From the moment employees consider joining your organization, right through to their exit, they encounter a myriad of impactful experiences. But organizations regularly fail to understand how all of the employee journeys, such as onboarding and performance reviews, fully impact key outcomes such as engagement and well-being.
As organizations evolve towards more modern Experience Management practices, companies will fill these insights gaps by embracing employee journey analytics. This emerging capability brings together two or more employee experience (EX) program datasets to understand how an experience at one point in an employee journey is related to outcomes at a later stage.
Employee journey analytics will open up new and powerful ways to explore data and provide actionable intelligence. By using this capability, an organization might discover that:
- Having enough time to access pre-training materials in manager learning experiences is a key driver for future manager effectiveness ratings
- During onboarding, having role clarity and feeling connected is most critical for sustained engagement and intent to stay
- The 360° leadership competencies of communication and respect are the strongest drivers of engagement for direct reports
- Being confident in their ability to apply what was learned in a specific product training predicts employees’ customer focus
- Employees’ workplace technology satisfaction has a strong correlation with their wellbeing
Five Steps for Tapping Into Employee Journey Analytics
Here are five steps to help guide your employee journey analytics projects.
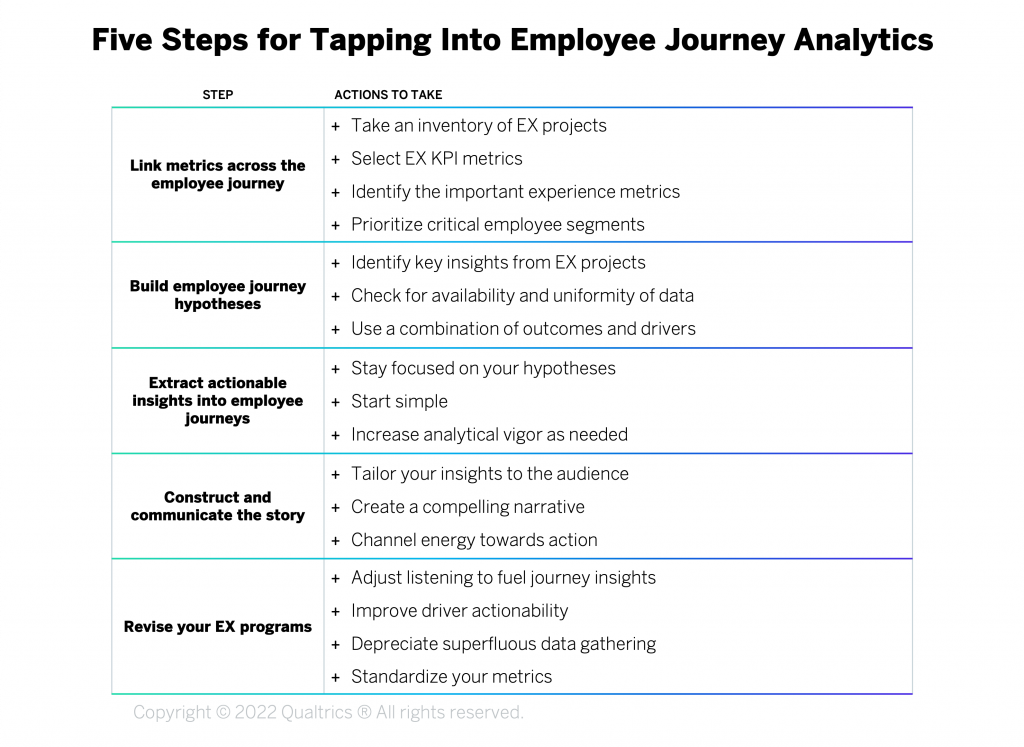
Step 1: Link Metrics Across the Employee Journey
At its core, the practice of employee journey analytics is about identifying links between different EX data sets and determining the extent of their relationship. Here’s how to select metrics that ensure you derive the greatest value:
- Take an inventory of EX projects. Chances are there are many employee listening activities happening across your organization, ranging from one-off feedback requests to an ongoing program of work. Before diving into the process of employee journey analytics, it is important to conduct a discovery to find out who is asking for employee feedback, what is being measured, and how the data is being managed.
- Select EX KPI metrics. As the roadmap of employee experience projects expands in an organization, so does the range of employee metrics that are being measured. Identify which existing metrics are the best indicators of organizational performance and how each EX project measures them. Common EX KPI metrics are employee engagement, manager effectiveness, wellbeing, intent to stay, and inclusion.
- Identify the important experience metrics. Within each of your current EX programs, it is likely that periodic improvements are being made. The success of these EX program activities is often judged by the magnitude of their impact on organizational outcomes such as engagement, talent retention, customer experience, operational and financial performance. Take a look at the design of your current EX programs, identifying the employee experiences that have been prioritized for maintenance or improvement, as well as those highly connected to organizational performance.
- Prioritize critical employee segments. When conducting employee journey analytics, it’s most productive to focus on specific segments of the employee population. For example, is attrition highest among new employees? Do customers from Australia provide the lowest CSAT ratings? Are frontline employees the most engaged? Are Black engineers reporting the least positive manager effectiveness ratings? Your analysis can identify specific populations, provided there are enough data points to reliably conduct the analysis.
Step 2: Build Employee Journey Hypotheses
To design effective employee journey analytics projects, build them on a foundation of testable hypotheses or research questions. These may be based on observations of behavioral patterns in the workplace, operational data (such as hiring, attrition, or performance metrics), or insights from outside of the organization (such as research or market trends). Doing this work before bringing multiple datasets together will ensure the program leverages the right metrics and guards from ‘analysis paralysis’ where people get stuck exploring the data, which impedes their transition towards action. Before starting the number-crunching, arrive at a comprehensive, testable set of hypotheses using these guidelines:
- Identify key insights from EX projects. A hypothesis is essentially an educated guess as to what your analysis is going to reveal. Take a look at your existing EX insights and operational employee data. Which insights have been discovered that require a deeper analysis across the employee lifecycle? What might the data from another point in the employee journey tell us? Test your initial thoughts with key stakeholders across the organization.
- Check for availability and uniformity of data. EX programs evolve over time. Survey questions are added and removed, some may frequently be skipped by respondents, and demographic information may be available for some time periods but not others. So you need to ensure that you have the appropriate data in the appropriate form to complete the analysis. It can be frustrating to develop and test hypotheses, only to discover that data across projects is inconsistent.
- Use a combination of outcomes and drivers. Analysts often spend significant time pouring through data to discover an insight such as employees who are engaged for multiple years are less likely to leave the organization. Okay, now what? What is causing this sustained engagement over time? It is far more impactful to explain that engagement is sustained for multiple years when people feel that their career goals can be met and they feel supported when adapting to organizational changes. That’s why you need to identify the workplace experiences (drivers) that impact the outcomes.
Step 3: Extract Actionable Insights Into Employee Journeys
Now that you have identified your hypotheses, you’re ready to begin exploring relationships across different touchpoints in the employee journey. Use your hypotheses as a starting point and run tests that will efficiently lead you to accept or reject them. Here are some tips for approaching the analysis:
- Stay focused on hypotheses. Hold true to your inquiry (i.e., don’t data dredge!). You may be tempted in cross-program analytics to scour all data to identify correlations and then report correlations as findings. Be mindful that many of these correlations can be statistical noise. Just because the perception of training in an onboarding survey correlates with the perception of corporate social responsibility in an engagement survey, it does not mean there is a relationship between the two. It may be purely coincidental. In this way, you’ll greatly reduce coincidental relationships and minimize statistical noise in generating your conclusions.
- Start simple. While many technology platforms have capabilities for advanced analytics, starting with simple statistics will help you quickly invalidate or support your hypotheses. These can be descriptive (for example, a table of engagement ratings for those who did and did not have onboarding career conversations), trending (for example, manager effectiveness ratings at time intervals), or comparisons (for example, a scatterplot comparing customer experience & training effectiveness trends).
- Increase analytical rigor as needed. After finding a potential insight during an initial review, it’s time for you to dive deeper with additional XM Analytical Techniques. Consider using some common analyses like ANOVAs (Analysis of Variance) to compare multiple groups of employees simultaneously, and Relative Weights Analysis to determine which variables are contributing most to the variance of an outcome metric.
Step 4: Construct and Communicate the Story
Now that you have completed your analysis, it’s time to communicate the insights and recommended actions, in a way that connects with people. While some audiences might love sitting through a two-hour journey into statistical models and complex mathematics, the reality is that you need concise communications that spark action. Here are some tips on becoming the Chief Storytelling Officer of your organization’s EX programs:
- Tailor your insights to the audience. Consider the unique needs of various stakeholders, crafting your messaging to resonate with them. EX audiences tend to fall into four broad groups: Executive Leaders, HR or people operations, frontline managers, and employees. Each audience requires insights to be relevant to their roles and crafted to help them move them from insight to action with the least friction possible.
- Create a compelling narrative. Now that you have some insights to share, building a story around them is a powerful way to engage an audience and motivate them to act. Use the data to inform the narrative, creating a story arc that focuses on specific actions. For example, the flow of your story may be 1) Draw in the audience with a personalized opening, 2) Explain the problem to be solved, 3) Provide your evidence-based insights, 4) Describe what success looks like & suggested actions to get there.
- Channel energy towards action. “I want to know more!” It’s the blessing and the curse of a well-delivered presentation. Rest assured, if you’ve engaged your stakeholders, they will want additional information. Additionally, the findings will likely rouse additional hypotheses for you to test. This is an iterative process, so consider the additional analysis to be indicative of a high level of interest in your work. But a word of warning – asking for more data analysis can effectively stall any action being taken. Don’t let perfection get in the way of progress, and encourage your stakeholders to stay focused on the two ultimate questions: What have we learned? and What improvements should we make?
Step 5: Revise Your EX Programs
As you analyze and present findings, you’ll likely find yourself saying “I wish we asked that question” or “We need to find a better way to measure that.” The learnings from employee journey analysis should be a critical input to updating your future EX programs. Here are some ways to think about these changes:
- Adjust listening to fuel journey insights. In most cases, EX programs are developed independently; most likely your onboarding survey items were developed to measure and impact the overall onboarding experience, not connecting the data to any other EX programs. But once you begin employee journey analytics, you will find relationships across the employee lifecycle that had not been considered in the past. Use this as an opportunity to address where there may be gaps in experience knowledge. For example, if your analysis reveals a link between perception of overall technology experience and engagement, but you don’t have data on individual technology applications or devices, you might consider redesigning your technology experience surveys to gain deeper insight to discern more specific experience gaps.
- Improve driver actionability. In your analysis, you will likely find relationships between driver and outcome variables across listening programs. However, if you find that too many driver variables are outcome-oriented themselves, it can be difficult to target action. If this occurs, consider replacing those items with more actionable items. For example, in a training effectiveness program, you may see relationships between the overall perception of a specific training program and the perception that the company supports career development. But if there are no driver items associated with the training program, it can be difficult to determine how to improve it.
- Depreciate superfluous data gathering. As organizations see more value from employee journey analytics, they’ll find an abundance of existing survey questions across their EX programs that aren’t driving any meaningful actions. Use this period of redesign to reduce overall survey lengths by eliminating survey items questions within individual programs that have minimal or no impact on other programs.
- Standardize your metrics. As you spend more time looking across individual EX programs, you will likely discover variances in survey item wording, scale use, and index calculations. In order to ensure that cross-program analytics are accurate, you should standardize common EX metrics such as employee engagement or demographics that are measured across different lifecycle touchpoints.
Tips For Success With Employee Journey Analytics
As you build out your employee journey analytics capabilities through the five steps above, keep these recommendations in mind:
- Map out timelines and dates of data collection. Employee journeys are longitudinal by nature, so it is important to consider which employee experiences were measured and when, as well as what may have been going for employees at that time.
- Consider the impact of ‘data joins’. Inner-joins, such as unique IDs, mean that only responses matching in both data sets will be analyzed, whereas outer-joins use all of the available data. Each has its own implications relating to the samples utilized and how the insights are interpreted.
- Plan for incorporating O-data. The analysis will need to include operational data (O-Data) like employee tenure, age, performance, and job classification along with the experience data (X-Data) we’ve discussed, So you will need to plan for getting access to these key inputs.
- Manage stakeholders and employee privacy. As your insights spur more interest across the organization, you will need to implement a robust governance process, where roles and responsibilities are clearly outlined and data security protocols are communicated and enforced.
- Factor in organizational changes. Reorganizations, employee shifts, and turnover are facts of life. You will need to make sure that your analysis accounts for these changes, where needed.
The bottom line: Tap into employee journey analytics to create actionable intelligence
Dr. Cecelia Herbert, XMP, PsyD, is a Principal Catalyst for Qualtrics XM Institute
Matthew Evans, MBA, is a Senior Employee Experience Product Scientist for Qualtrics