As part of Qualtrics XM Institute’s 2024 Global Consumer Study, nearly 24,000 consumers around the world evaluated their recent experiences with organizations in 20 industries across four dimensions: satisfaction, likelihood to trust, likelihood to recommend, and likelihood to purchase more. Based on these responses – along with data we collected in our 2021, 2022, and 2023 Global Consumer Studies – we analyzed the overall state of global consumer sentiment as we move into 2025 as well as how these satisfaction and loyalty metrics have evolved across both countries and industries over the past three years. From this analysis, we found that:
- Loyalty metrics lag behind satisfaction. Consumers provided a satisfaction rating of 4- or 5- stars after 76% of recent experiences. However, their likelihood to perform key loyalty behaviors is somewhat lower; after recent interactions, 73% trust the organization, 70% would recommend the organization to friends and family, and 69% say they are likely to purchase more from the organization.
- Consumer loyalty is down as we head into 2025. Compared to last year, consumers are less likely to trust (-1.2 pts), recommend (-1.5 pts), and purchase more (-1.3 pts) from organizations. Likelihood to trust and recommend has decreased the most among consumers in New Zealand and the UAE, while likelihood to repurchase has decreased the most among German and New Zealand consumers.
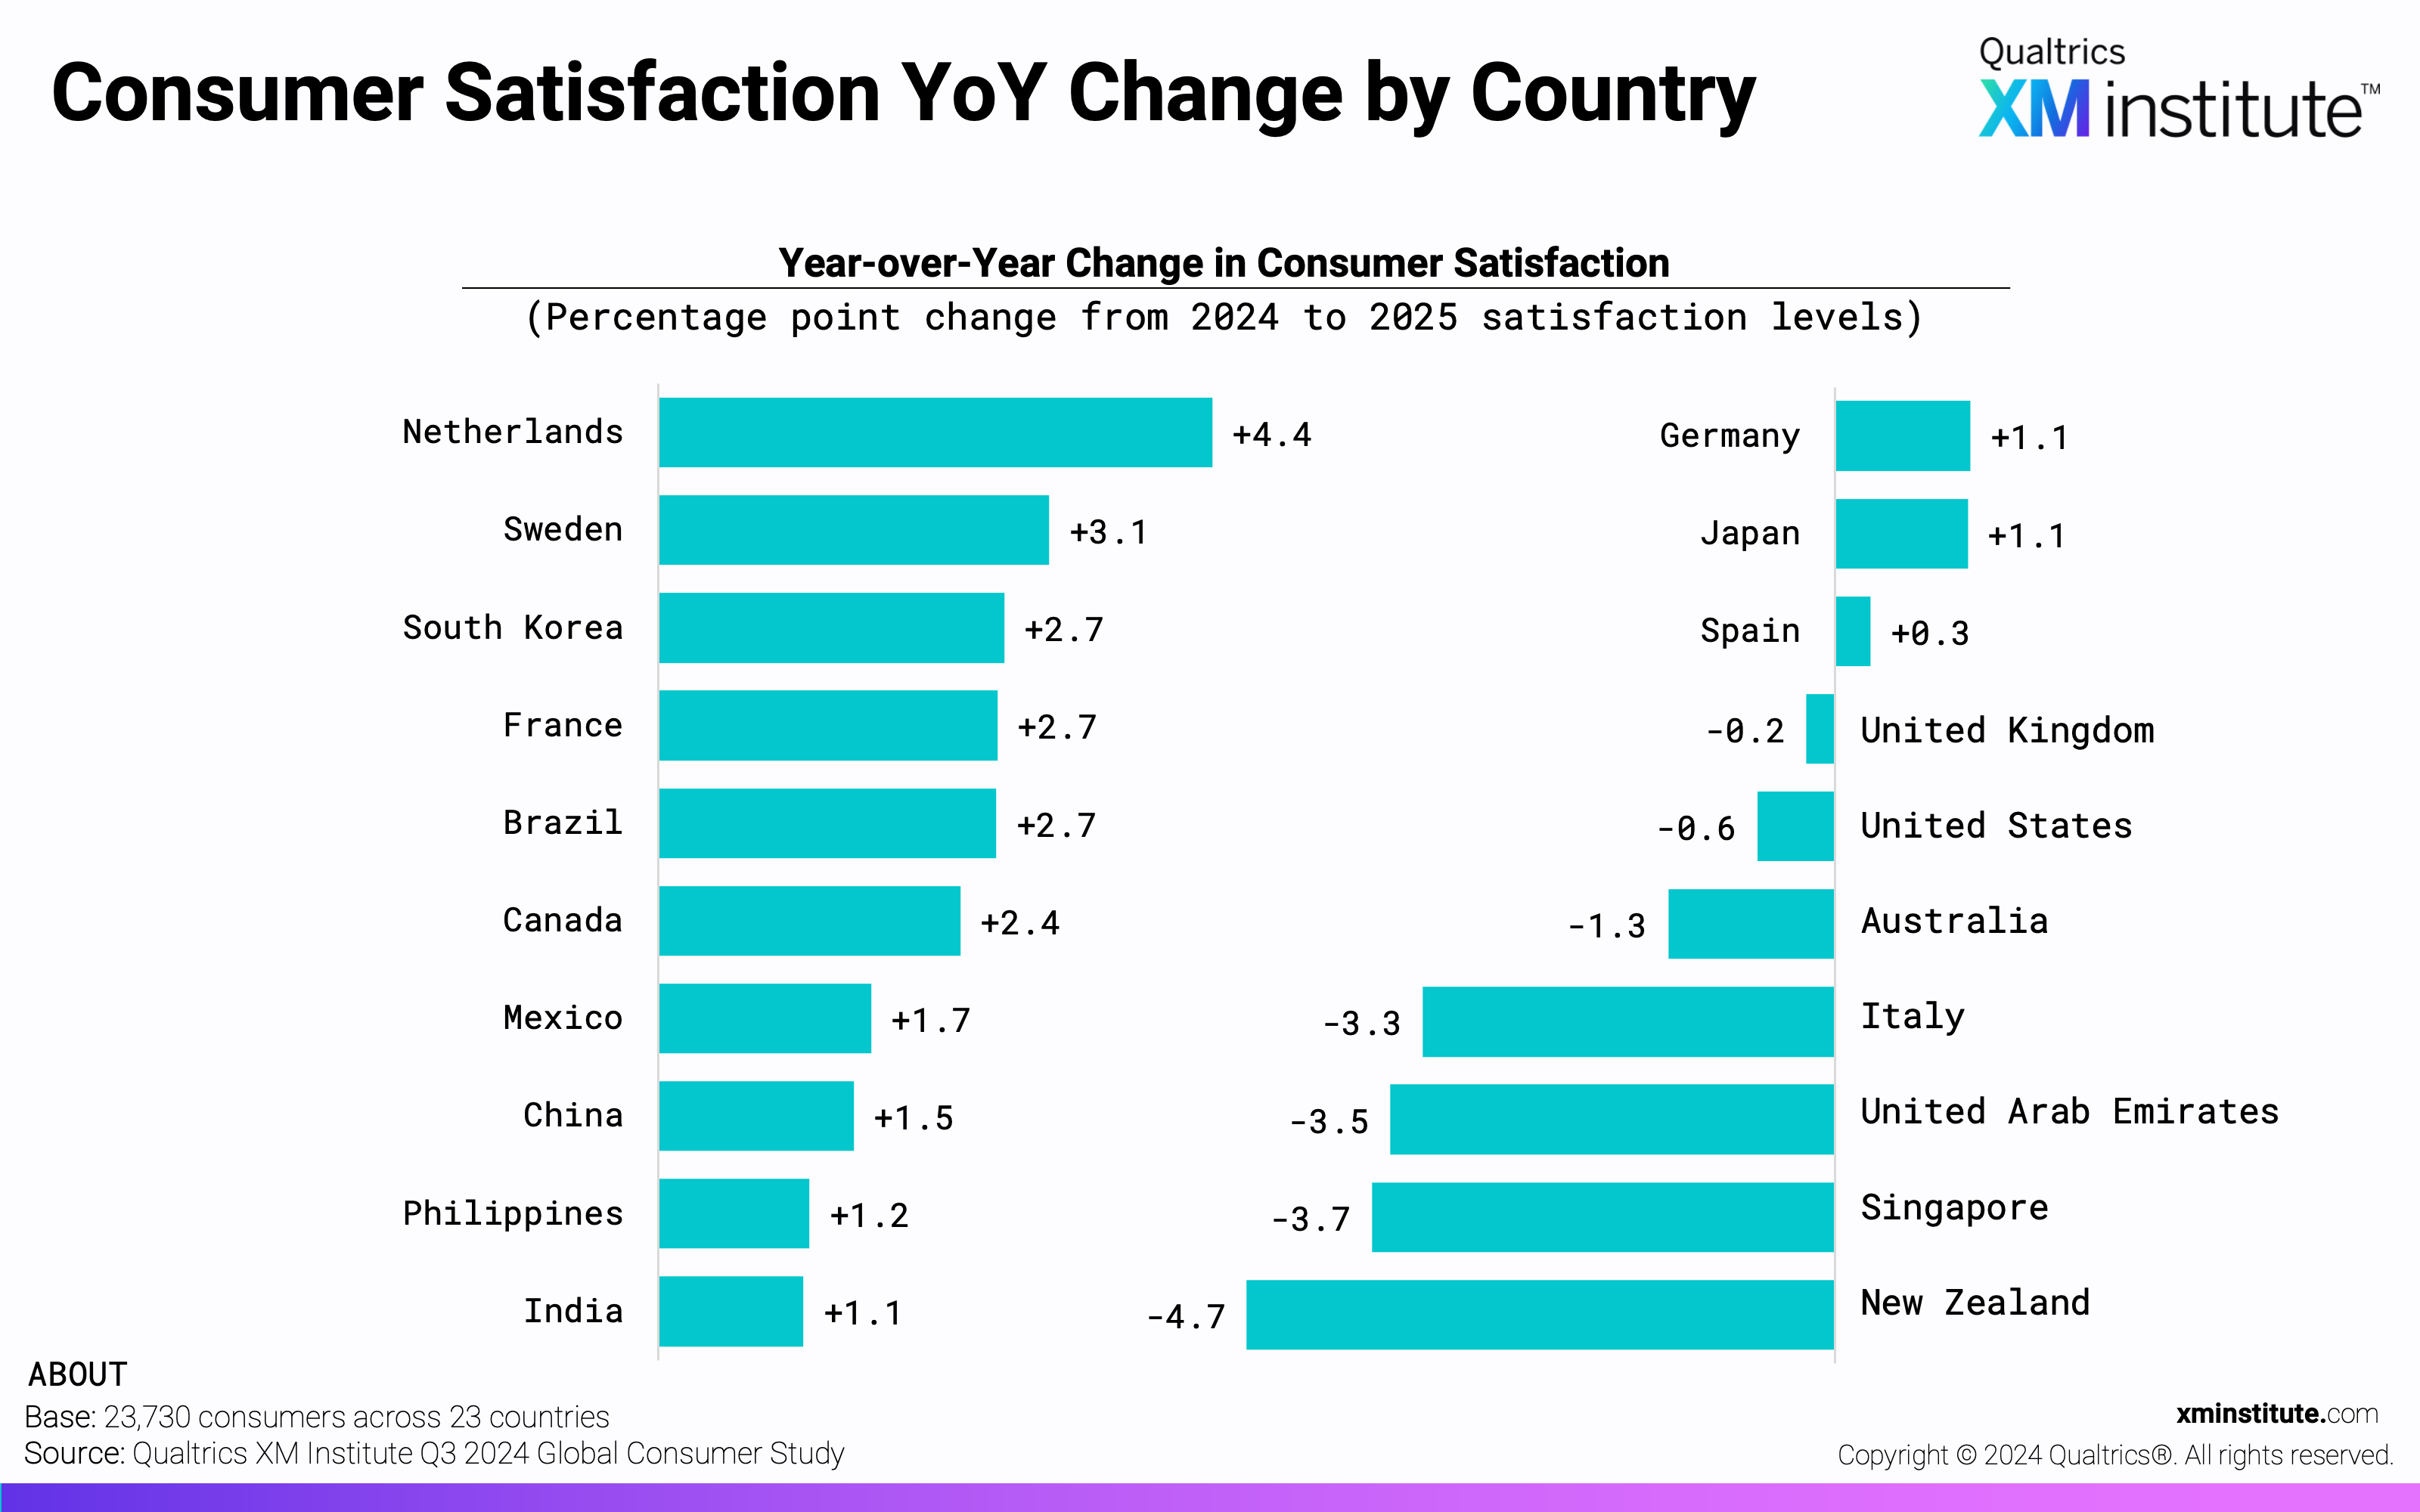
- Overall satisfaction remains relatively stable. Consumer satisfaction has not changed significantly from 2024, increasing by just 0.4 points. Chinese consumers most frequently rate their recent experiences as a 4- or 5-star experience (85%), while Japanese consumers are the least likely to do so (56%). Satisfaction changed the least among UK and Spanish consumers, while satisfaction among Dutch and New Zealand consumers showed the greatest volatility.
- Hotels enjoy the most consumer trust and advocacy. Despite moderate decreases in both consumer trust (-2.4 pts) and advocacy (-2.5 pts), hotels still enjoy the highest rates of trust (79%) and advocacy (78%) of all 20 industries, while supermarkets enjoy the highest likelihood of repurchasing (82%). Government agencies rated lowest for trust, advocacy, and repurchasing.
Key Findings: Satisfaction
Satisfaction is a popular, easy-to-understand customer experience measurement. It acts as a quality indicator of customer experience that is used as a core metric in half of customer experience programs in 2024. To gauge the current state of customer satisfaction, we asked consumers around the world how satisfied they were with their recent experiences across 20 industries on a scale of 1- to 5-stars. From their responses, we found that:
- Global consumer satisfaction lands at 76%. Consumers provided a 4- or 5- star rating out of 5 stars for 76% of interactions in 2025. Global consumer satisfaction remains steady, with just a +0.3 percentage-point change from 2022 across the 19 countries and 17 industries we’ve consistently included in our studies.
- Chinese consumers report the highest average satisfaction levels. Chinese consumers provided an average satisfaction rating of 85%, nine points higher than the global average. Filipino (82%) and Indian (81%) consumers have the next highest satisfaction levels. Meanwhile, Japanese consumers are the least likely to rate their satisfaction with a recent experience 4- or 5- stars, doing so only 56% of the time. Swedish and Italian organizations also receive lower average satisfaction ratings from their consumers (69% and 71%, respectively).
- Satisfaction levels have shifted most among New Zealand consumers. Over the past year, consumer satisfaction in New Zealand has decreased 4.7 percentage points, the largest change across the 20 countries represented. Dutch consumers reported the second-largest change in satisfaction, a 4.4 percentage-point increase from 2024. Satisfaction levels in the UK (-0.2 pts) and Spain (+0.3 pts) have changed the least.
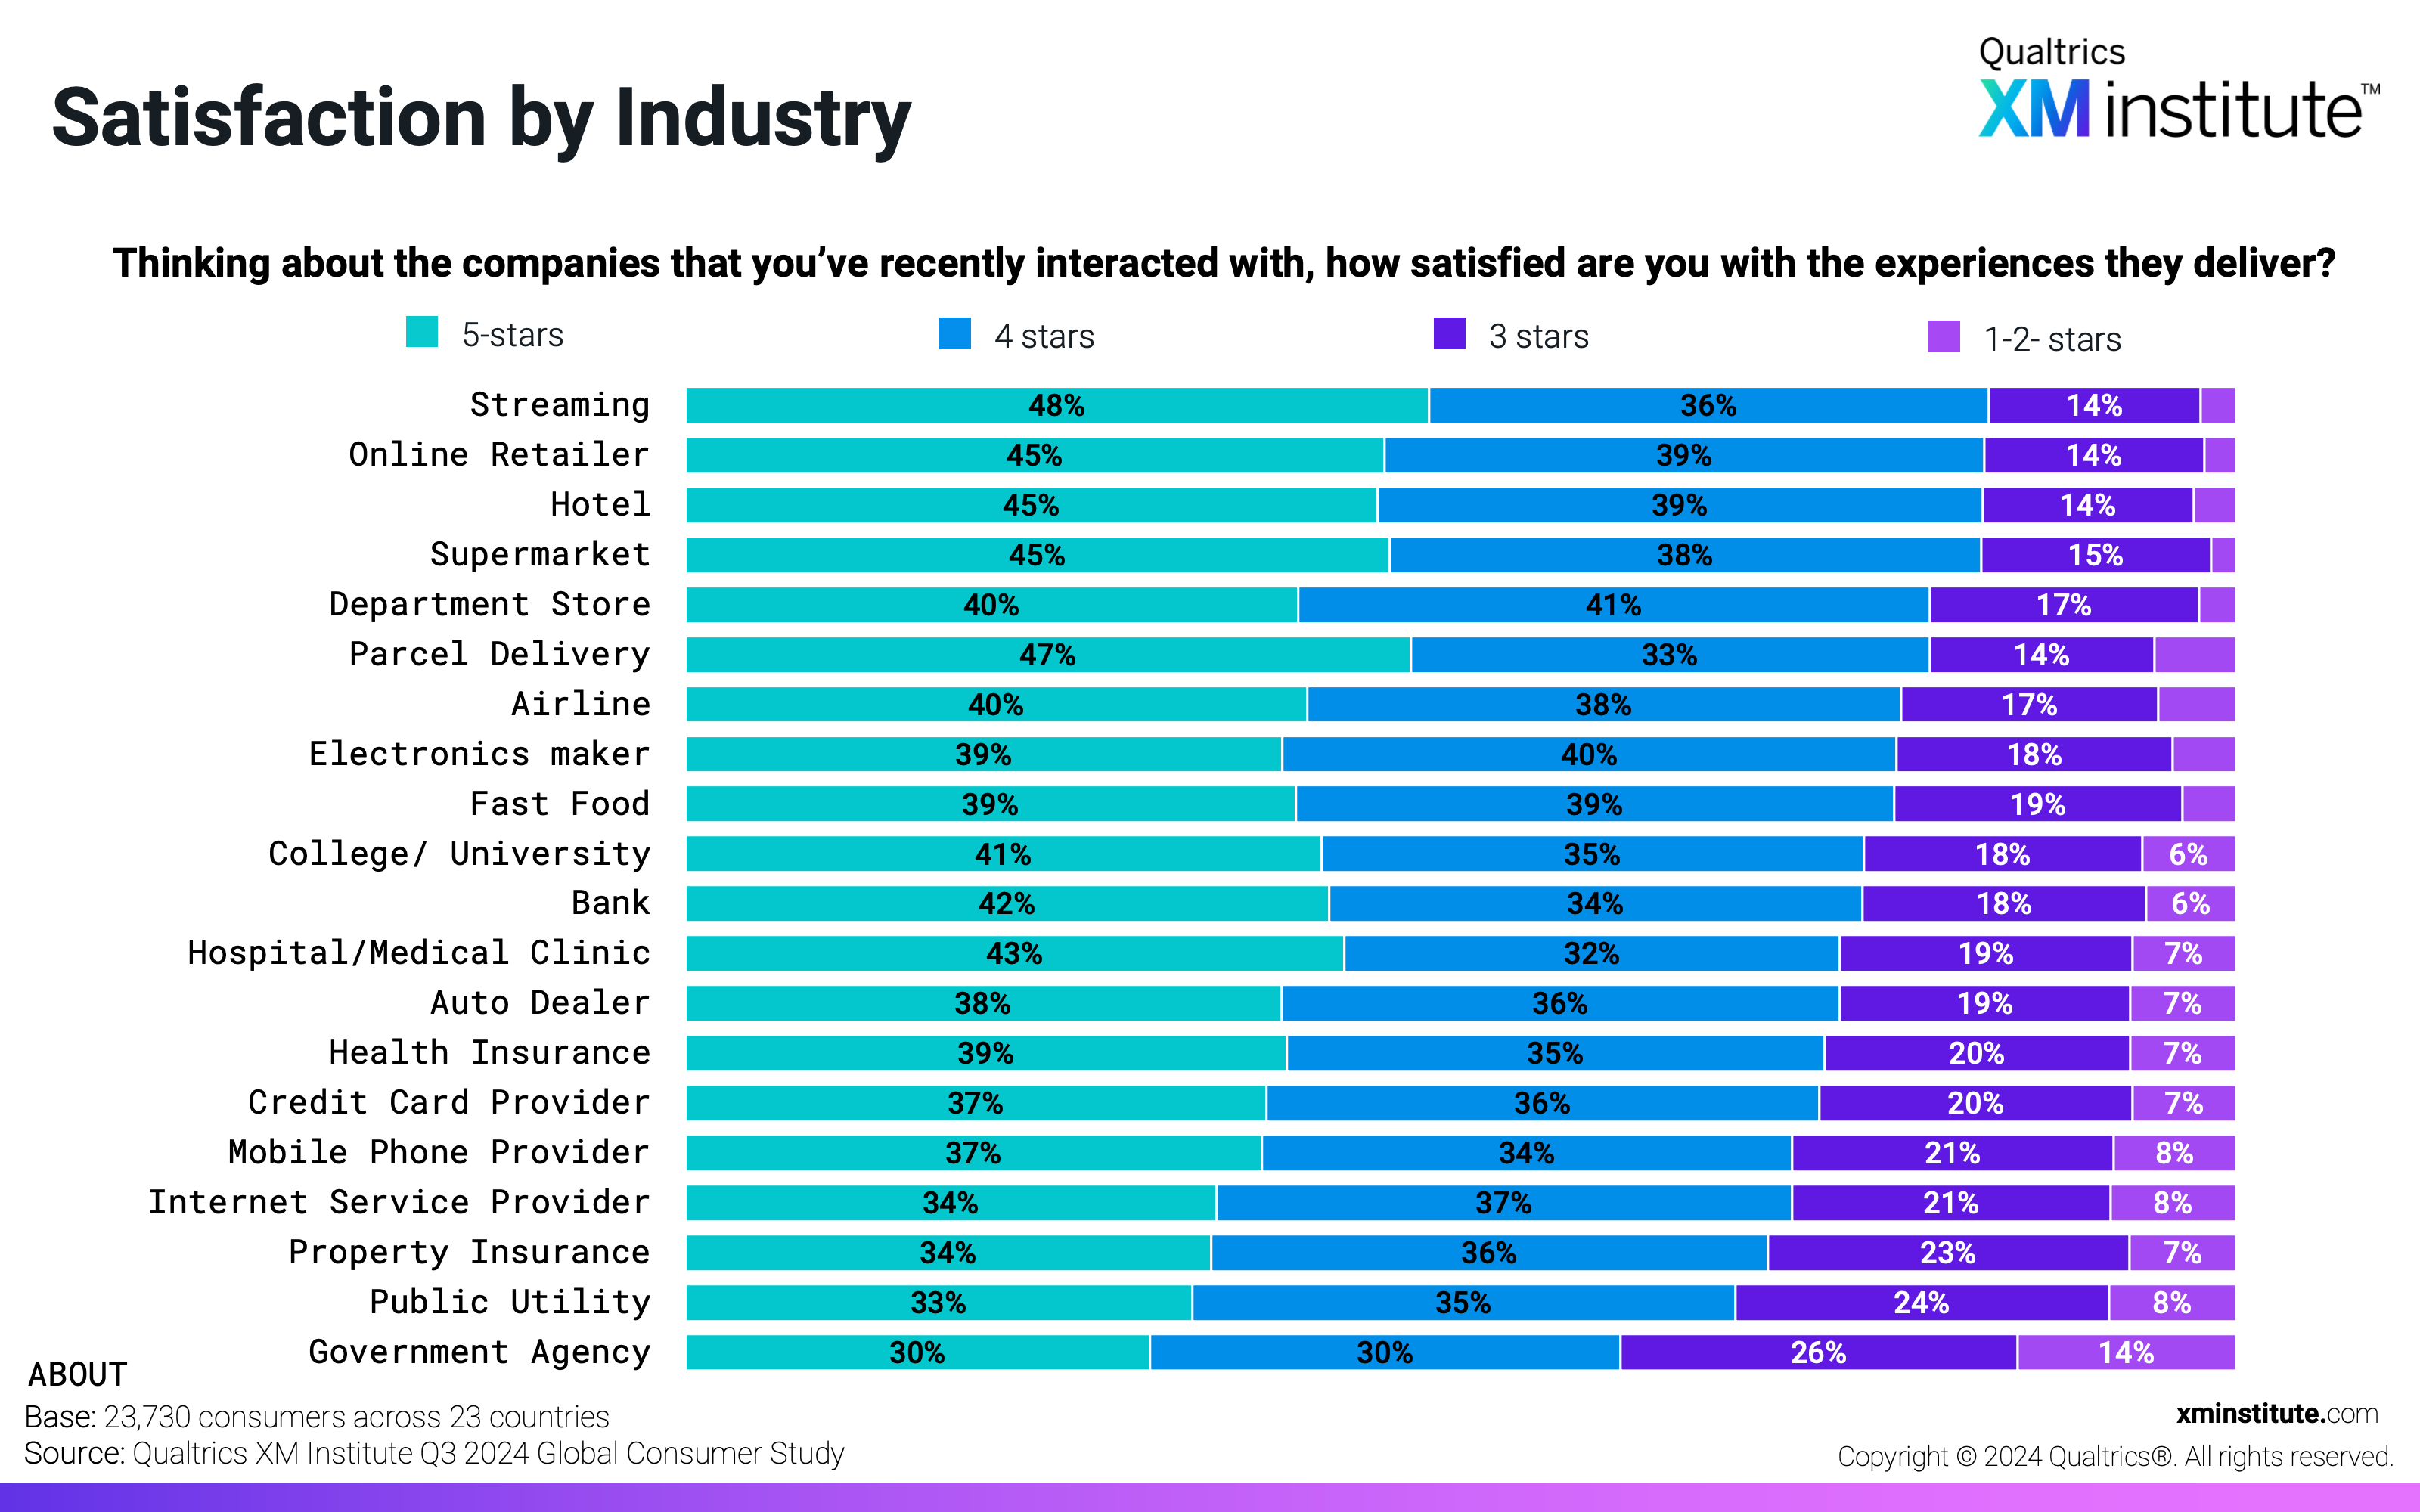
- Streaming media companies enjoy the highest consumer satisfaction. Forty-eight percent of streaming consumers gave a 5-star satisfaction rating, while another 36% provided a 4-star rating.
Key Findings: Likelihood to Trust
Trust is a classic measurement indicative of your customer relationship. Cultivating customer trust is essential to achieving desired business outcomes, whether that’s through influencing their spending behaviors, getting them to advocate for your organization, earning their forgiveness if you make a mistake, and much more. To understand the state of trust as we move into 2025, we asked consumers around the world how likely they are to trust an organization from one of the 20 different industries after their recent experience on a scale of 1 (extremely unlikely) to 5 (extremely likely). From their responses, we found that:
- Global consumer trust lands at 73%. Consumers said they are likely to trust an organization after 73% of experiences. Global consumer trust has grown over the past three years, increasing 1.9 points from 2022 across the 19 countries and 17 industries we’ve consistently included in the studies.
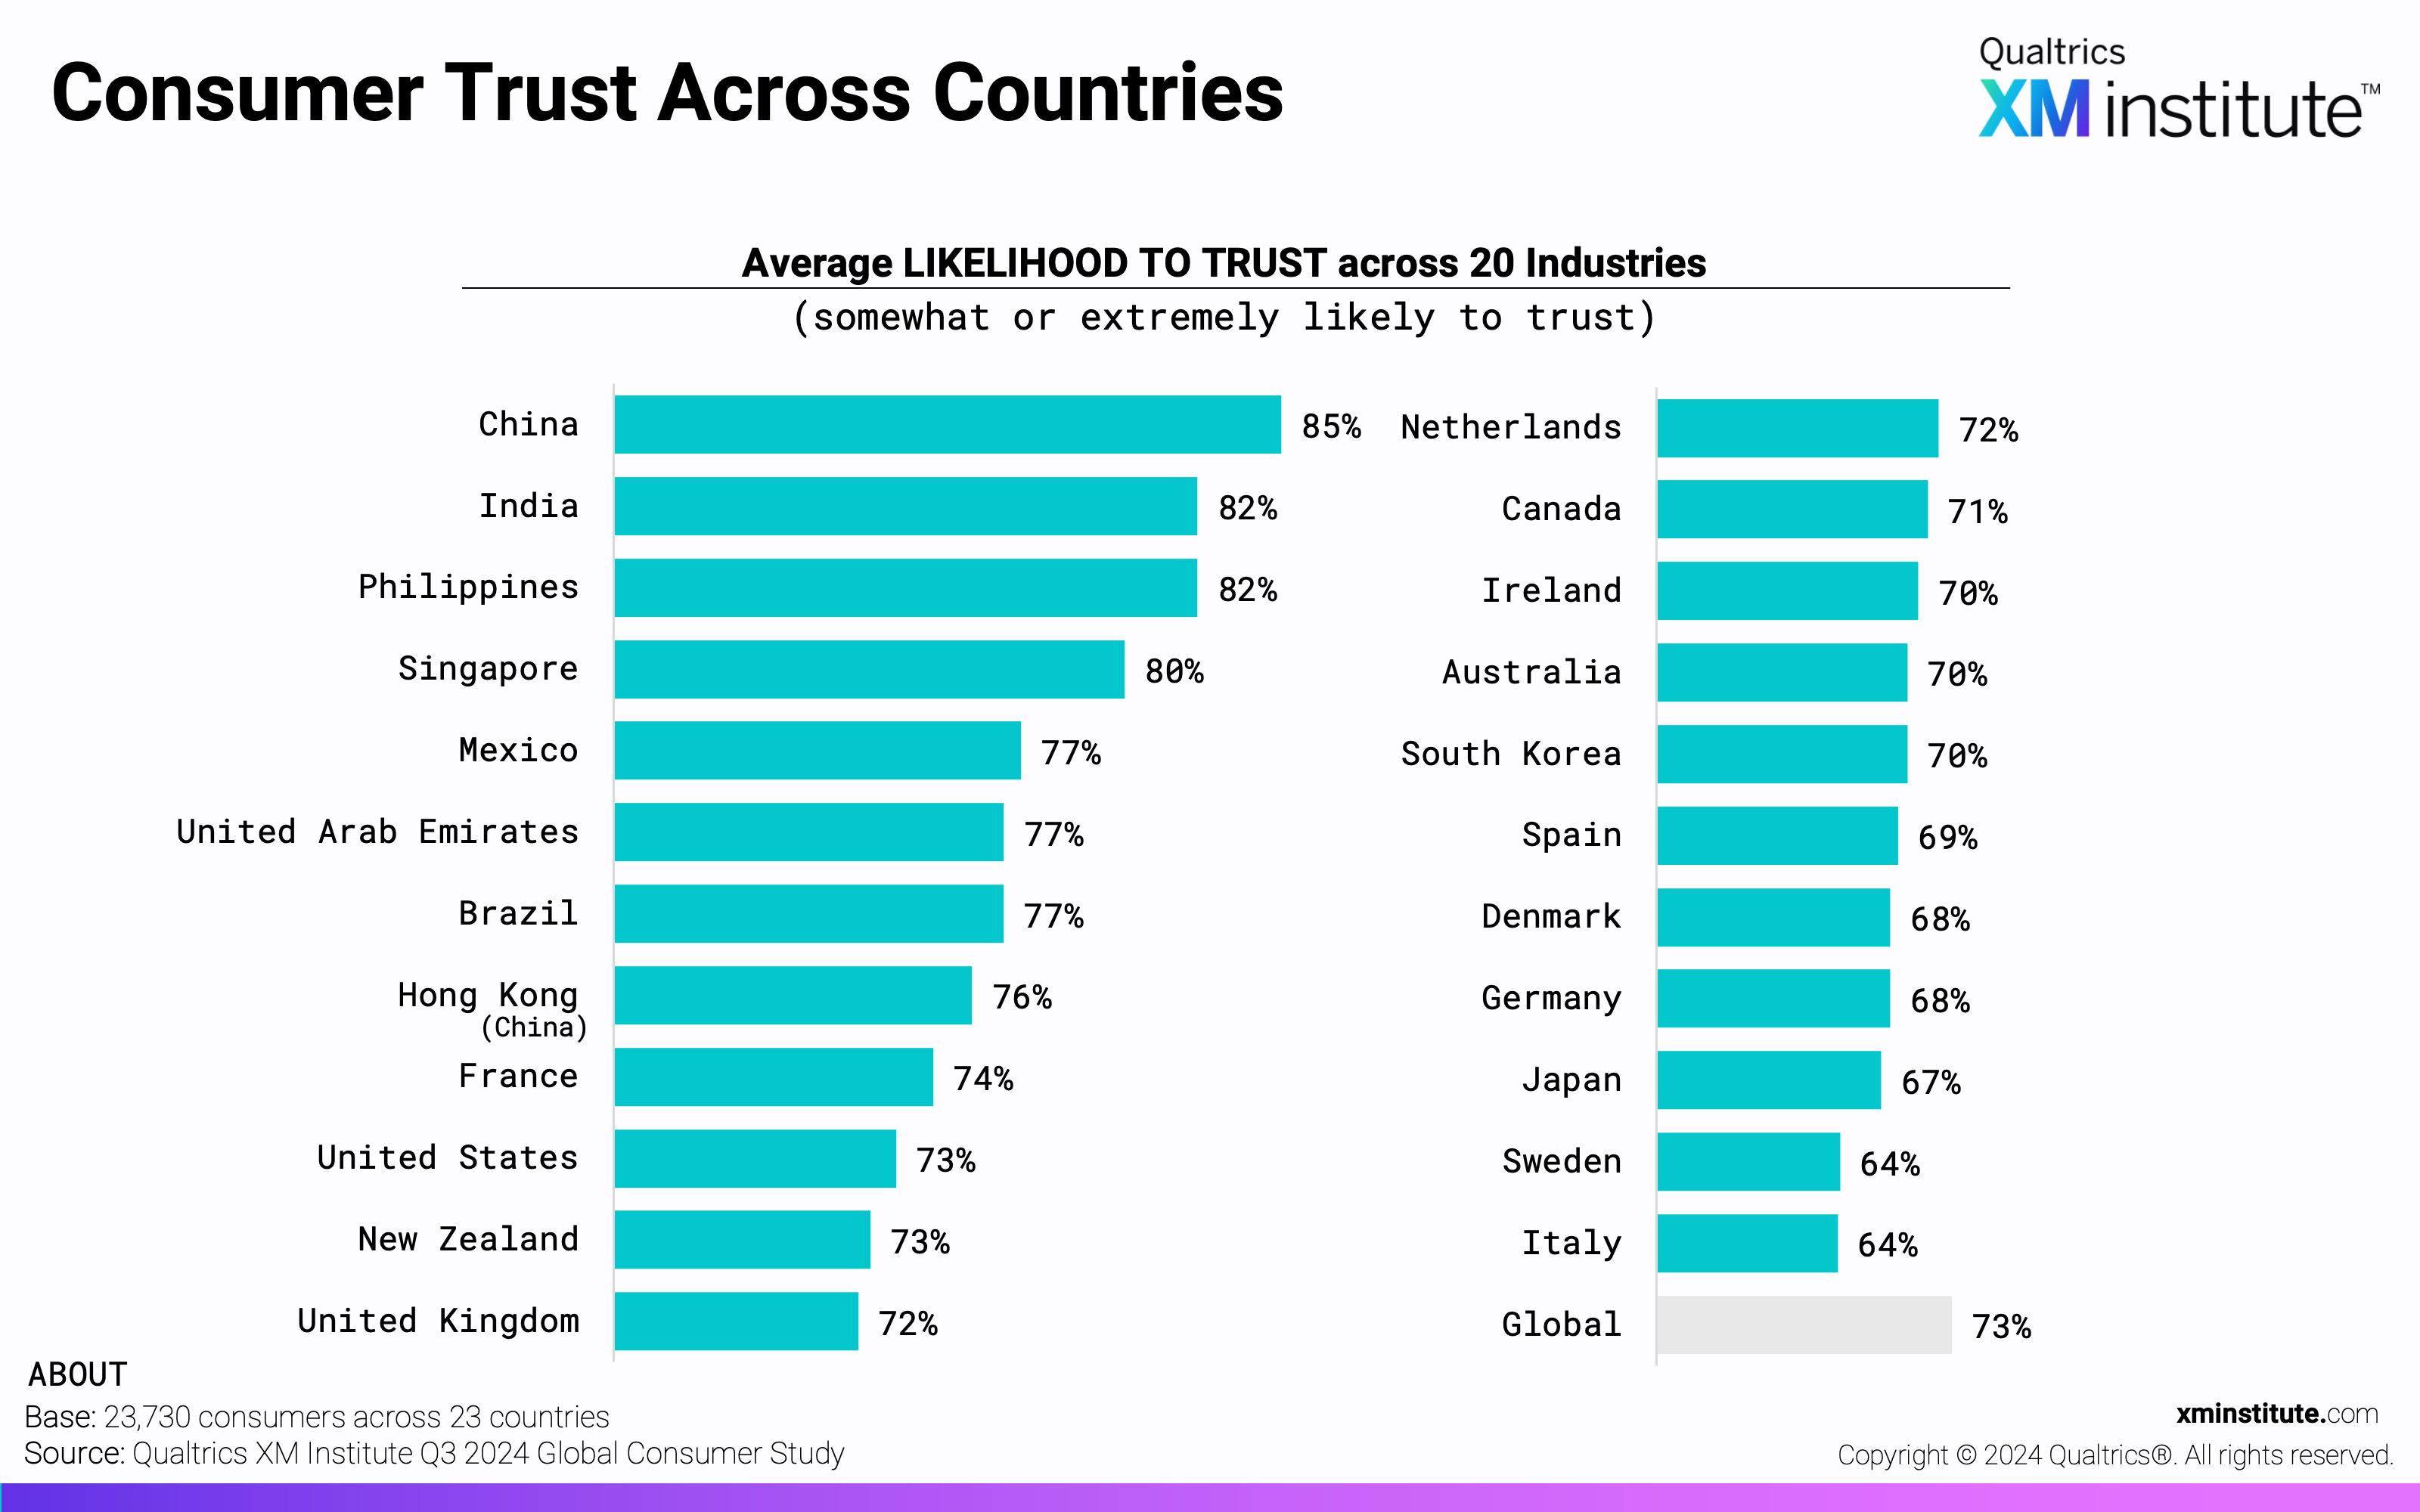
- Chinese consumers demonstrate the highest levels of trust. With an average rating of 85%, Chinese consumers’ trust levels are 12 points higher than the global average. Indian and Filipino consumers follow closely behind, each with an average rating of 82%. Italian and Swedish consumers, meanwhile, are most hesitant to trust organizations, with average ratings of just 64%.
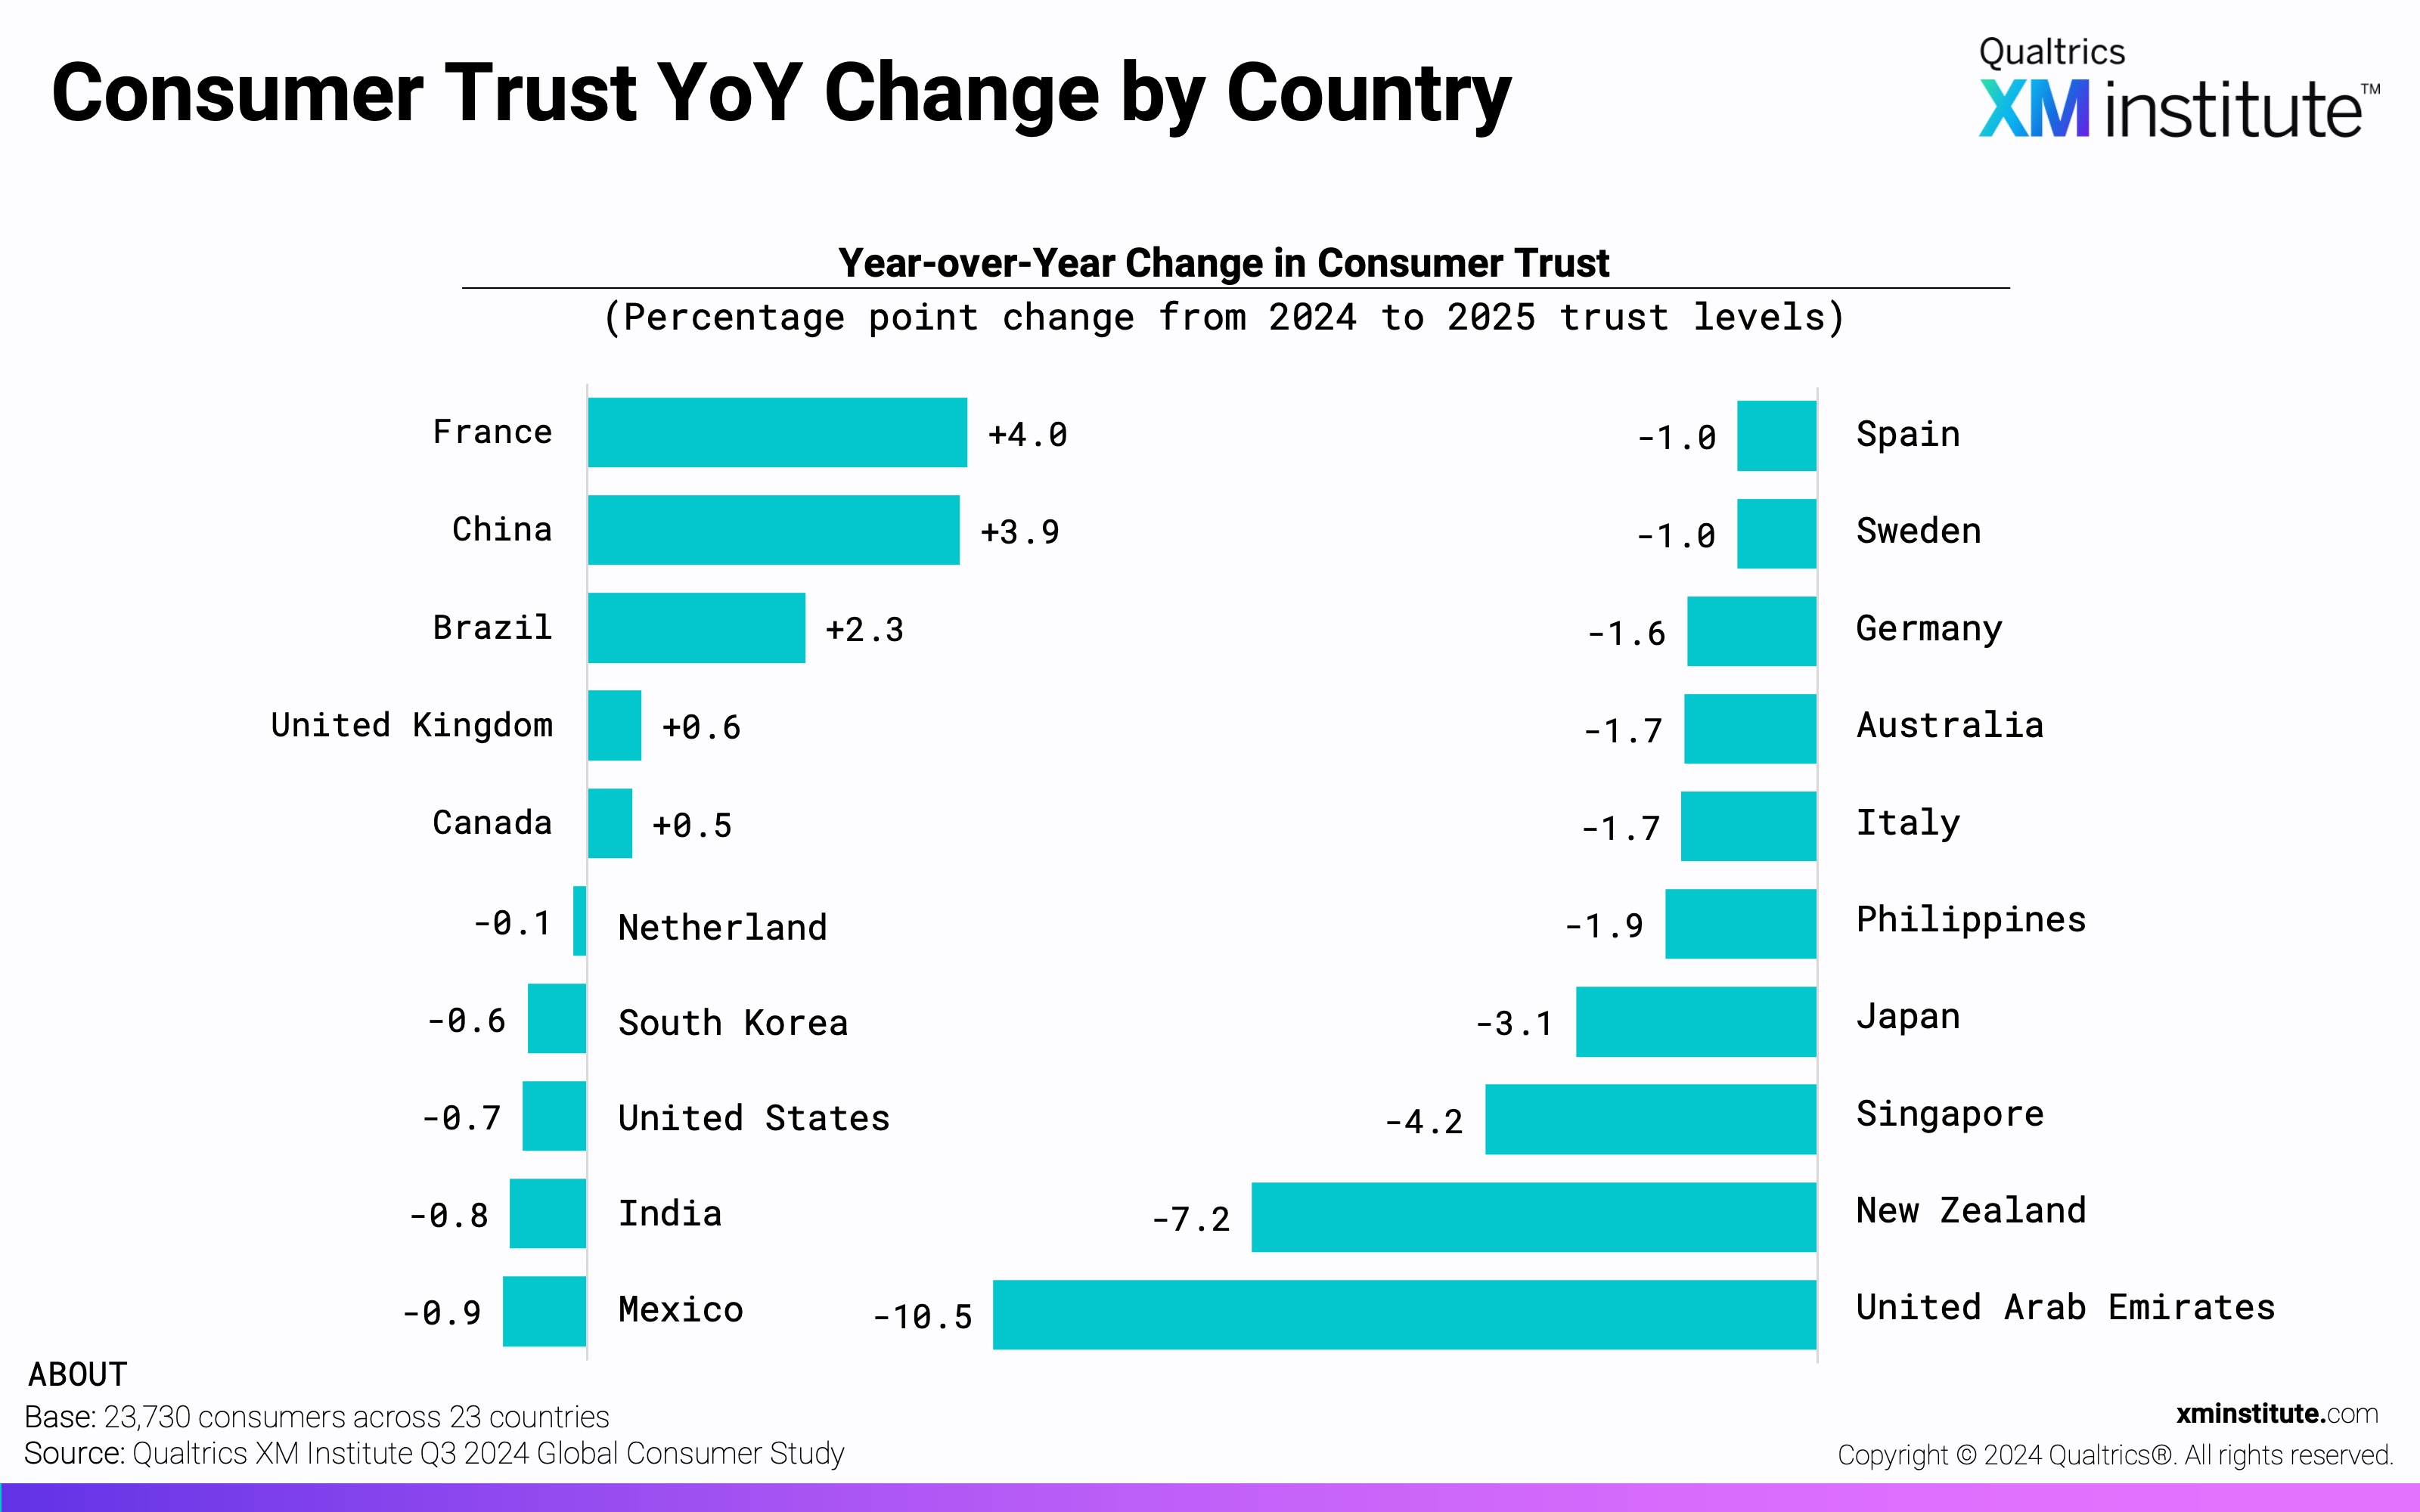
- Trust levels have shifted most dramatically among Emirati consumers. Between our 2024 and 2025 studies, consumer likelihood to trust in the United Arab Emirates has decreased by 10.5 percentage points, the largest year-over-year change across the 20 countries surveyed. New Zealand consumers reported the second-largest change in trust, a 7.2 percentage-point decrease from 2024. Consumer trust in the Netherlands (-0.1 pt) and Canada (+0.5 pts) has changed the least.
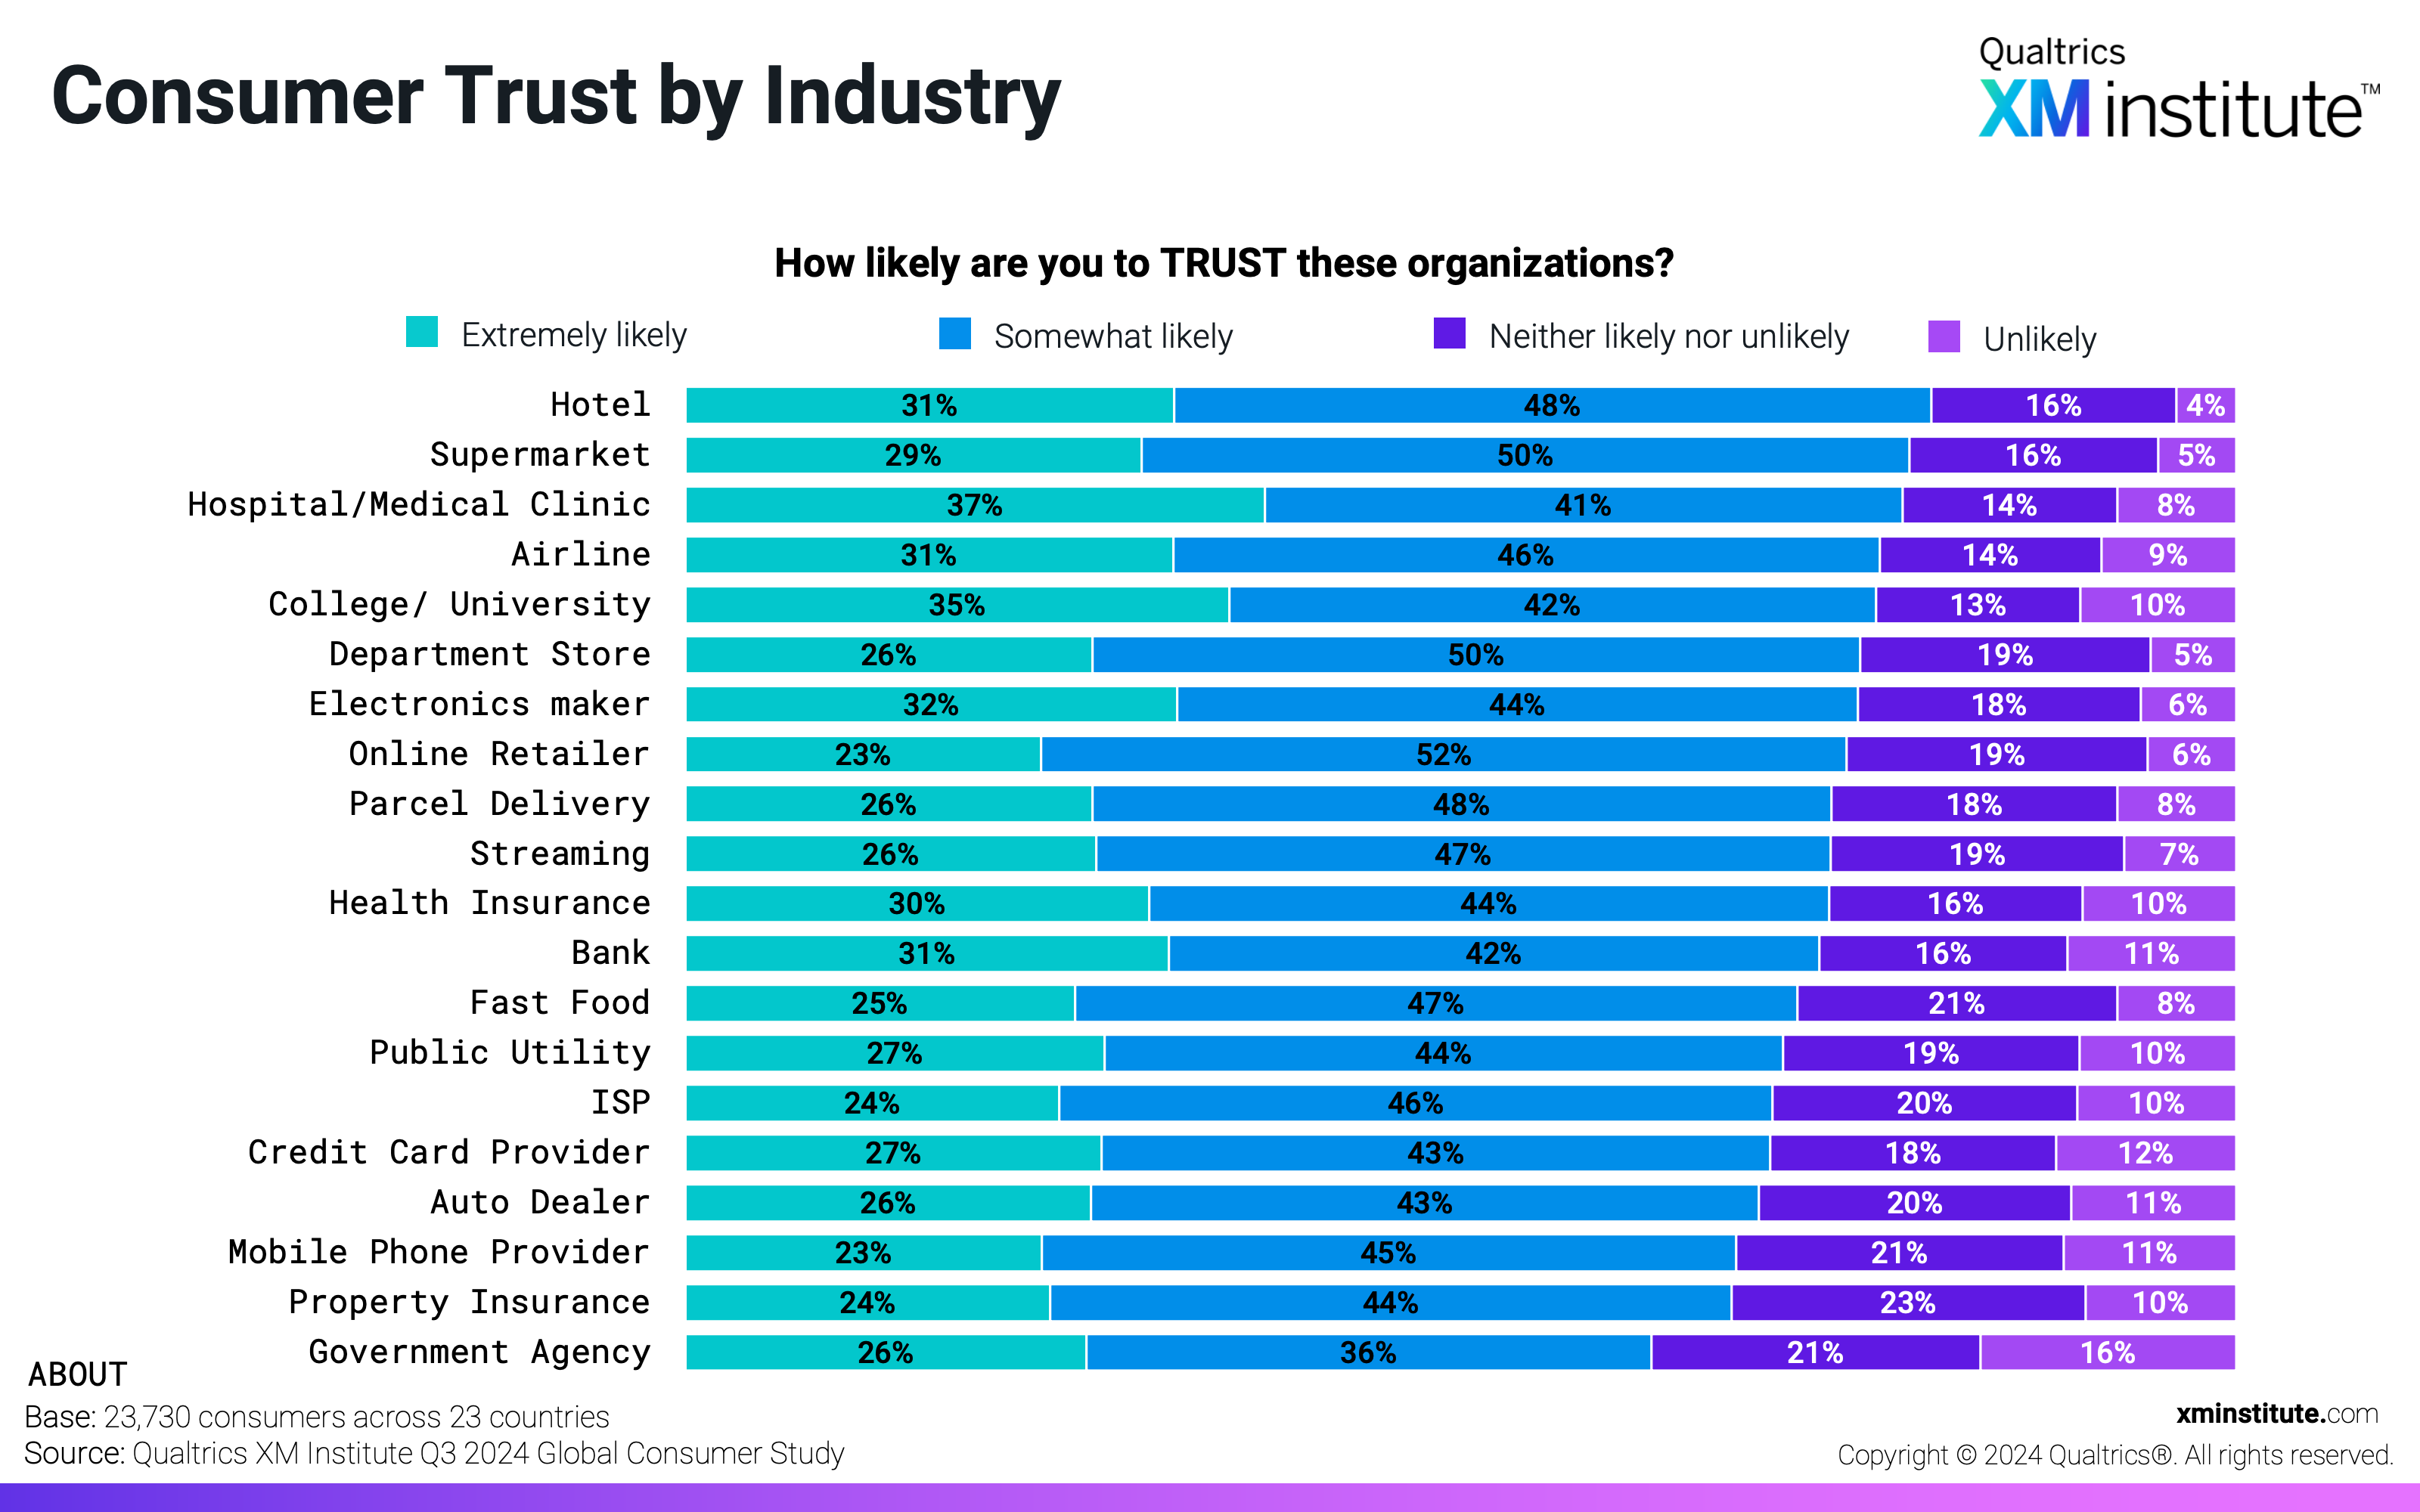
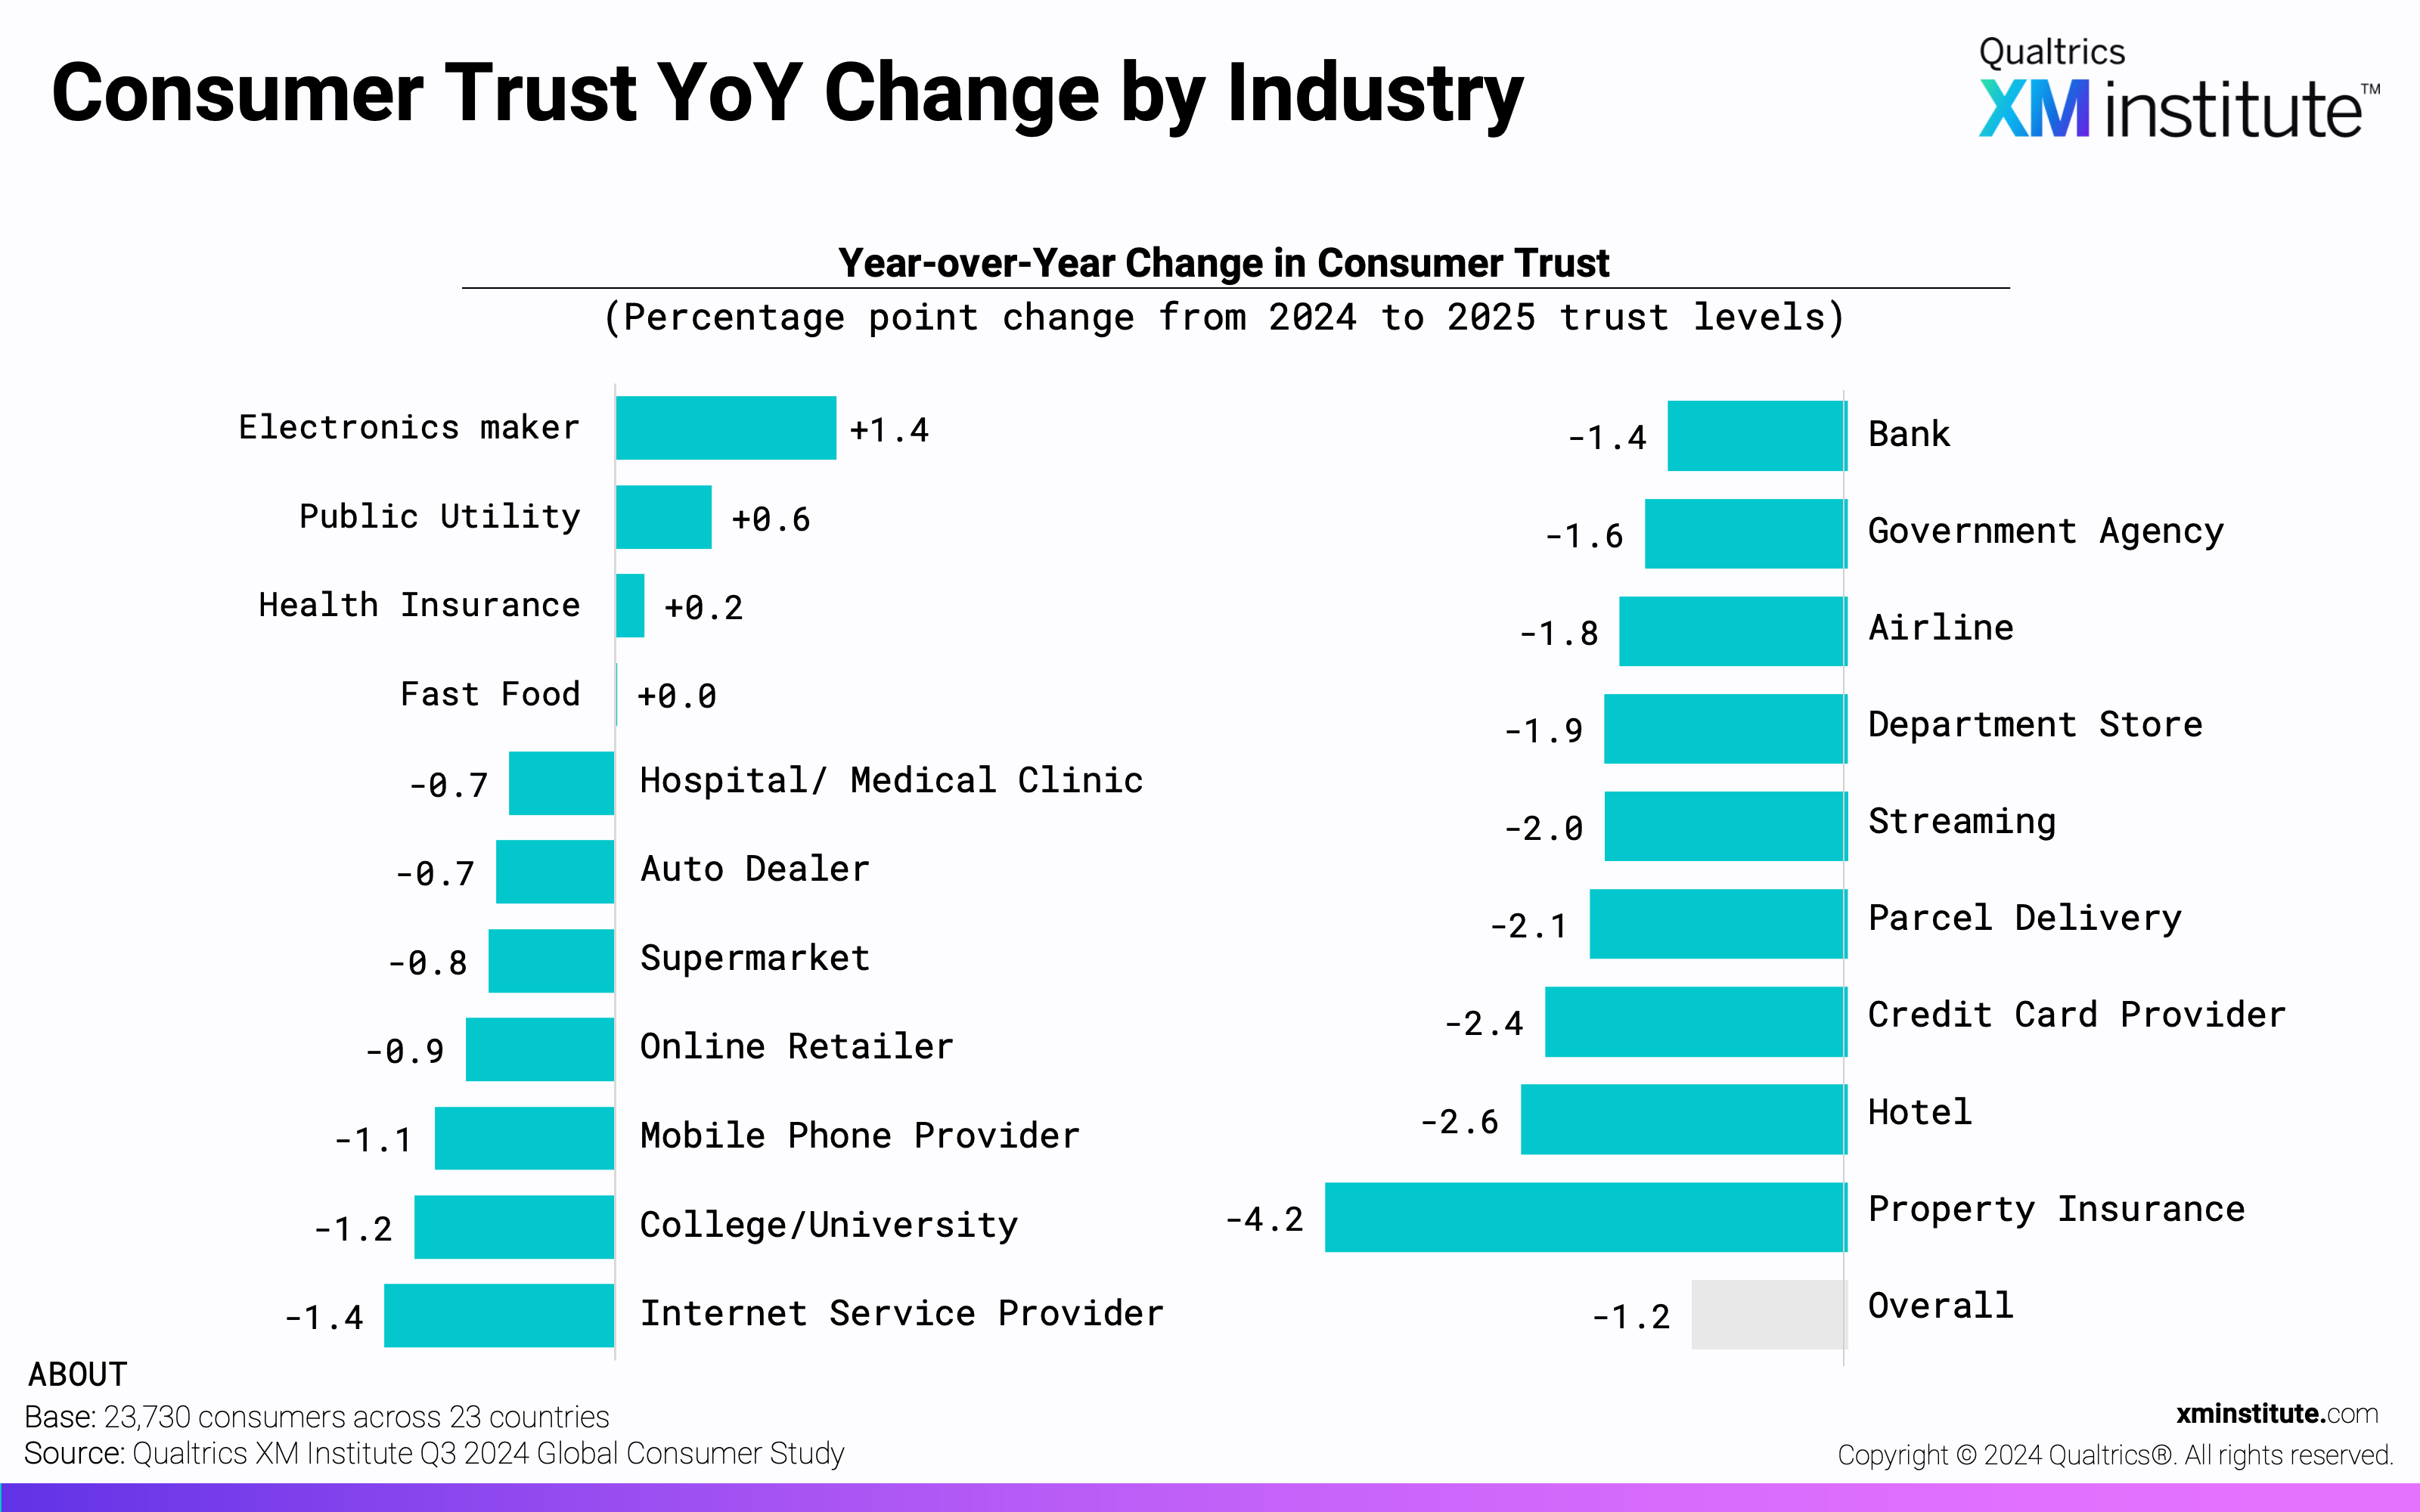
- Hotels and supermarkets enjoy the highest consumer trust. Consumers were most likely to say that they are somewhat or extremely likely to trust after recent hotel and supermarket experiences (79% each) and least likely to do so after experiences with government agencies (62%). Property insurers experienced the greatest decline in consumer trust, with a 4.2 percentage-point decrease over the last year. Hotels (-2.6 pts) and credit card providers (-2.4 ps) saw the next-largest changes in consumer trust.
Key Findings: Likelihood to Recommend
Likelihood to recommend is a frequently used customer experience relationship metric, often measured using Net Promoter Score (NPS). Having customers advocate for your organization to friends and family is a primary way to expand both your customer base and share of wallet. To understand the state of consumer advocacy as we move into 2025, we asked people around the world how likely they are to recommend an organization from one of the 20 different industries after their recent experience on a scale of 1 (extremely unlikely) to 5 (extremely likely). From their responses, we found that:
- Global consumer advocacy lands at 70%. After 70% of interactions, consumers report being somewhat or very likely to recommend an organization to friends and family. This metric has increased by 1.1 points since 2022 across the 19 countries and 17 industries we’ve consistently included in the studies.
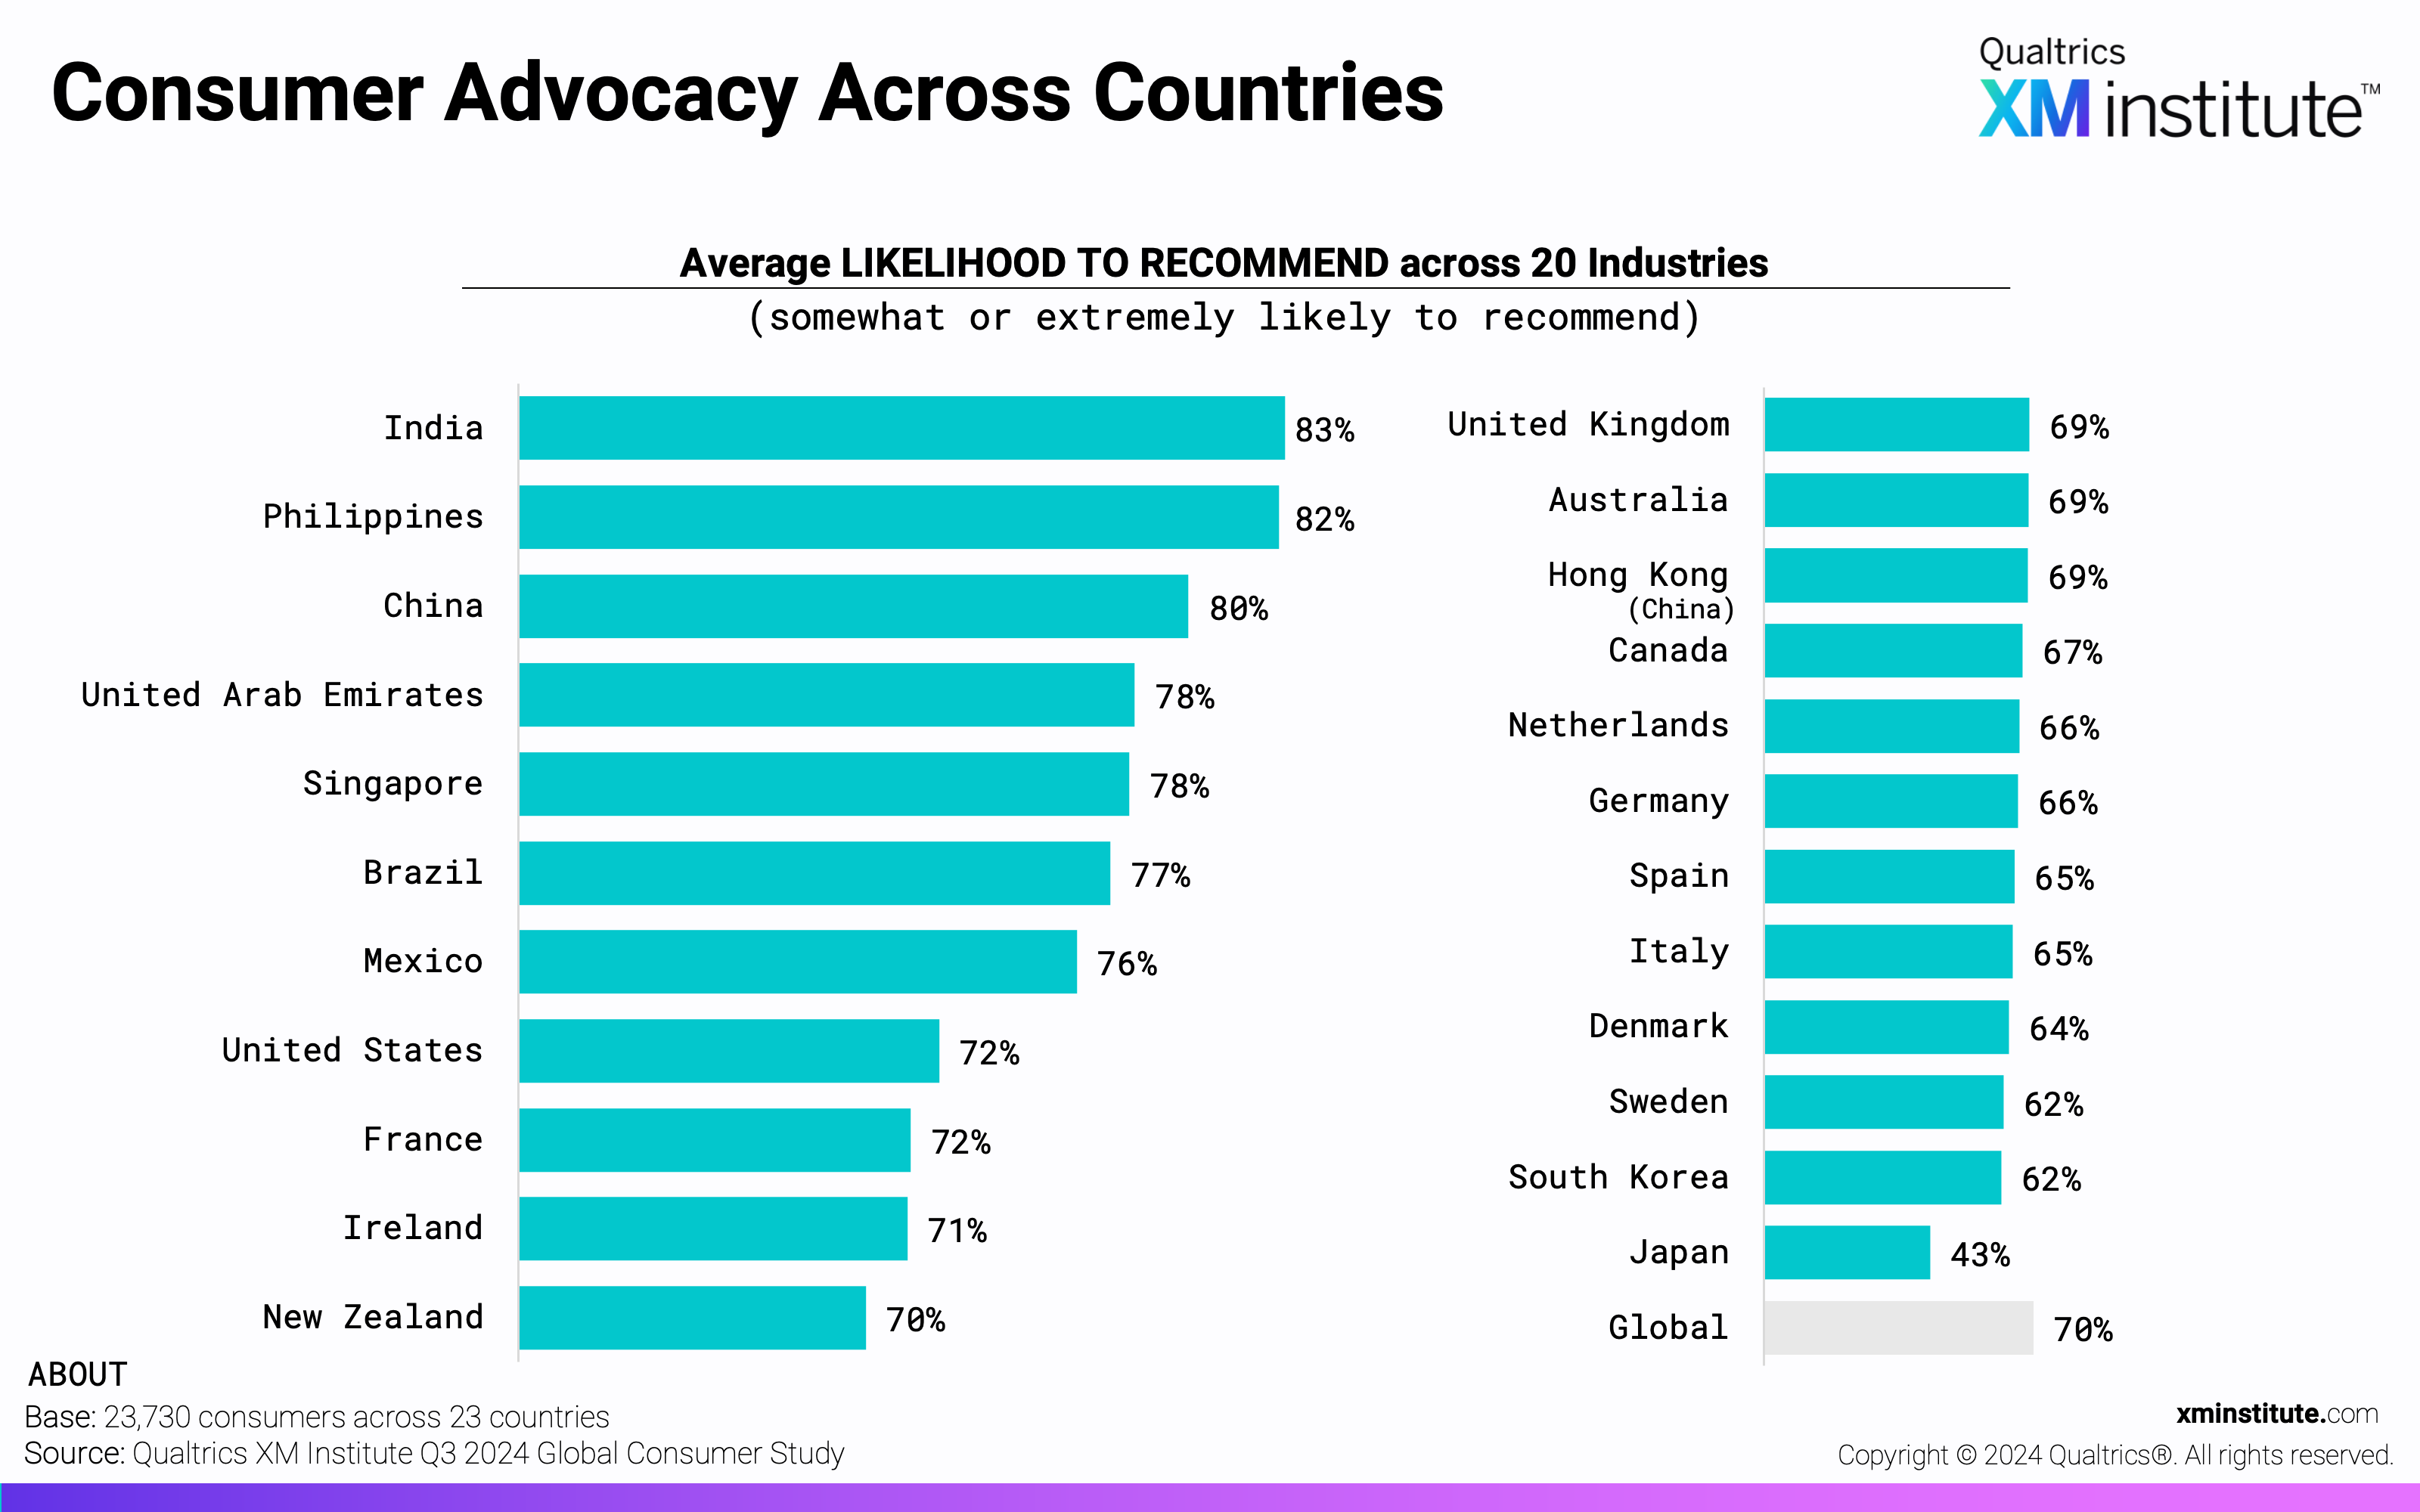
- Indian consumers are the strongest advocates. Indian consumers say they are likely to recommend an organization after 83% of experiences, the highest rating across the 23 countries. Filipino (82%) and Chinese (80%) consumers are similarly strong advocates. In contrast, Japanese organizations should expect the least advocacy from their consumers, who are likely to recommend after just 43% of interactions – 27 points below the global average.
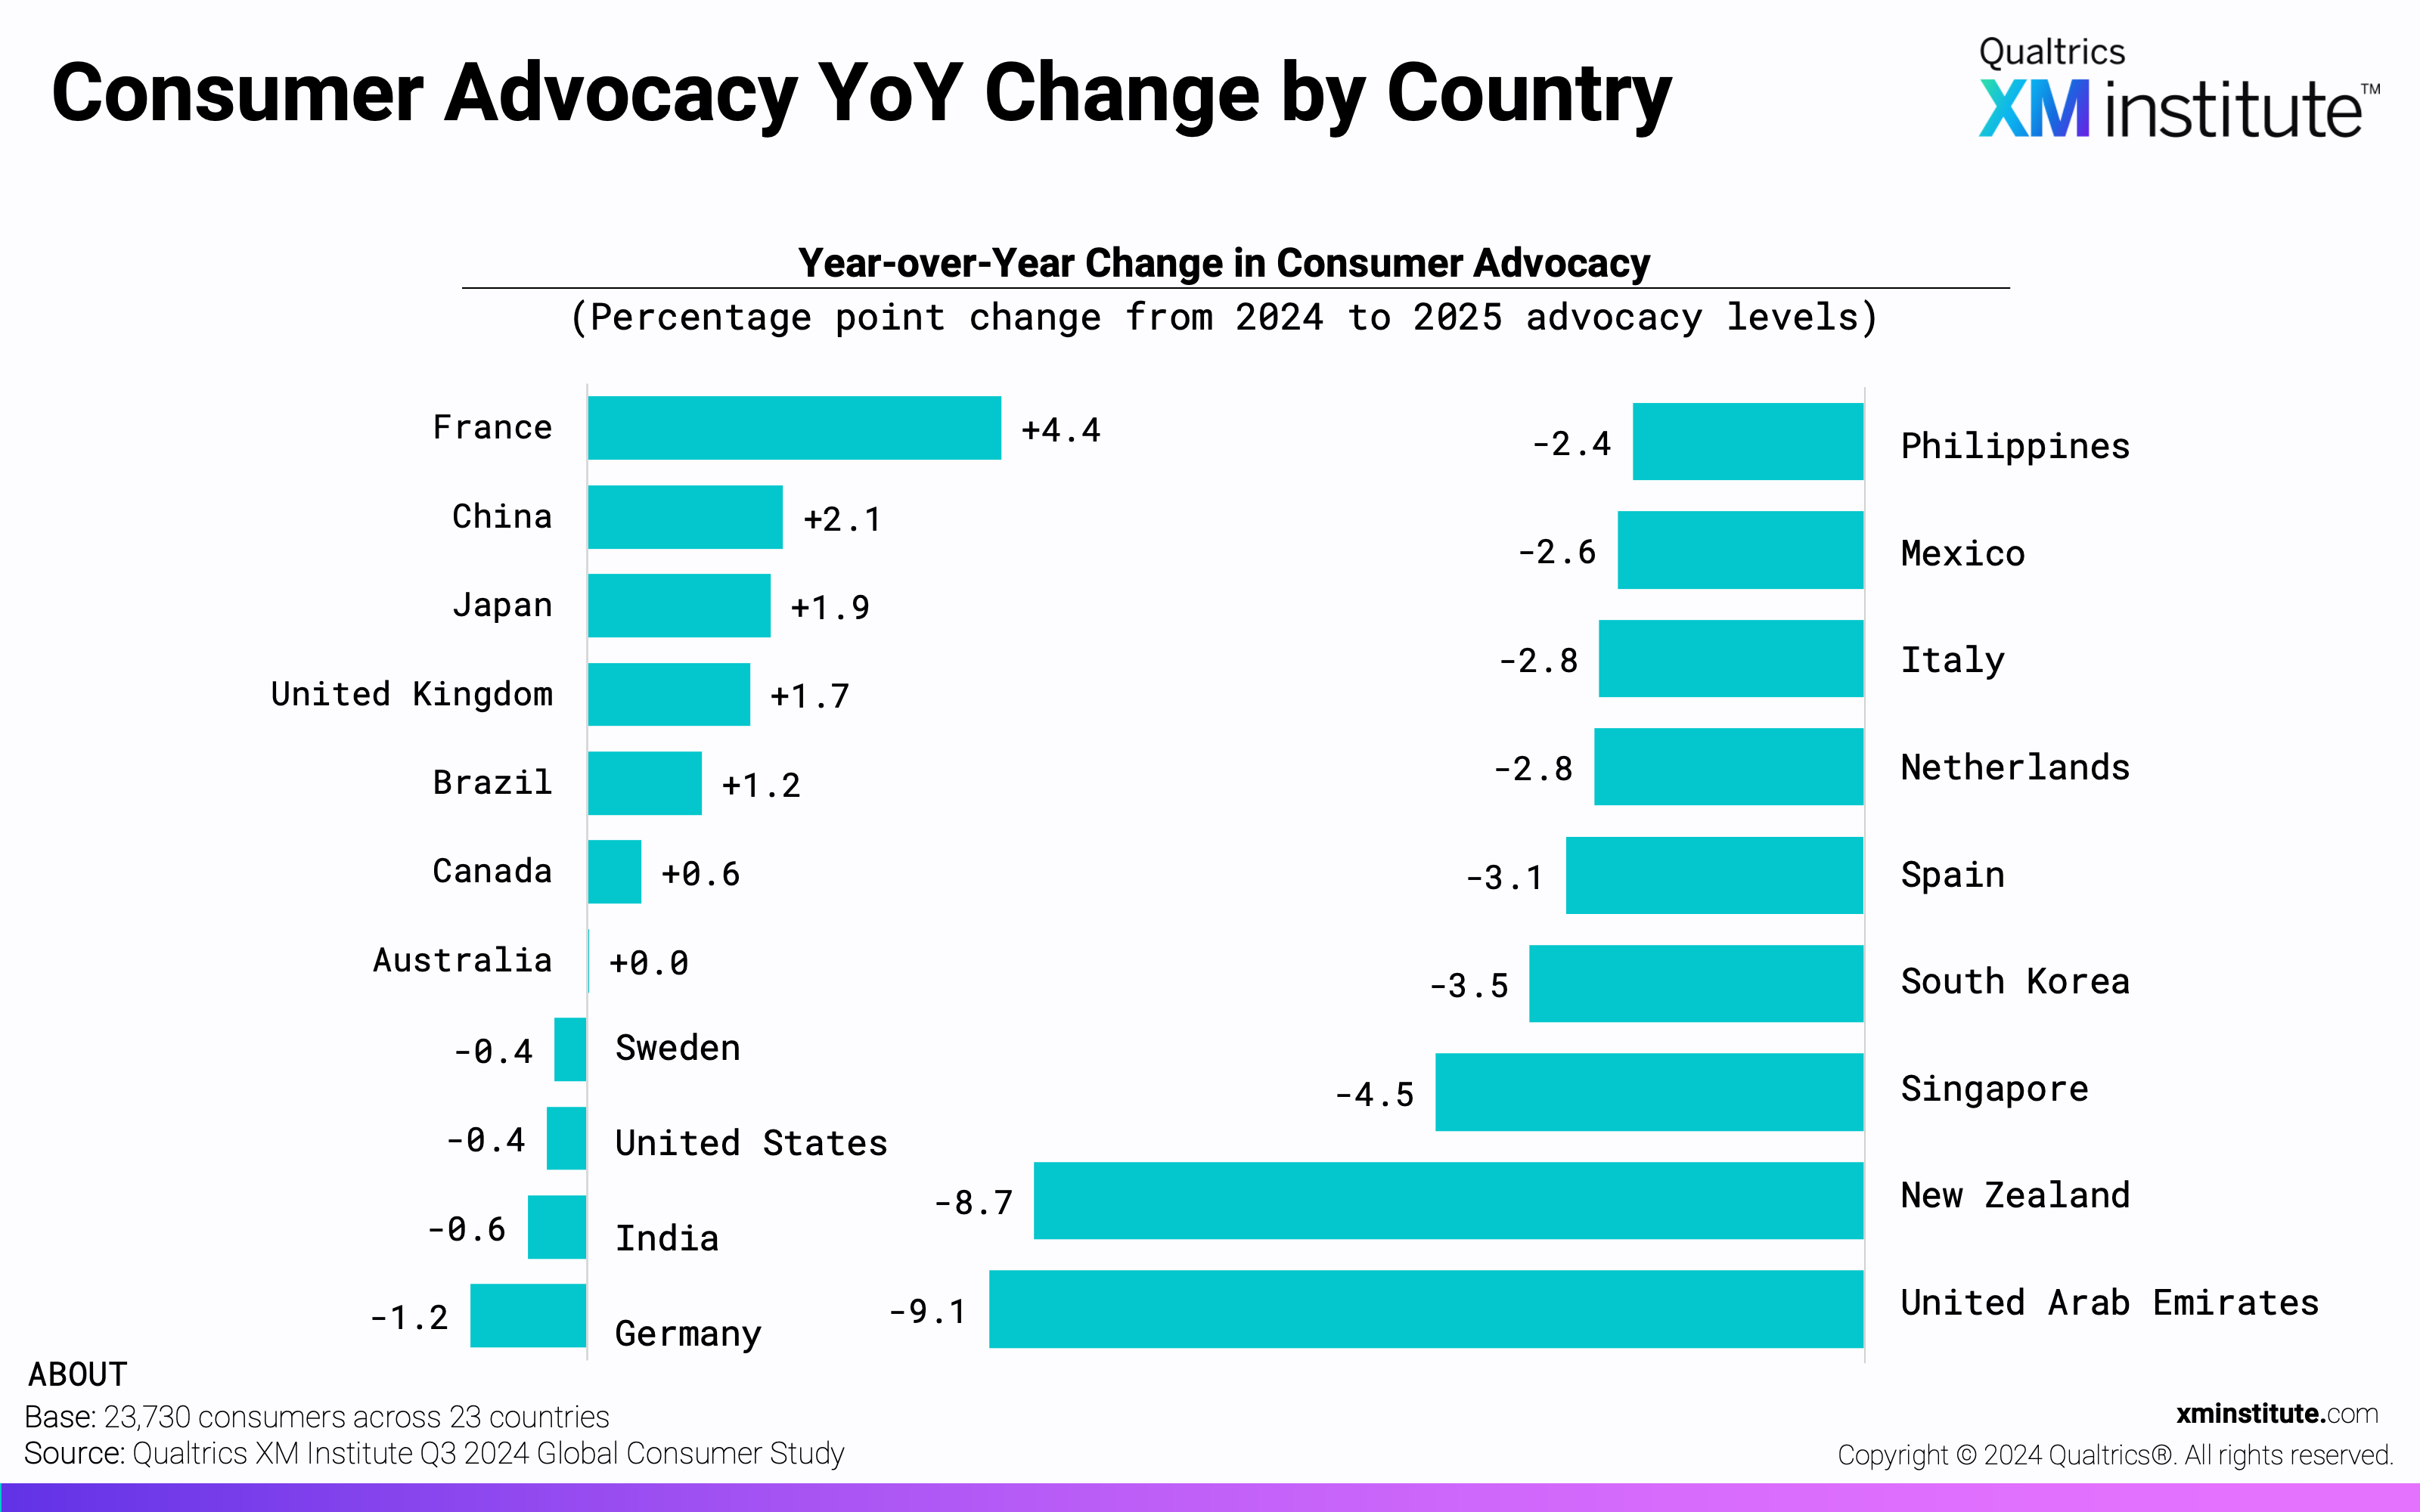
- Advocacy has changed the most among Emirati consumers. Between our 2024 and 2025 studies, likelihood to recommend in the United Arab Emirates has decreased 9.1 points, the largest year-over-year change across the 20 countries represented. A similarly large drop (-8.7 pts) occurred among New Zealand consumers. On the other end of the spectrum, French organizations saw the largest increase in consumer advocacy (+4.4 pts) from 2024. Consumer advocacy has changed the least in Australia, with minimal year-over-year increases in likelihood to recommend.
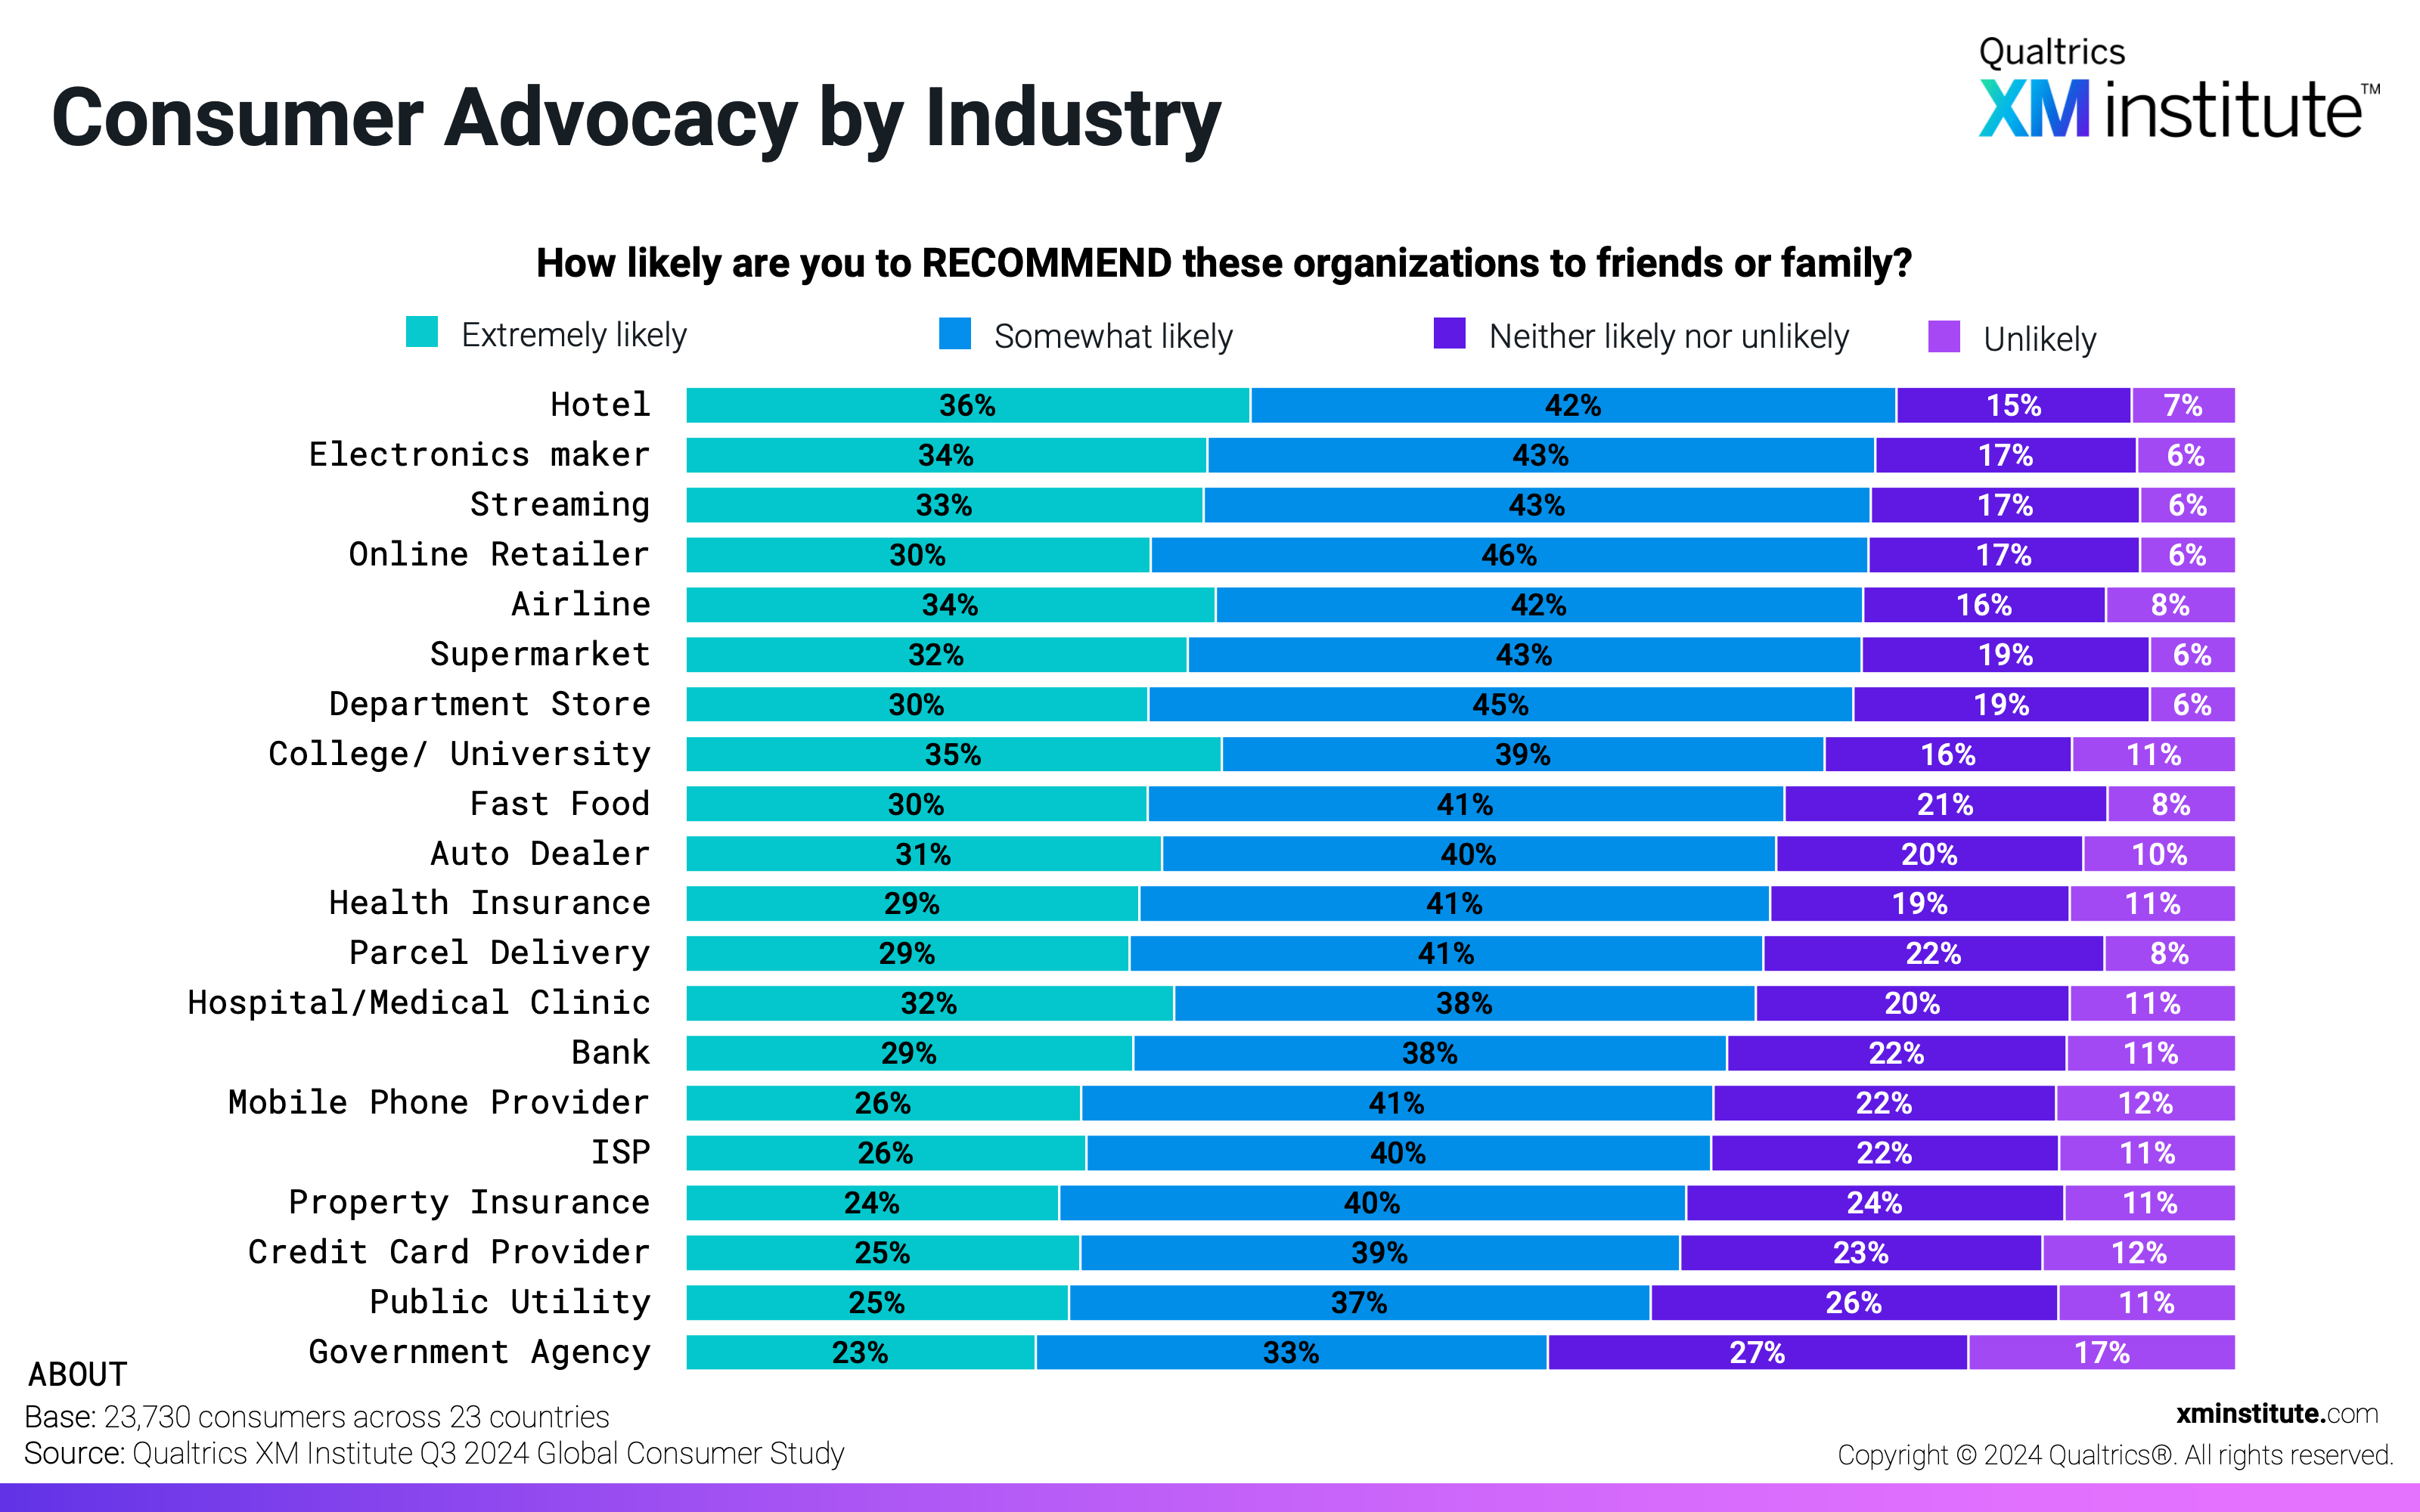
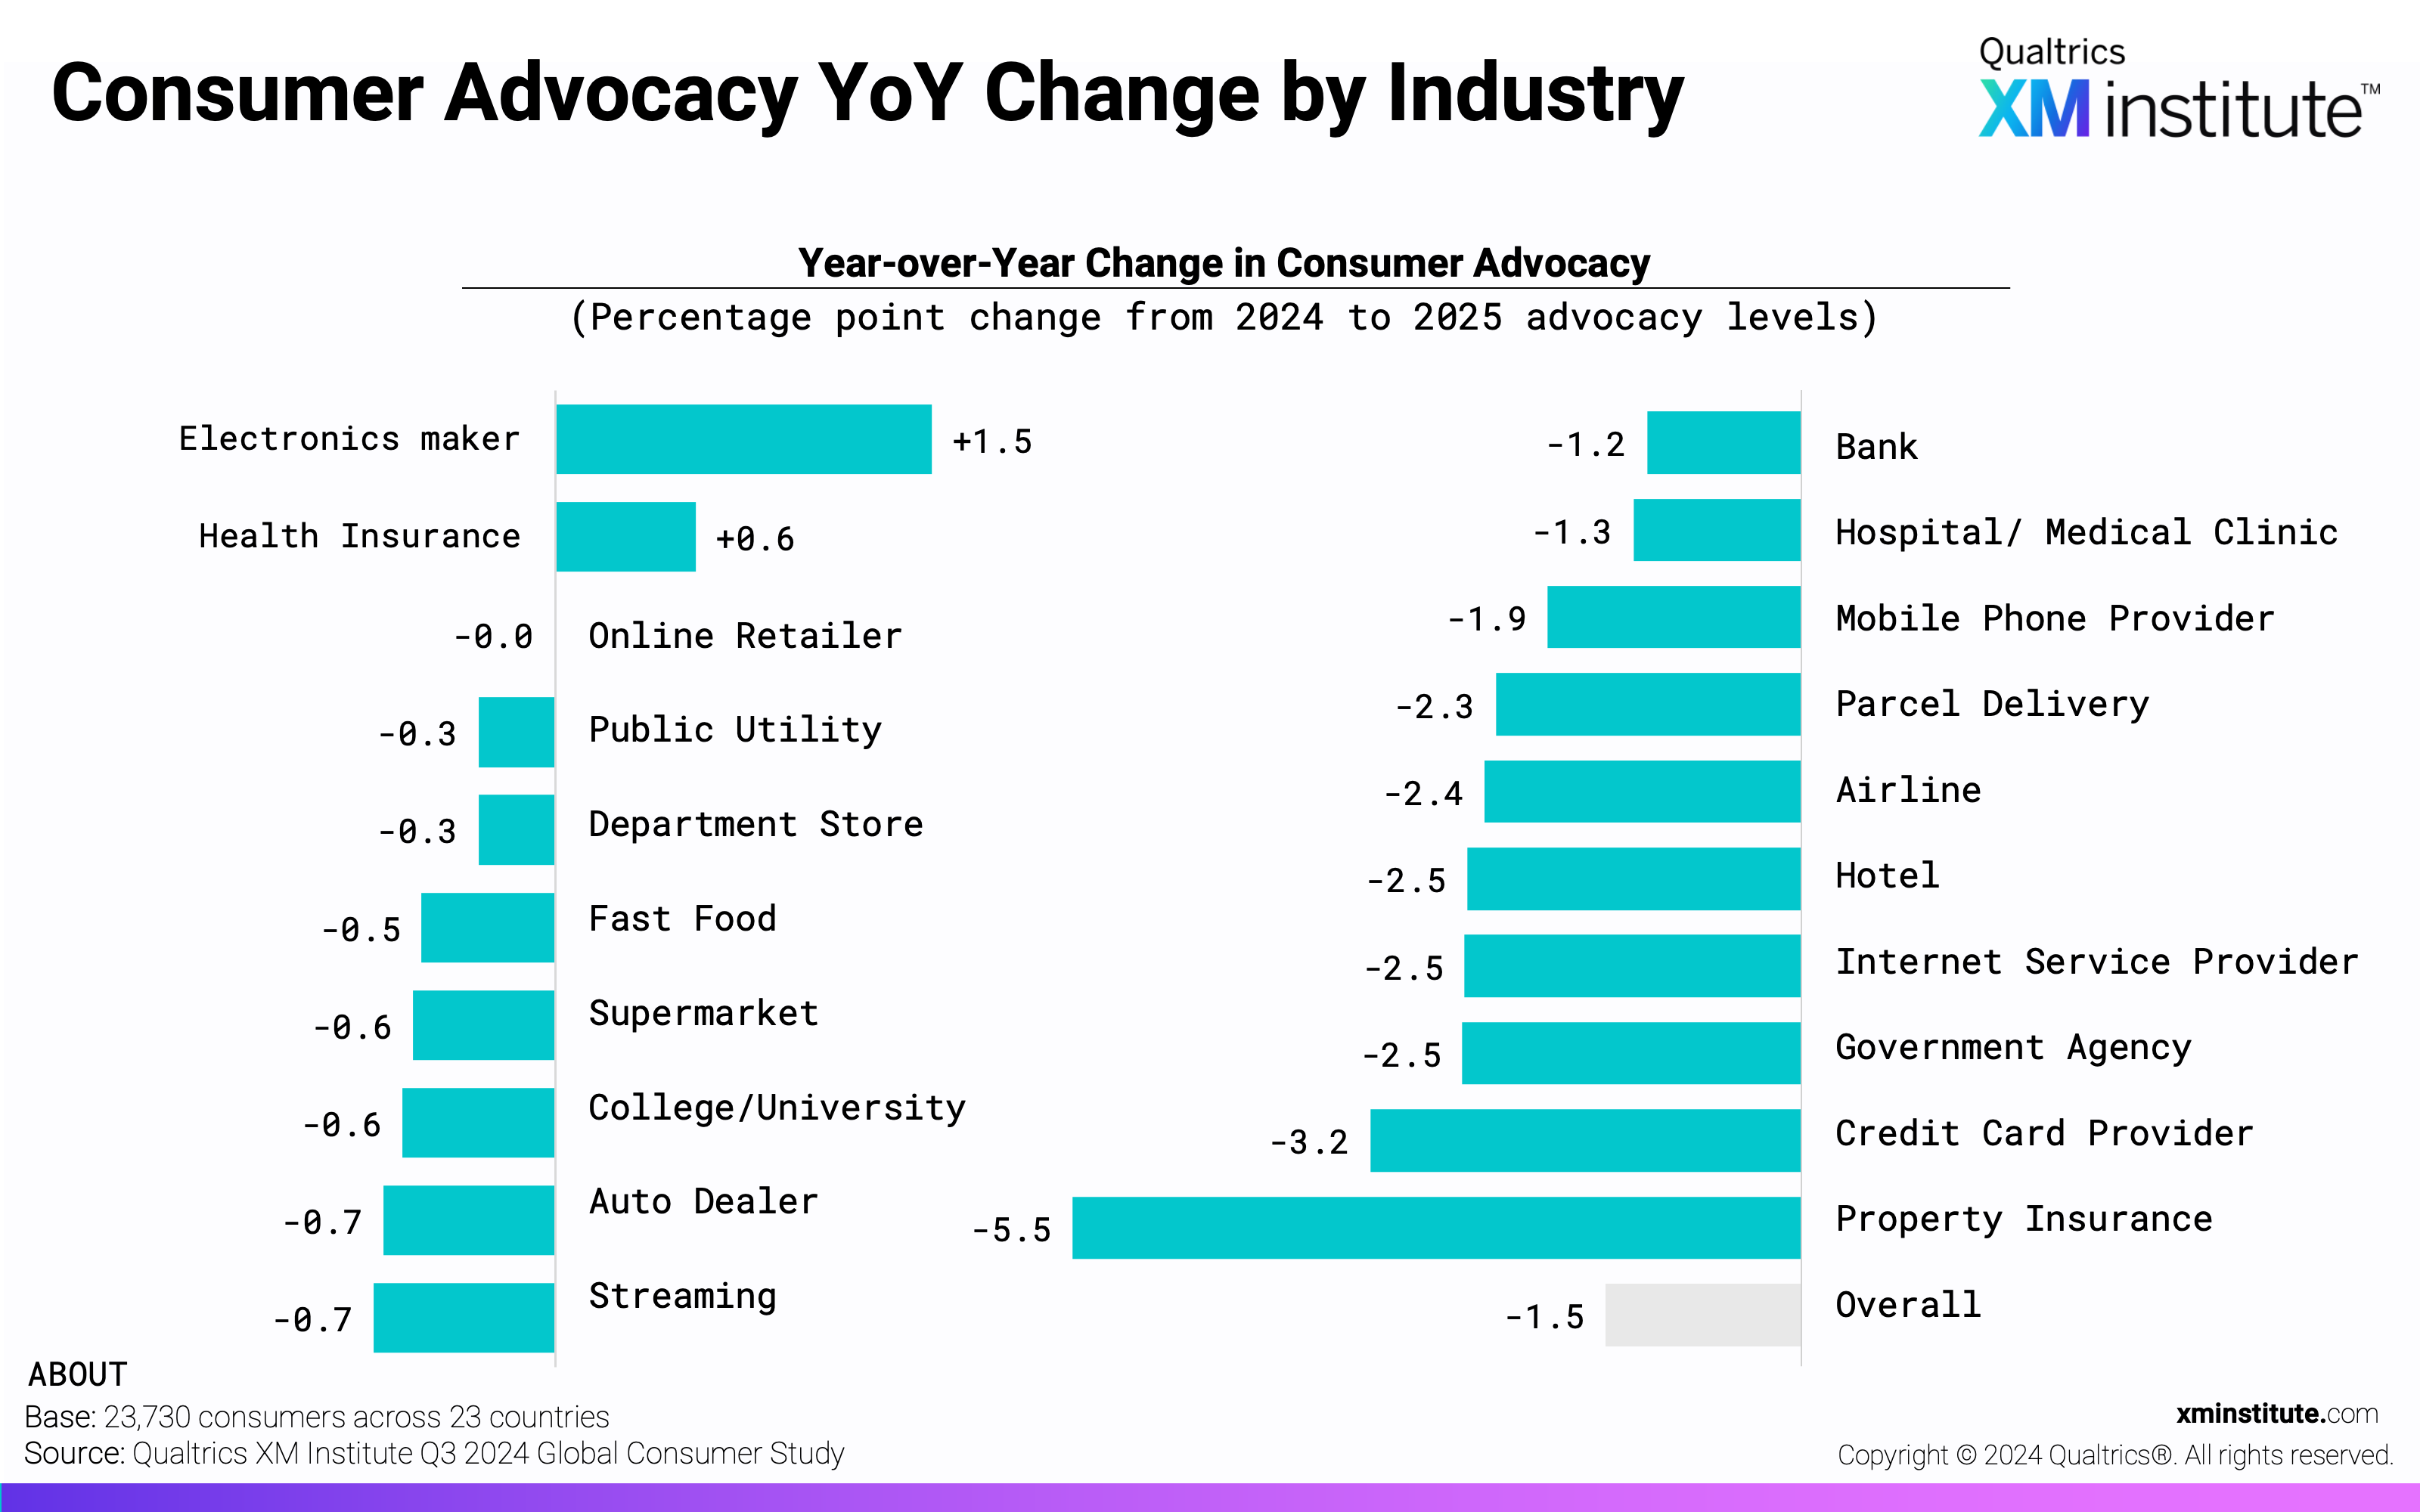
- Hotels and electronics receive the highest advocacy ratings. Consumers are likely to recommend the organization after 78% of hotel experiences and 77% of electronics experiences – the highest advocacy levels across 20 industries. Government agencies (56%) and public utilities (62%) are least likely to have customers recommend them to friends or family. Over the last year, advocacy has changed the least for online retailers (+0 pts), while property insurers (-5.5 pts) and credit card providers (-3.2 pts) saw the most dramatic declines.
Key Findings: Likelihood to Rebuy
Repeat purchases are critical drivers of business results. To measure how likely global customers are to rebuy from organizations they recently interacted with, we asked consumers to rate their likelihood of repurchasing across 20 industries on a scale of 1 (extremely unlikely) to 5 (extremely likely). From their responses, we found that:
- Global consumer likelihood to repurchase lands at 69%. After 69% of recent experiences, consumers said they were somewhat or extremely likely to buy more from that organization. Globally, likelihood to purchase more has increased by 3.2 points since 2022 across the 19 countries and 17 industries we’ve consistently included in the studies.
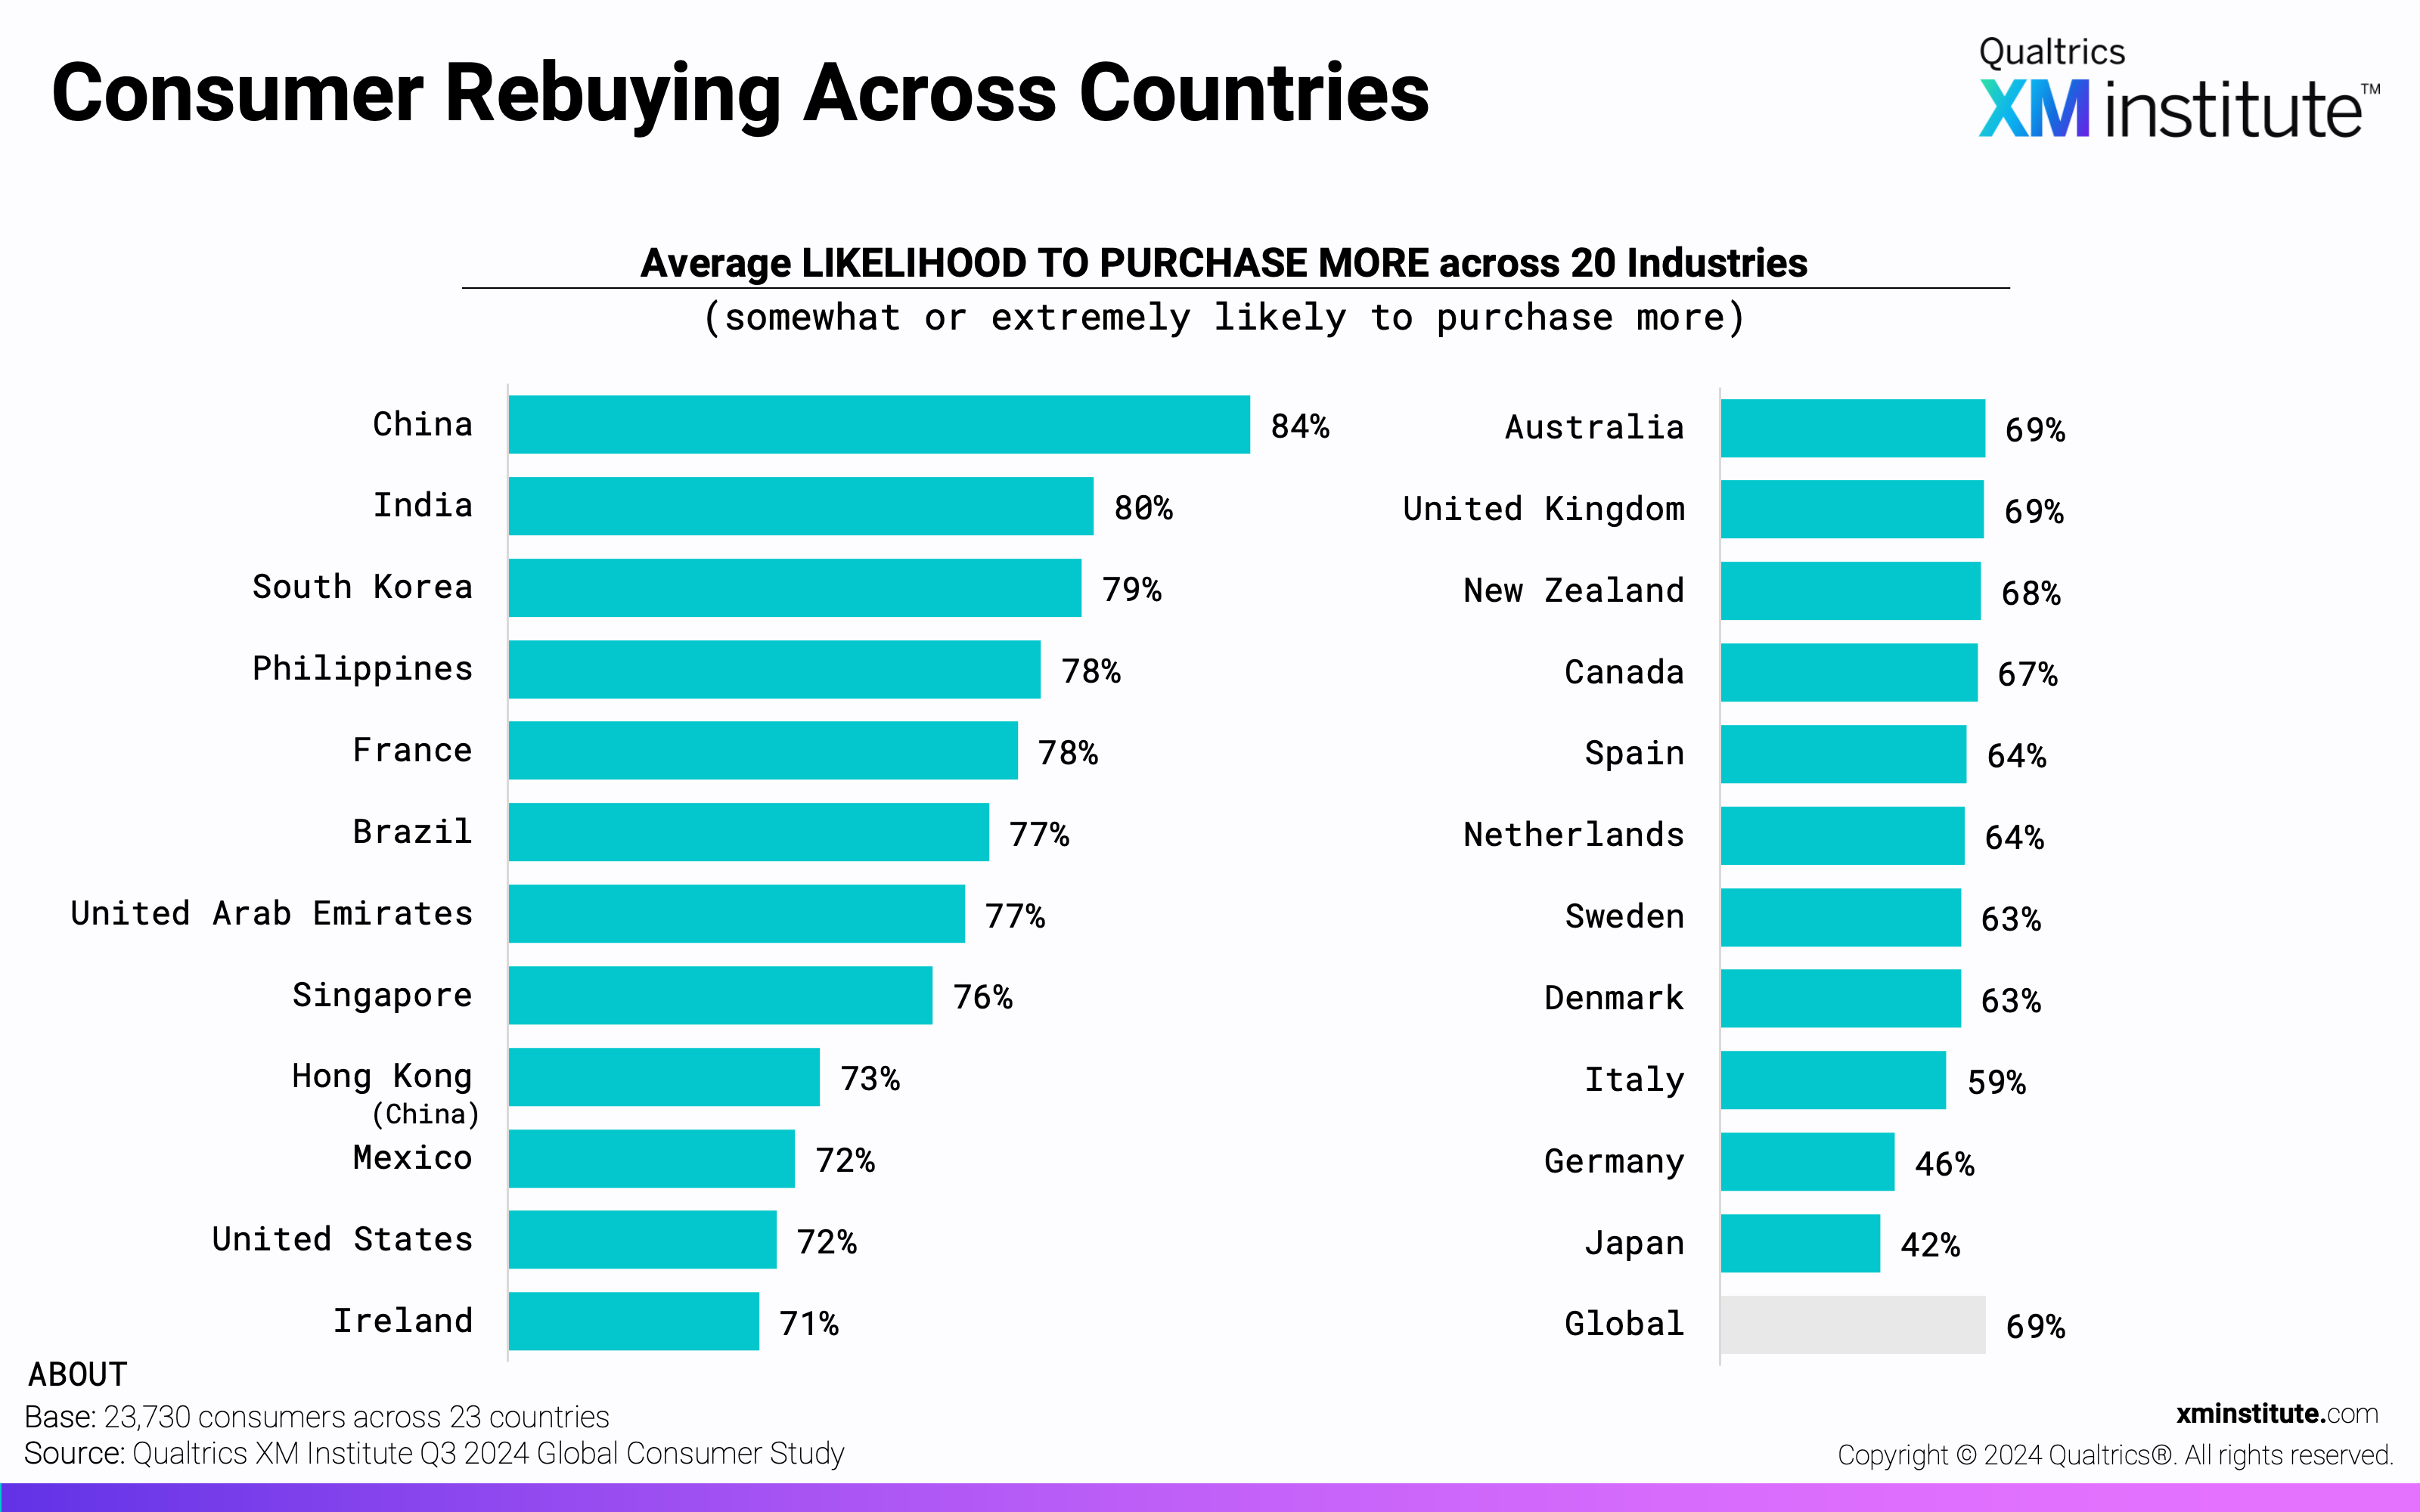
- Chinese consumers are the most likely to purchase more. Chinese consumers say they are likely to purchase more after 84% of experiences – twice the rate of Japanese consumers, who say they are likely to rebuy just 42% of the time. German (46%) and Italian (59%) consumers have the second- and third-lowest intent to repurchase levels across the 23 countries.
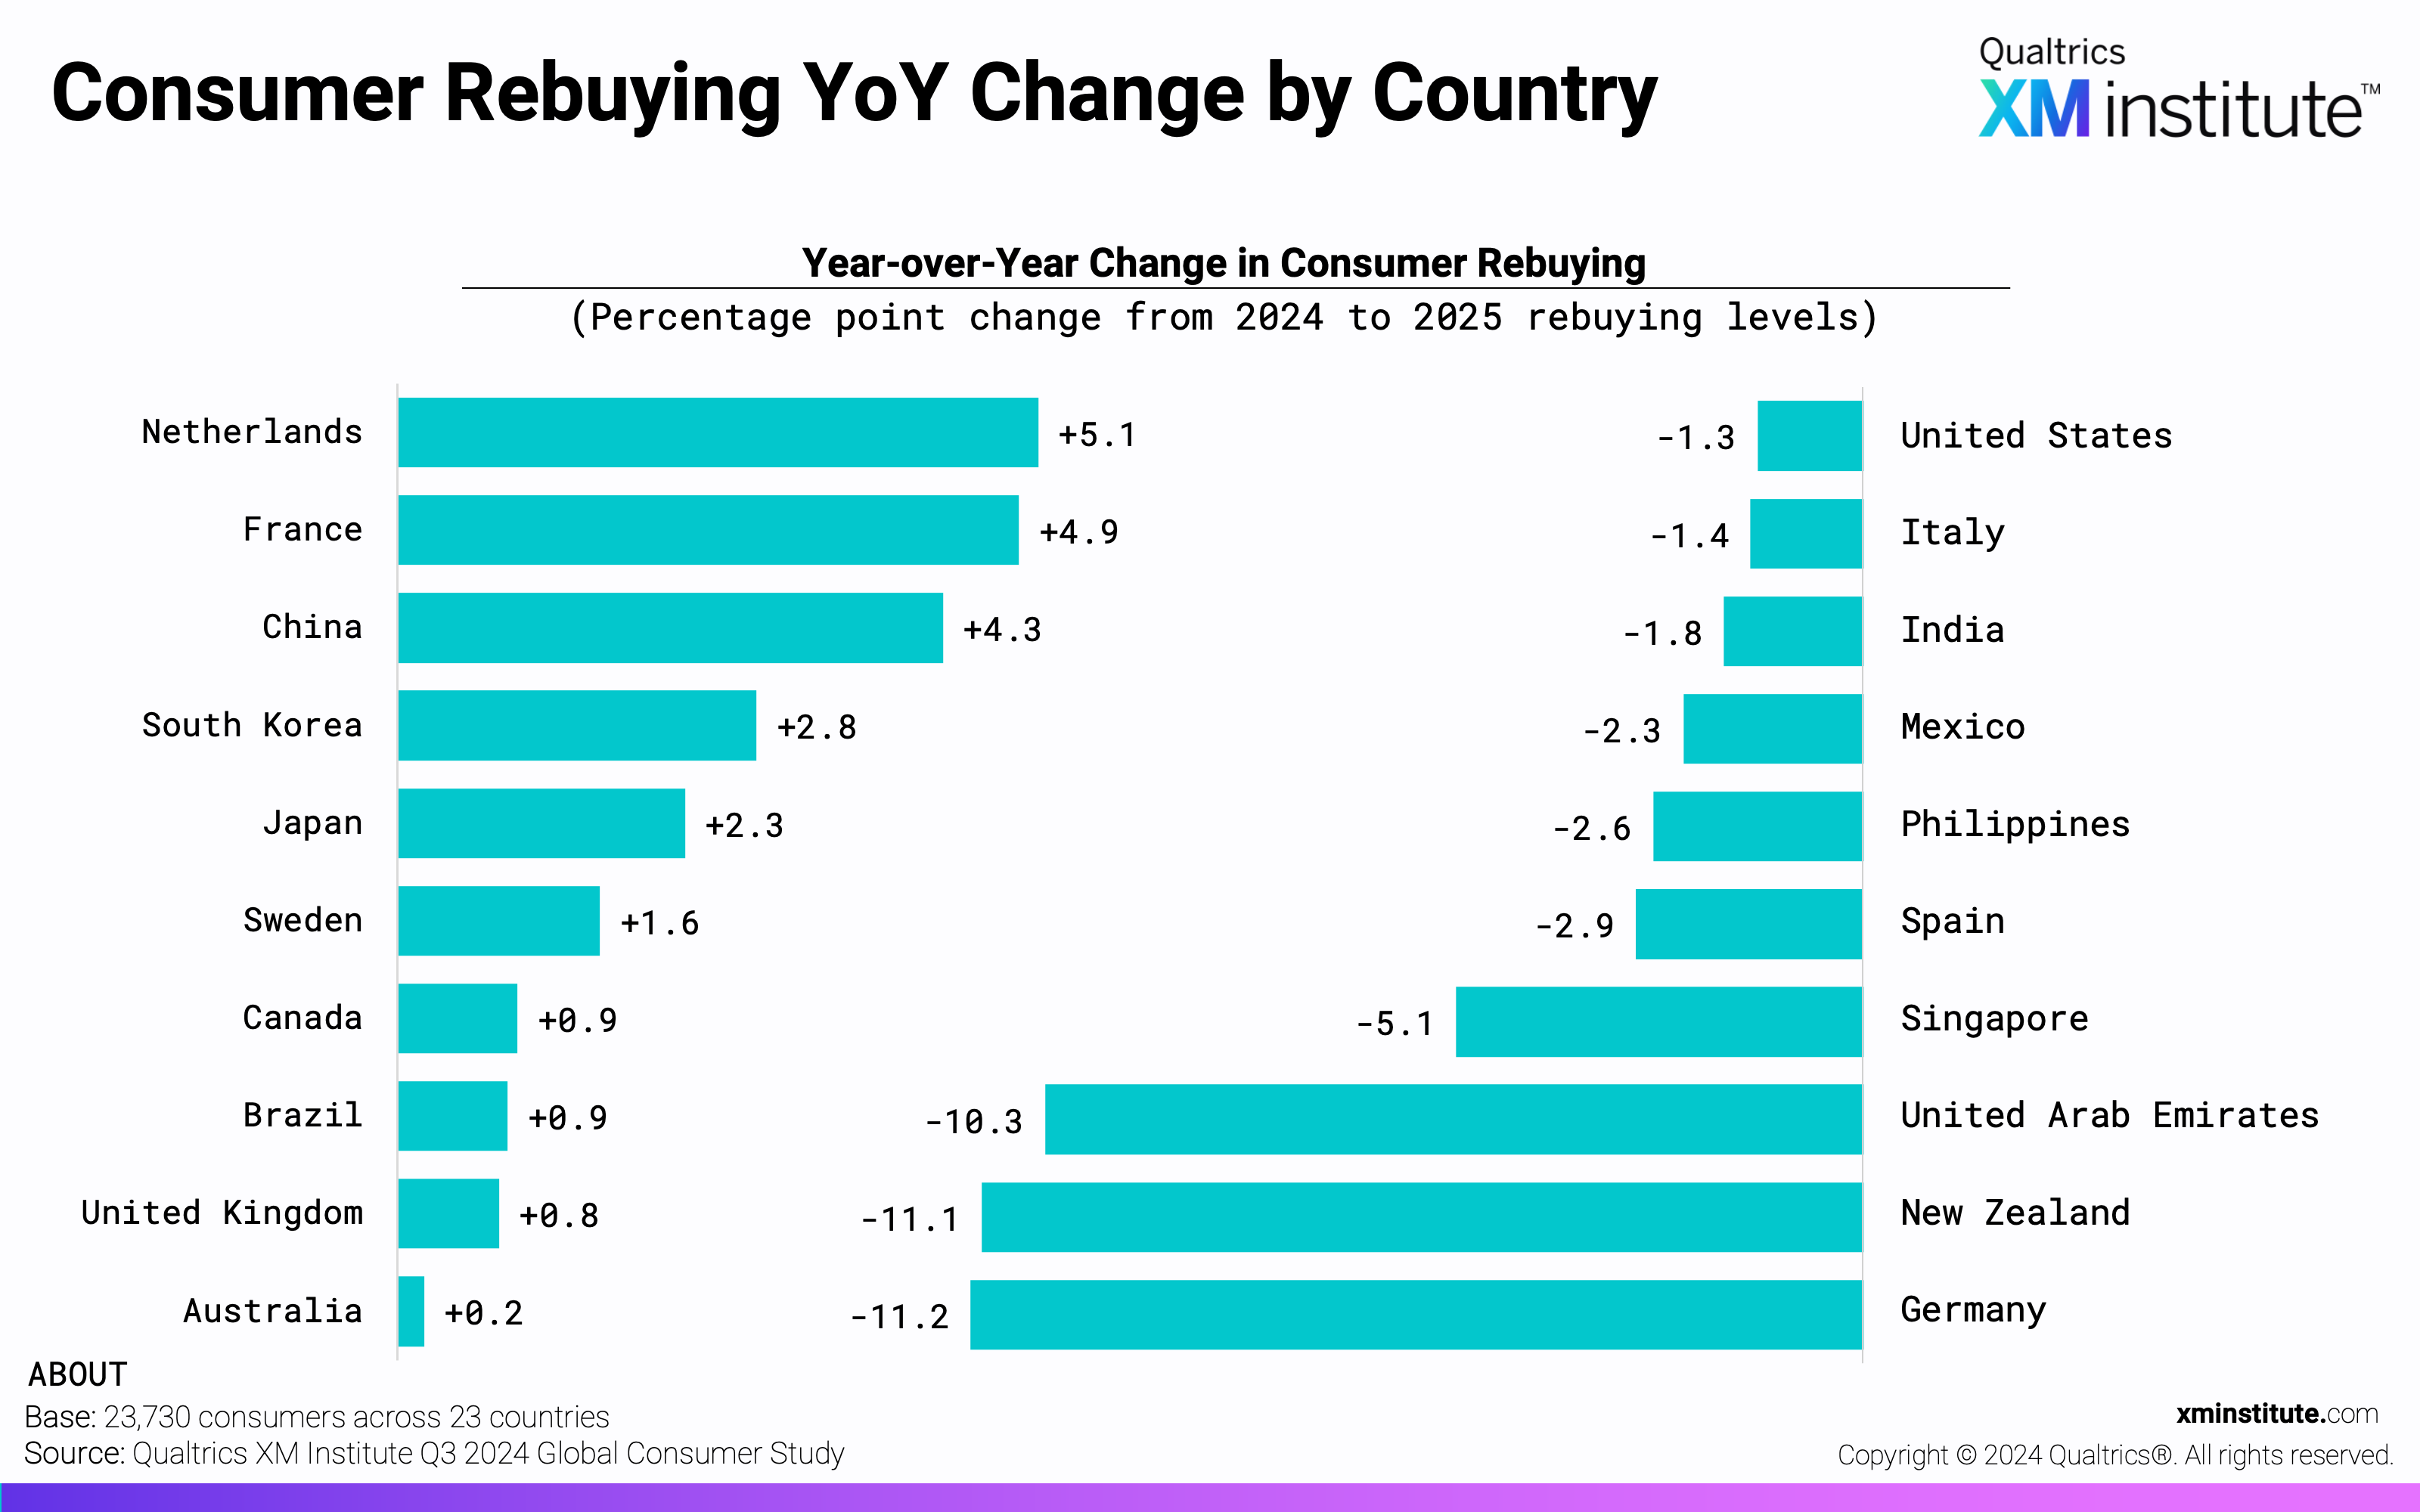
- Repurchase intent changed the most among German consumers. Between our 2024 and 2025 studies, consumer likelihood to purchase more has changed the most for Germans (-11.2 pts) and New Zealanders (-11.1 pts), while it has changed the least for Australian consumers (+0.2 pts). Dutch organizations enjoy the greatest increase in consumer intent to rebuy (+5.1 pts).
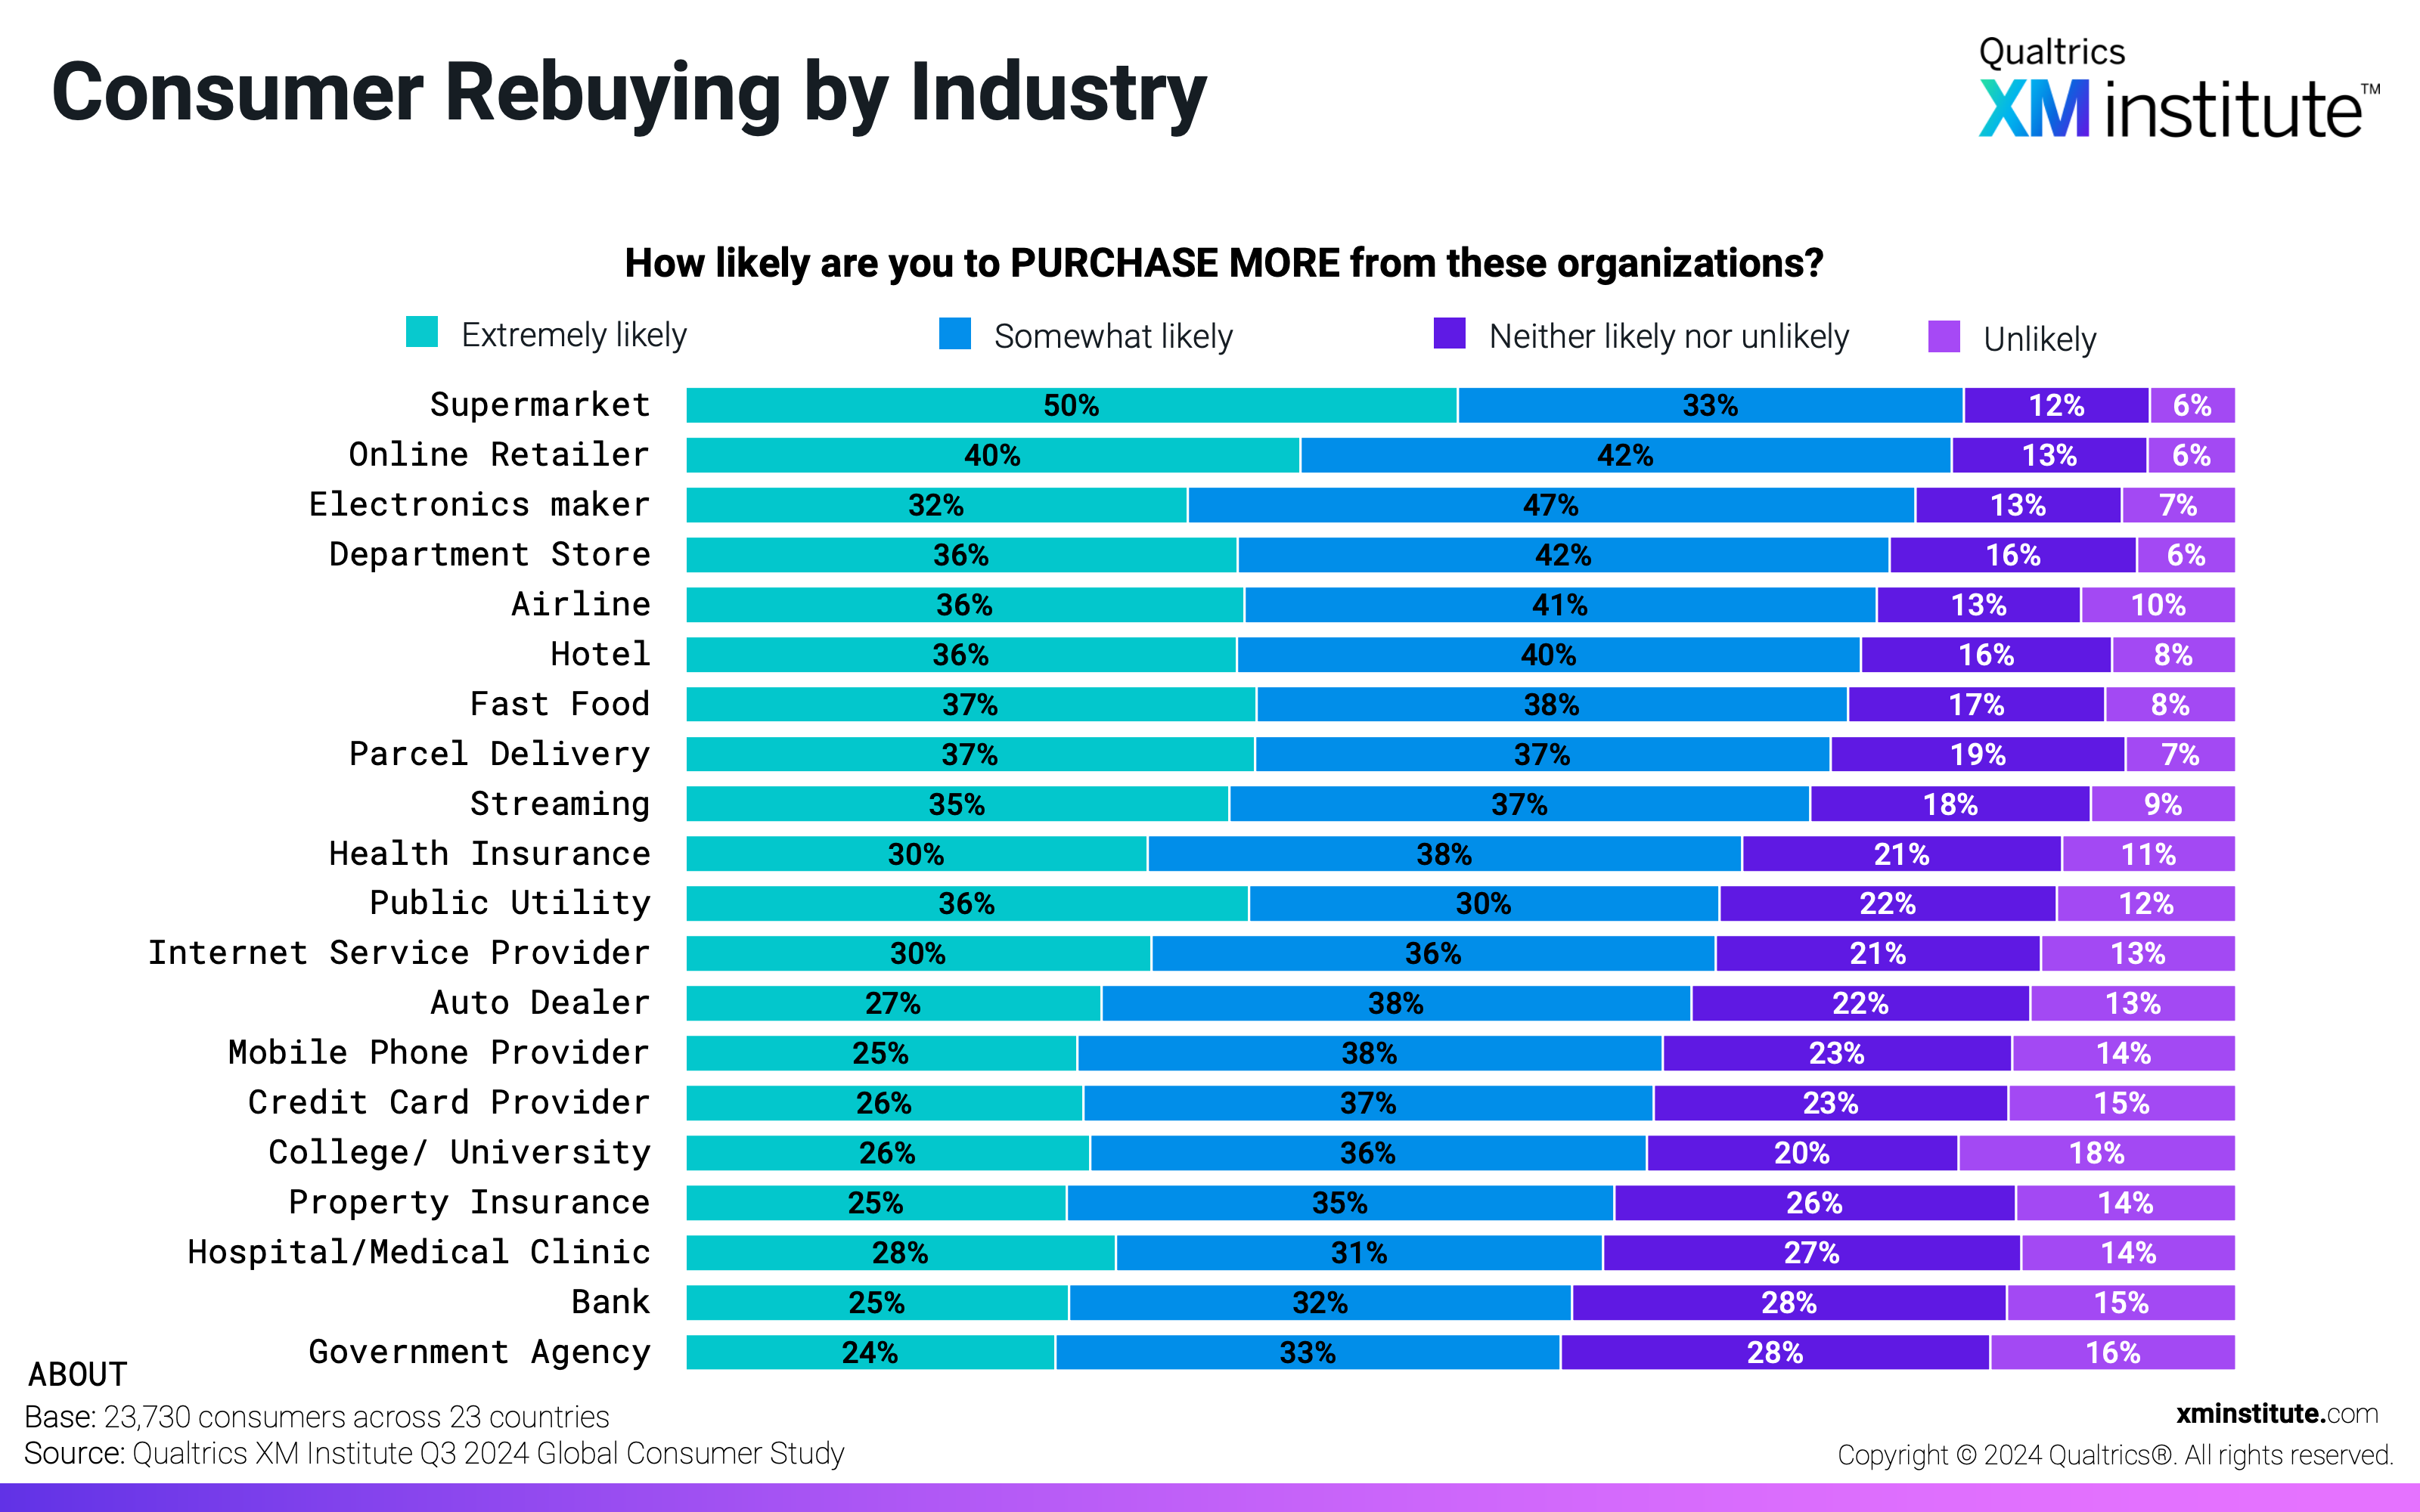
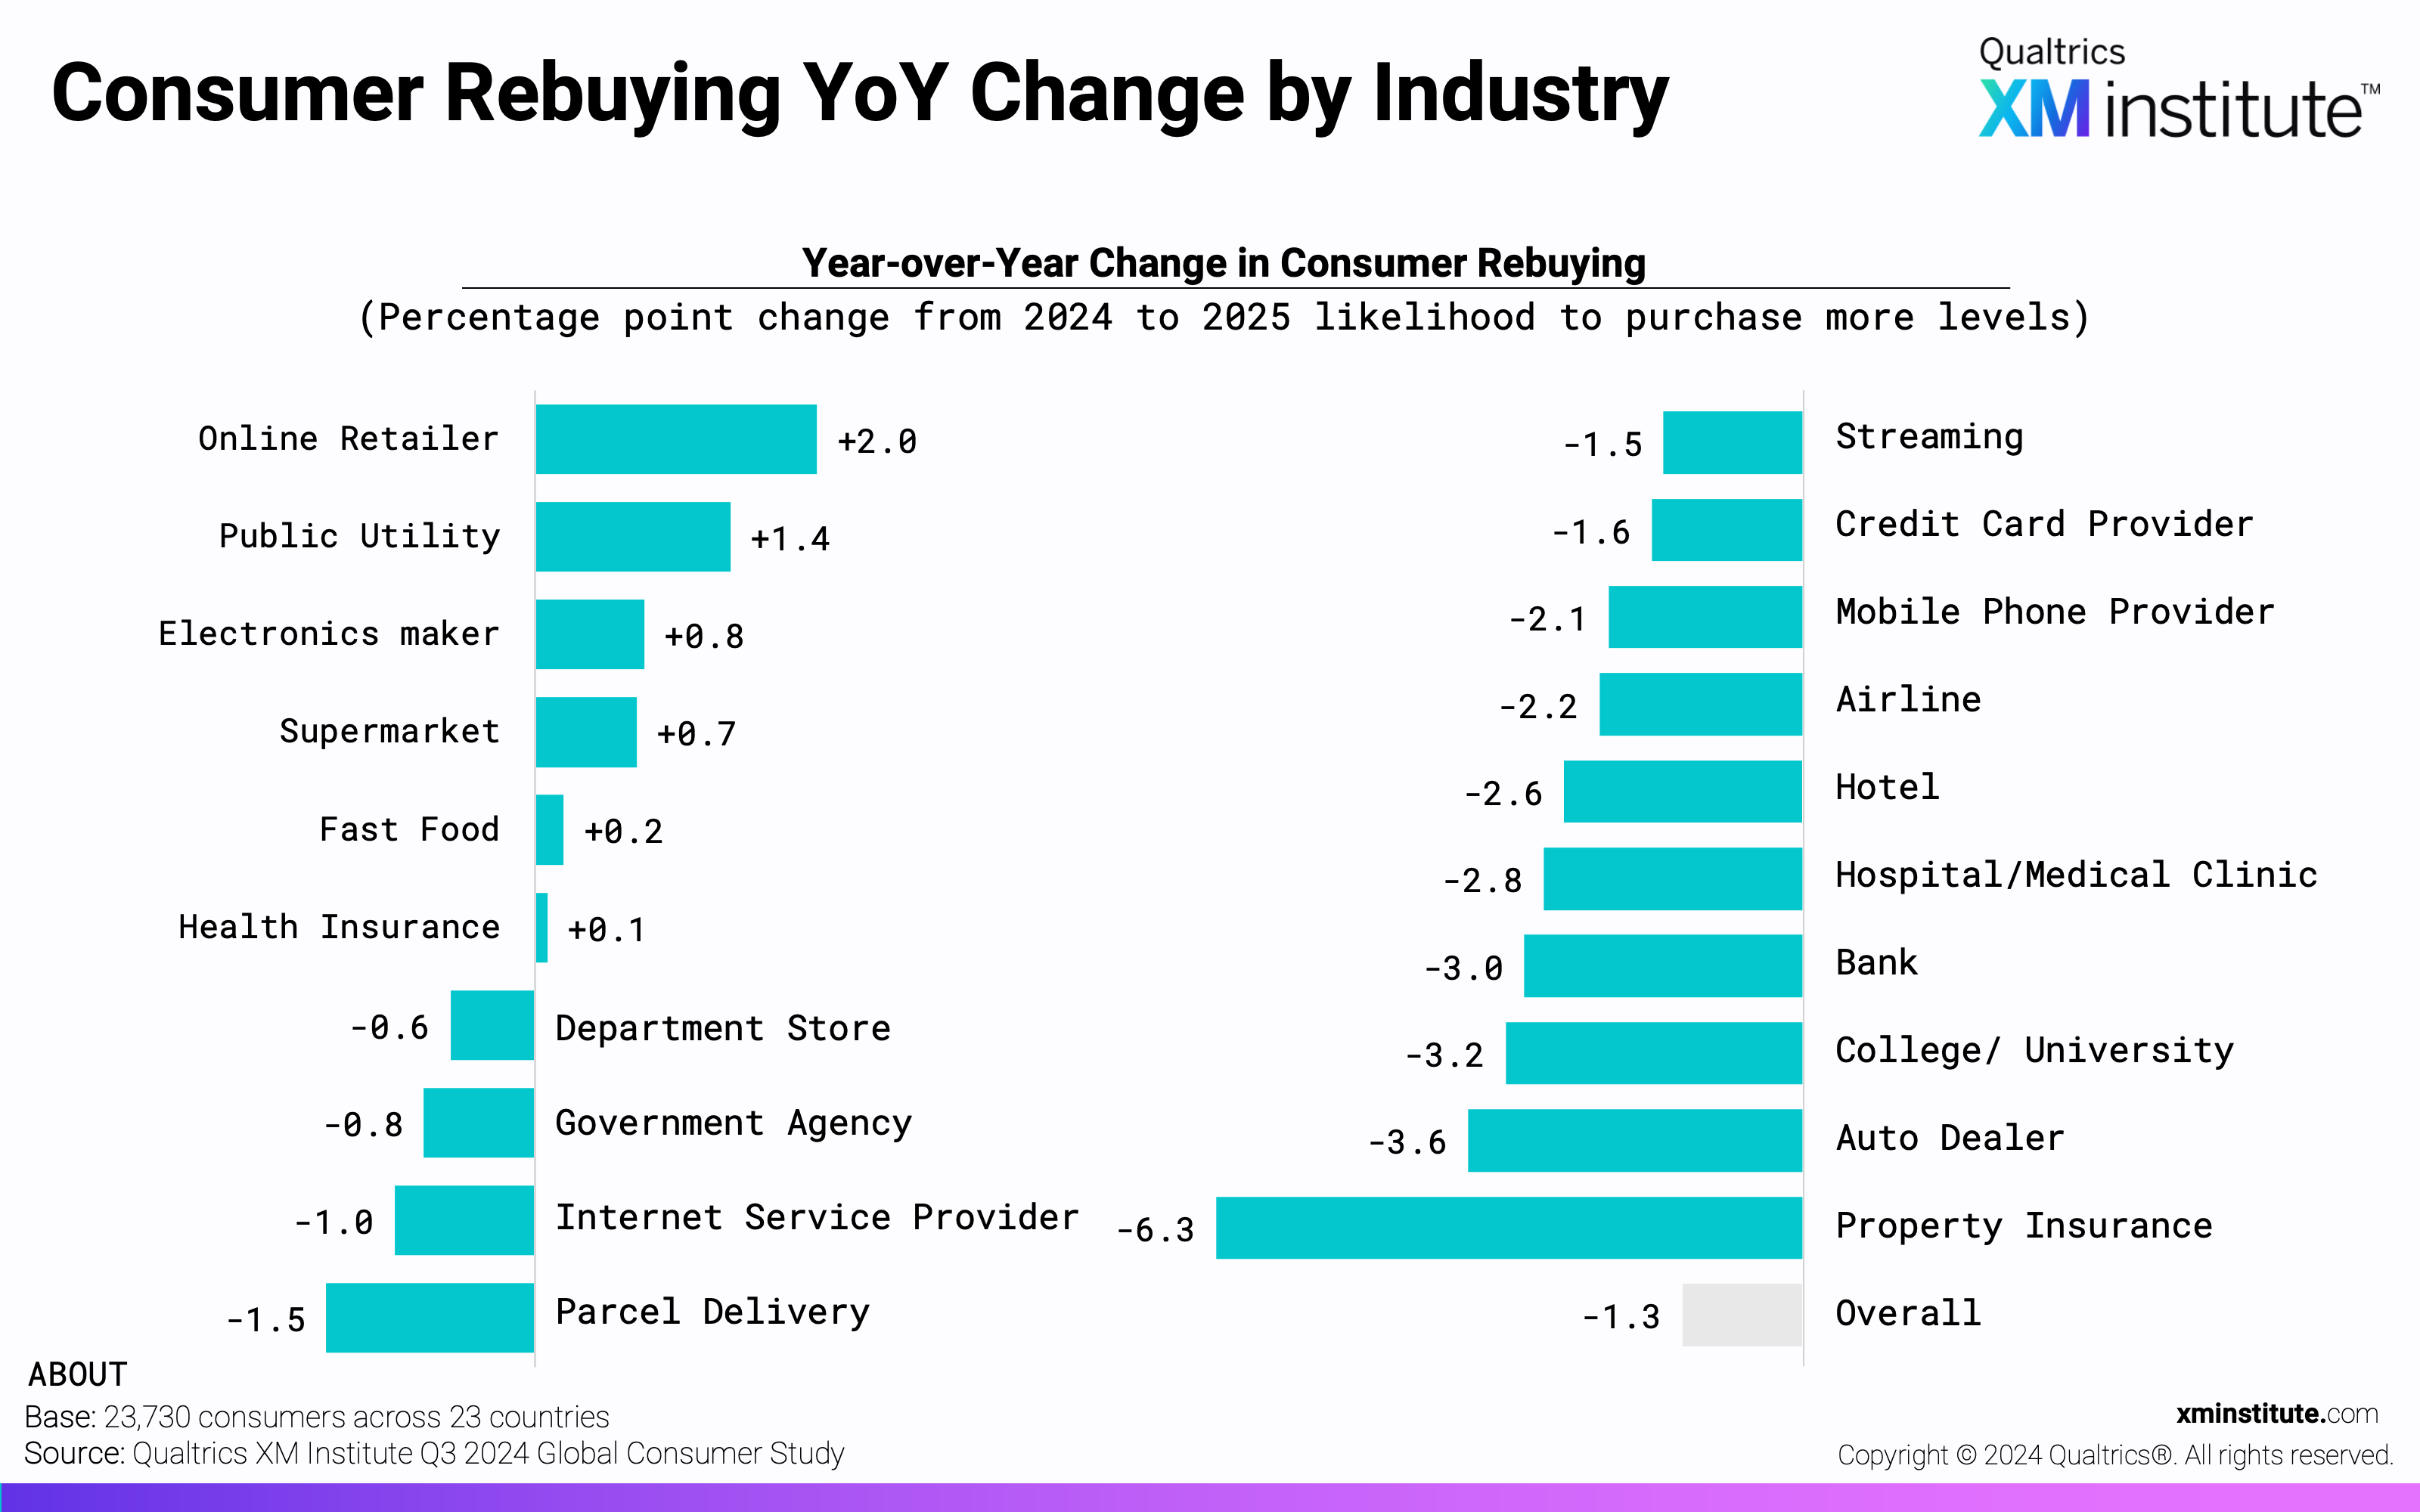
- Consumers are most likely to purchase more from supermarkets and online retailers. Consumers globally are likely to purchase more after 82% of both supermarket and online retail experiences, while just 56% say the same after government agency experiences. Over the past year, likelihood to repurchase has increased the most for online retailers (+2 pts) and second-most for public utilities (+1.4 pts). Meanwhile, repurchase intent has declined the most for property insurers, dropping -6.3 points in the past year. Health insurers (+0.1 pt) and fast food (+0.2 pts) saw the least change in their consumers’ likelihood to purchase more.
Figures
Here are the figures in this Data Snapshot. See industry summaries for download below.
- Consumer Satisfaction Across Countries (see Figure 1)
- Consumer Satisfaction YoY Change by Country (see Figure 2)
- Satisfaction by Industry (see Figure 3)
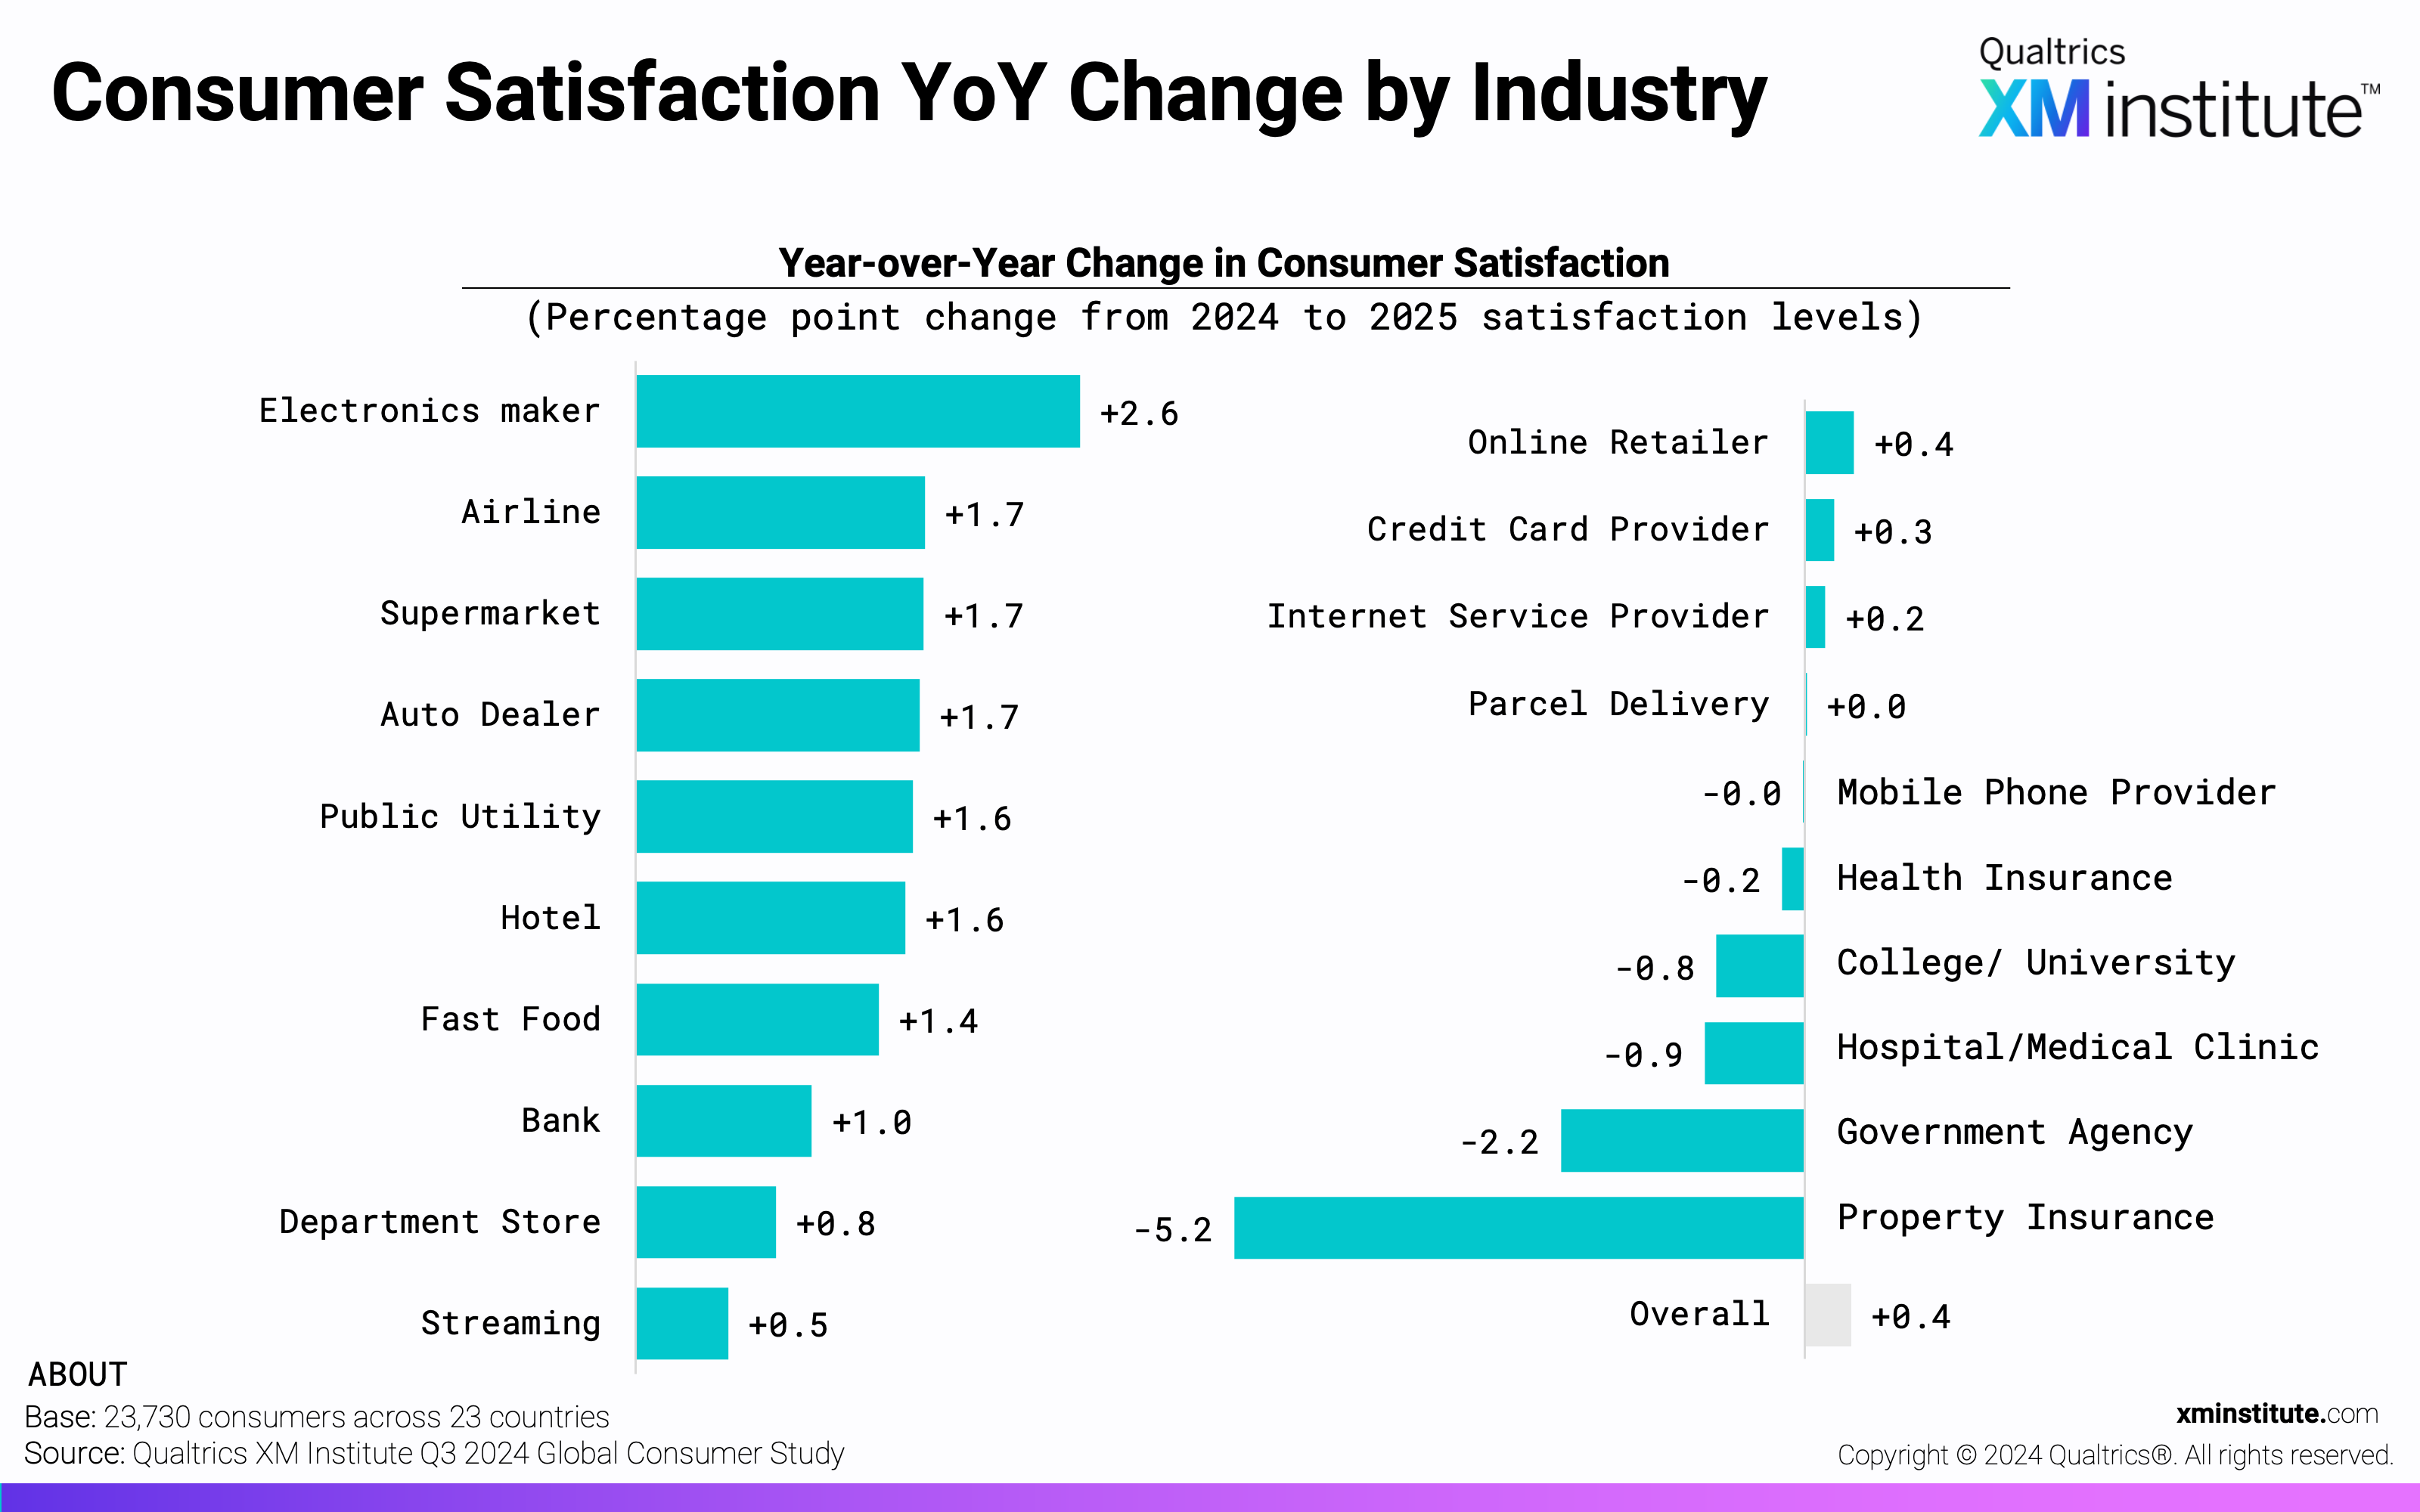
- Consumer Satisfaction YoY Change by Industry (see Figure 4)
- Consumer Trust Across Countries (see Figure 5)
- Consumer Trust YoY Change by Country (see Figure 6)
- Consumer Trust by Industry (see Figure 7)
- Consumer Trust YoY Change by Industry (see Figure 8)
- Consumer Advocacy Across Countries (see Figure 9)
- Consumer Advocacy YoY Change by Country (see Figure 10)
- Consumer Advocacy by Industry (see Figure 11)
- Consumer Advocacy Change by Industry (see Figure 12)
- Consumer Rebuying Across Countries (see Figure 13)
- Consumer Rebuying YoY Change by Country (see Figure 14)
- Consumer Rebuying by Industry (see Figure 15)
- Consumer Rebuying YoY Change by Industry (see Figure 16)
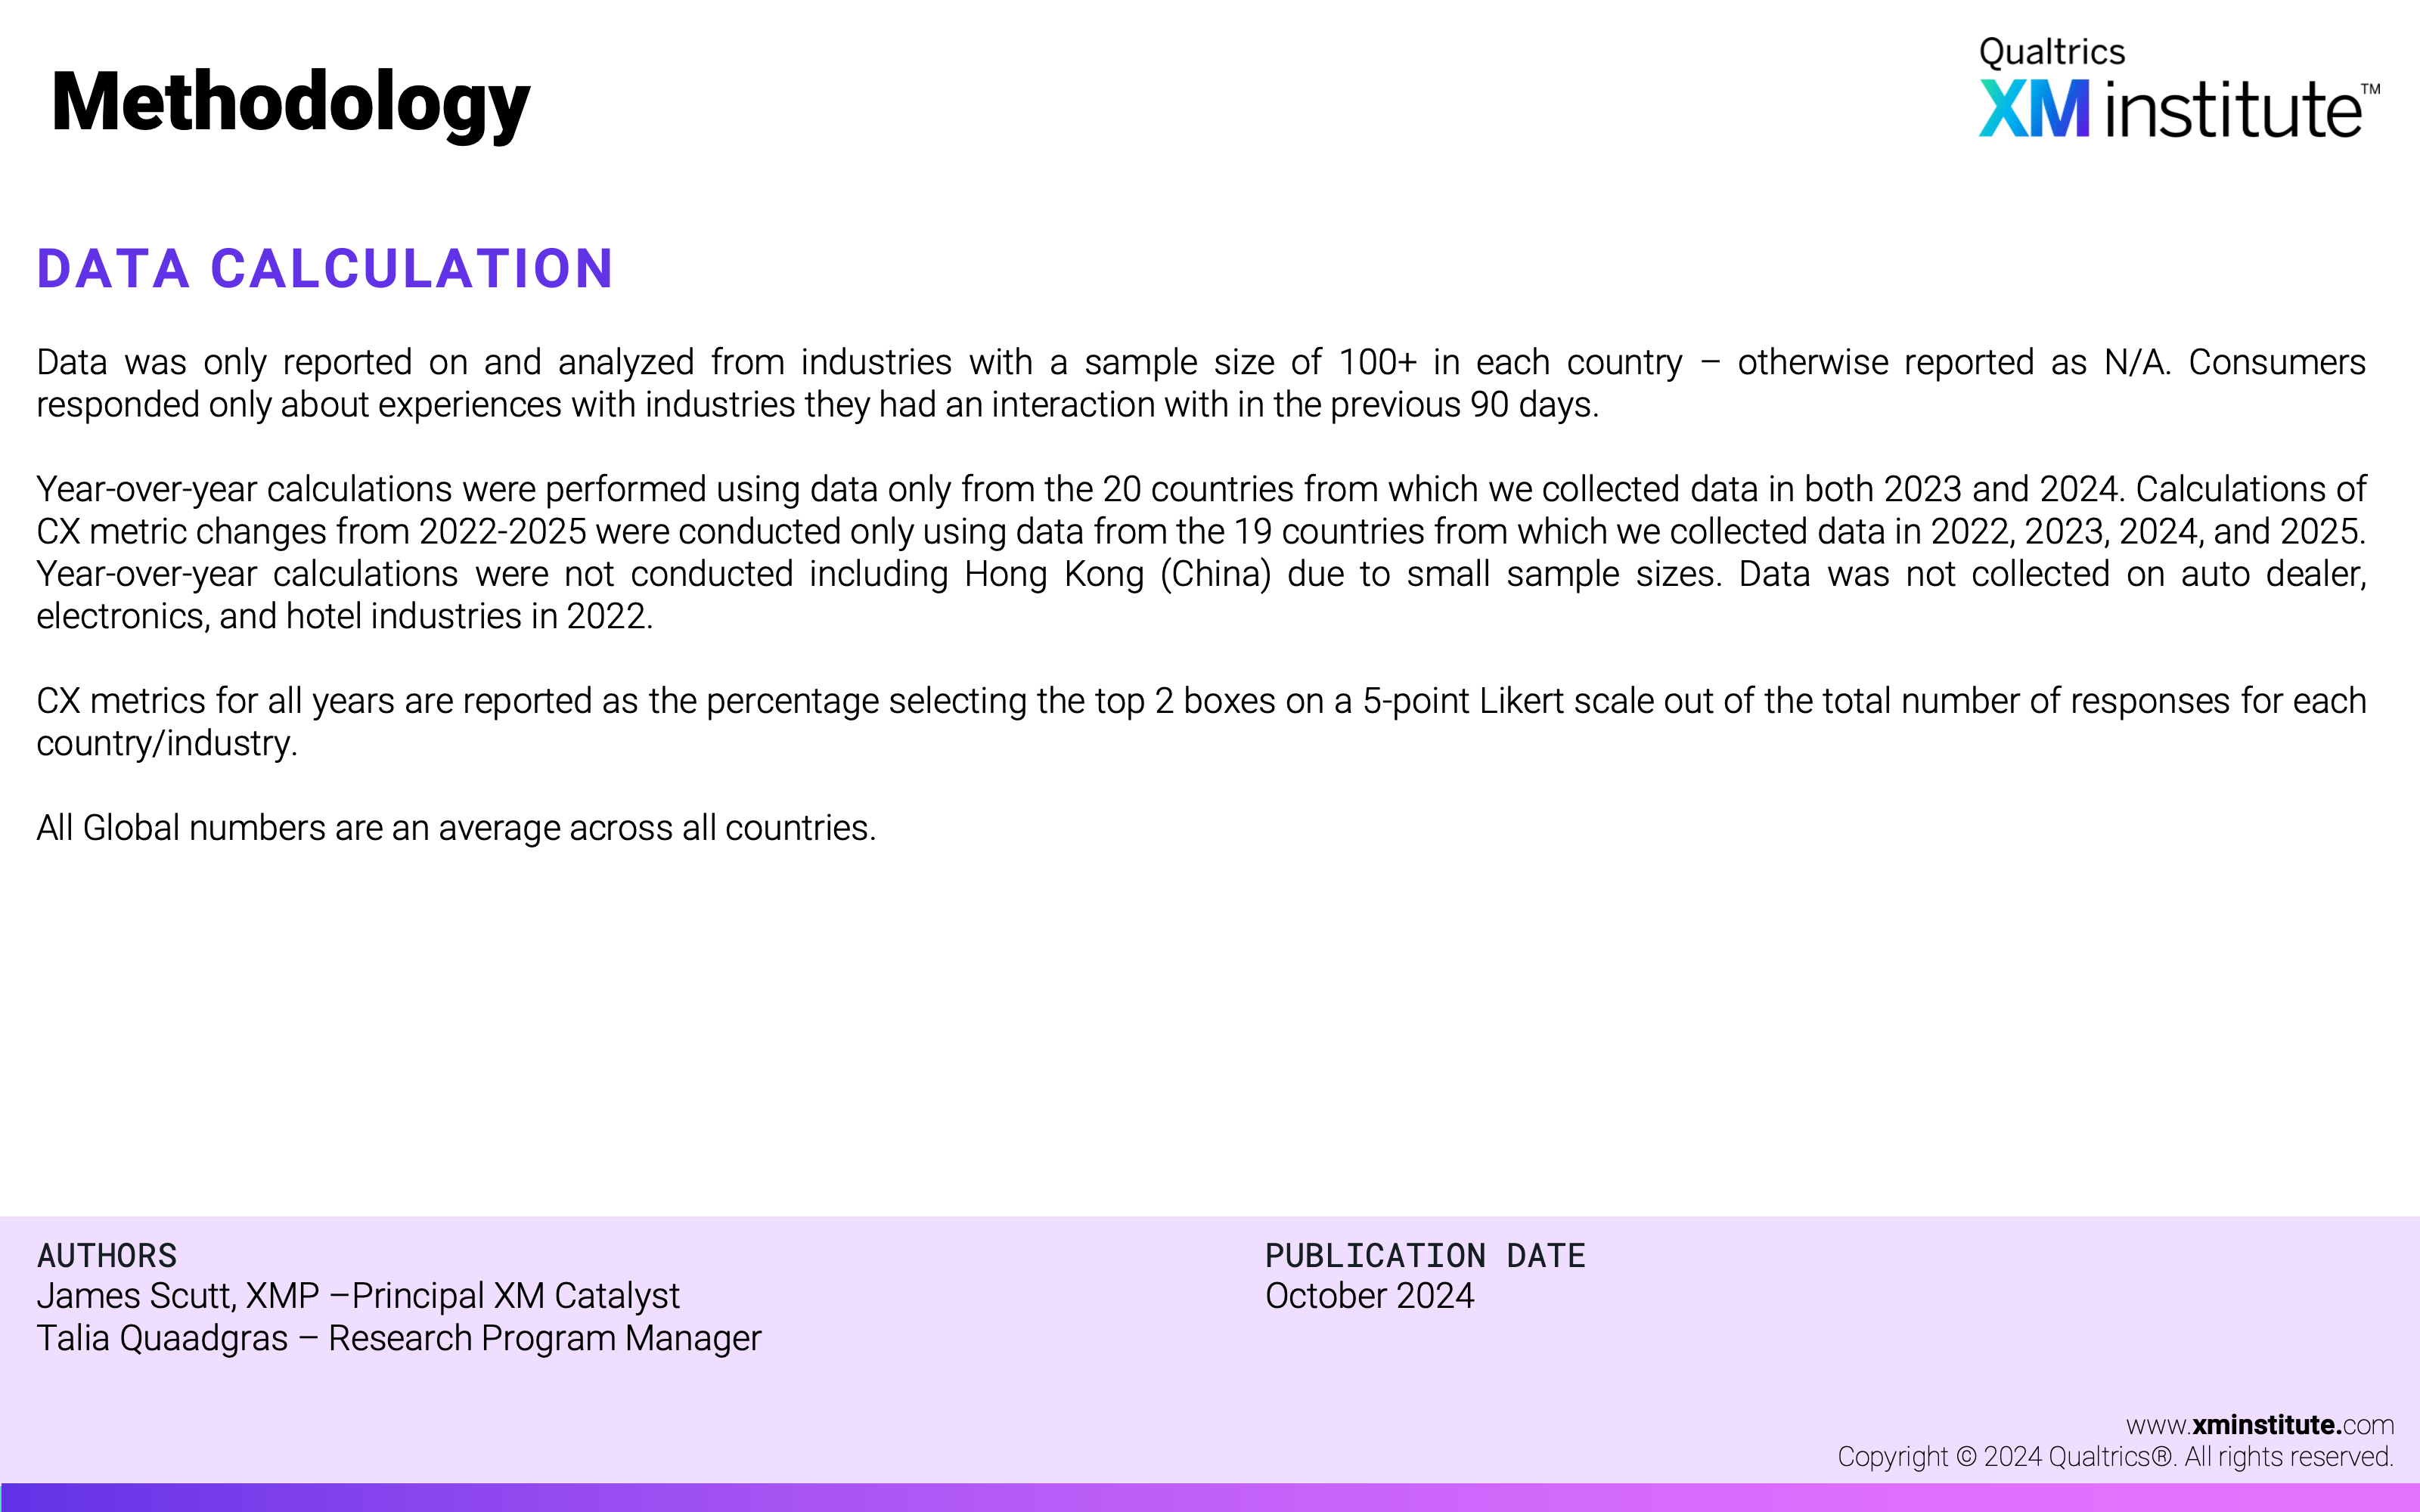
- Methodology (see Figure 17)


