Net Promoter Score (NPS) remains one of the most popular customer experience measurements, with over three-quarters (76%) of CX practitioners reportedly using it as a core metric in 20241. To provide CX practitioners with an up-to-date benchmark of NPS, we track the average NPS across more than 300 brands and 20 industries as part of our annual U.S. consumer study2. In this blog post, we share how NPS has changed over the past five years.
NPS is on the Rise
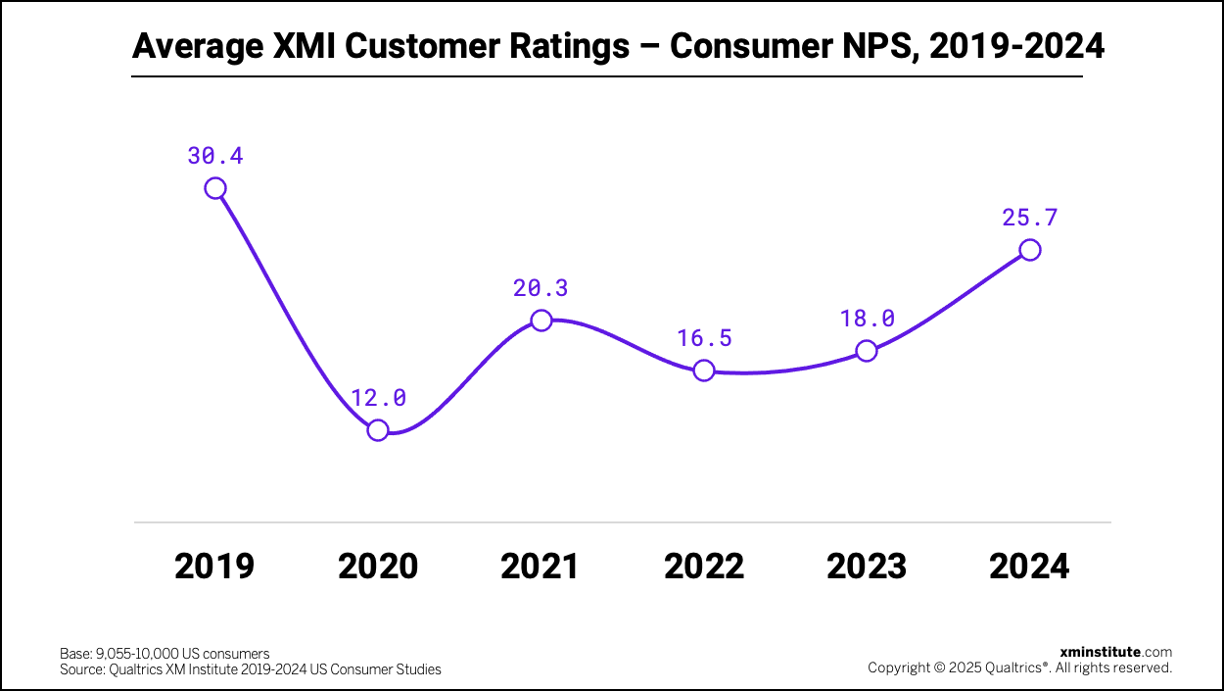
After three years of NPS middling out between the 30.4 high of pre-pandemic 2019 and the 12-point low of 2020, we said last year that we believed NPS was stabilizing at a “new normal”. The data chose to prove us wrong – NPS in 2024 more than doubled from its 2020 nadir to bounce back to 85% of its 2019 score, increasing 7.7 points in one year3.
Industries Haven’t Bounced Back Equally
As part of our an analysis, we also examined how 20 industries’ 2024 ratings compare to their performance in 2019. Their recovery has varied.
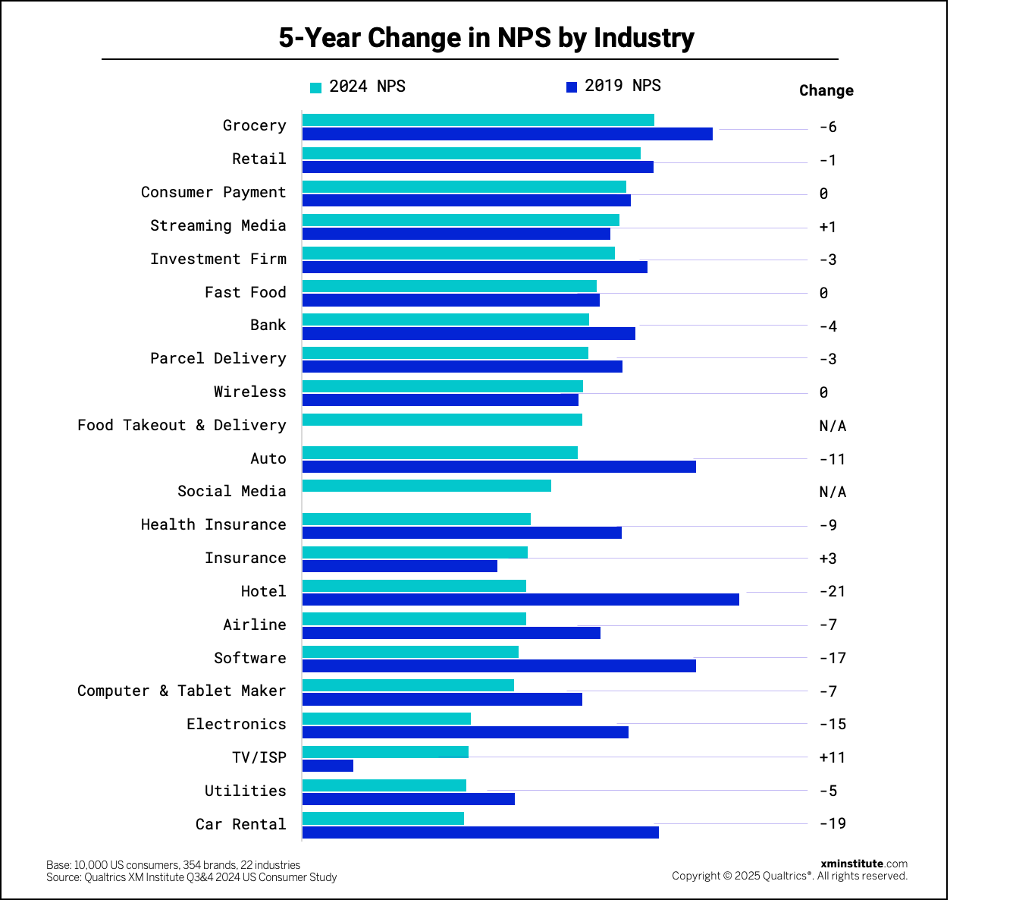
We also found that:
- Grocers earned the highest scores. As in 2023, grocers and retailers earned the two highest average NPS ratings, with scores of 34.3 and 33.0, respectively. Consumer payments follows closely behind, with an industry average rating of 31.5.
- NPS remains below 2019 levels for 14 of 20 industries. From 2019 to 2024, NPS declined for all industries except for the TV/ISP, insurance, streaming media, wireless, fast food, and consumer payment industries.
- NPS fell the most among hotels and car rental providers. When compared to their 2019 ratings, industry average NPS in 2024 has fallen the most for hotels (-21 pts) and car rental providers (-19 pts). Car rentals claim the lowest rank among 22 industries in 2024, with an NPS of 15.8, and have the worst overall recovery, reaching just 46% of their 2019 NPS in 2024.
- The TV/ISP industry enjoyed the biggest 5-year gains. The TV/internet service provider industry made the most significant NPS increase over the past five years, improving 11 points from 5.2 in 2019 to 16.2 in 2024. Despite this 321% increase from their 2019 industry average NPS, TV/ISP is in the third-lowest spot in the rankings. Average NPS only rose for two other industries over this period of time – insurance (+3 pts) and streaming media (+1 pt).
NPS is Higher Today Among Older Consumers
We also examined how NPS varies across different age groups and how scores compare to 2019 ratings.
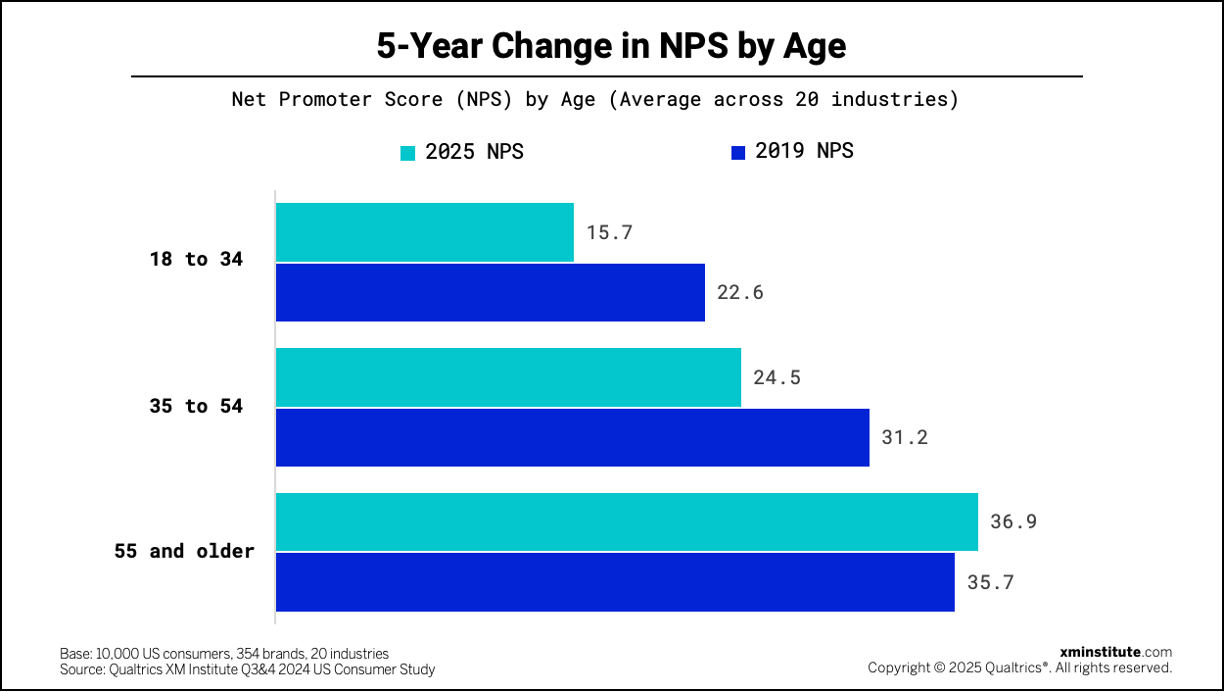
From our analysis, we found that:
- Young consumers give low scores. The average NPS for consumers between the ages of 18 and 34 provided an NPS of 15.7. Middle aged consumers (35 to 54) provide an NPS 8.8 points higher than this, while the oldest consumers give an NPS more than twice as high as the youngest consumers.
- NPS declined the most among young consumers. From 2019 to 2024, NPS given by consumers ages 18 to 34 fell the most. Their average rating in 2024 is 15.7, 6.9 points below their average rating of 22.6 in 2019.
- Older consumers’ NPS rose. Consumers over the age of 55 provide an NPS of 36.9 in 2024, 1.2 points higher than the score of 35.7 they provided in 2019. They are the only age group whose scores increased over this period of time.
Why Does My NPS Look So Different From These Ratings?
Each year, we get questions like: why is my NPS so different from XM Institute’s benchmark? And now that I’m measuring NPS, what do I do next? To answer the latter, check out our recommendations to help you propel your NPS program. On the former:
- Our benchmark is composed of consumer-facing industries. By the nature of our consumer-facing study, we are only able to measure customer relationships with B2C industries. If your customers are primarily businesses, or your customer base includes a mix of B2B and B2C customers, this may not be the best benchmark for you. Qualtrics customers can access a B2B NPS benchmark in the benchmark editor.
- This is a US benchmark. Consumers around the world answer the NPS very differently, so you may not want to set global goals based on a US-specific benchmark if you have a multinational customer base. Interpretations of the NPS question itself can vary culturally, and customers have different connotations for what’s good or bad on an 11-point scale. If NPS is your global metric, you’ll be better served by setting region-specific goals.
- Our research contains bias. While we make the best attempt to include as many brands as possible in our benchmark, we’re limited by the scale and reach of our study. We need a viable sample size to include brands in our benchmark, and therefore can only collect enough sample data on larger region- or nation-wide brands. A full list of brands included in our study is available to Qualtrics CX customers in the full report in the benchmark editor.
- NPS is a fickle measurement system. Our research shows that likelihood to recommend metrics may not be the best indicator of actual consumer behavior — whether they truly recommend your product or service to others. Other key performance indicators specific to your industry may provide additional insight to your organization’s customer experience program.
- You’re misusing NPS. Net Promoter Score is a measurement for assessing overarching attitudes or sentiment toward your organization. It should reflect the sum of a person’s interactions with your organization, and not be used to receive feedback after a single interaction or touchpoint. If you are using NPS as a transactional-level metric rather than a relationship tracking mechanism, your scores may differ.
The bottom line: NPS continues to evolve – make sure you’re in tune with your industry benchmarks.
Talia Quaadgras is a Research Program Manager with XM Institute
- The Ratings are calculated using the standard NPS® method. Net Promoter Score, Net Promoter, and NPS are registered trademarks of Bain & Company, Satmetrix, and Fred Reichheld.
- This year’s scores come from Qualtrics XM Institute’s Q3&4 2024 US Consumer study of 10,000 US consumers. To calculate the NPS for each industry, we asked 10,000 people to evaluate 354 companies across 22 industries. Respondents provided Net Promoter Scores for companies they had recently interacted with, and we averaged those individual company scores to produce an average rating for each industry. If you are a Qualtrics CX client and interested in methodology, additional benchmark metrics, or a list of companies included in this research, you can access the benchmark editor through Qualtrics.
- We added 2 industries to our cross-industry scoring in 2021, for a total of 20 industries in 2019-2020 and 22 industries in 2021-2024.