Understanding How NPS Relates to CX and Loyalty Behaviors
Many organizations use Net Promoter® Score (NPS®) as a key metric to understand the quality of the experience they deliver to customers. To understand how NPS relates to better customer experiences and stronger loyalty behaviors across different industries, XM Institute conducted a large-scale benchmark study. We asked a representative sample of 10,000 U.S. consumers to rate their recent interactions with 319 organizations across 20 industries. To develop this set of Data Snapshots, we:
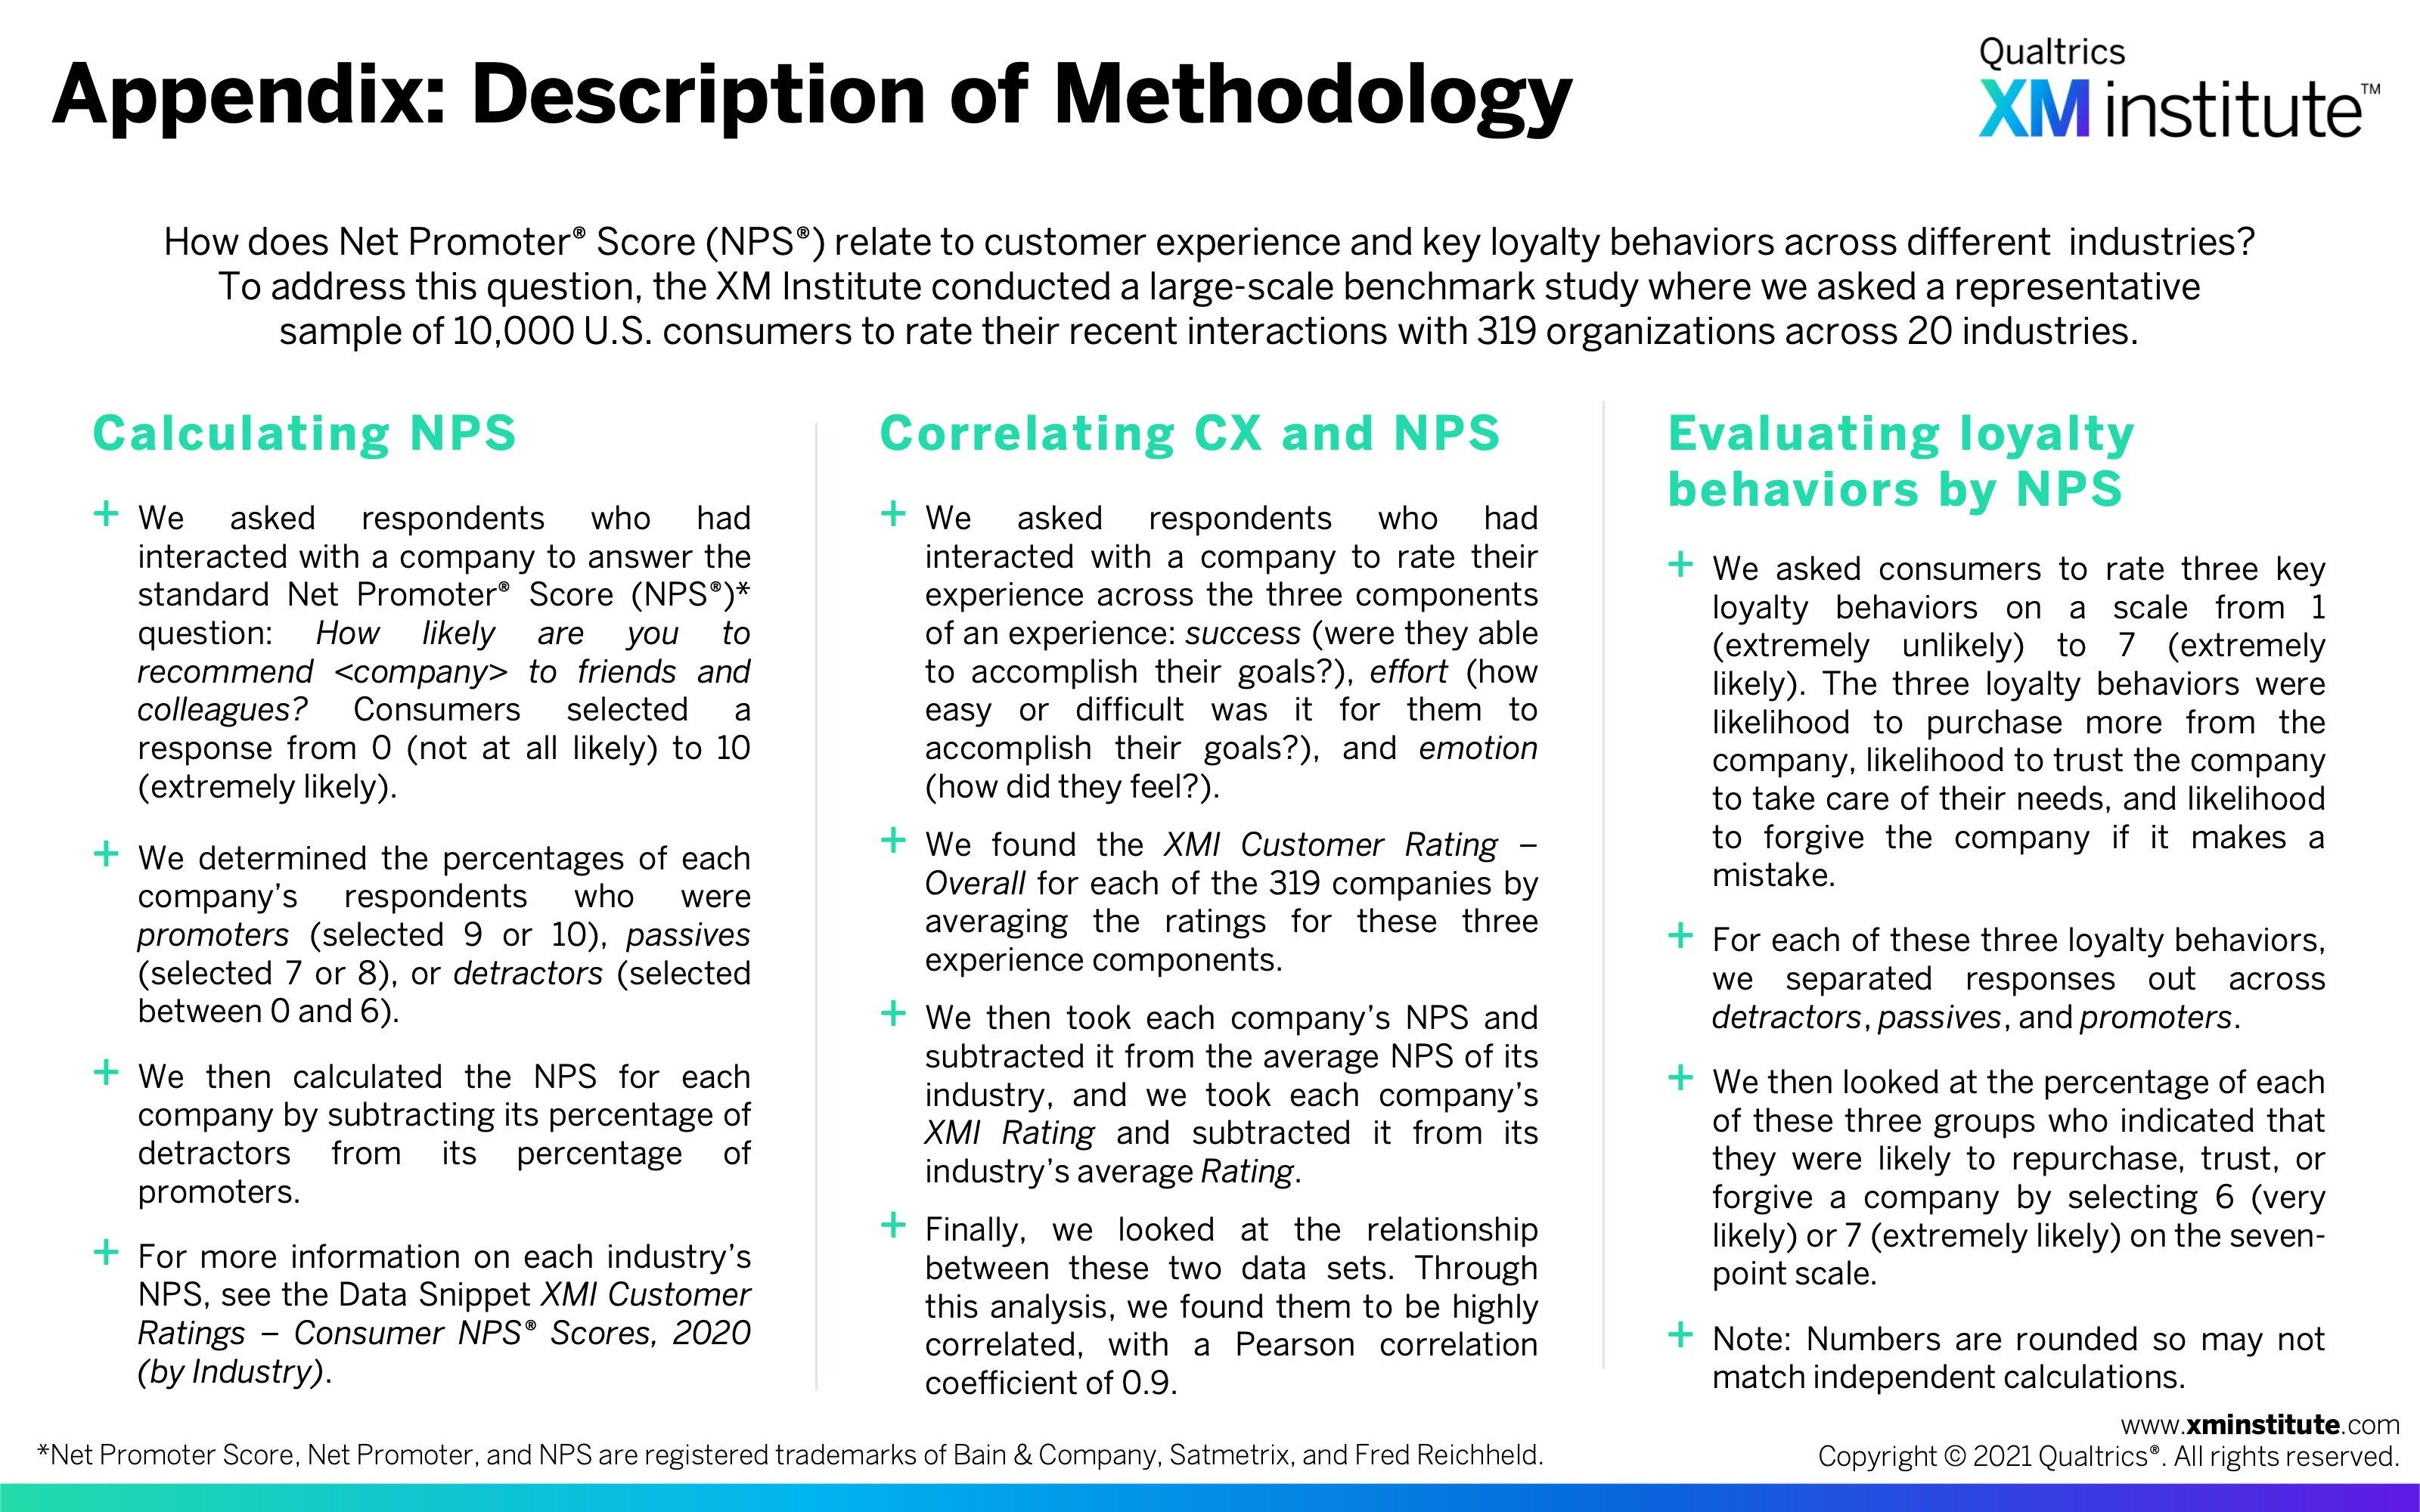
- Calculated each company’s and industry’s NPS. We asked respondents who had interacted with a company in the previous 90 days to answer the standard NPS® question: How likely are you to recommend to friends and colleagues? Consumers selected a response from 0 (not at all likely) to 10 (extremely likely). We then determined the percentages of each firm’s respondents who were promoters (selected 9 or 10), passives (selected 7 or 8), or detractors (selected between 0 and 6). We then calculated the NPS for each company by subtracting its percentage of detractors from its percentage of promoters. To determine each industry’s NPS, we averaged the NPS of all the companies within that industry.
- Generated XMI Customer Ratings – Overall for each company and industry. To assess the quality of each organization’s customer experience (CX), we used a composite metric called the “XMI Customer Rating – Overall.” We computed this metric by asking respondents to rate their interactions with a company they had recently engaged with across the three components of an experience: success (were they able to accomplish their goals?), effort (how easy or difficult was it for them to accomplish their goals?), and emotion (how did the interaction make them feel?). We then averaged each company’s scores on these three components to produce its XMI Customer Rating – Overall. To get each industry’s XMI Customer Rating, we averaged the Rating of all companies within that industry.
- Analyzed the relationship between NPS and CX. To understand the relationship between a customer’s experience and their likelihood of recommending an organization, we first took each individual company’s NPS and subtracted it from the average NPS of their industry, and we subtracted each individual company’s XMI Customer Rating from its industry’s average. We then looked at the relationship between these two data sets and found them to be highly correlated, with a Pearson correlation coefficient of 0.9.
- Evaluated the loyalty of promoters, passives, and detractors. We also asked customers how likely they are to demonstrate three key loyalty behaviors on a scale from 1 (extremely unlikely) to 7 (extremely likely). The three behaviors we assessed were likelihood to purchase more from the company, likelihood to trust a company to take care of their needs, and likelihood to forgive a company if it makes a mistake. We then broke their responses out by whether their NPS score indicated they were detractors, passives, or promoters for that company and looked at the percentage of each group who indicated that they were likely to repurchase, trust, or forgive a company by selecting 6 (very likely) or 7 (extremely likely) on the seven-point scale.
Key Findings Across Industries
We examined how NPS varies by industry and how loyalty behaviors differ between promoters and detractors across all 20 industries. Our analysis shows that:
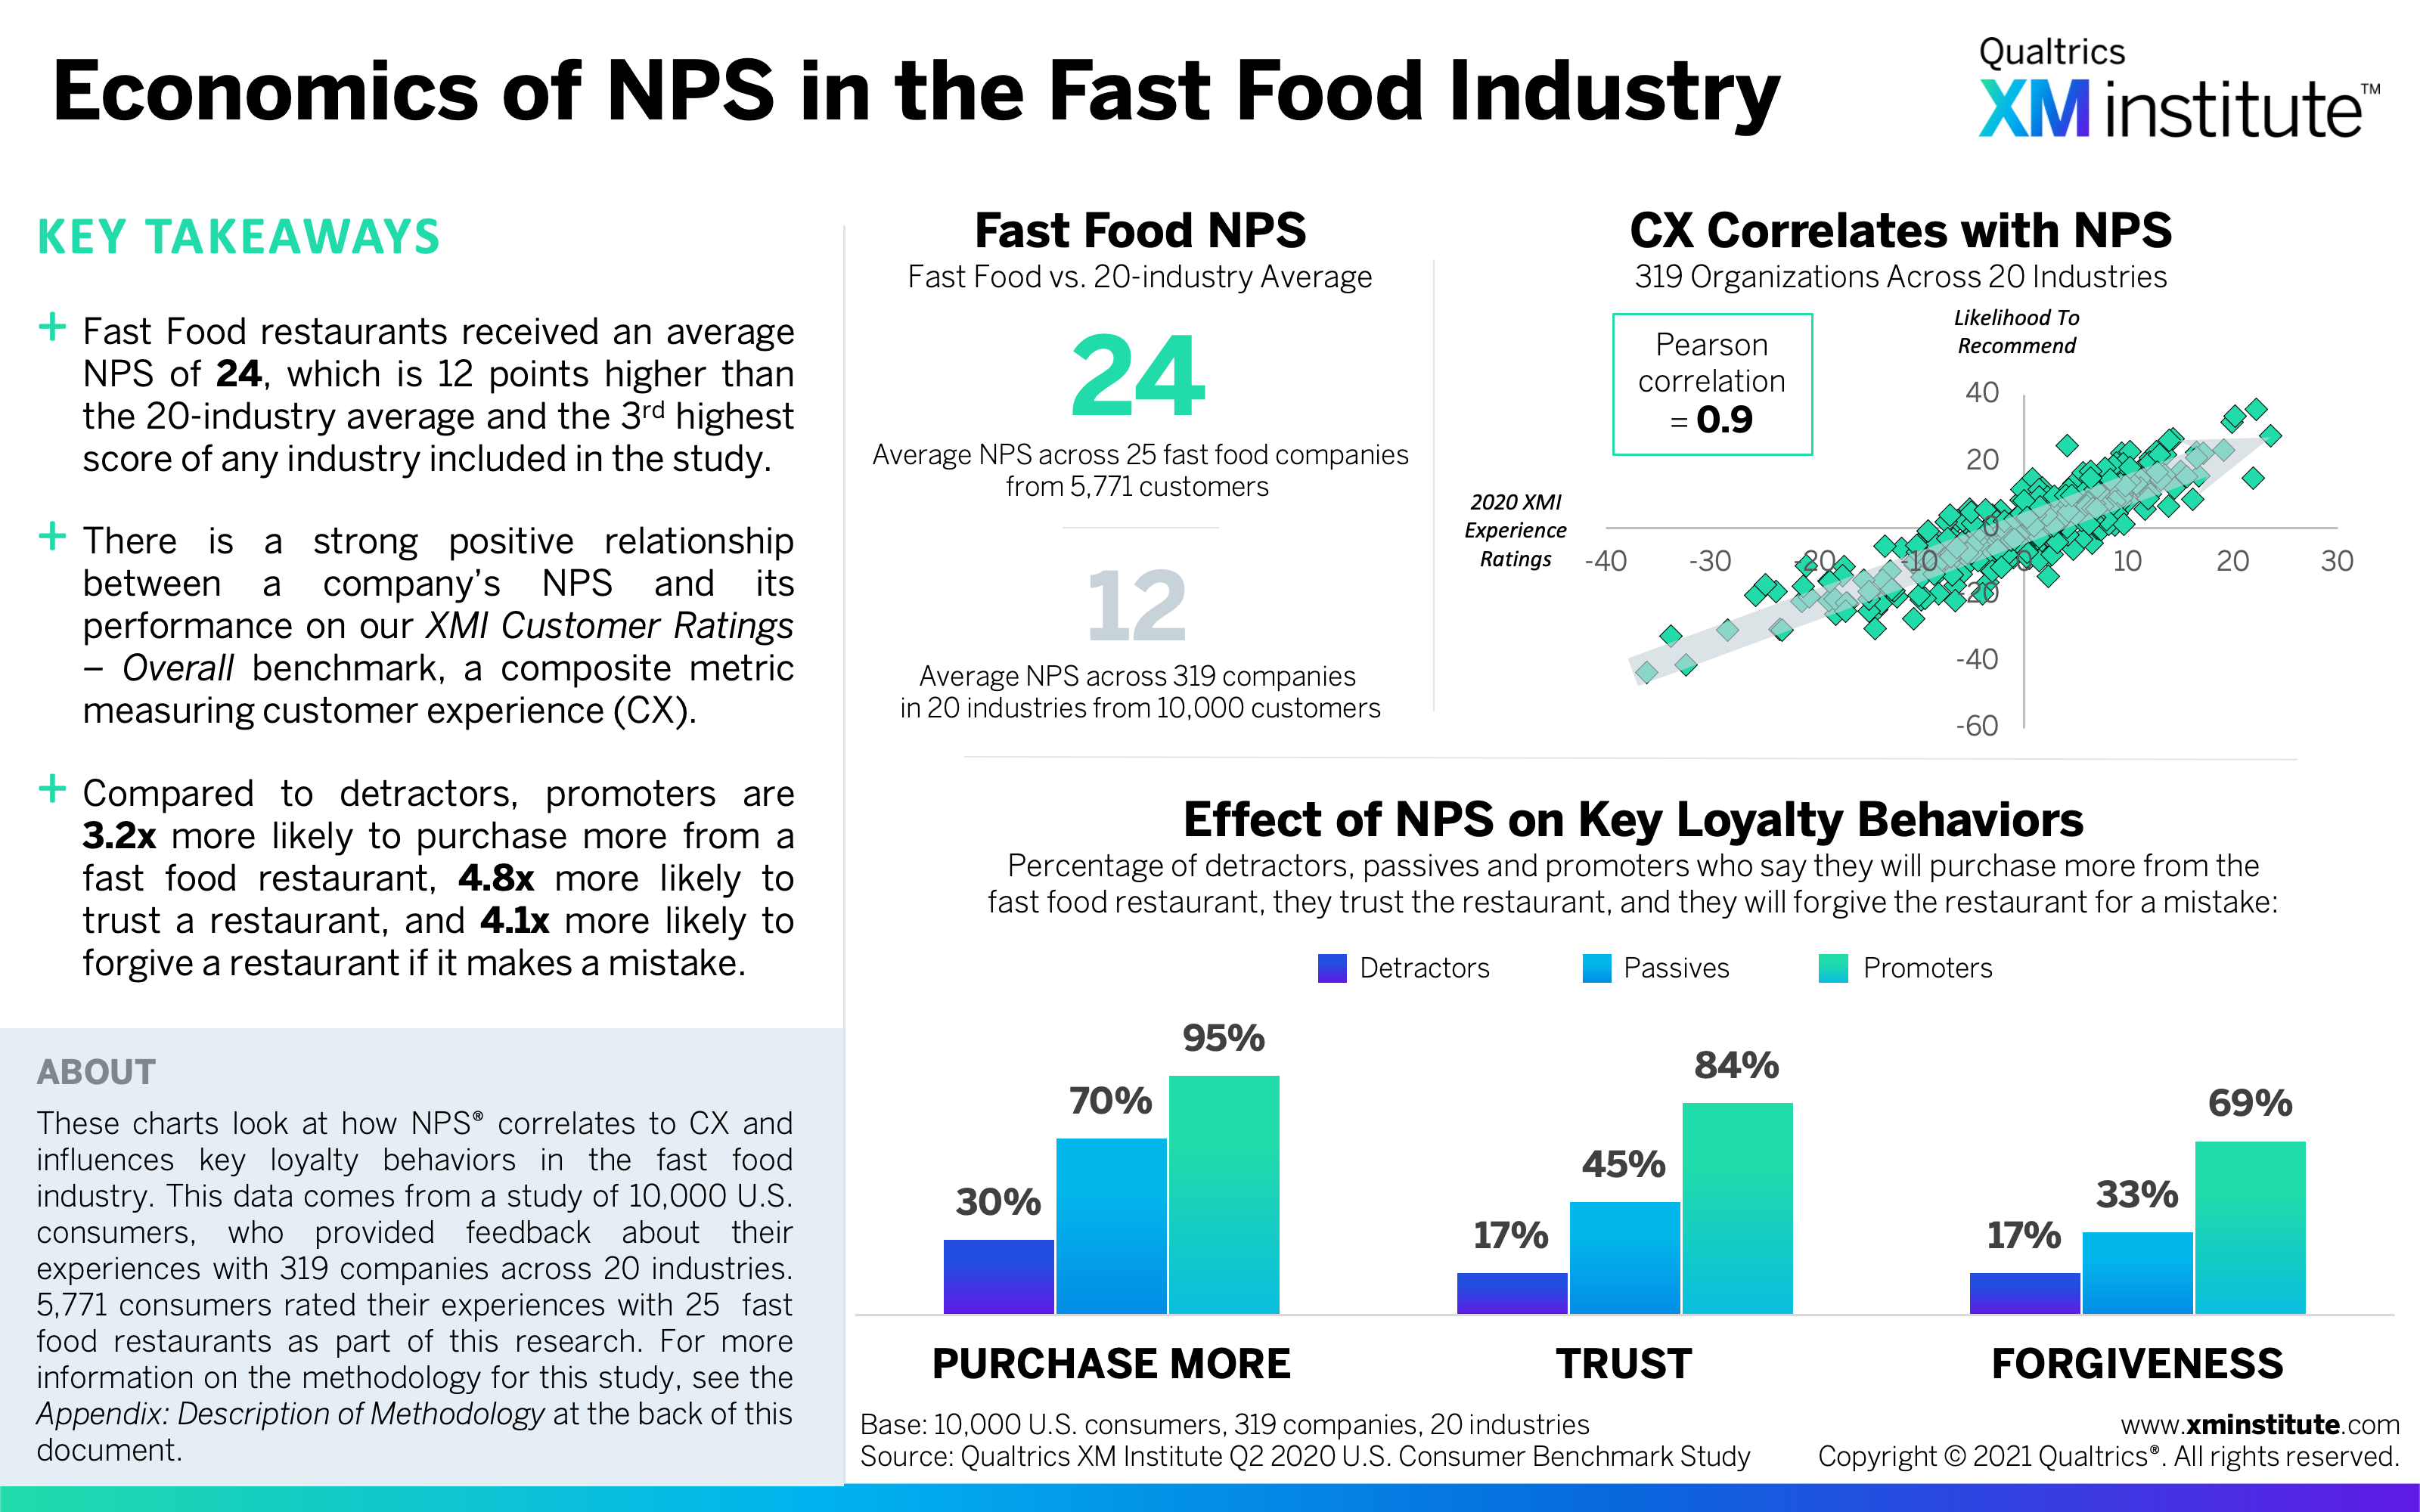
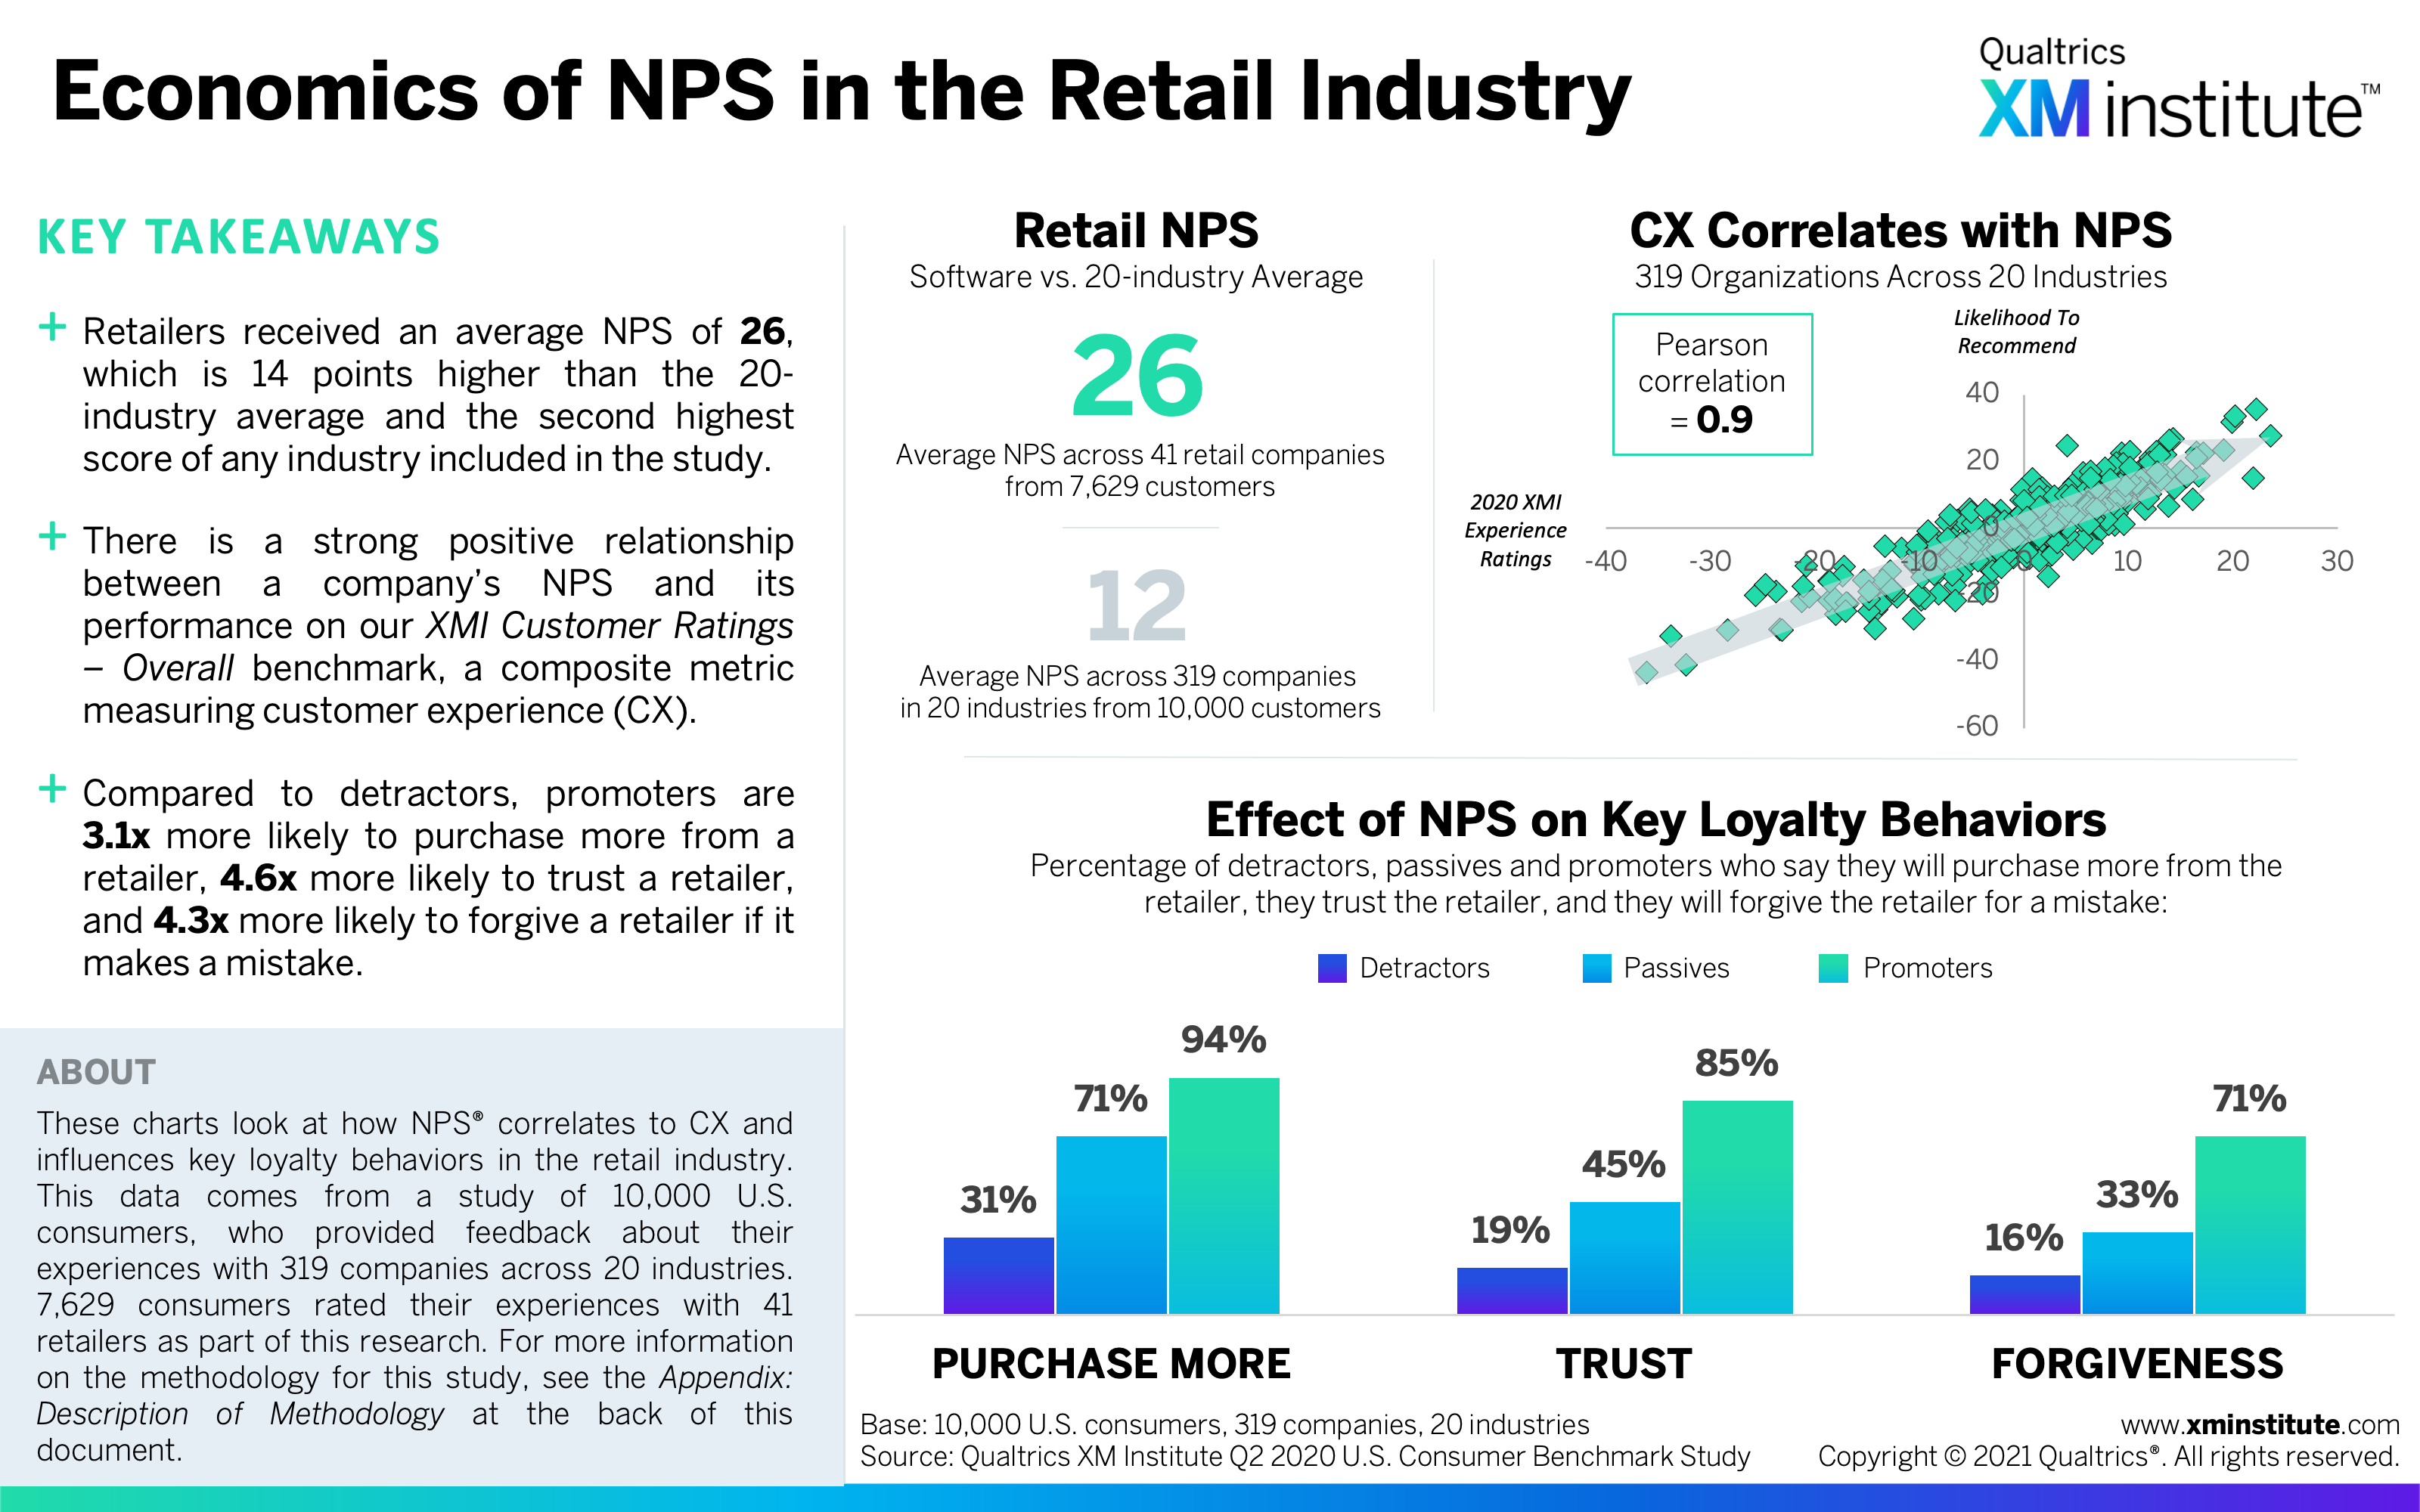
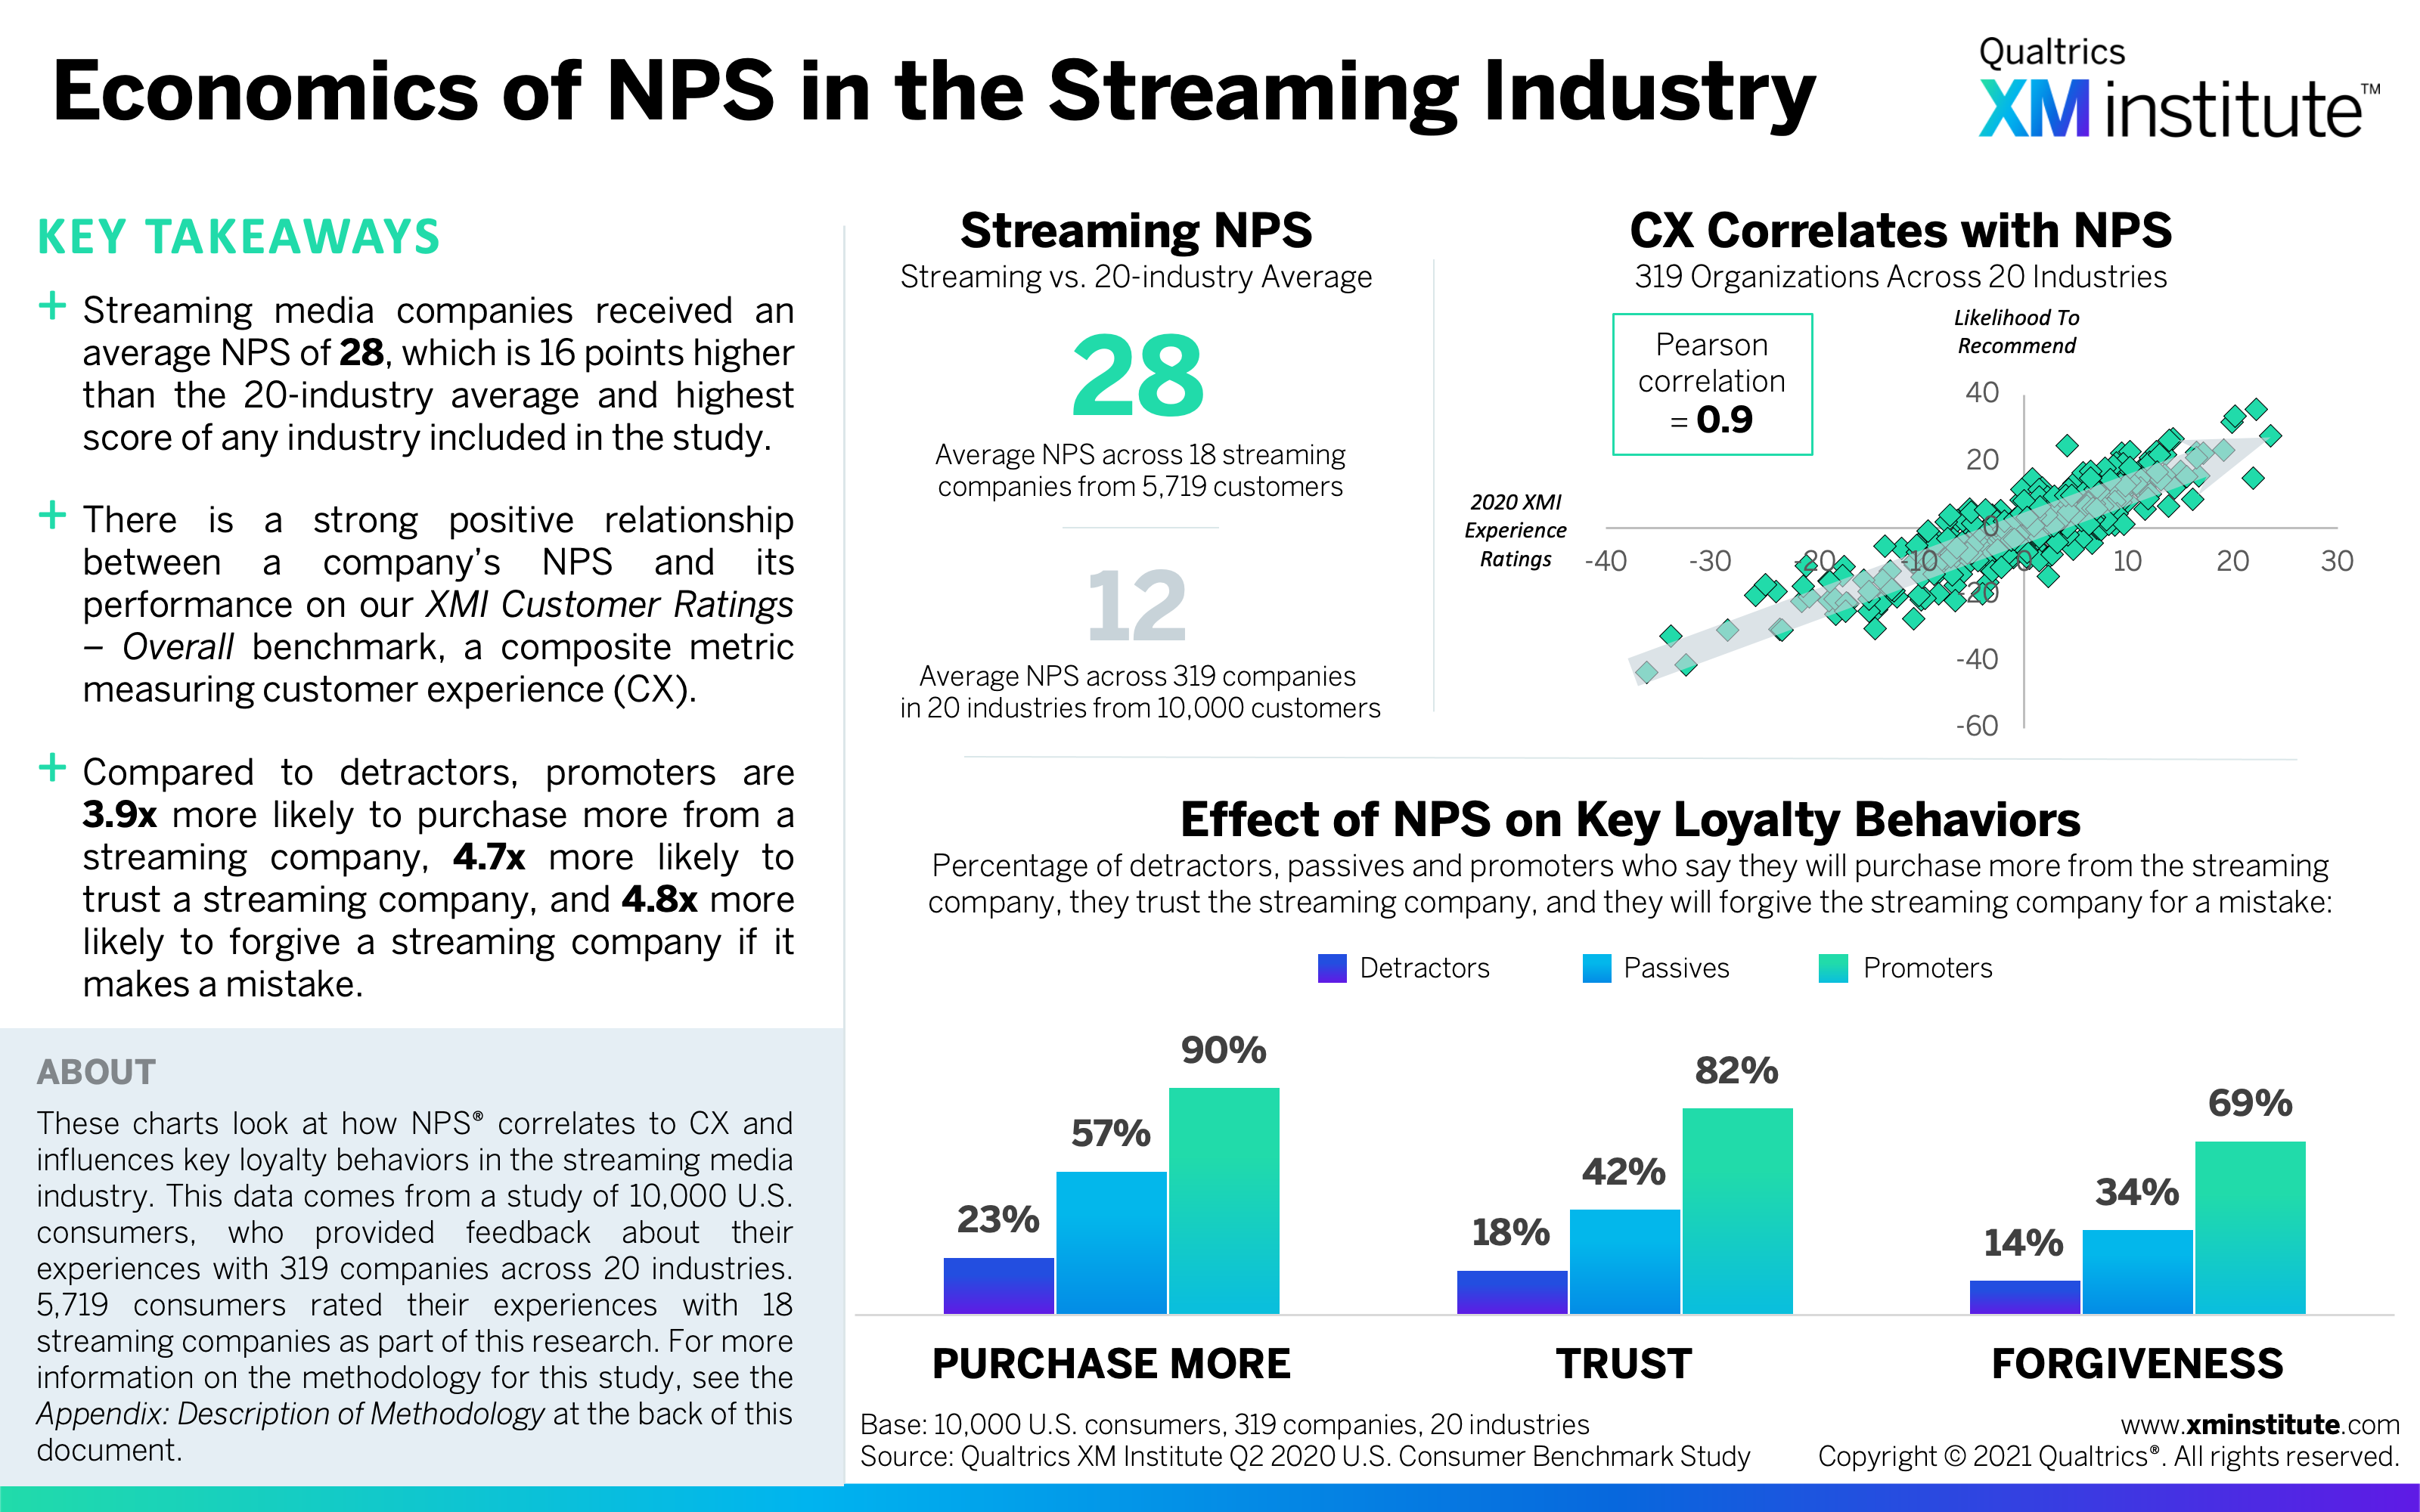
- Streaming media earned the highest industry NPS. The industry average NPS for streaming media companies is 28, the highest of any industry. Retail and fast food come in second and third, with scores of 26 and 25 respectively. At the other end of the spectrum, consumer payments, airlines, and car rentals all have negative industry averages.
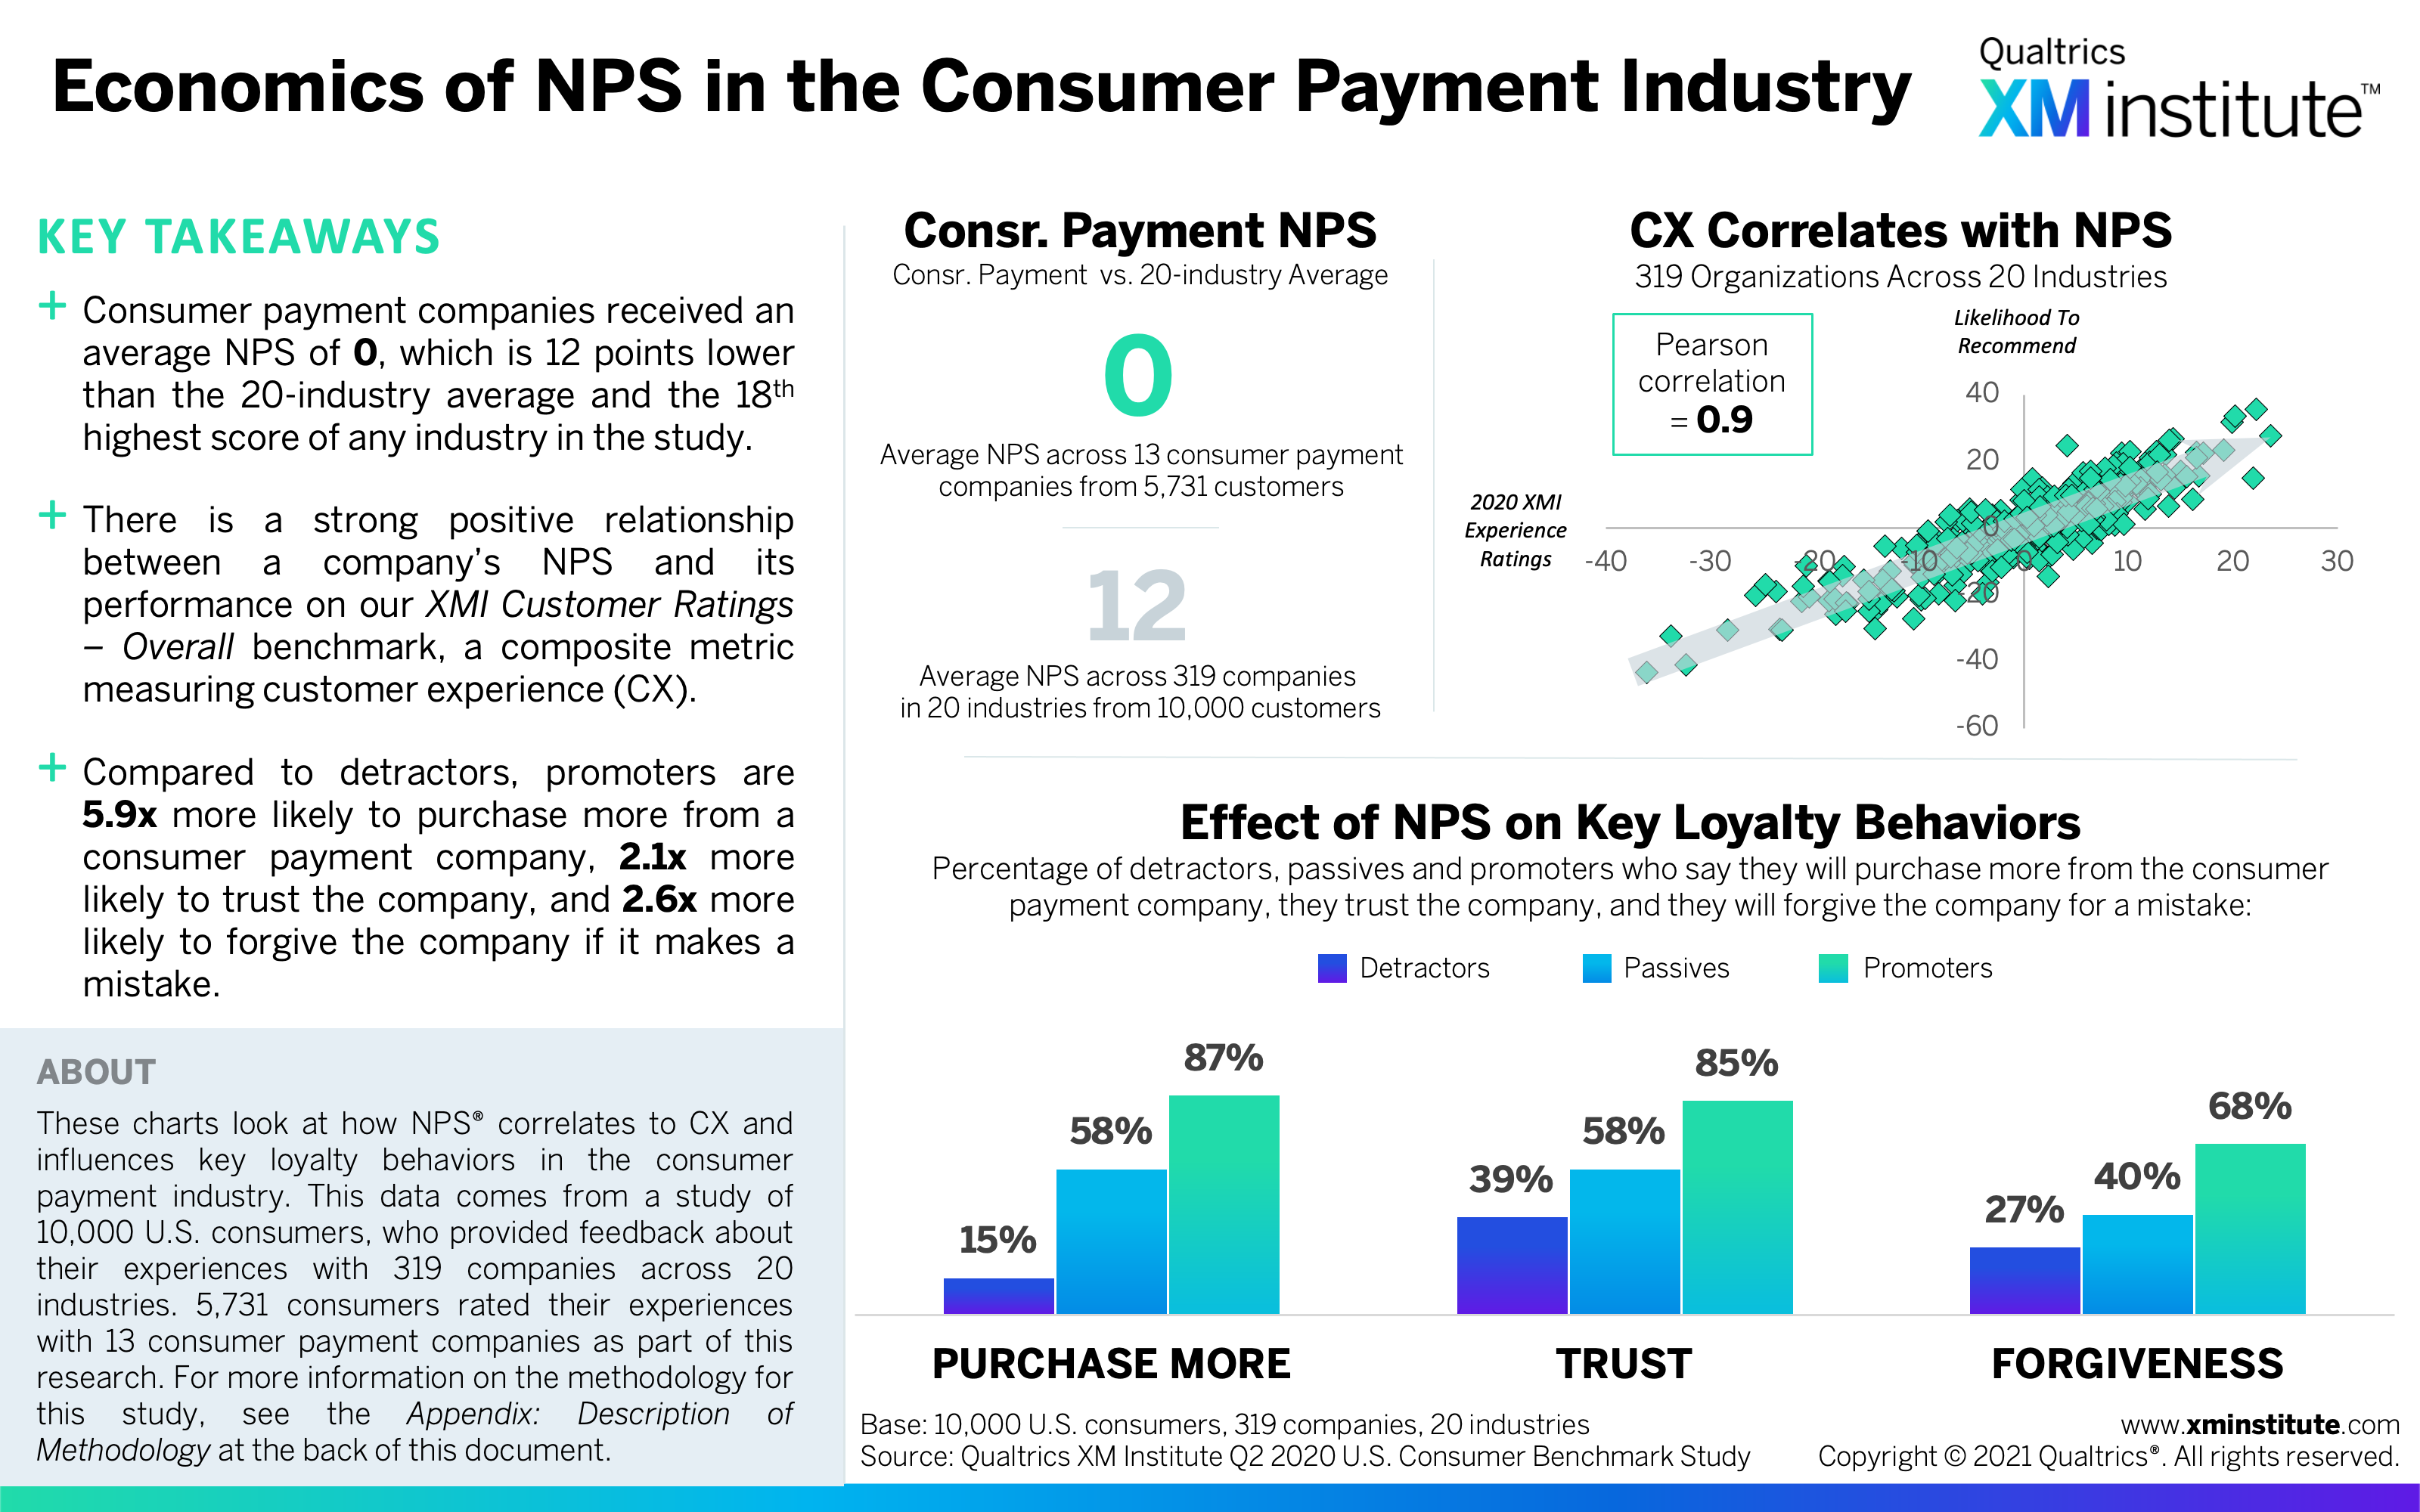
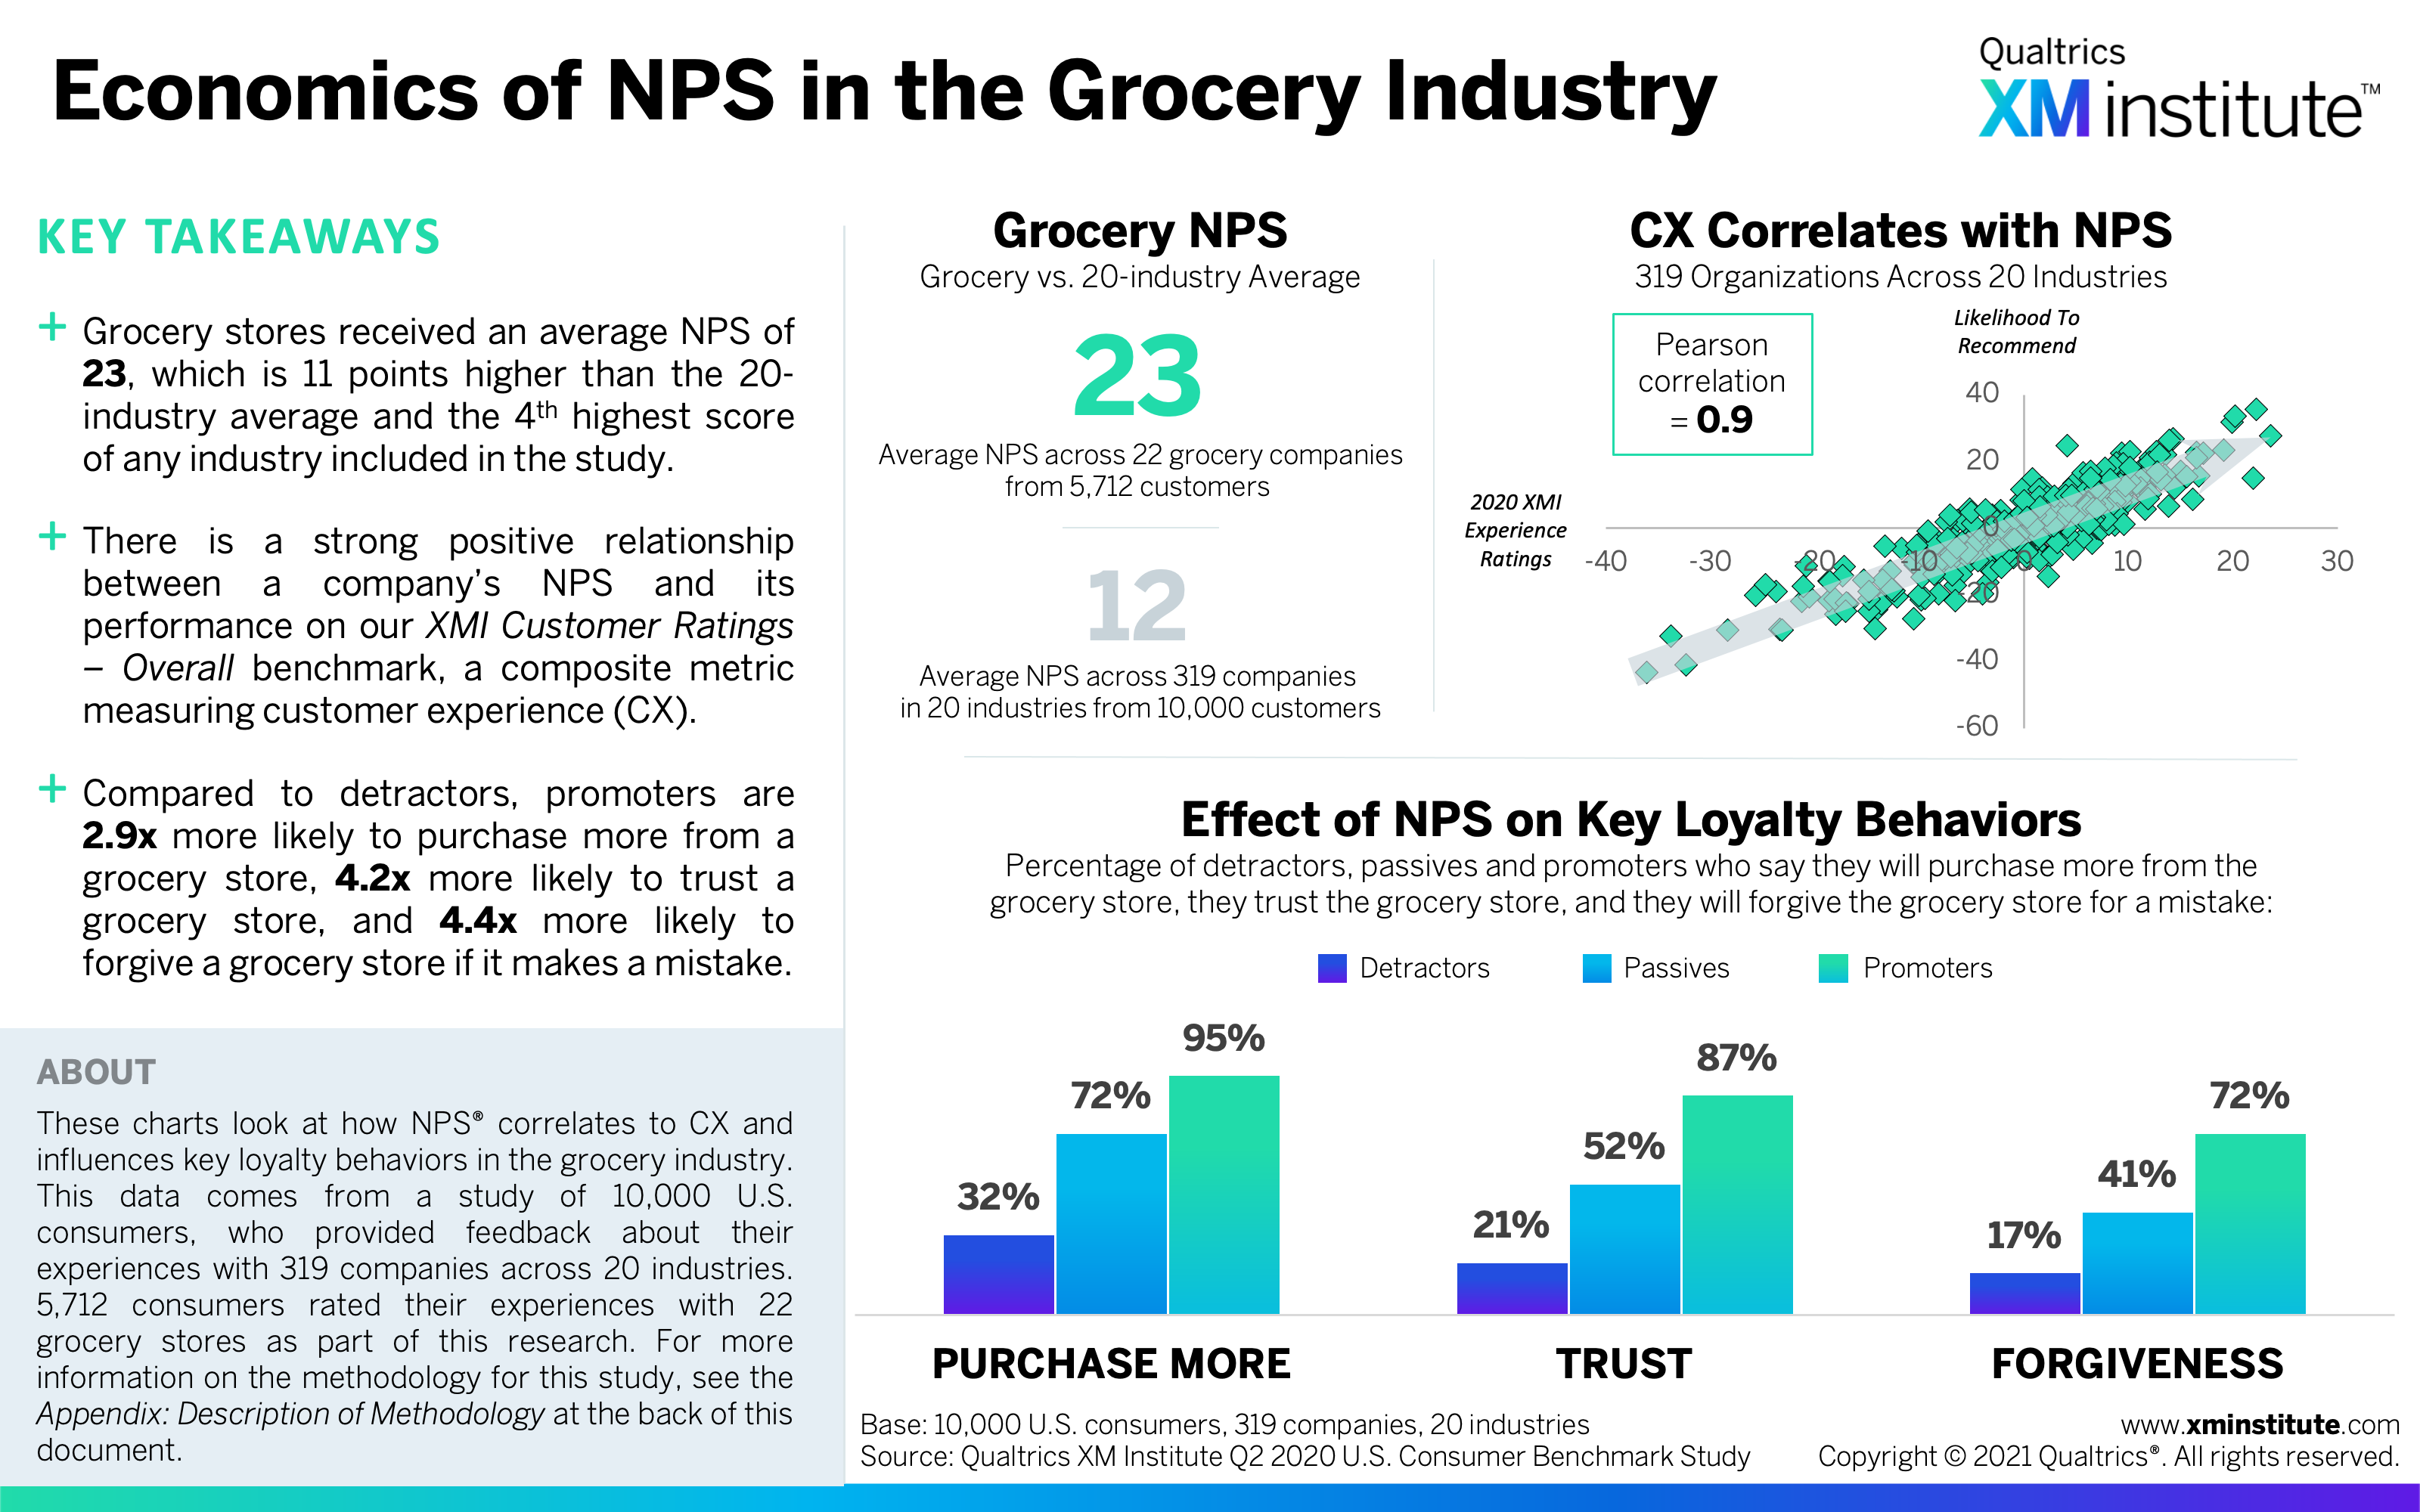
- Consumer payments have the largest repurchase differential. Compared to detractors, promoters in the consumer payments industry are almost six times more likely to say that they will repurchase from the company. This is the largest gap between promoters and detractors in any industry we looked at and shows that consumer payments companies who can increase their NPS will particularly benefit from repeat customers. While promoters are significantly more valuable than detractors in any industry, the gap is smallest for grocery, where they are less than three times more likely to purchase more.
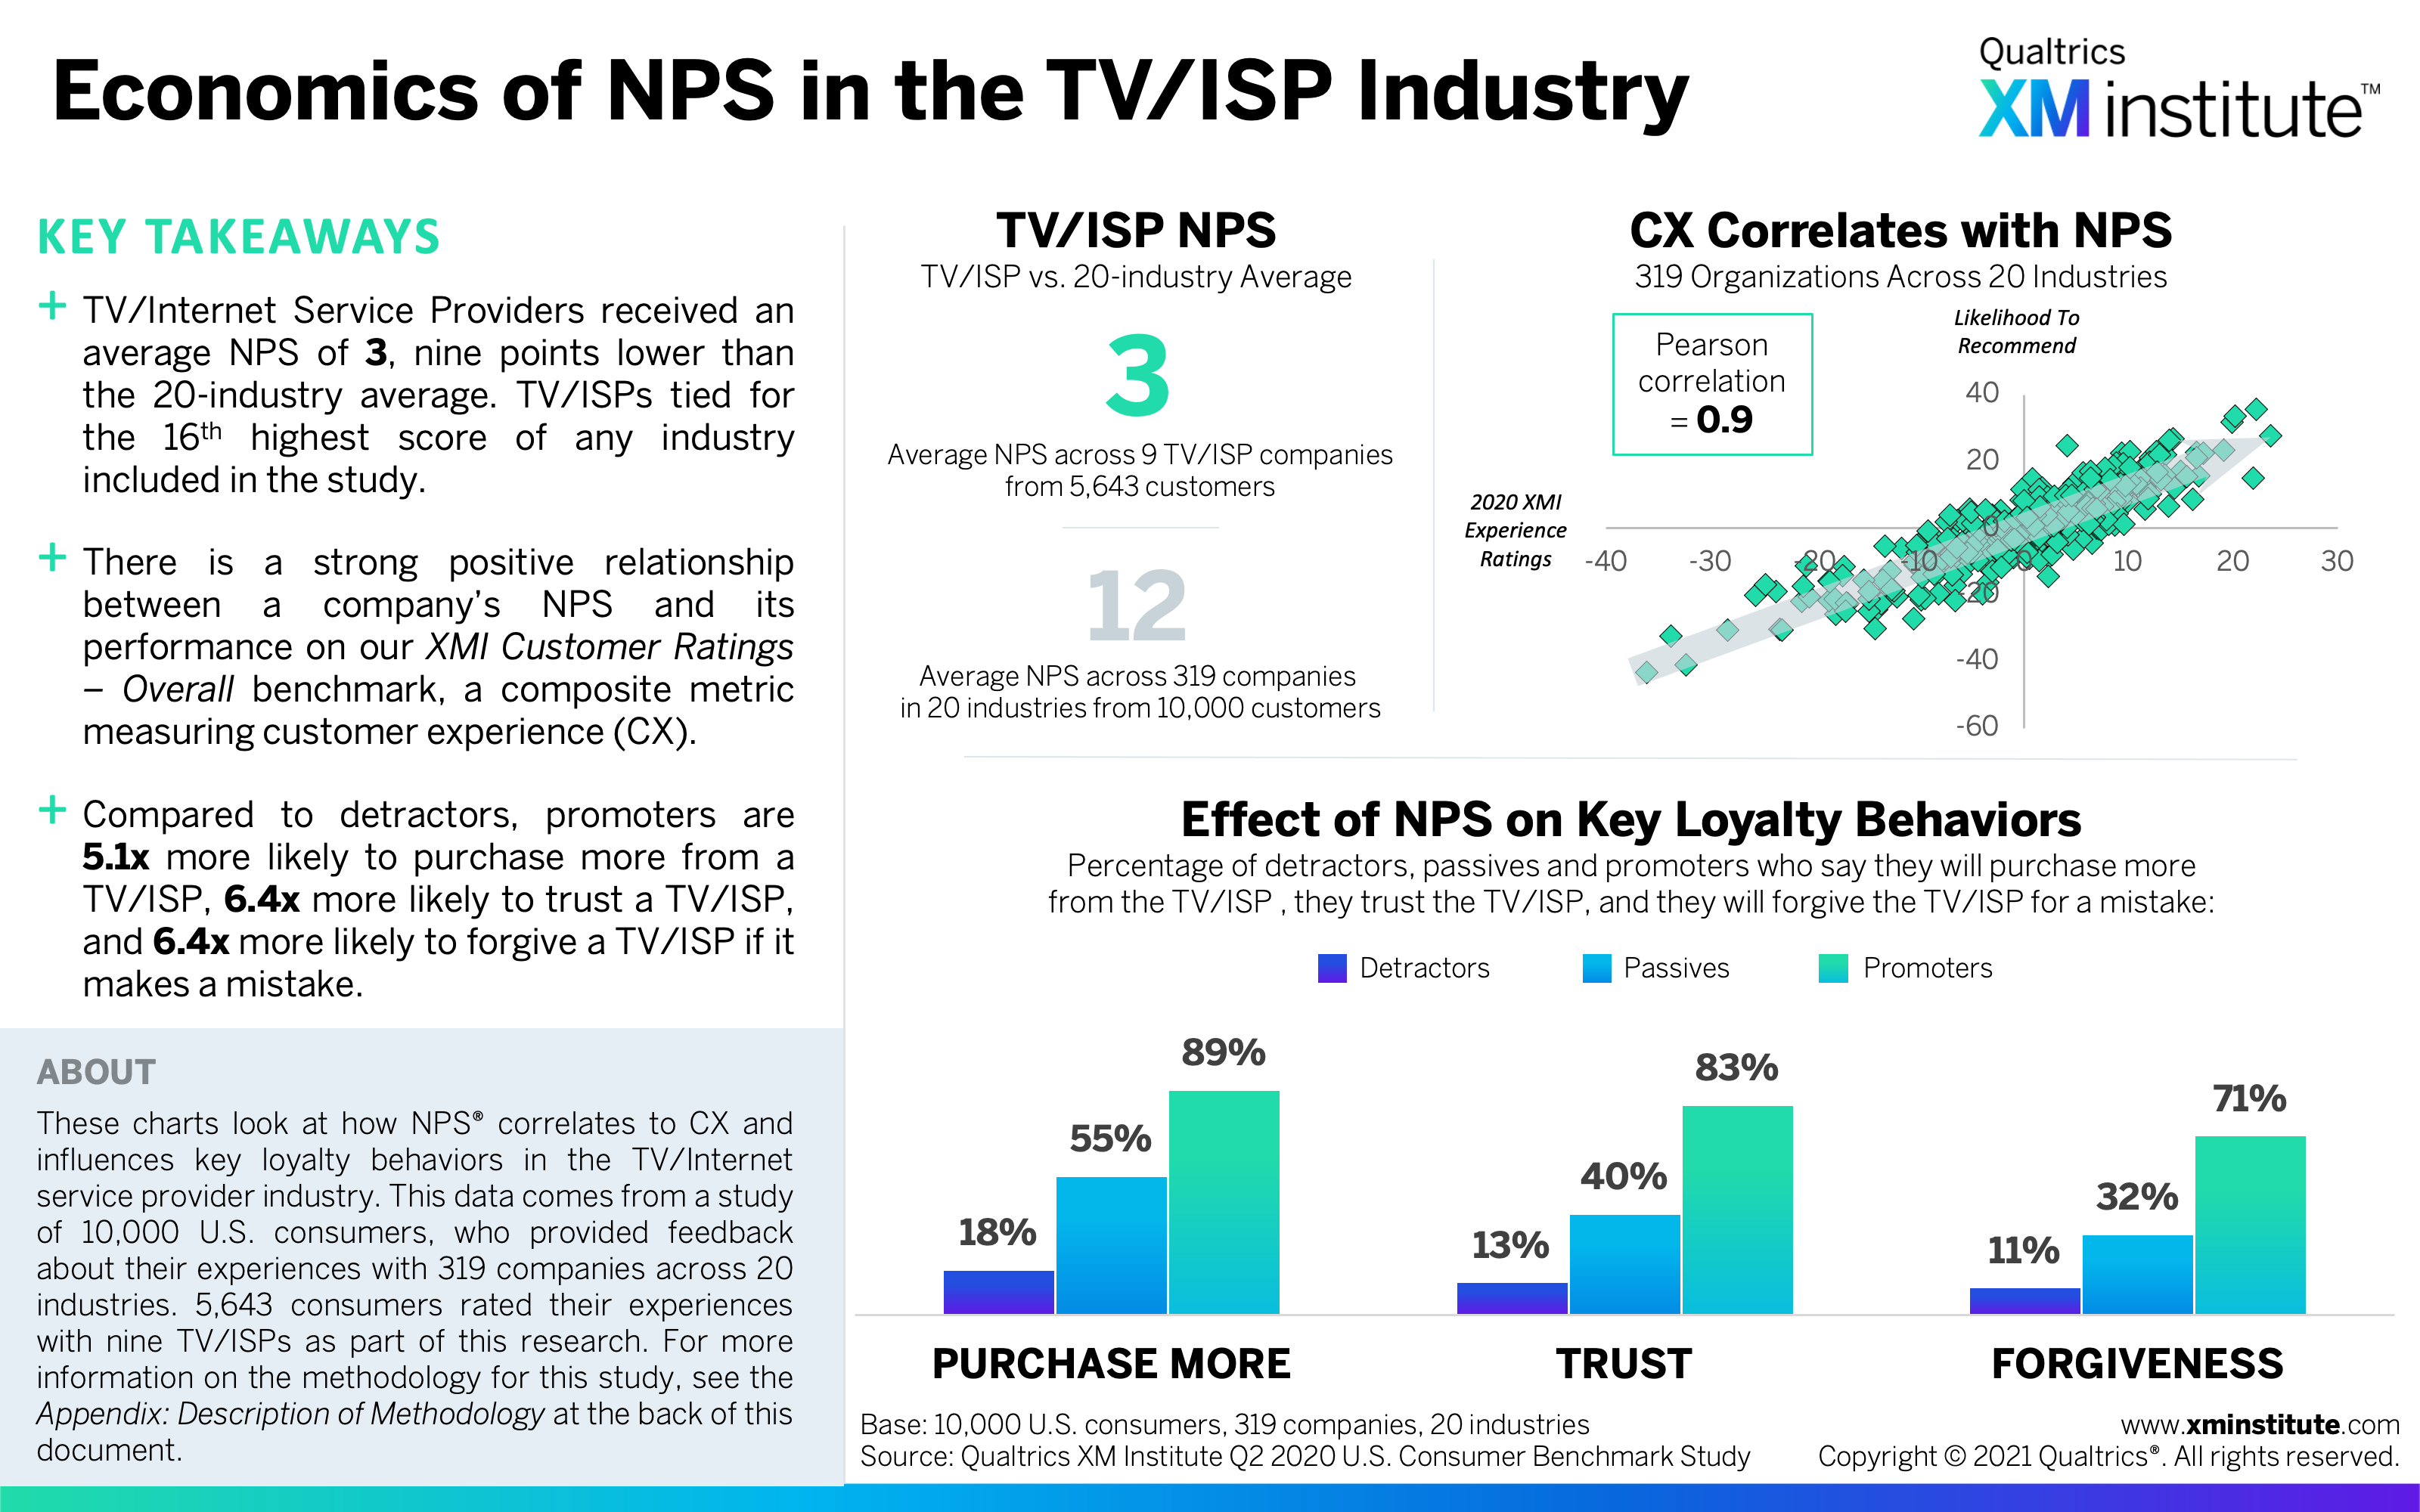
- TV/Internet Service Providers have the largest trust differential. We also analyzed how likely promoters are to trust a company to take care of their needs versus how likely detractors are to trust a company to do the same. We found the biggest difference between these two groups in the TV/Internet Service Provider (ISP) industry – with a gap of 70 percentage-points – and the smallest difference between these two groups in consumer payments, which only had a gap of 46 percentage-points.
- TV/Internet Service Providers have the largest forgiveness differential. When we looked at how likely promoters are to say they will forgive the company if it makes a mistake compared to detractors, we found that promoters in the TV/ISP industry were more than six times more likely to say that they’ll forgive the company, with a difference between these two groups of 60 percentage-points. Meanwhile, this gap is smallest for consumer payments companies, where promoters are less than three times more likely to forgive the company compared to detractors.
Figures
Here are the figures in this Data Snapshot:
-
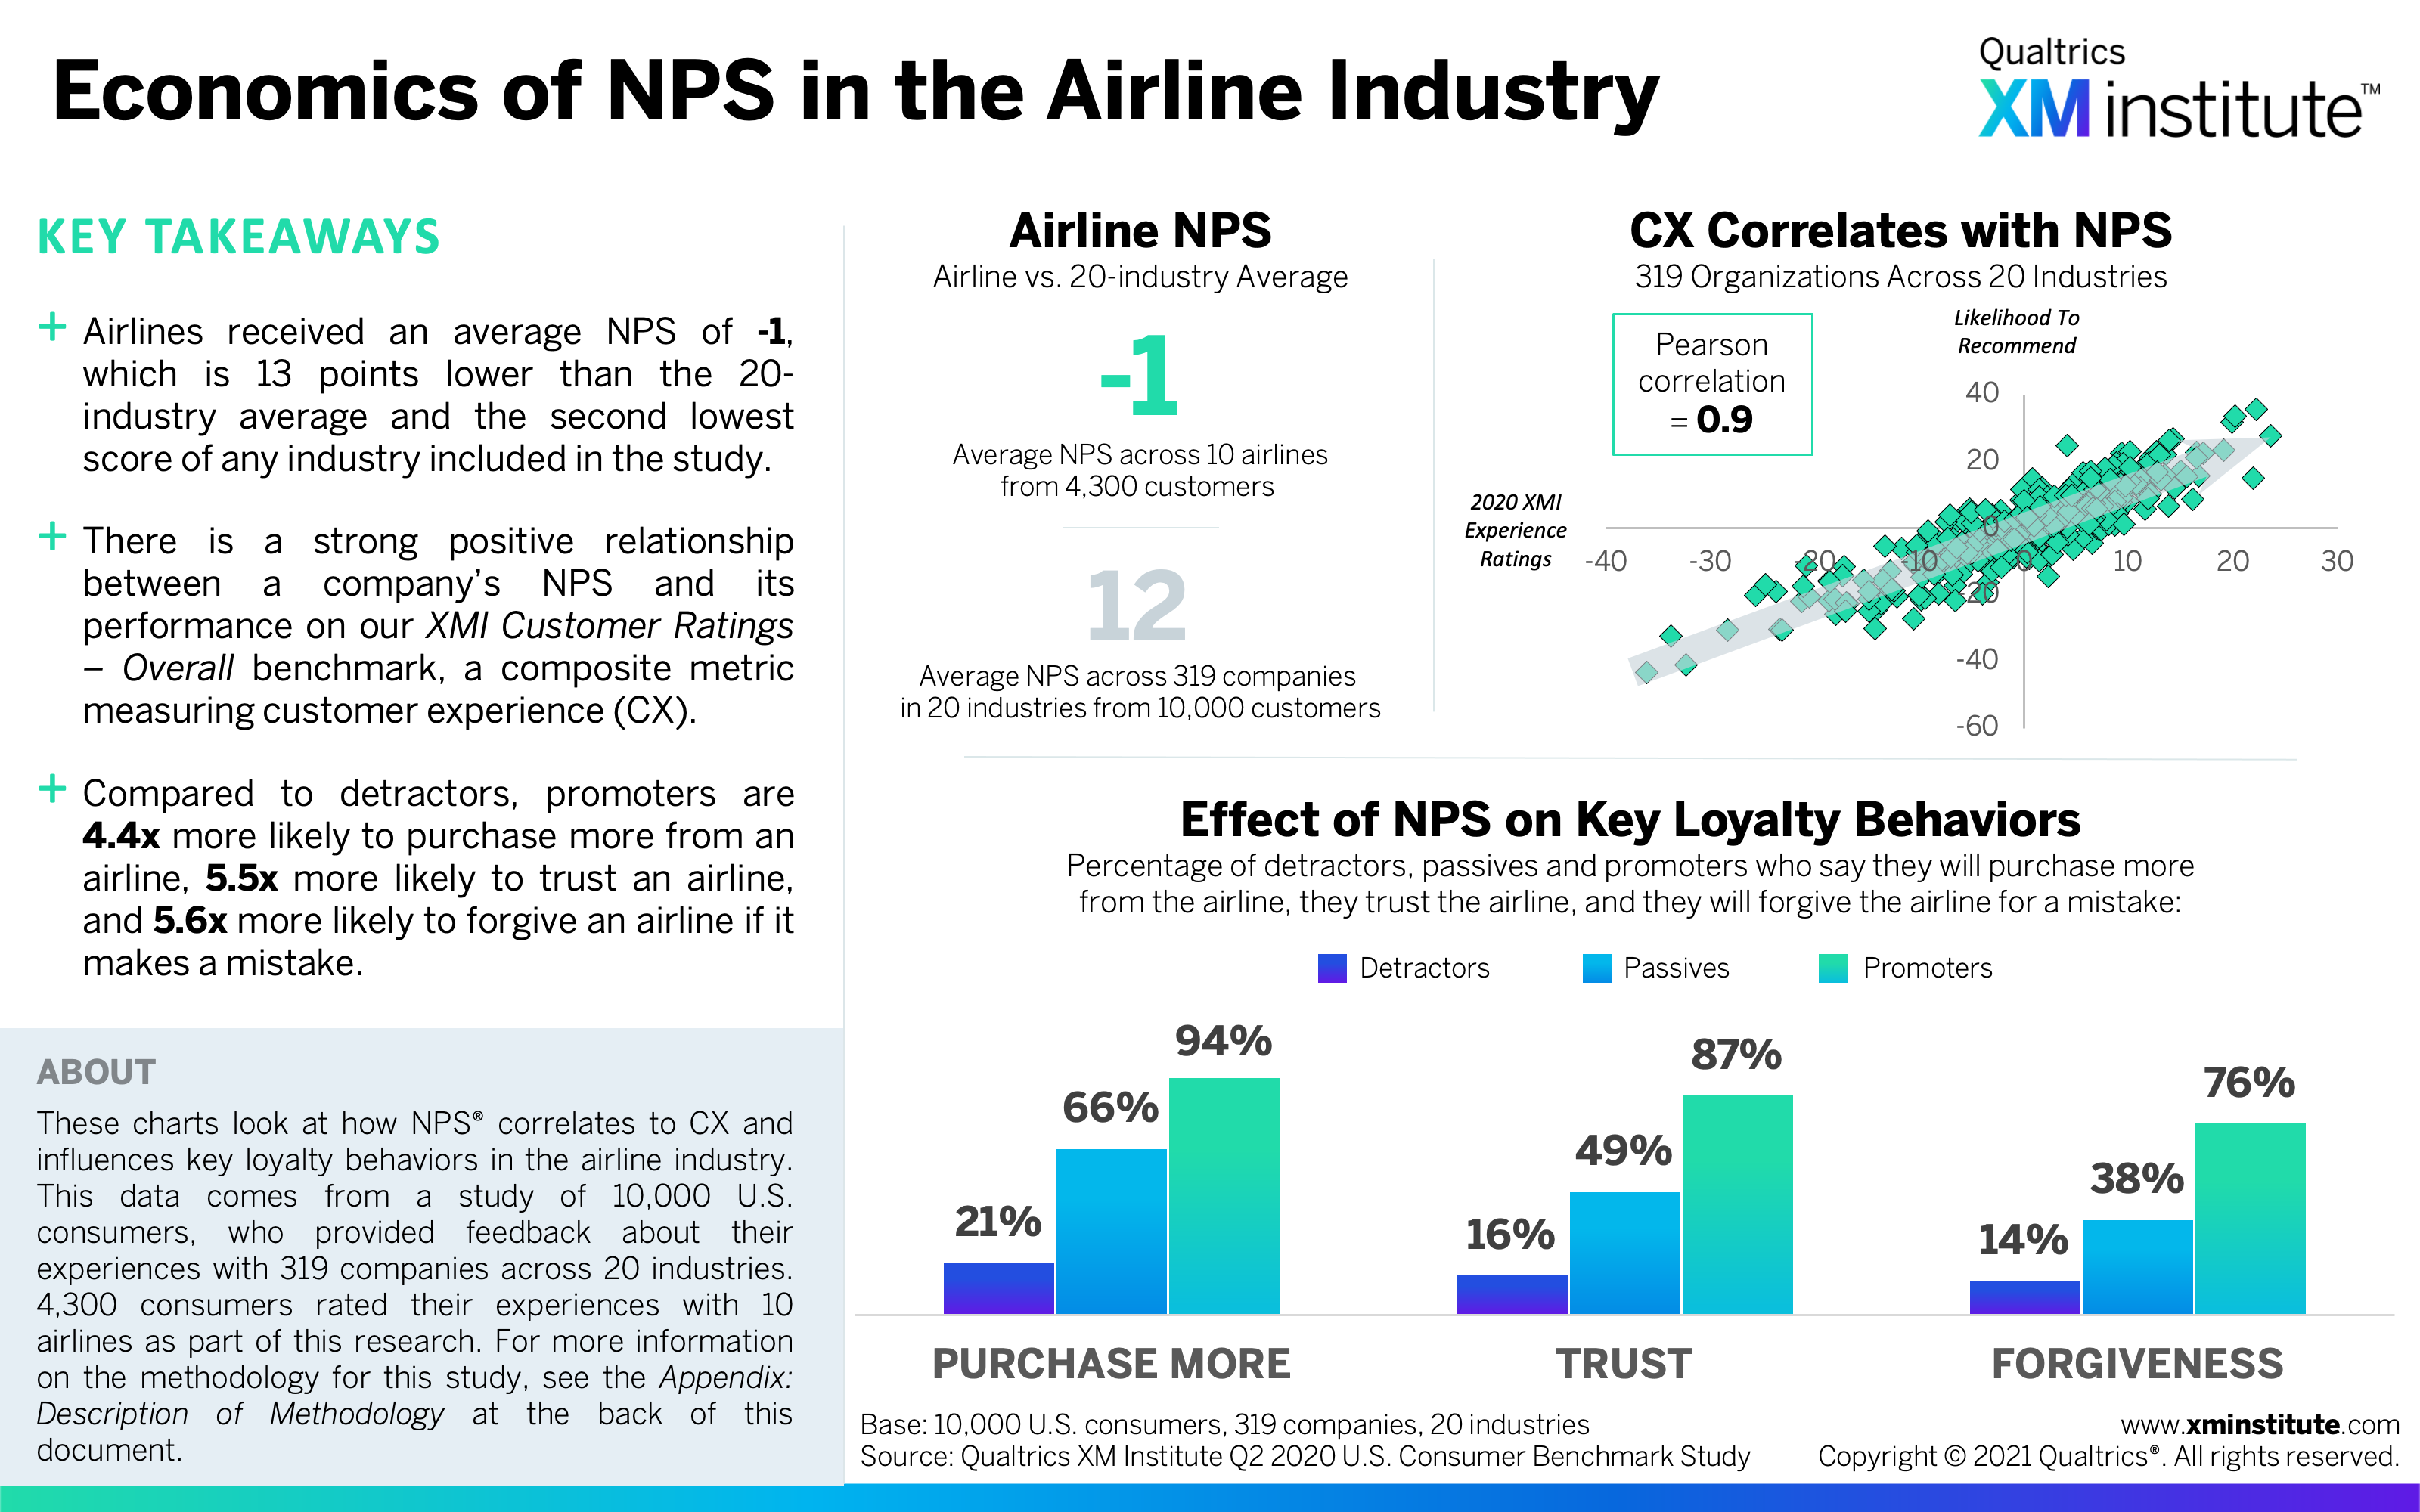
- Economics of NPS in the Airline Industry (see Figure 1)
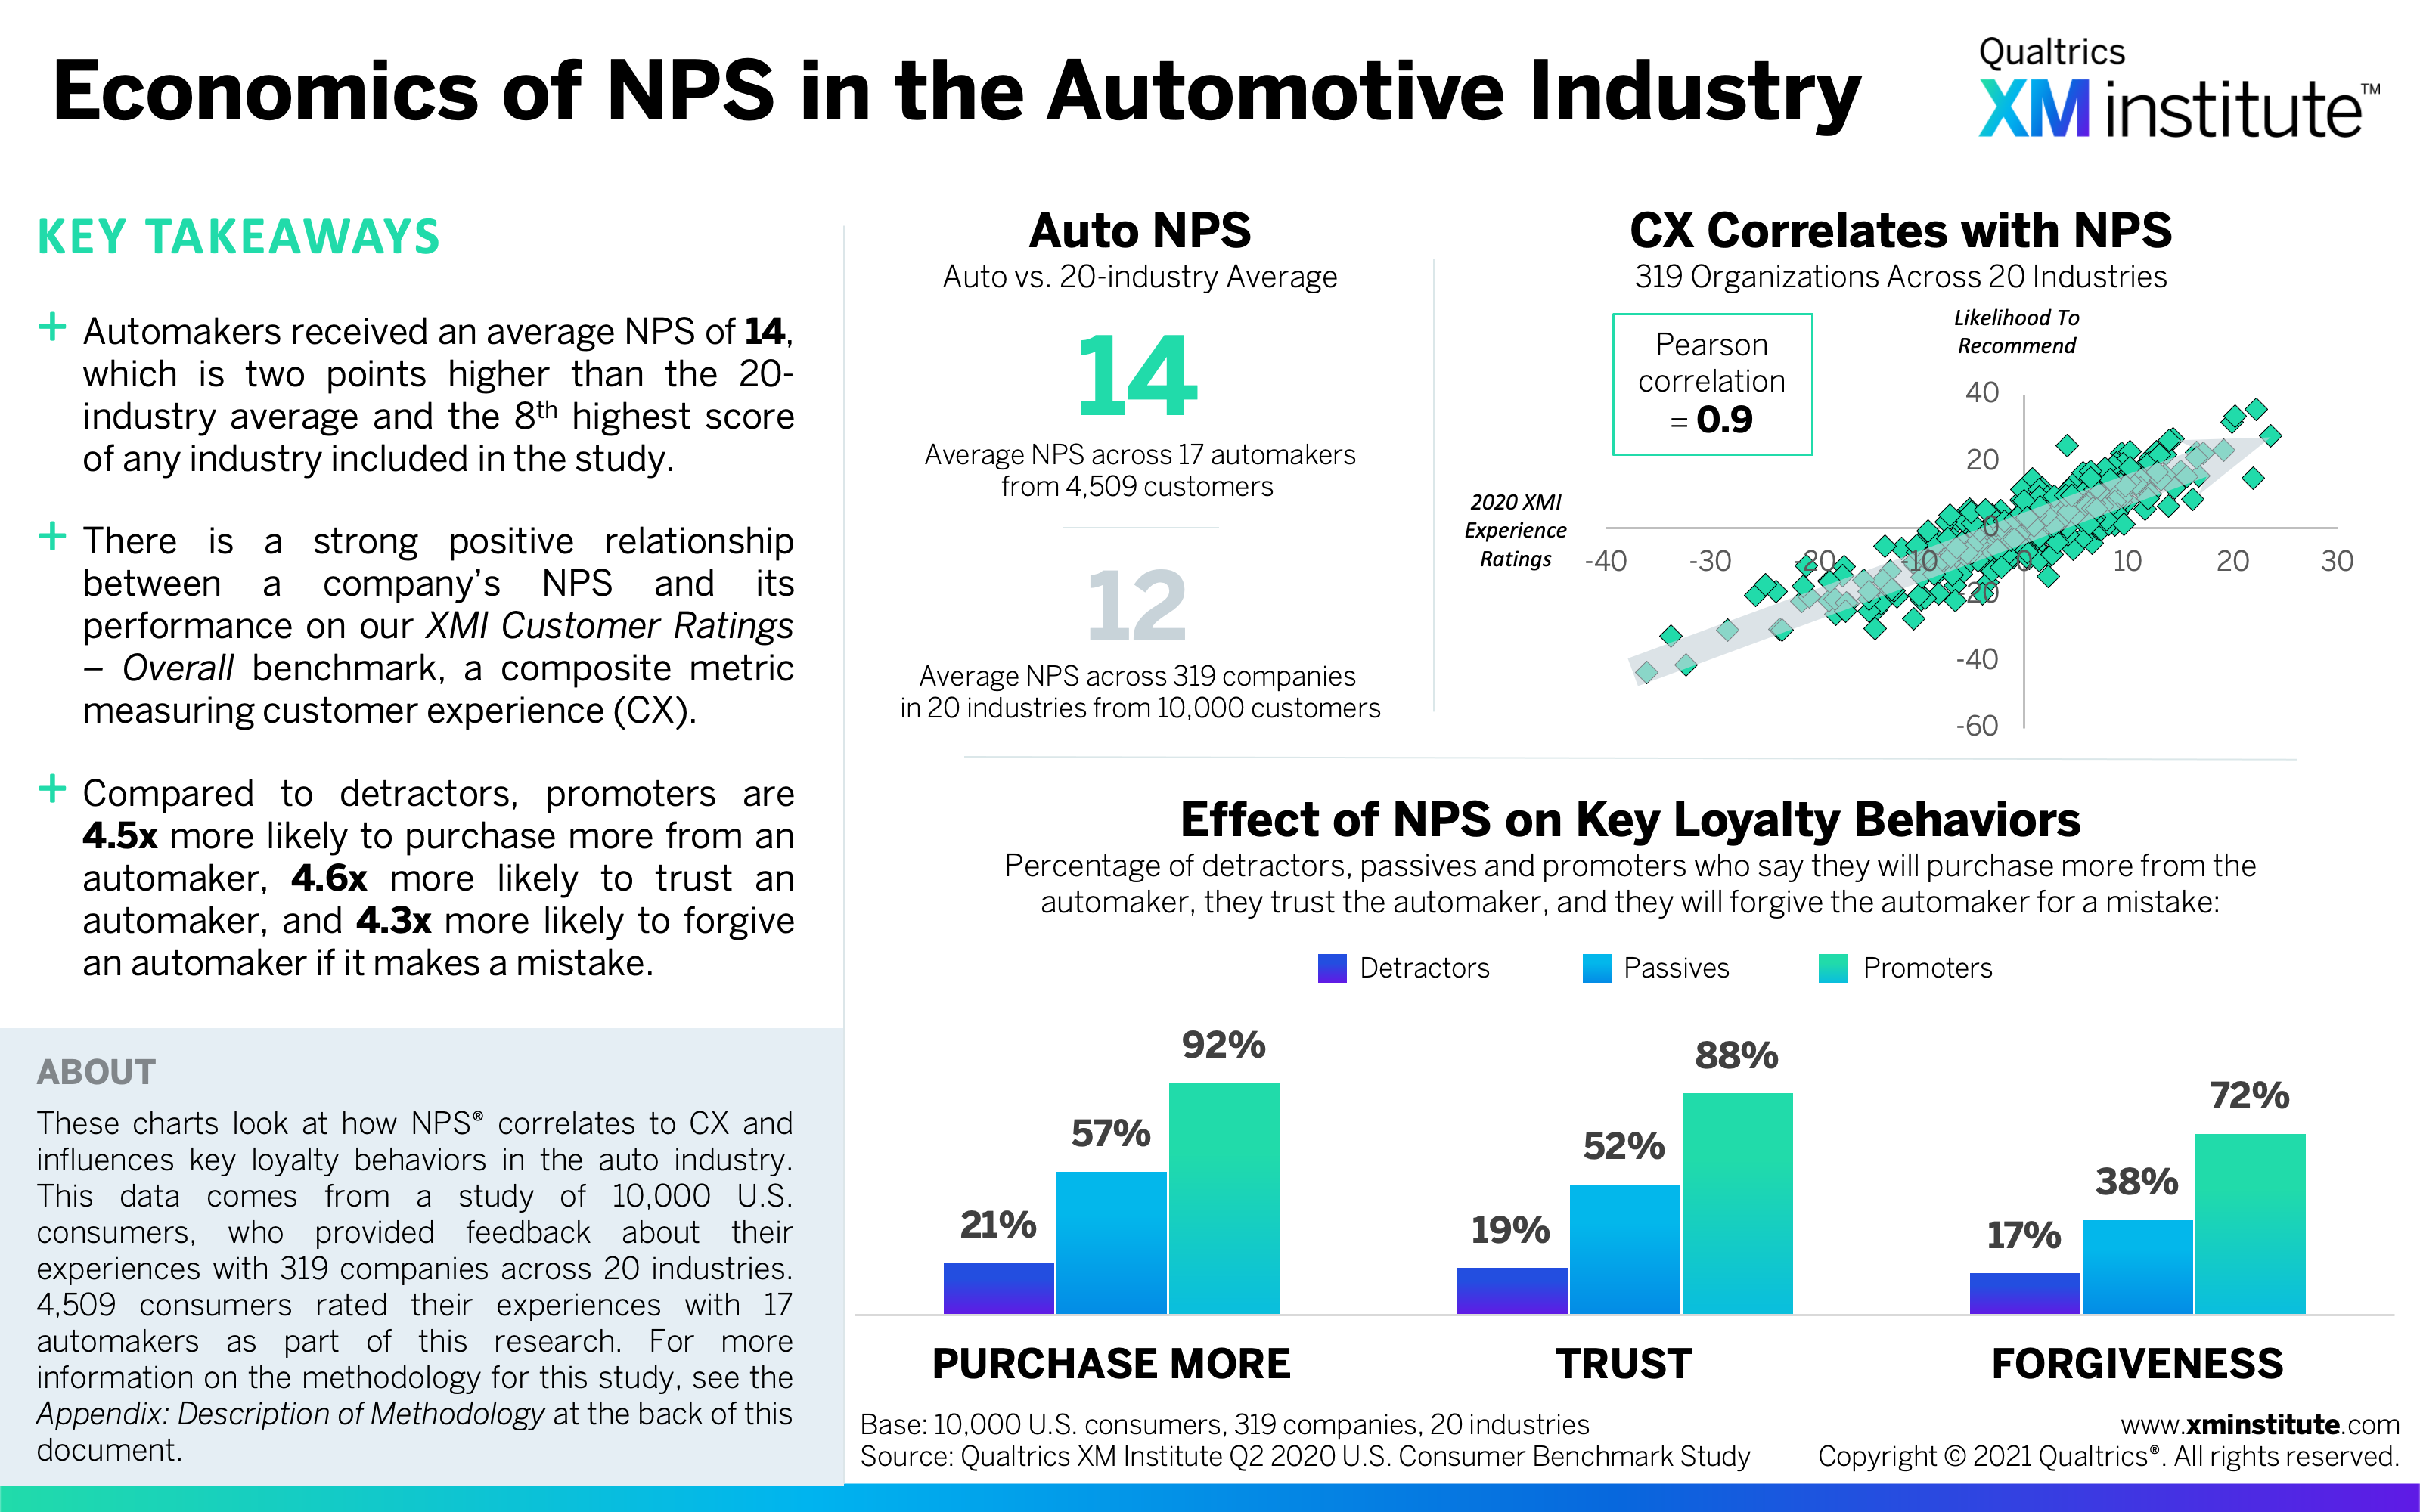
- Economics of NPS in the Automotive Industry (see Figure 2)
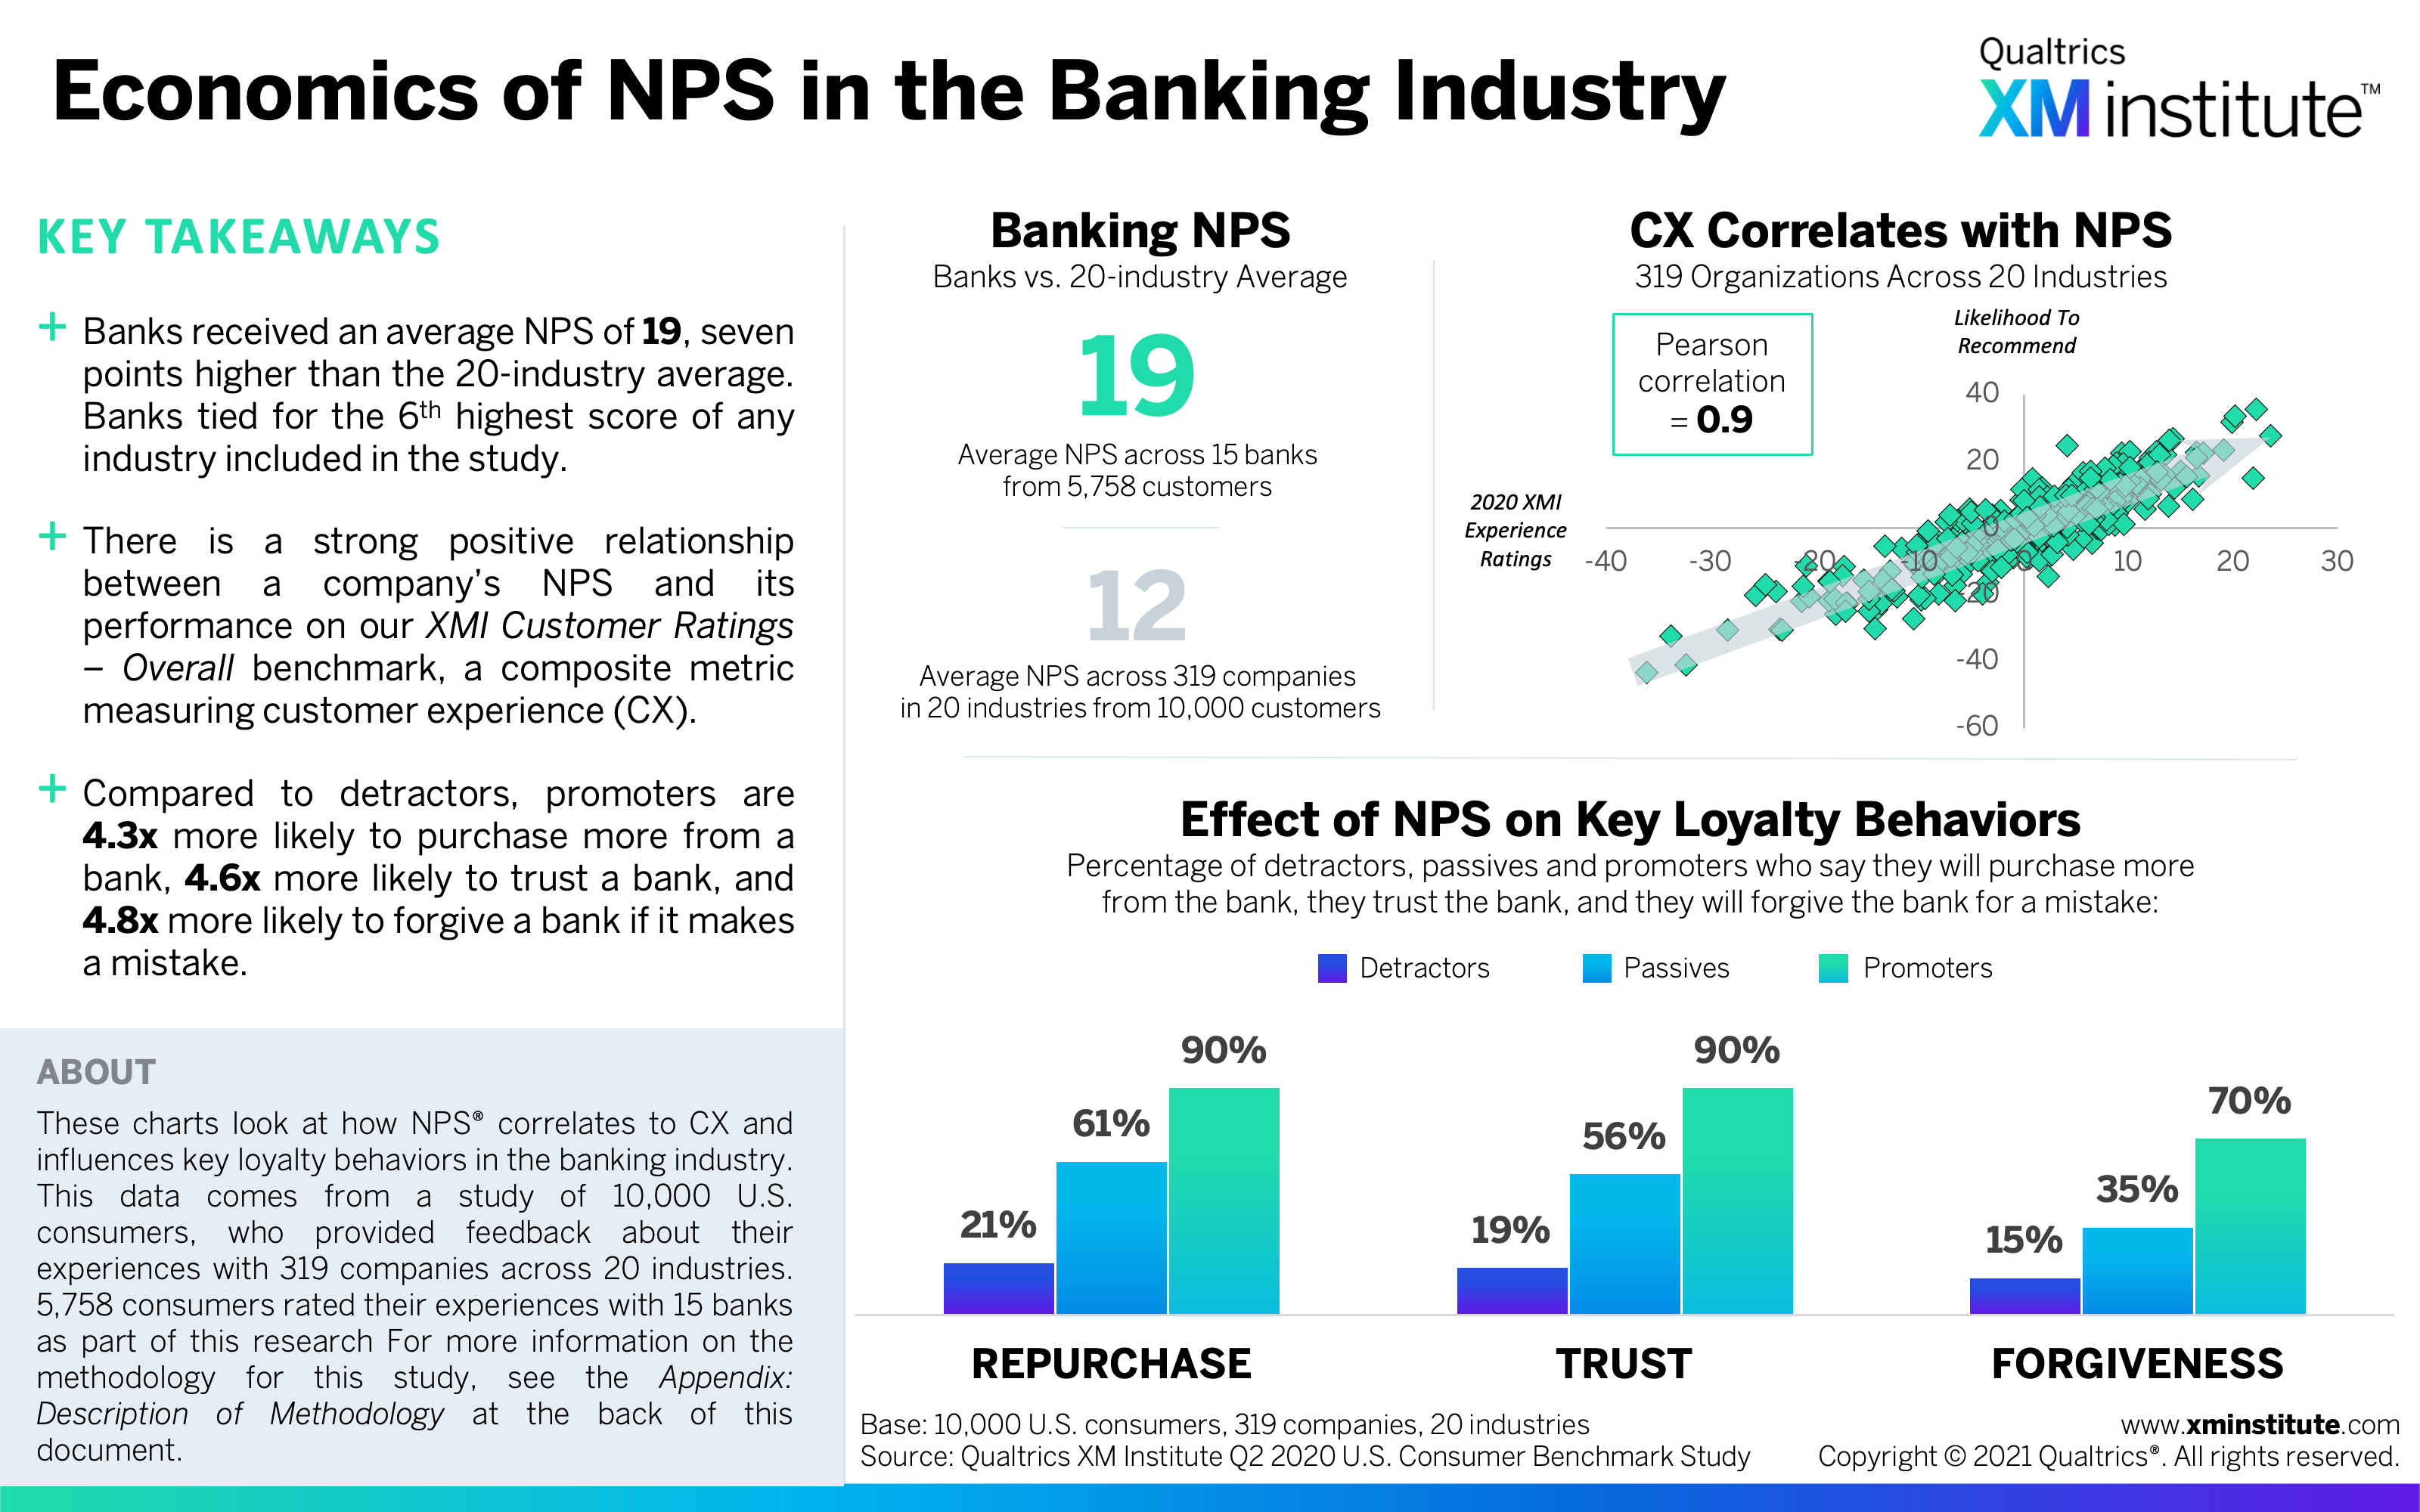
- Economics of NPS in the Banking Industry (see Figure 3)
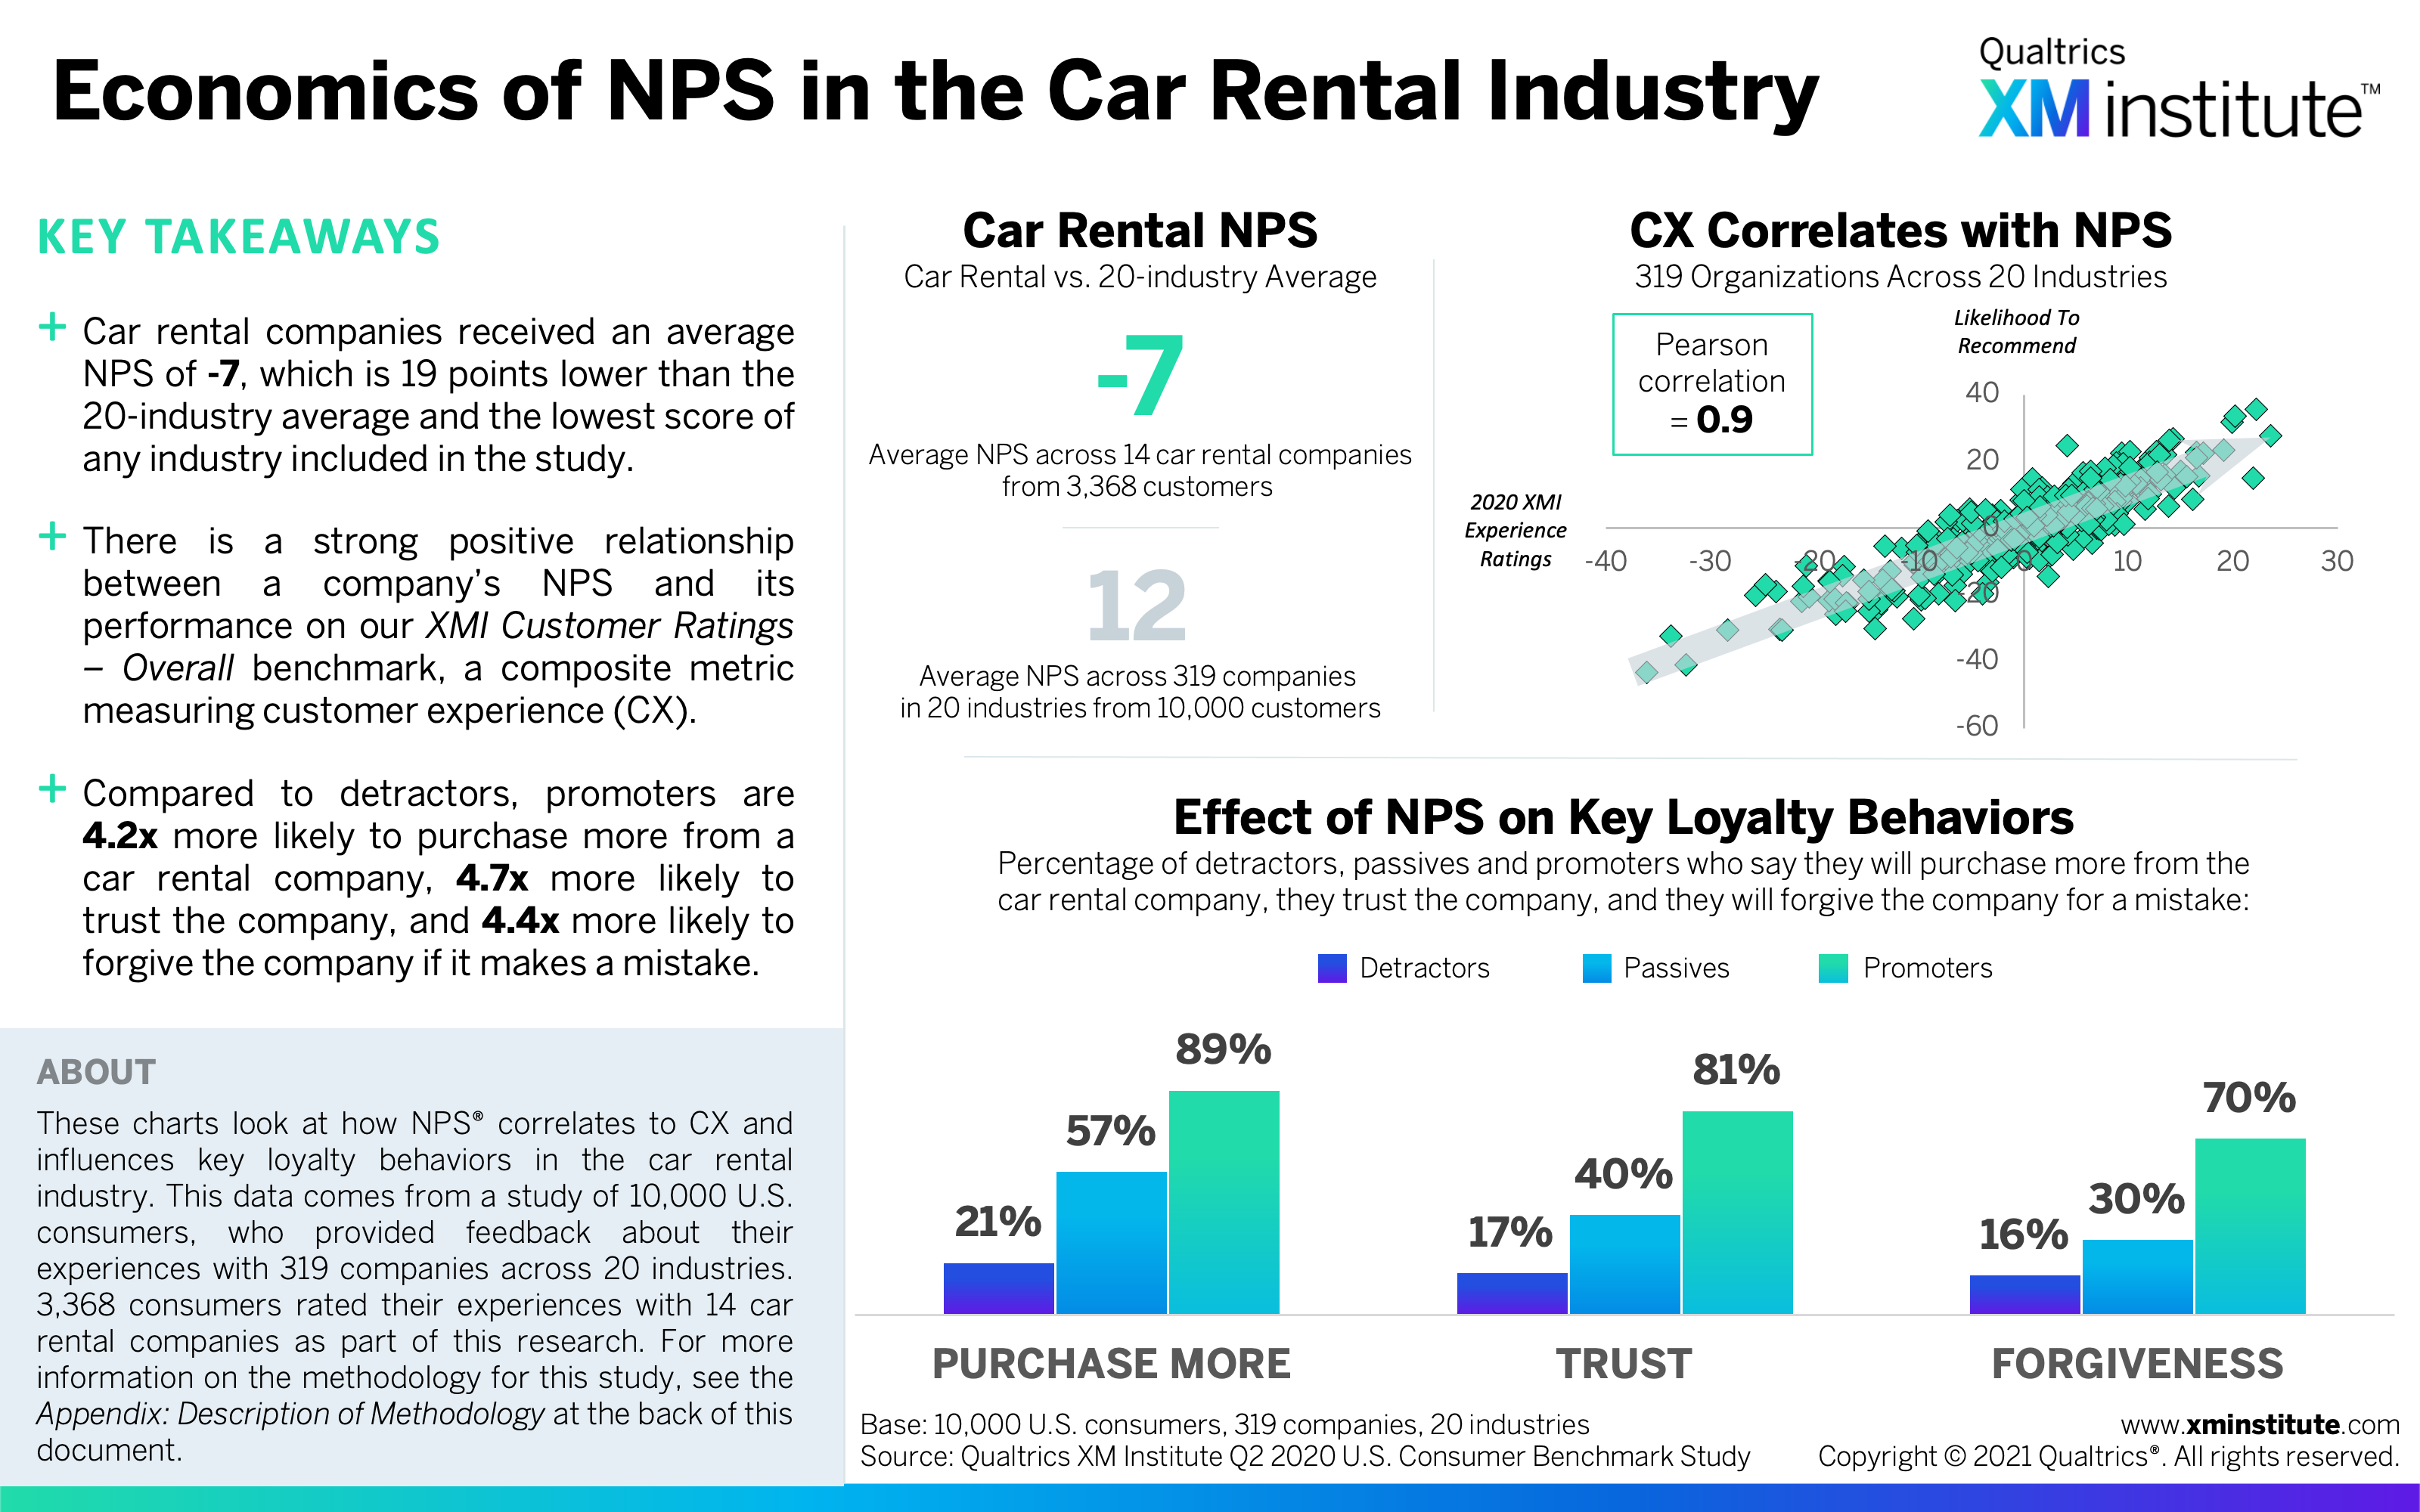
- Economics of NPS in the Car Rental Industry (see Figure 4)
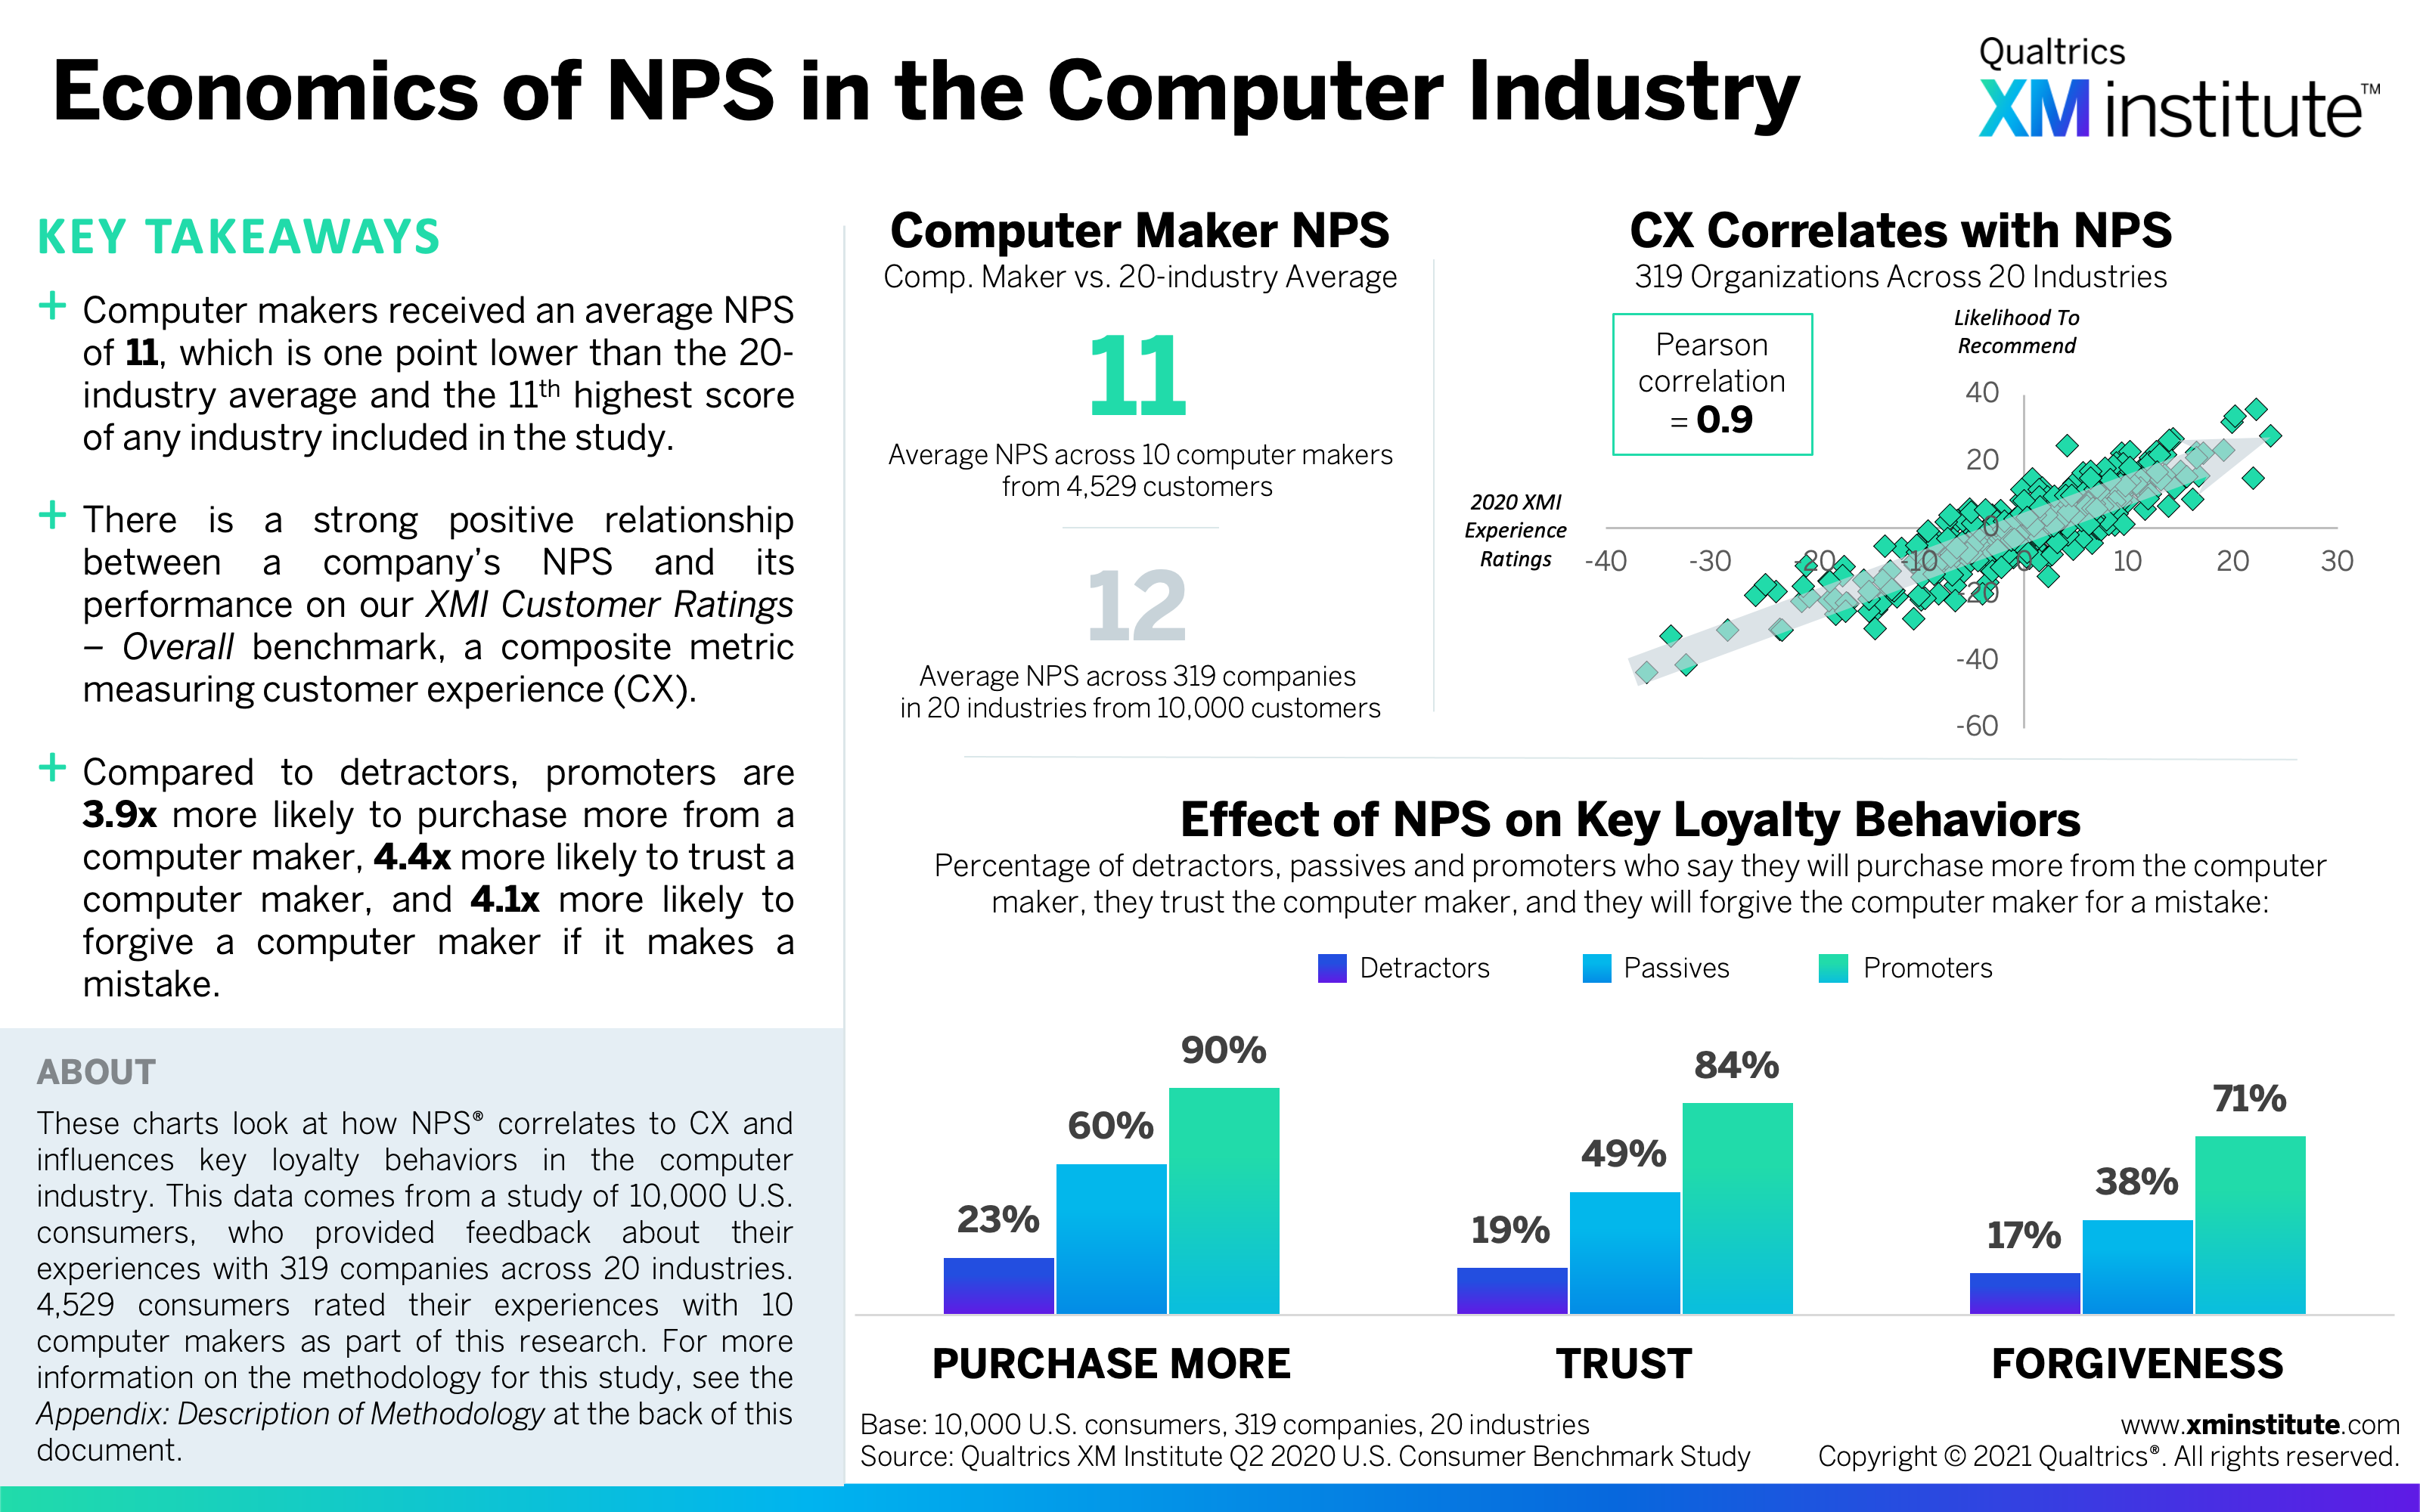
- Economics of NPS in the Computer Makers Industry (see Figure 5)
- Economics of NPS in the Consumer Payments Industry (see Figure 6)
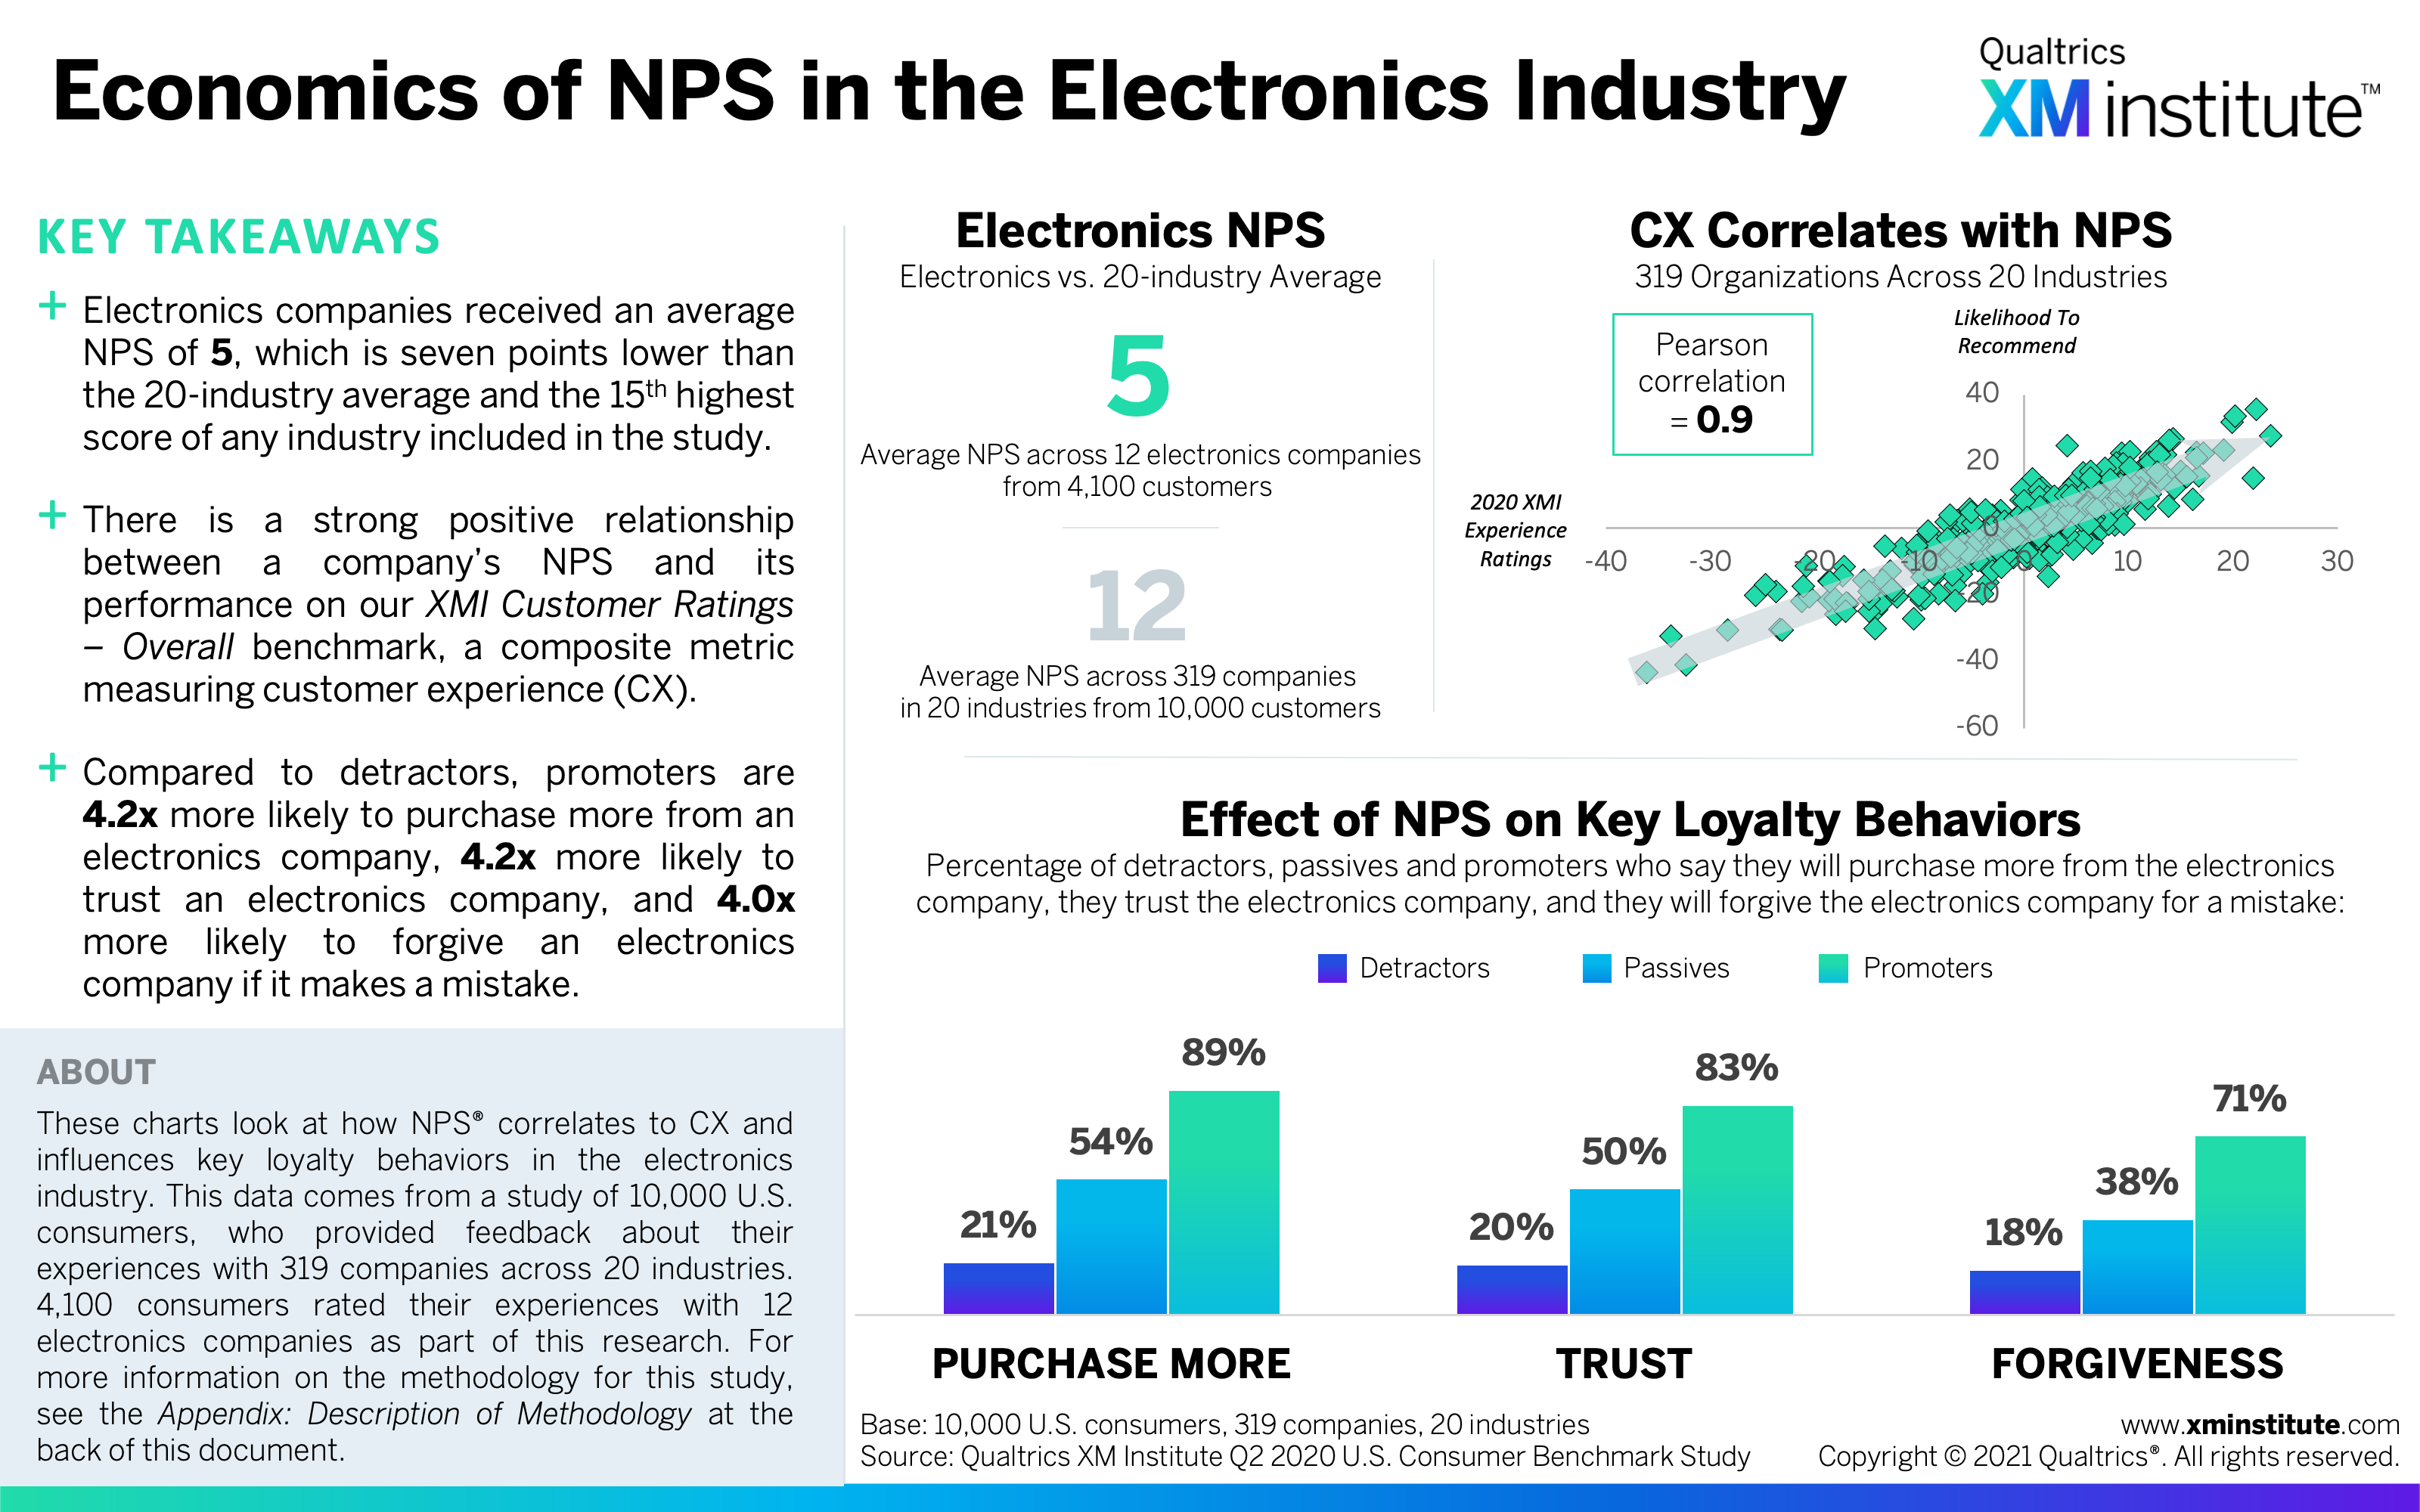
- Economics of NPS in the Electronics Industry (see Figure 7)
- Economics of NPS in the Fast Food Industry (see Figure 8)
- Economics of NPS in the Grocery Industry (see Figure 9)
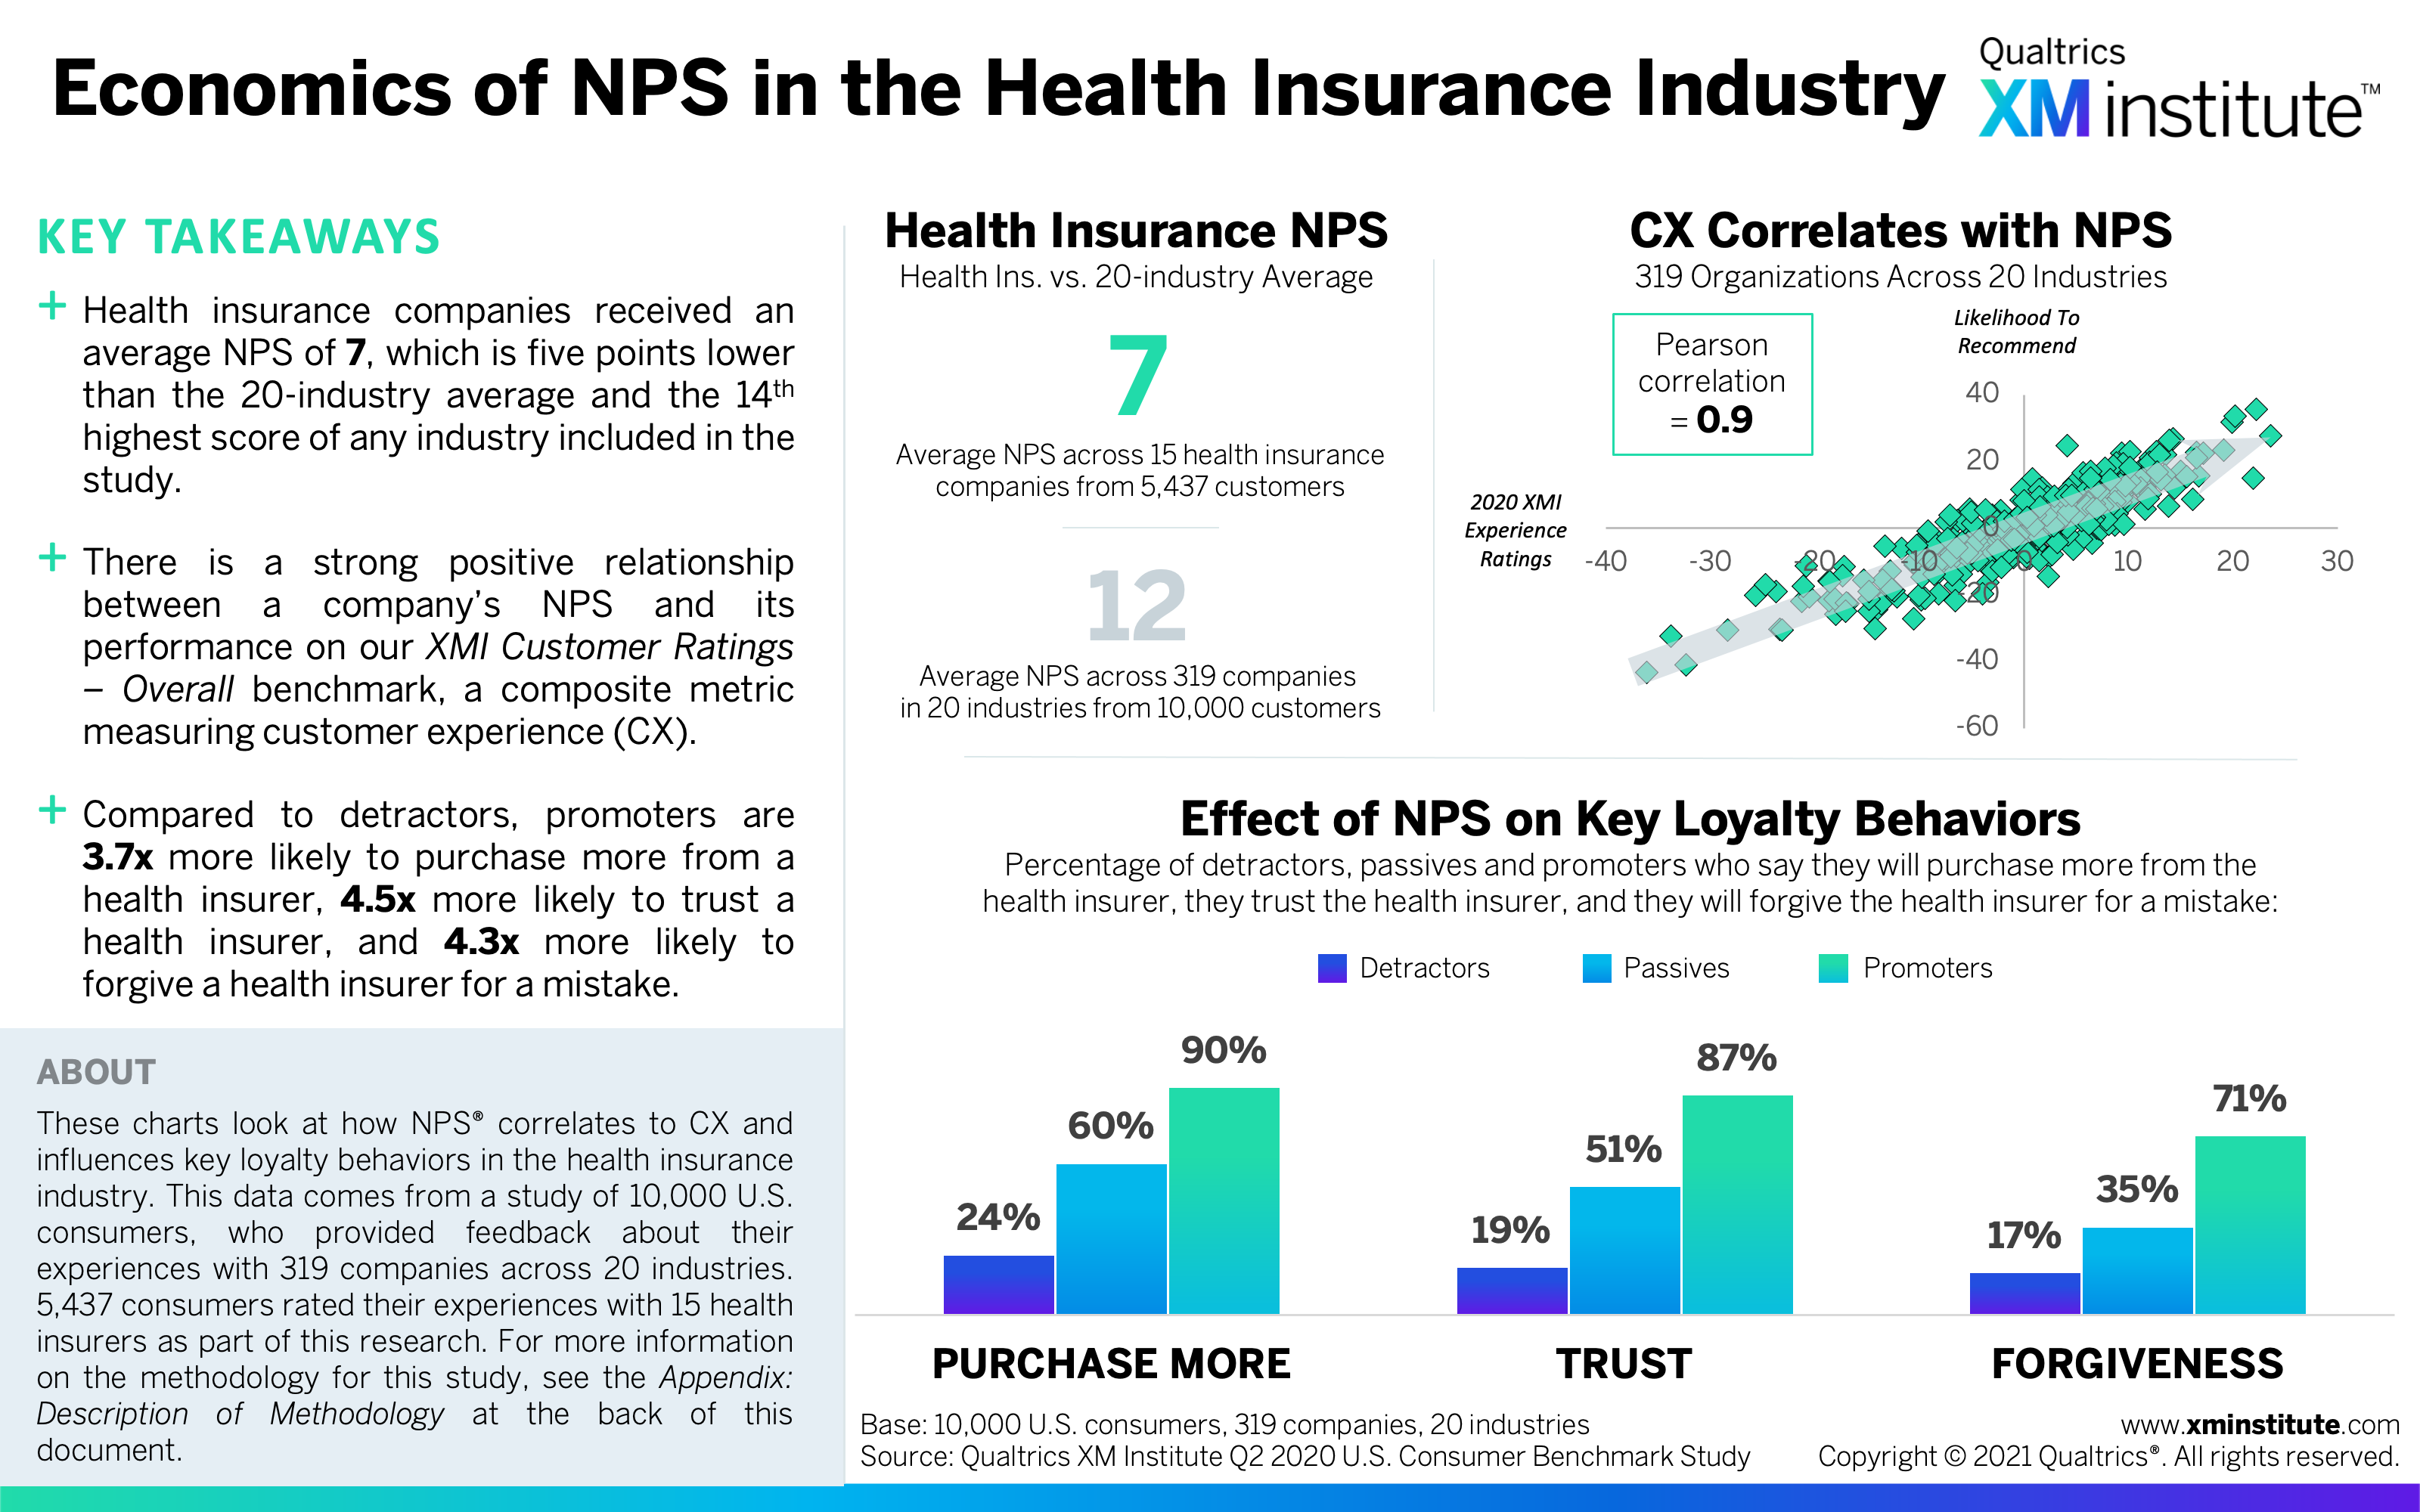
- Economics of NPS in the Health Insurance Industry (see Figure 10)
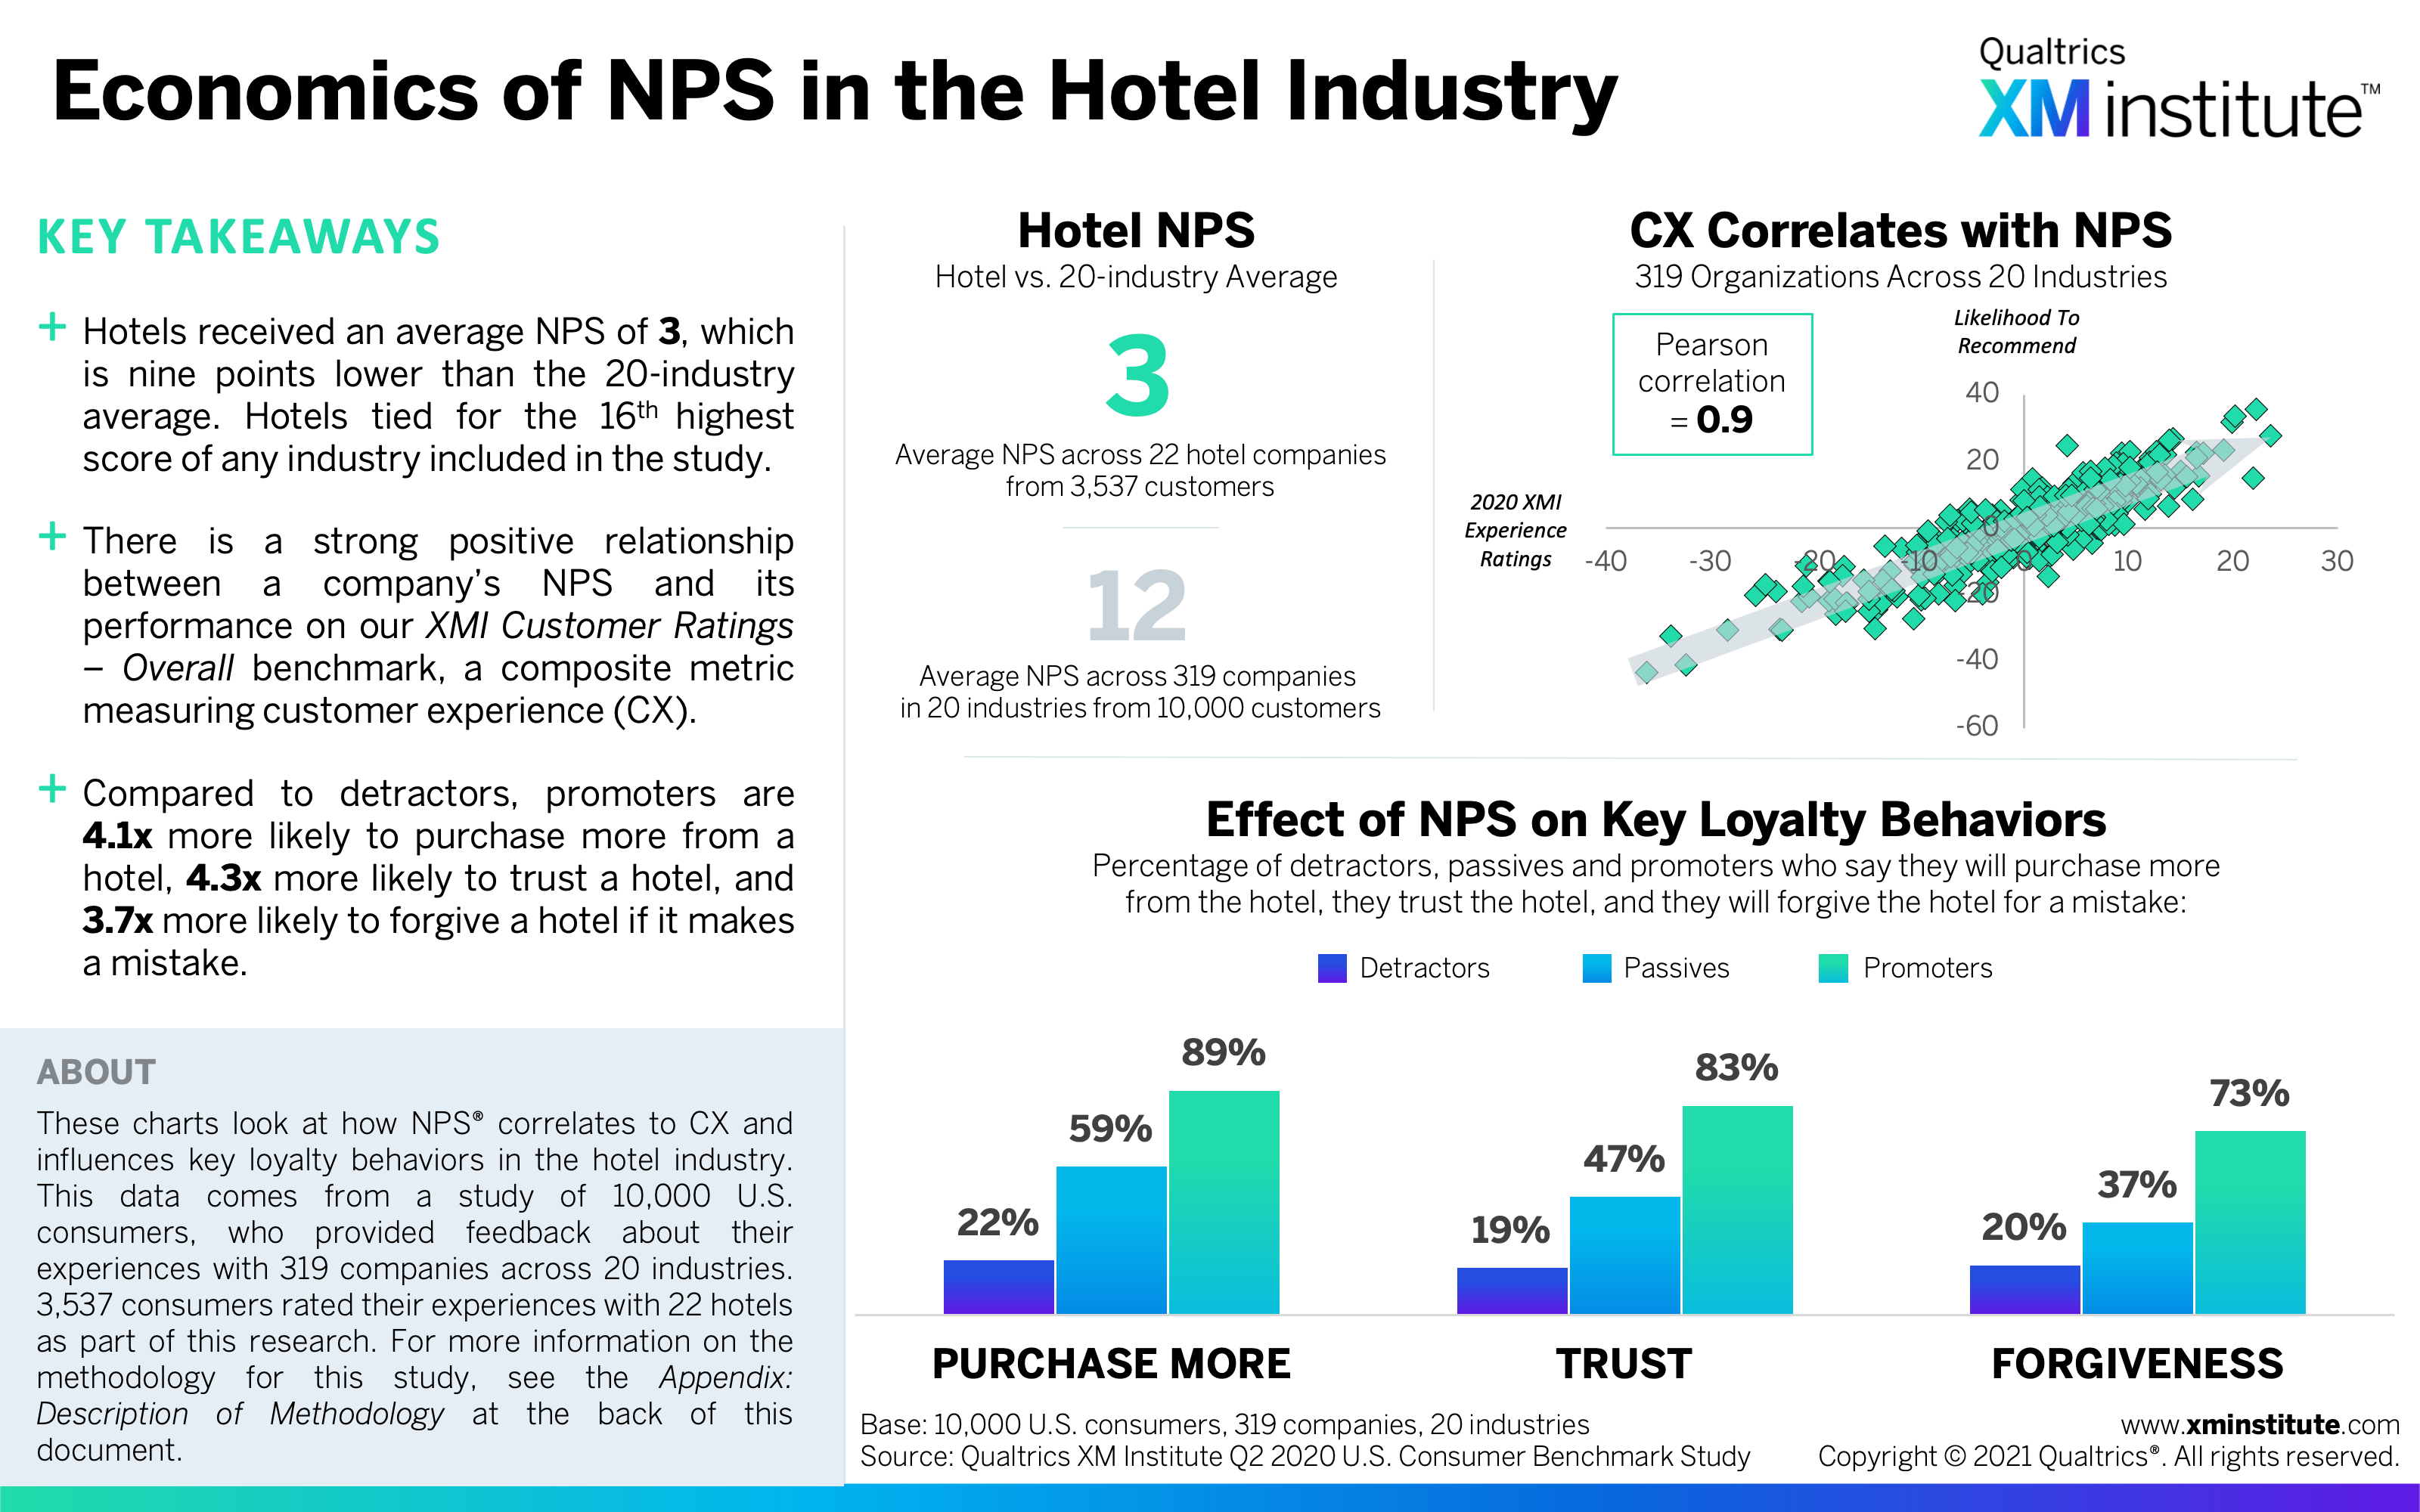
- Economics of NPS in the Hotel Industry (see Figure 11)
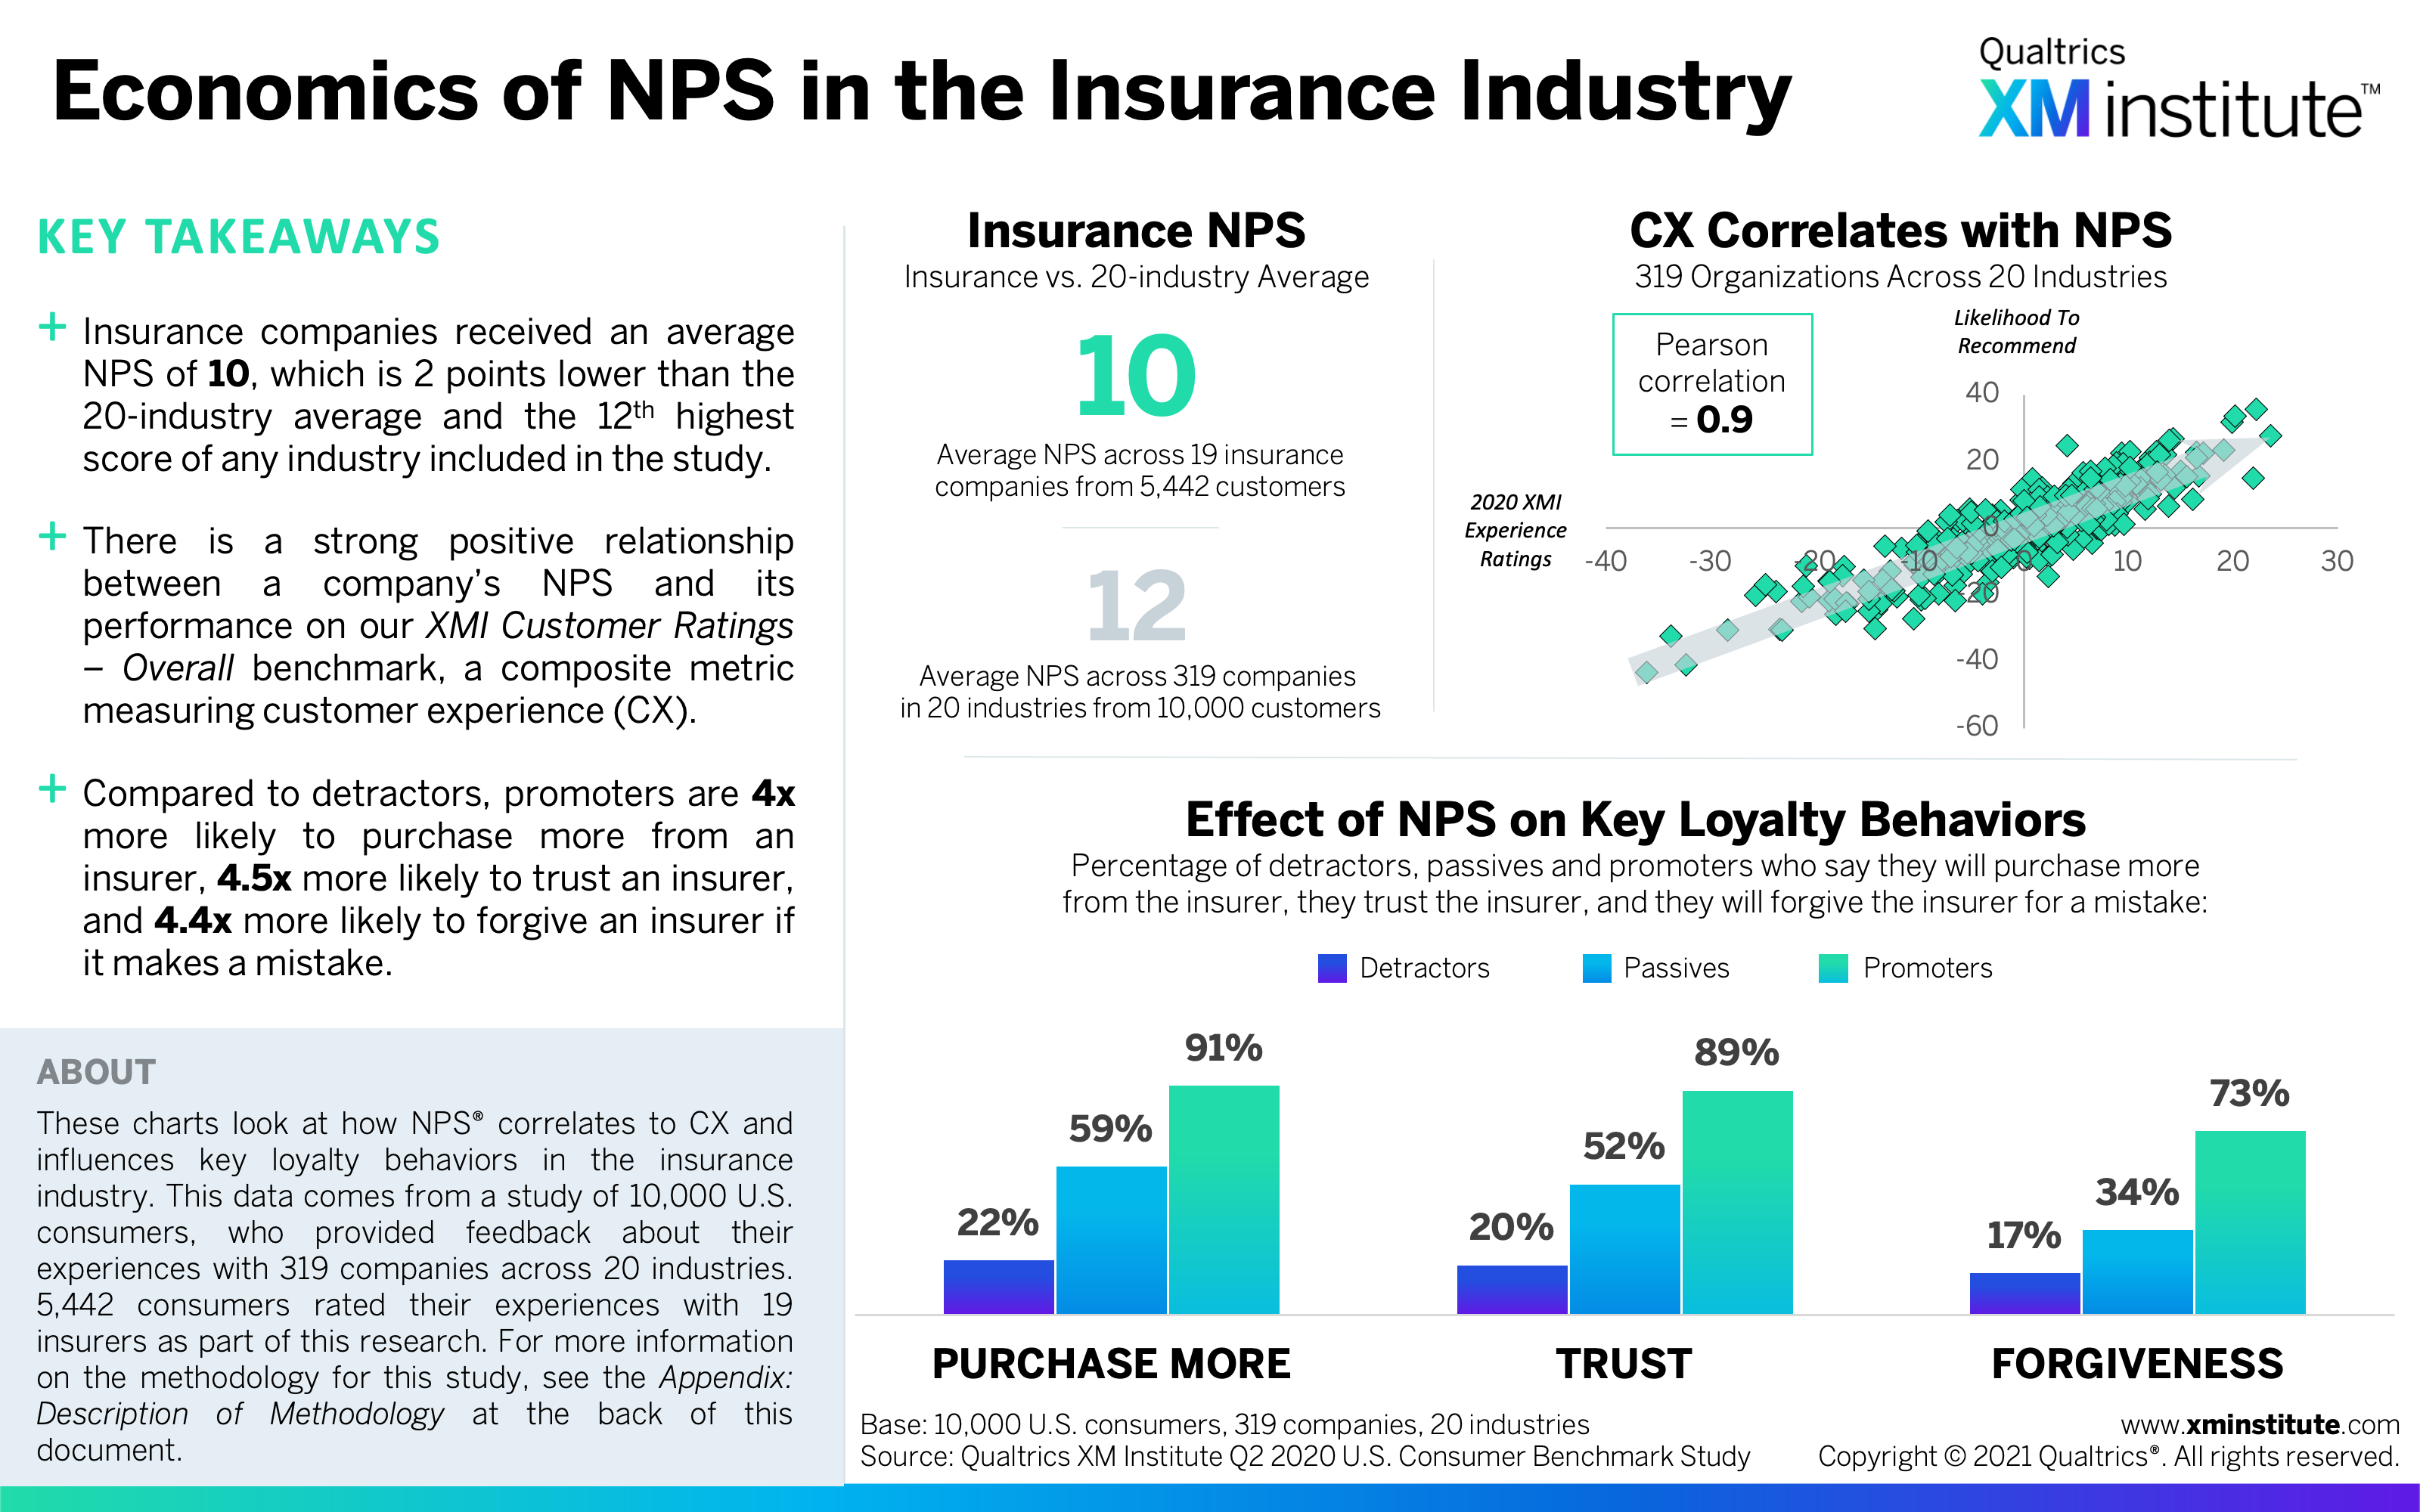
- Economics of NPS in the Insurance Industry (see Figure 12)
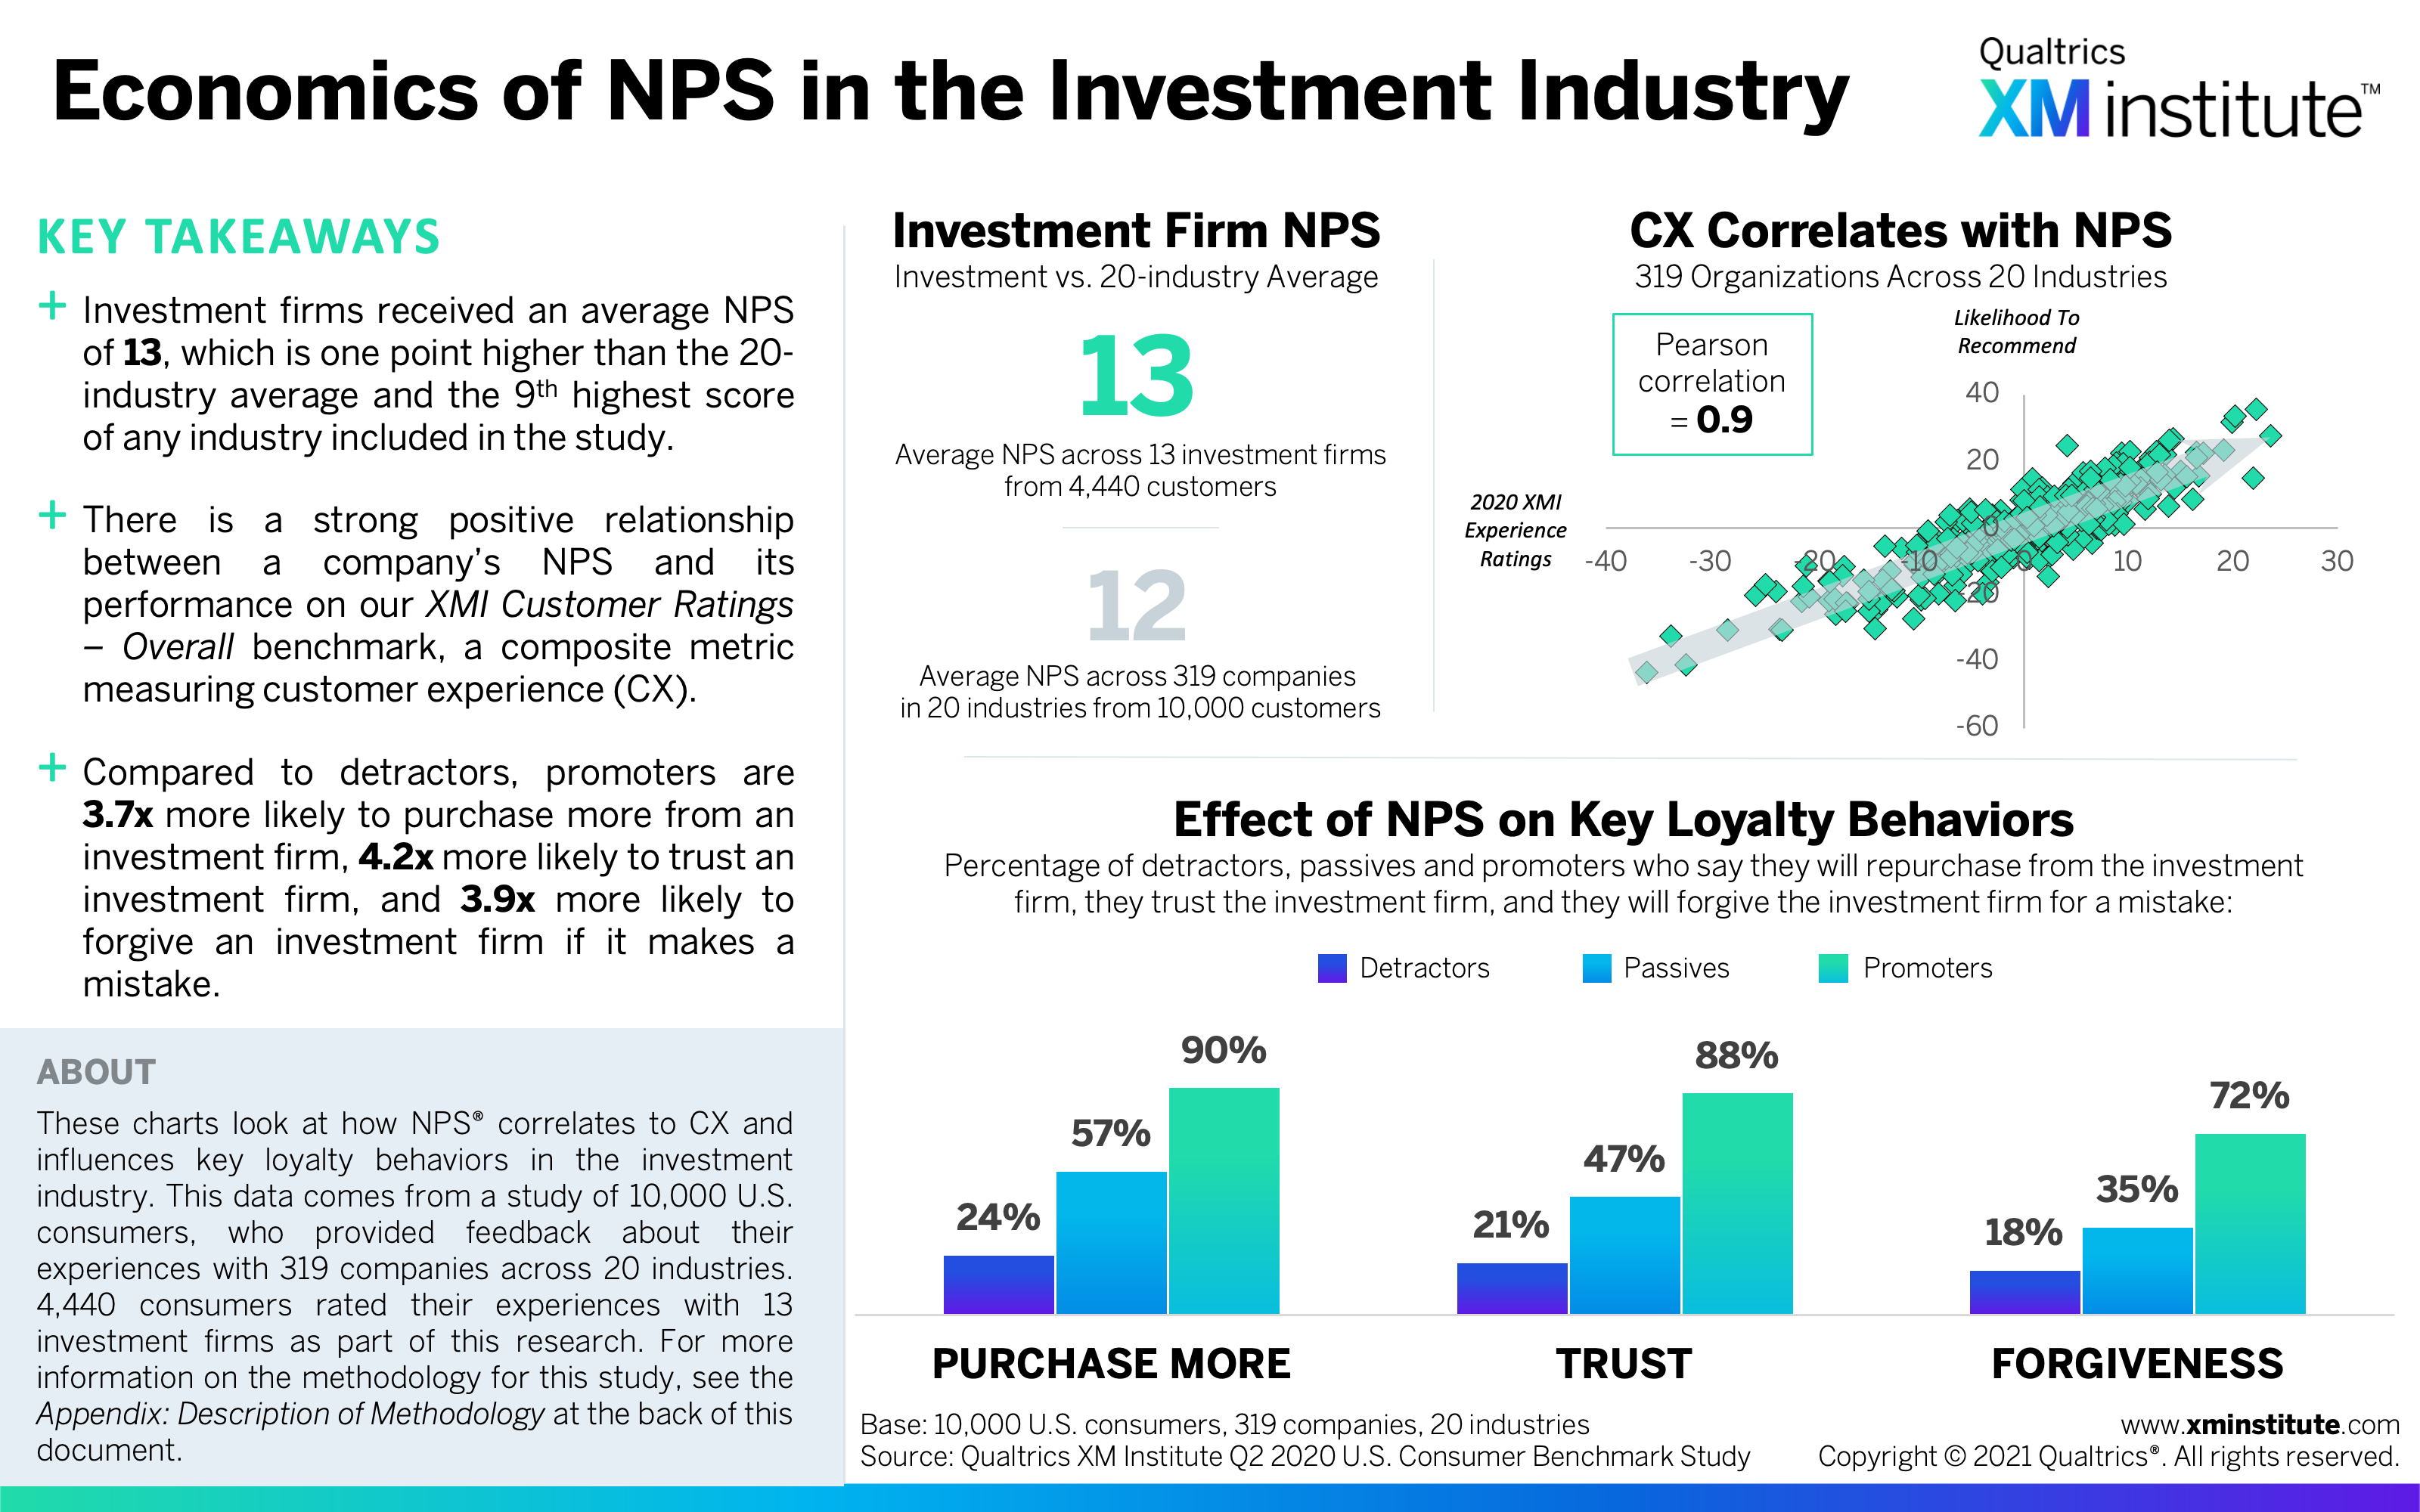
- Economics of NPS in the Investment Firms Industry (see Figure 13)
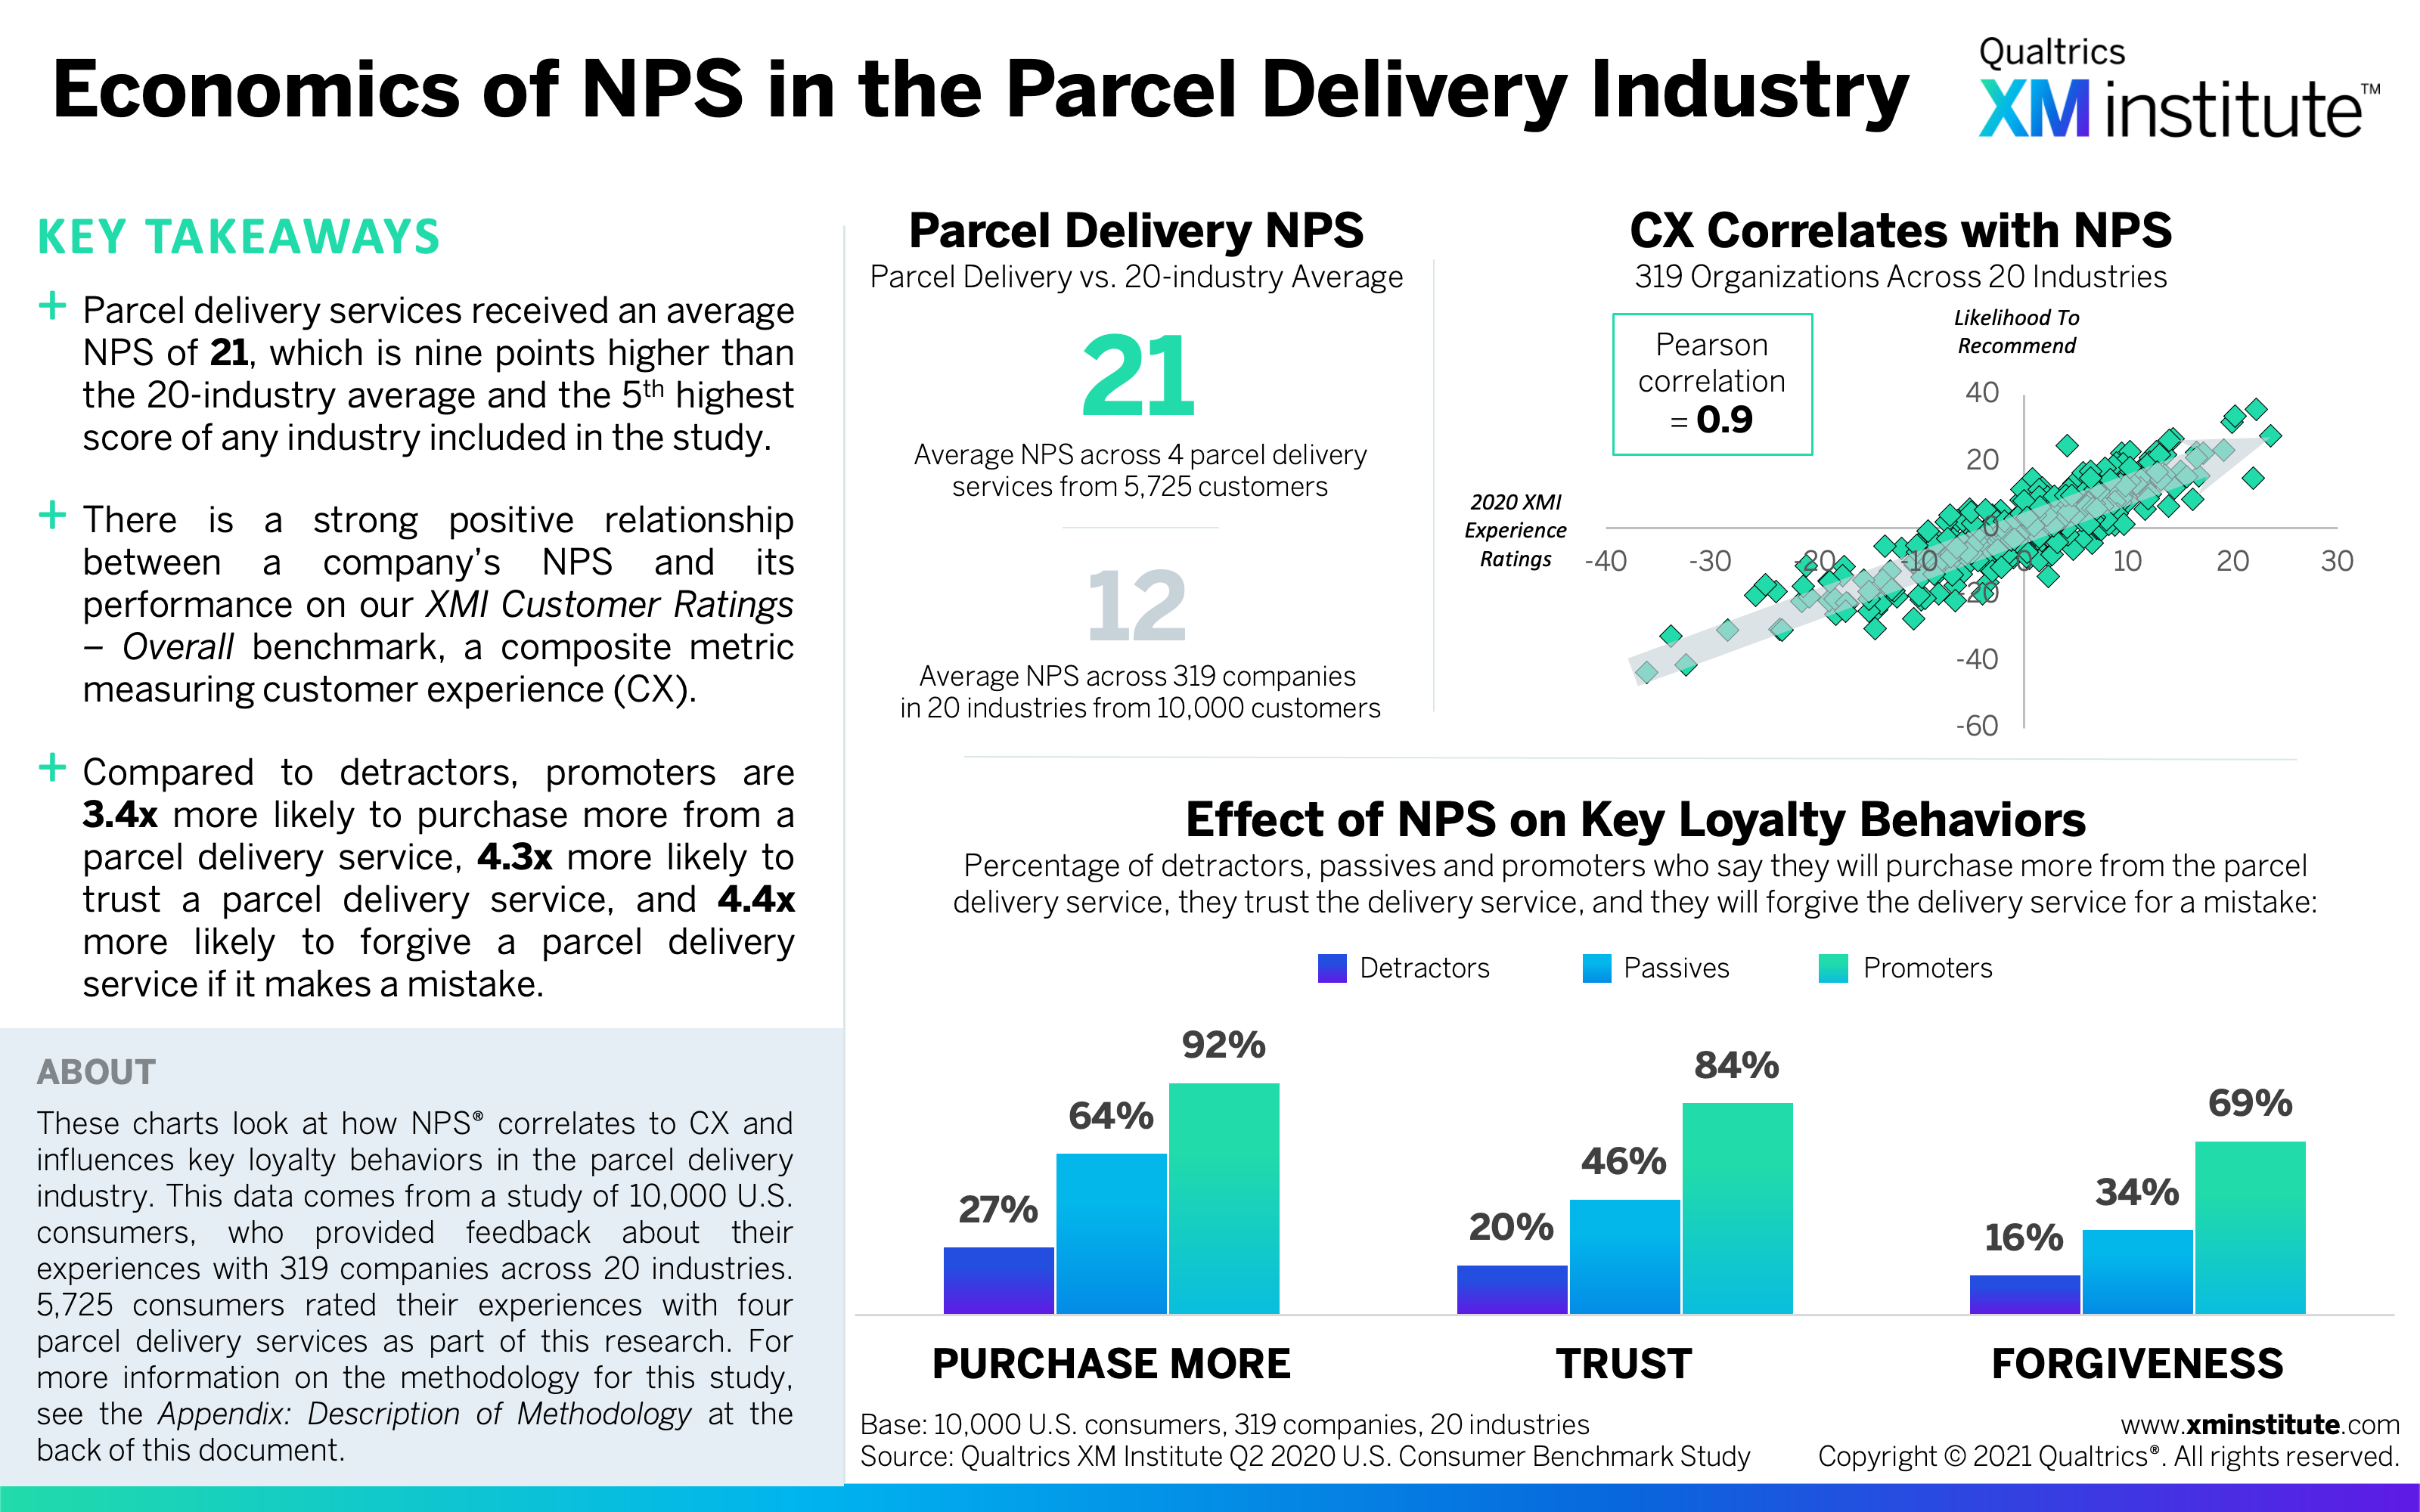
- Economics of NPS in the Parcel Delivery Services Industry (see Figure 14)
- Economics of NPS in the Retail Industry (see Figure 15)
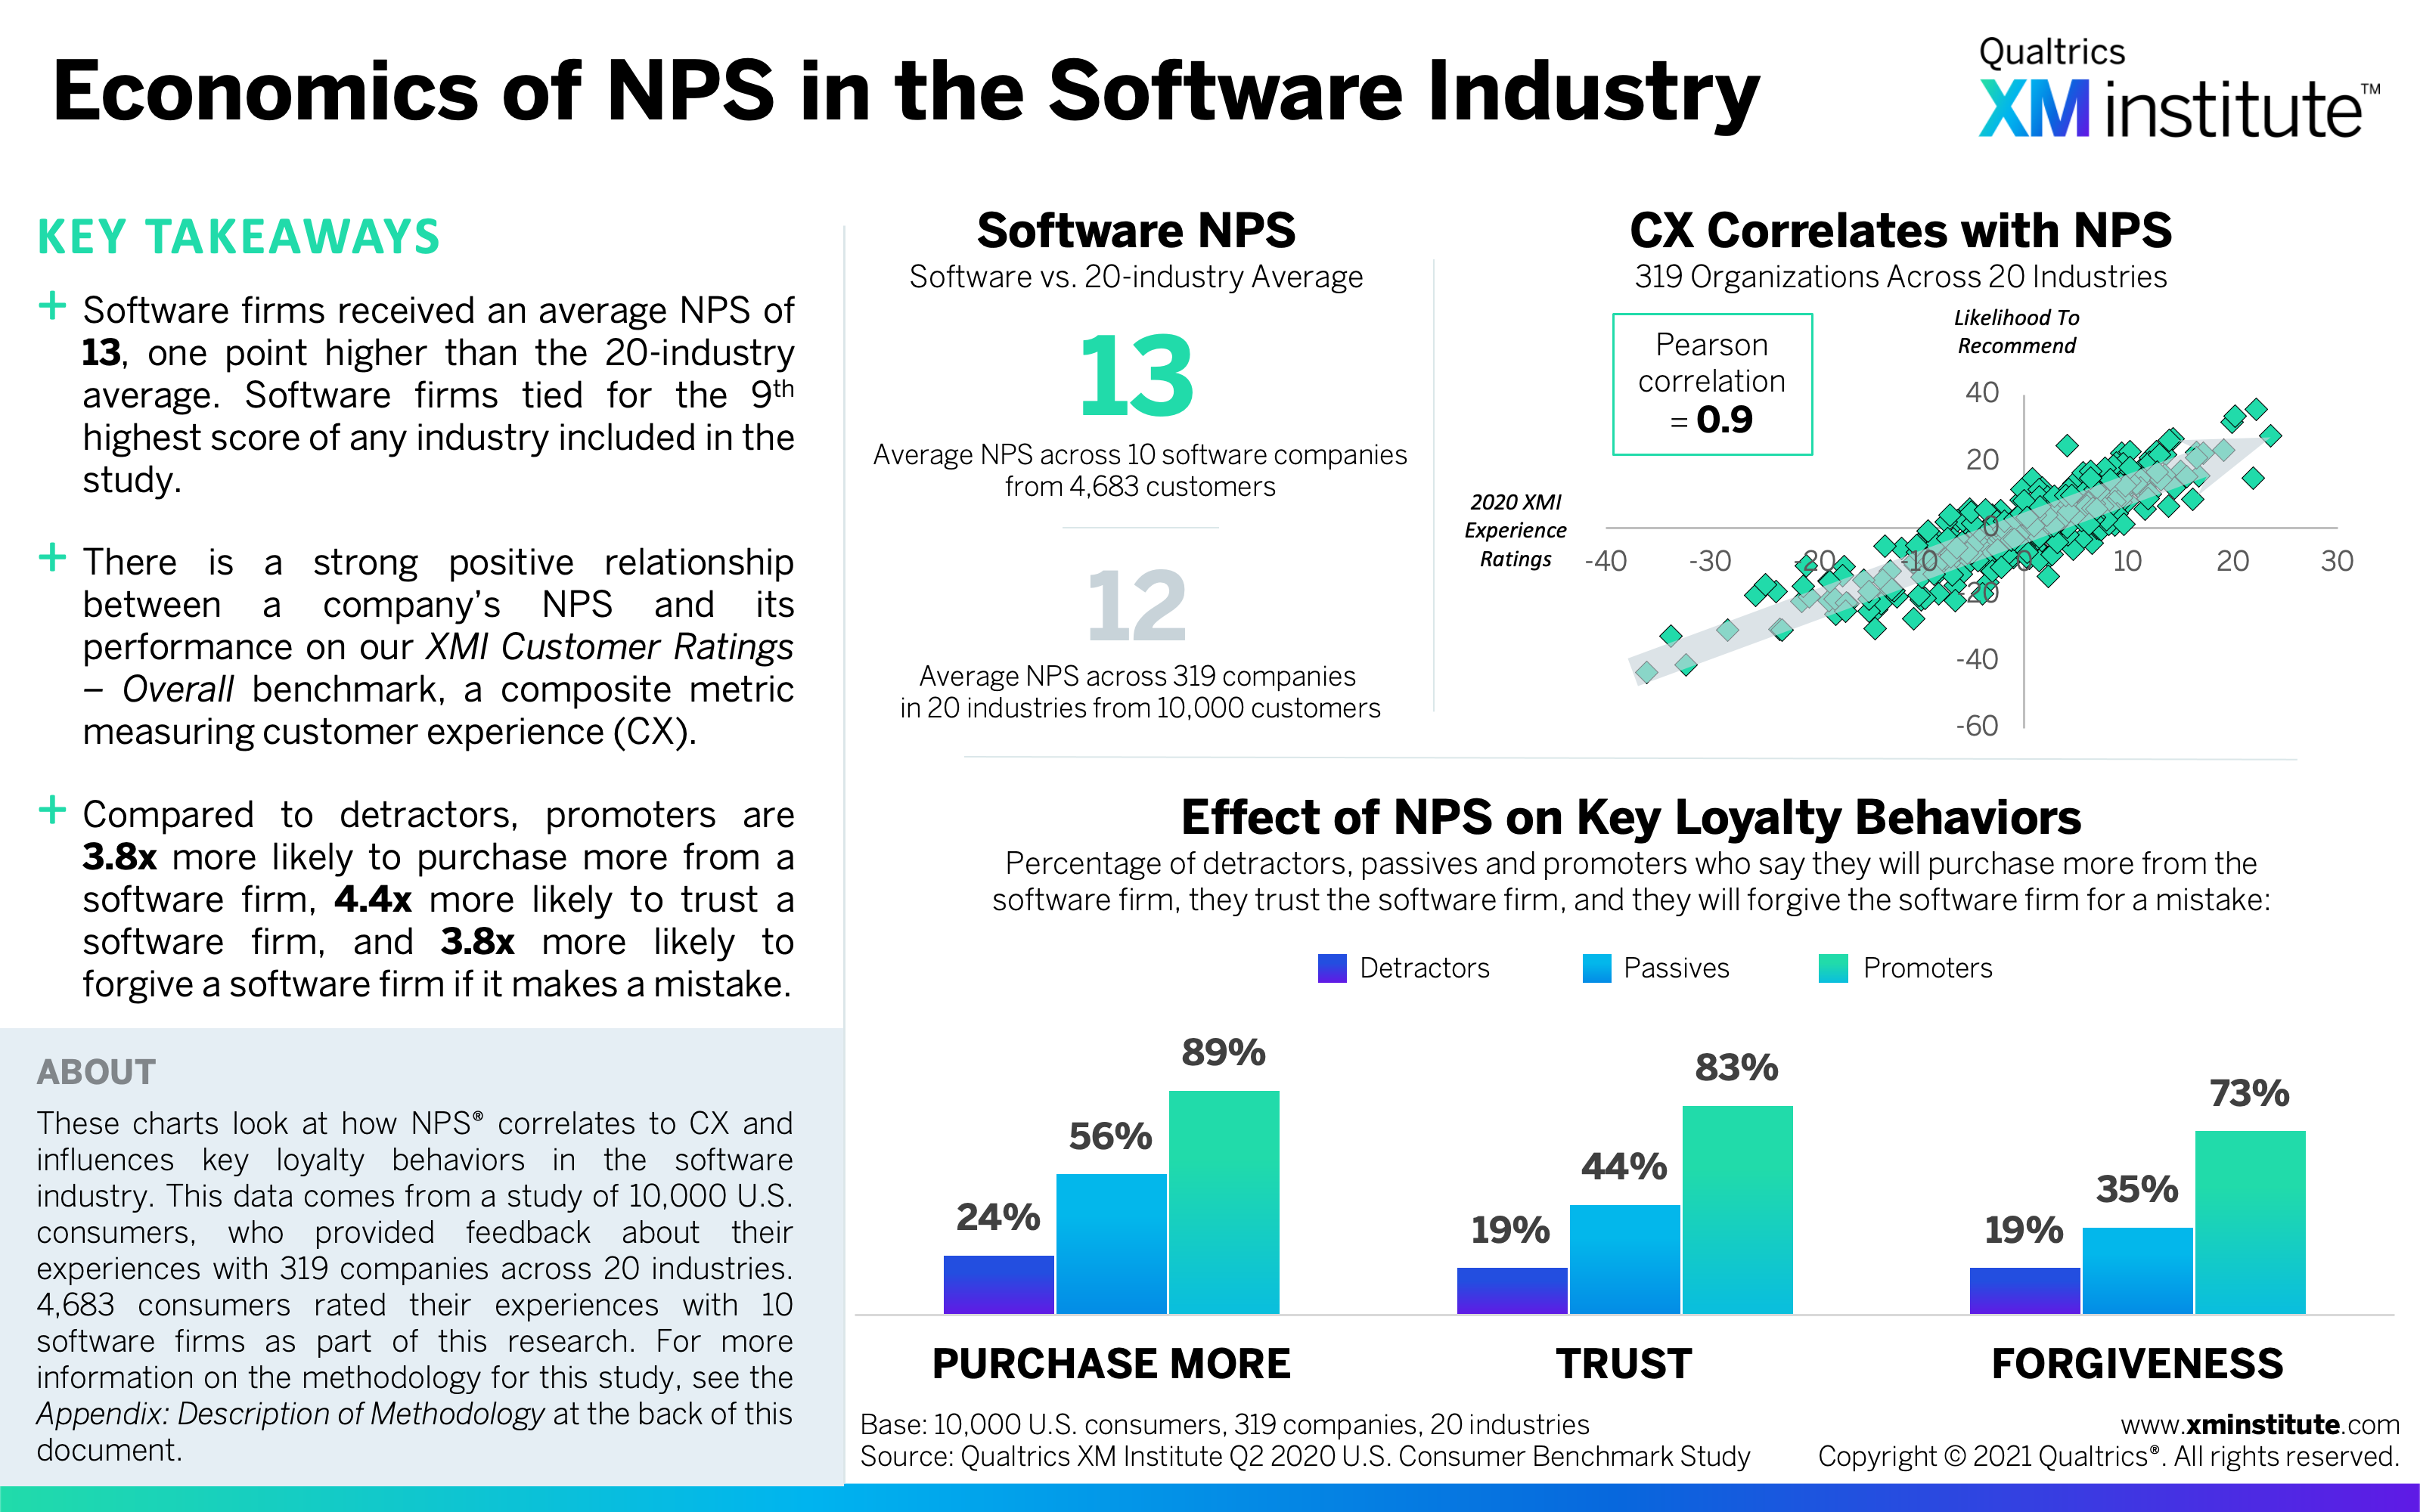
- Economics of NPS in the Software Industry (see Figure 16)
- Economics of NPS in the Streaming Media Industry (see Figure 17)
- Economics of NPS in the TV/ISP Industry (see Figure 18)
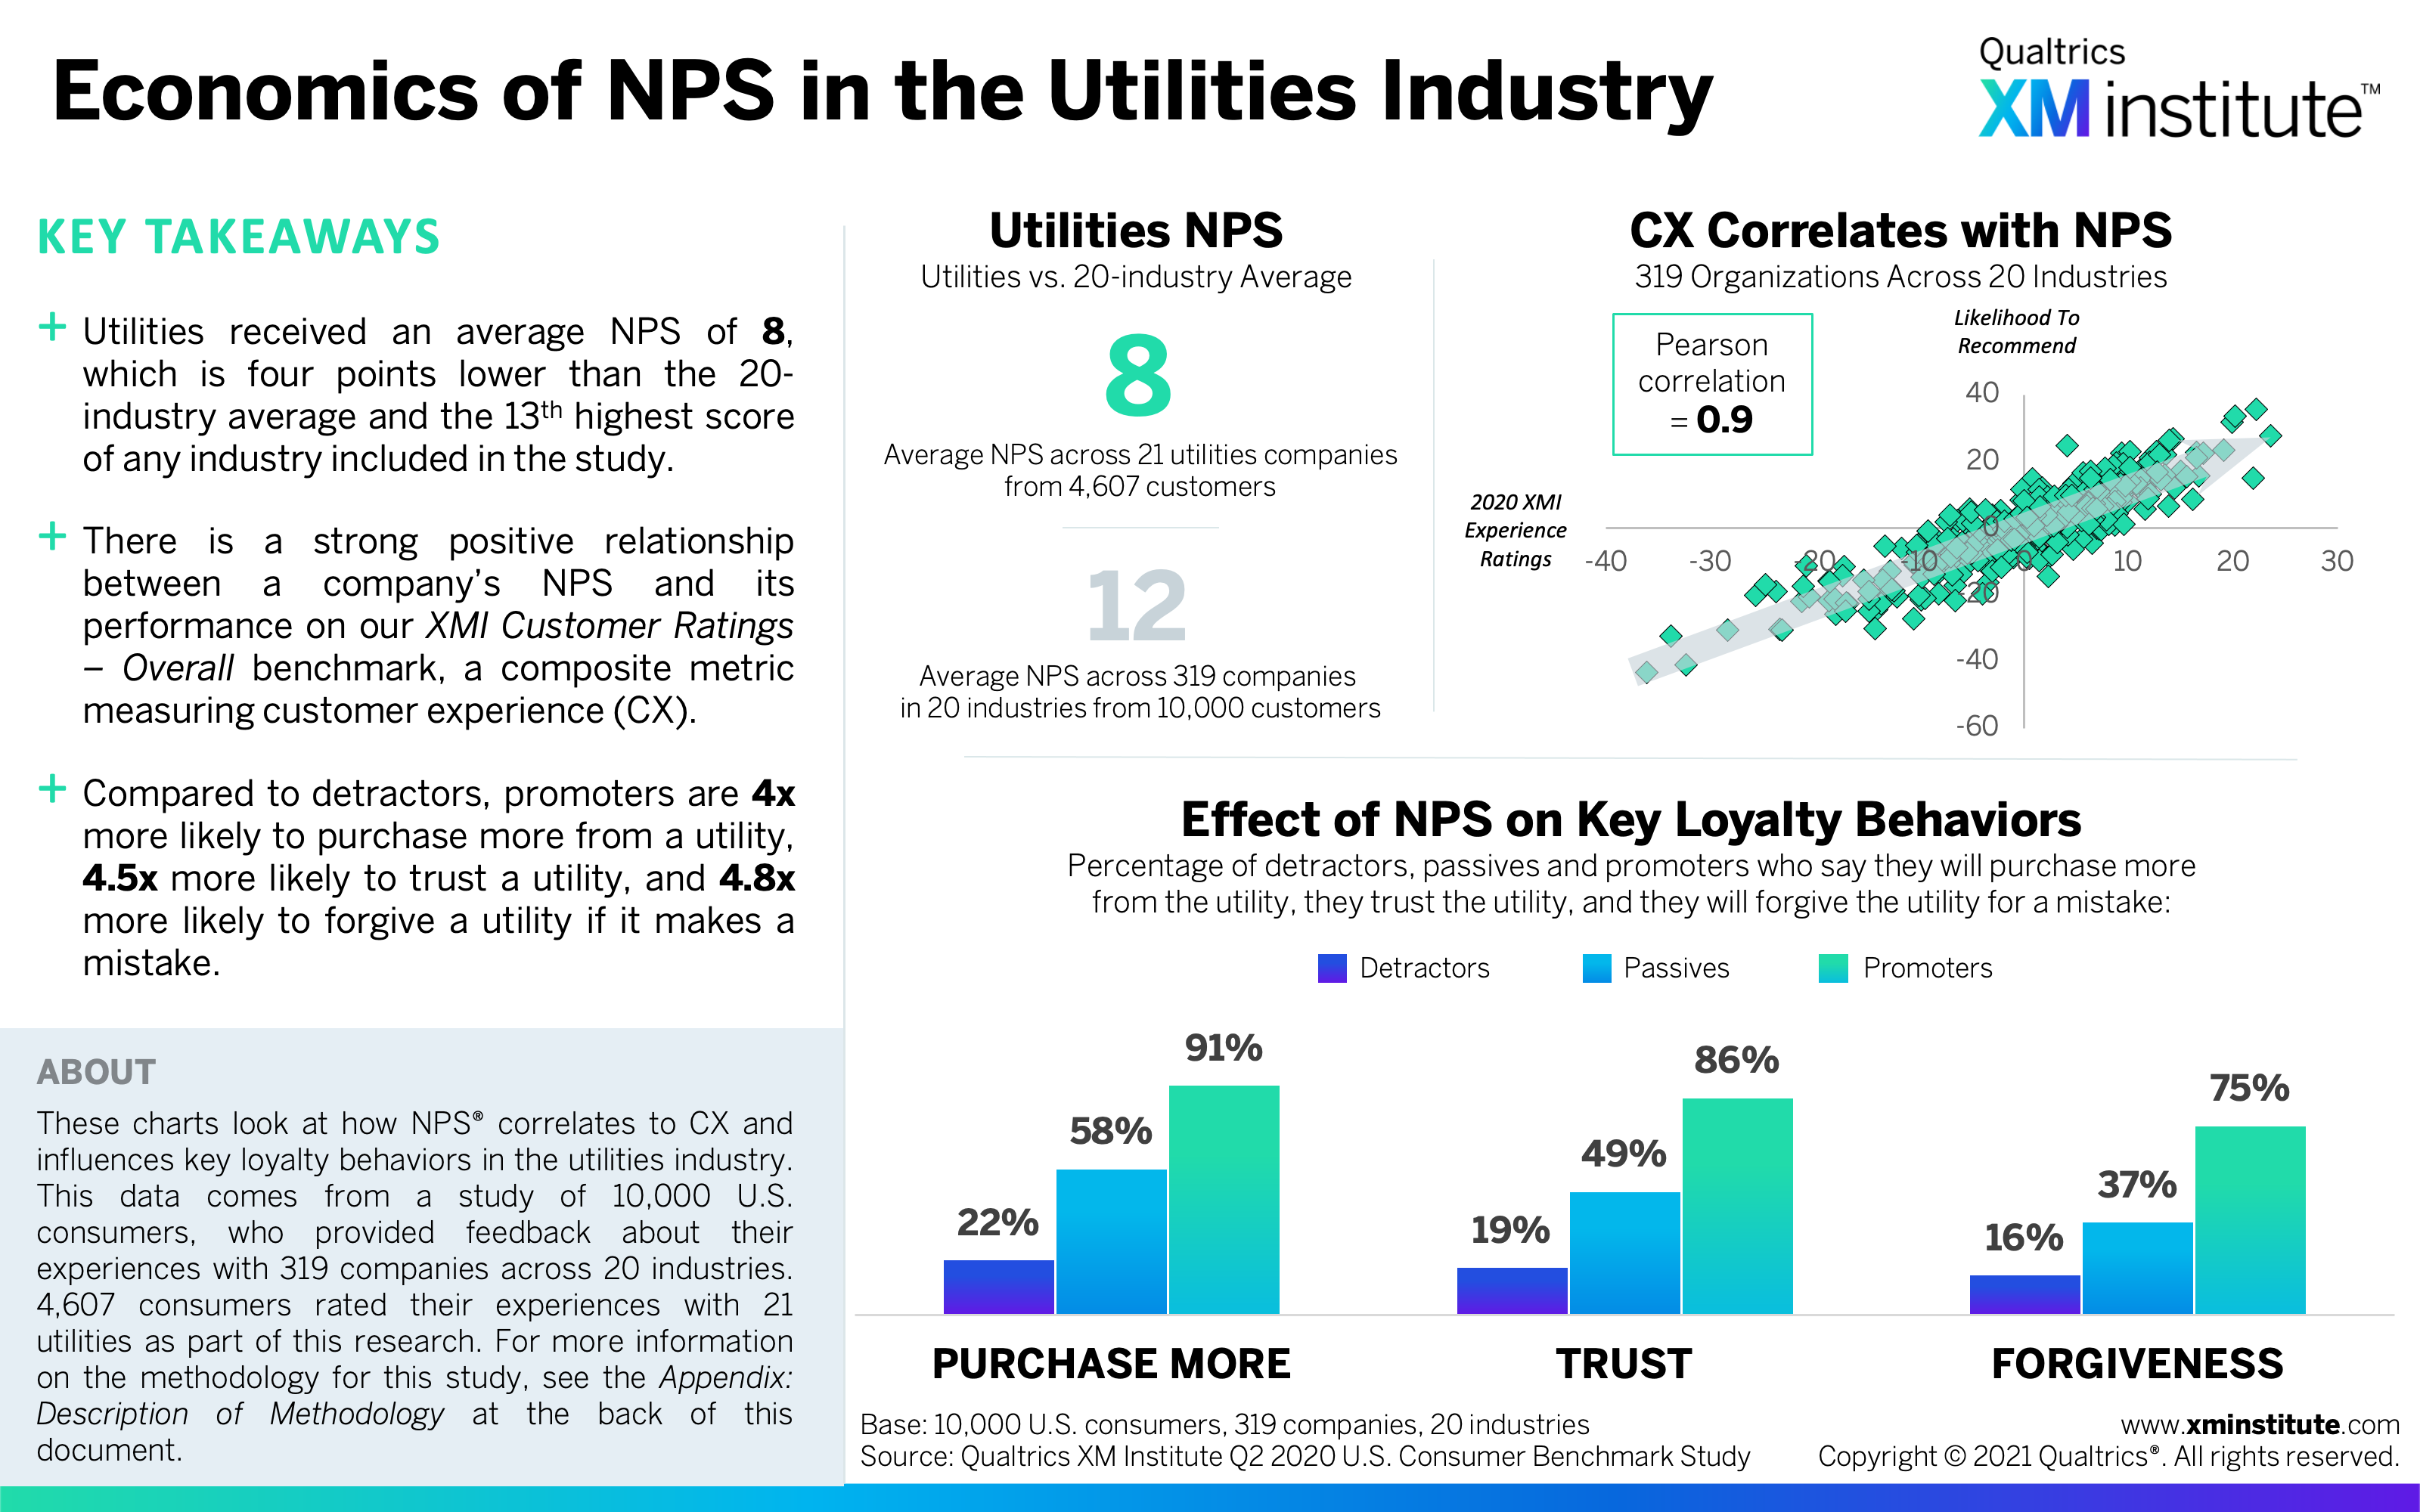
- Economics of NPS in the Utilities Industry (see Figure 19)
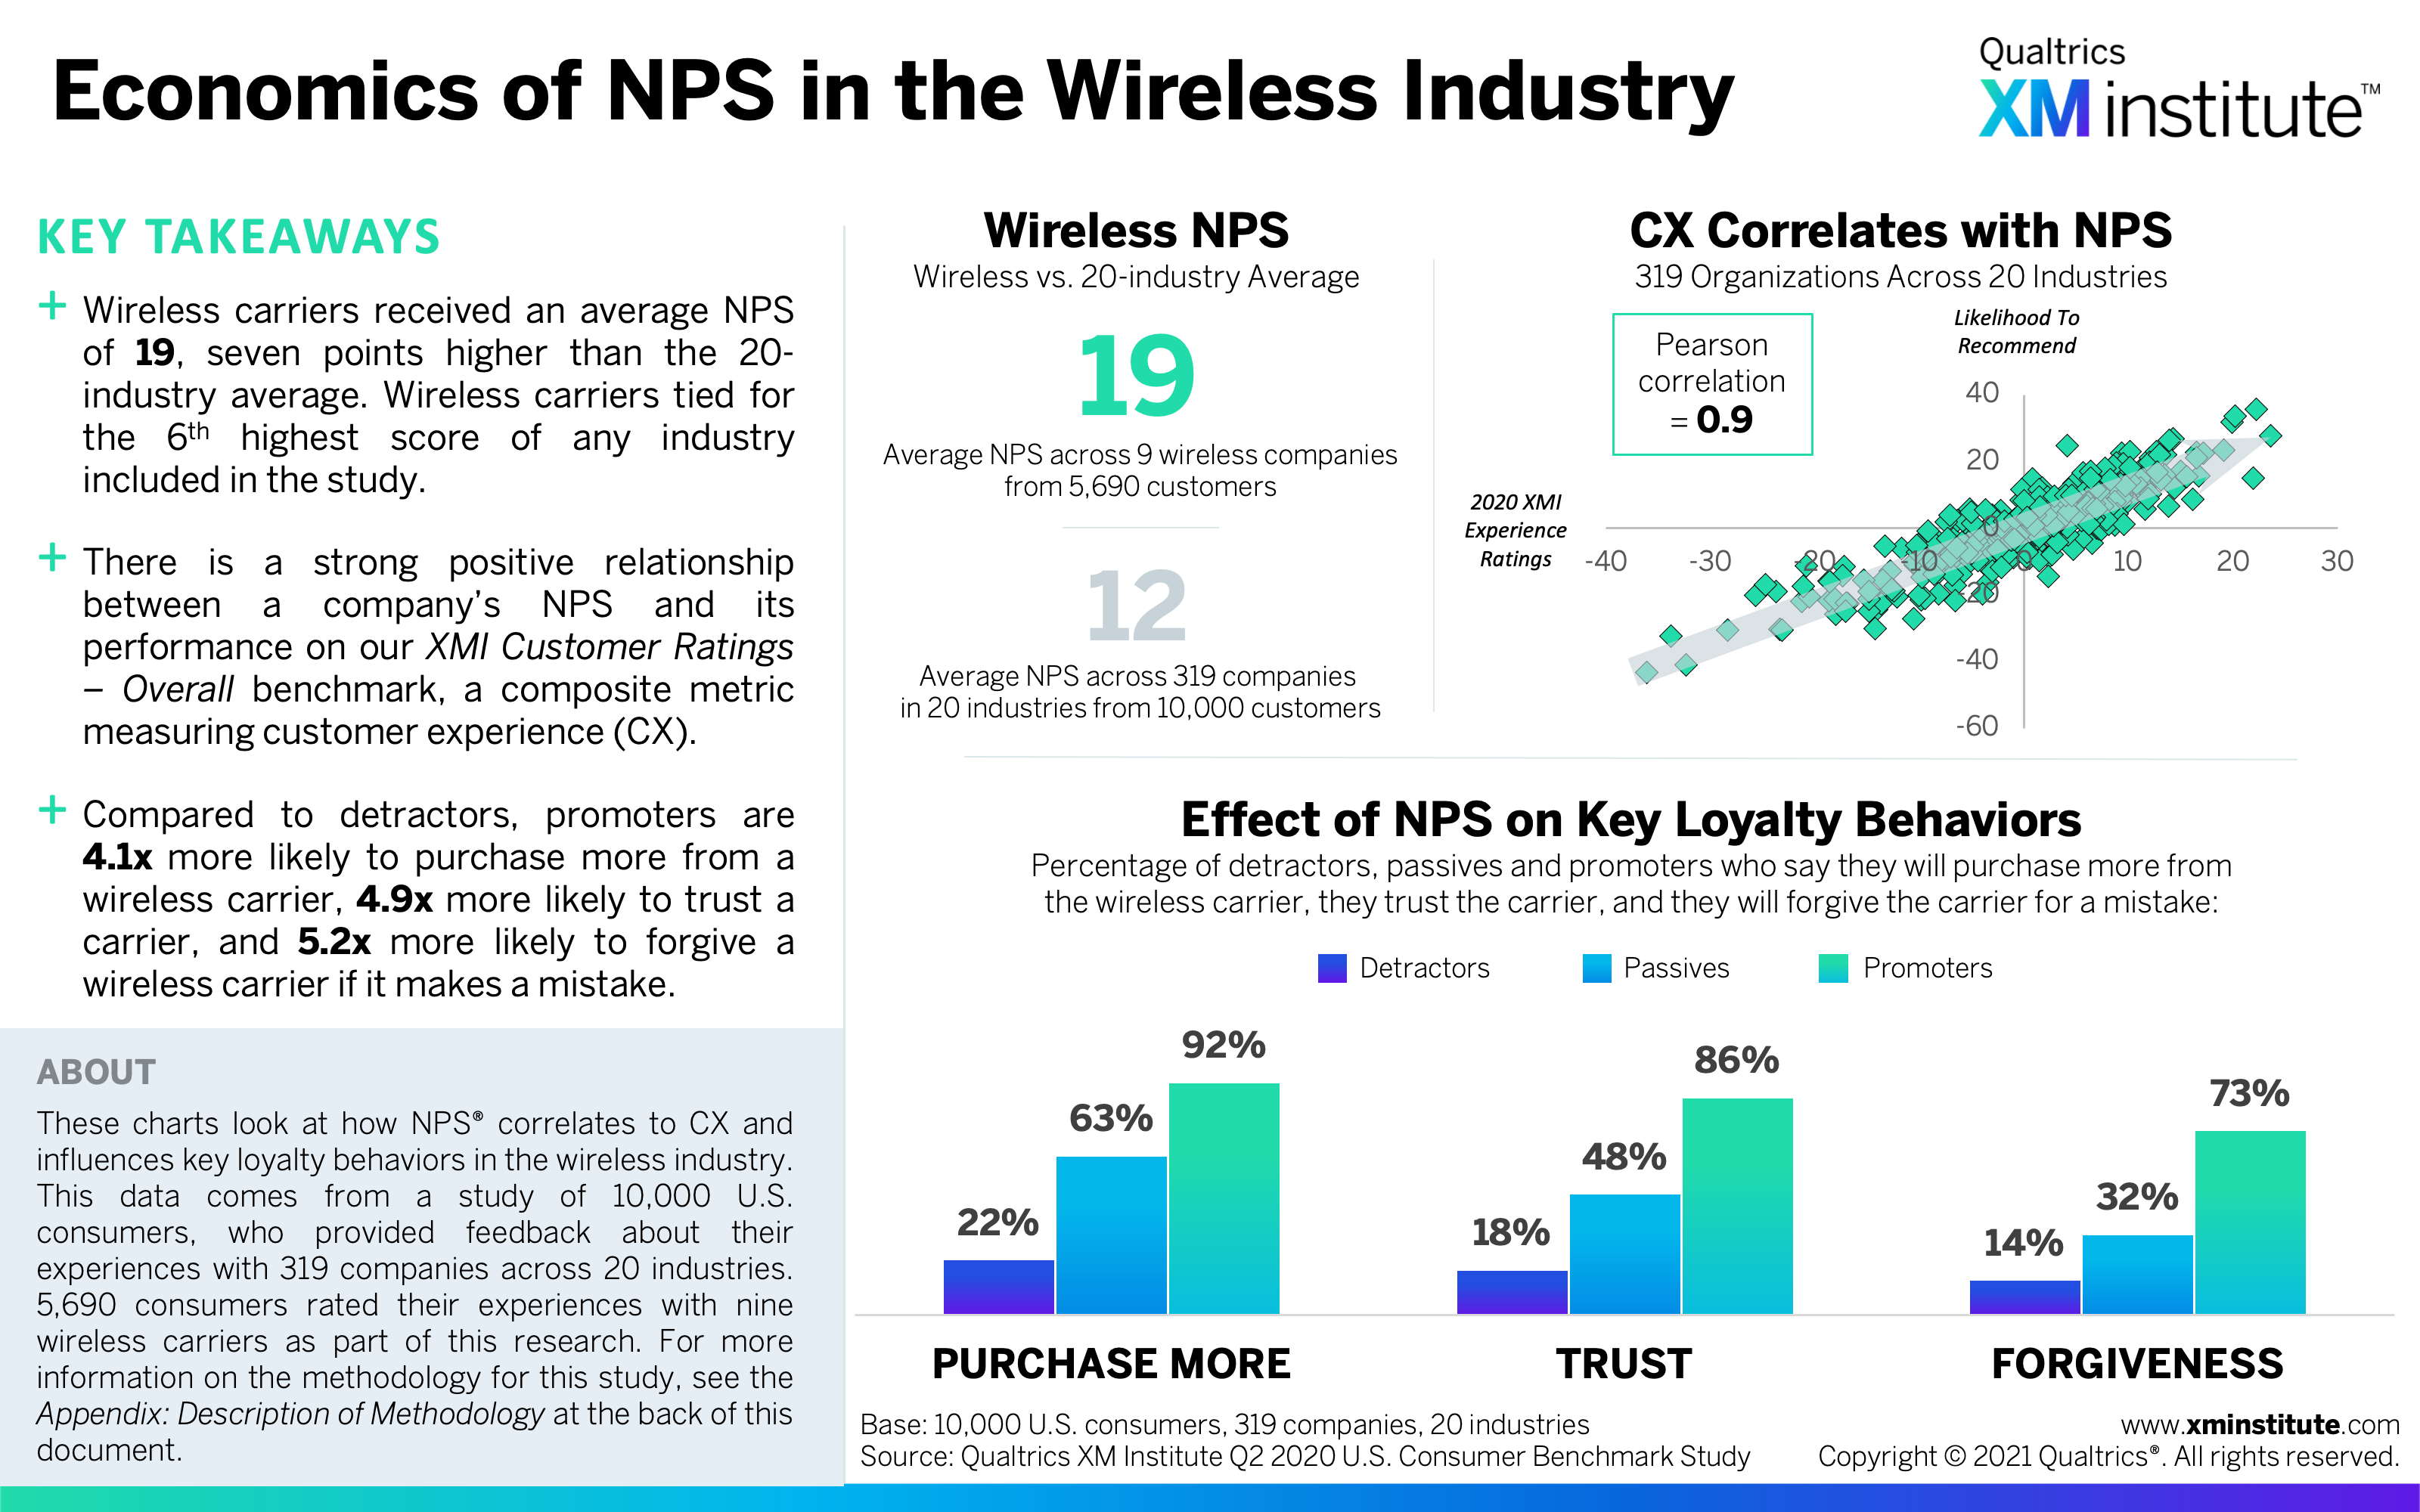
- Economics of NPS in the Wireless Industry (see Figure 20)
- Appendix: Description of Methodology (see Figure 21)
Economics of NPS for Individual Industries
Find the Economics of NPS for each individual industry below:


