Key Findings
Many organizations across the United States use Net Promoter Score® (NPS®) as a key metric to understand customer loyalty and the quality of their customer experience. In this data snapshot, we examine the relationship between NPS and customer experience and share key insights on how loyalty differs according to NPS across 22 industries. Key findings include:
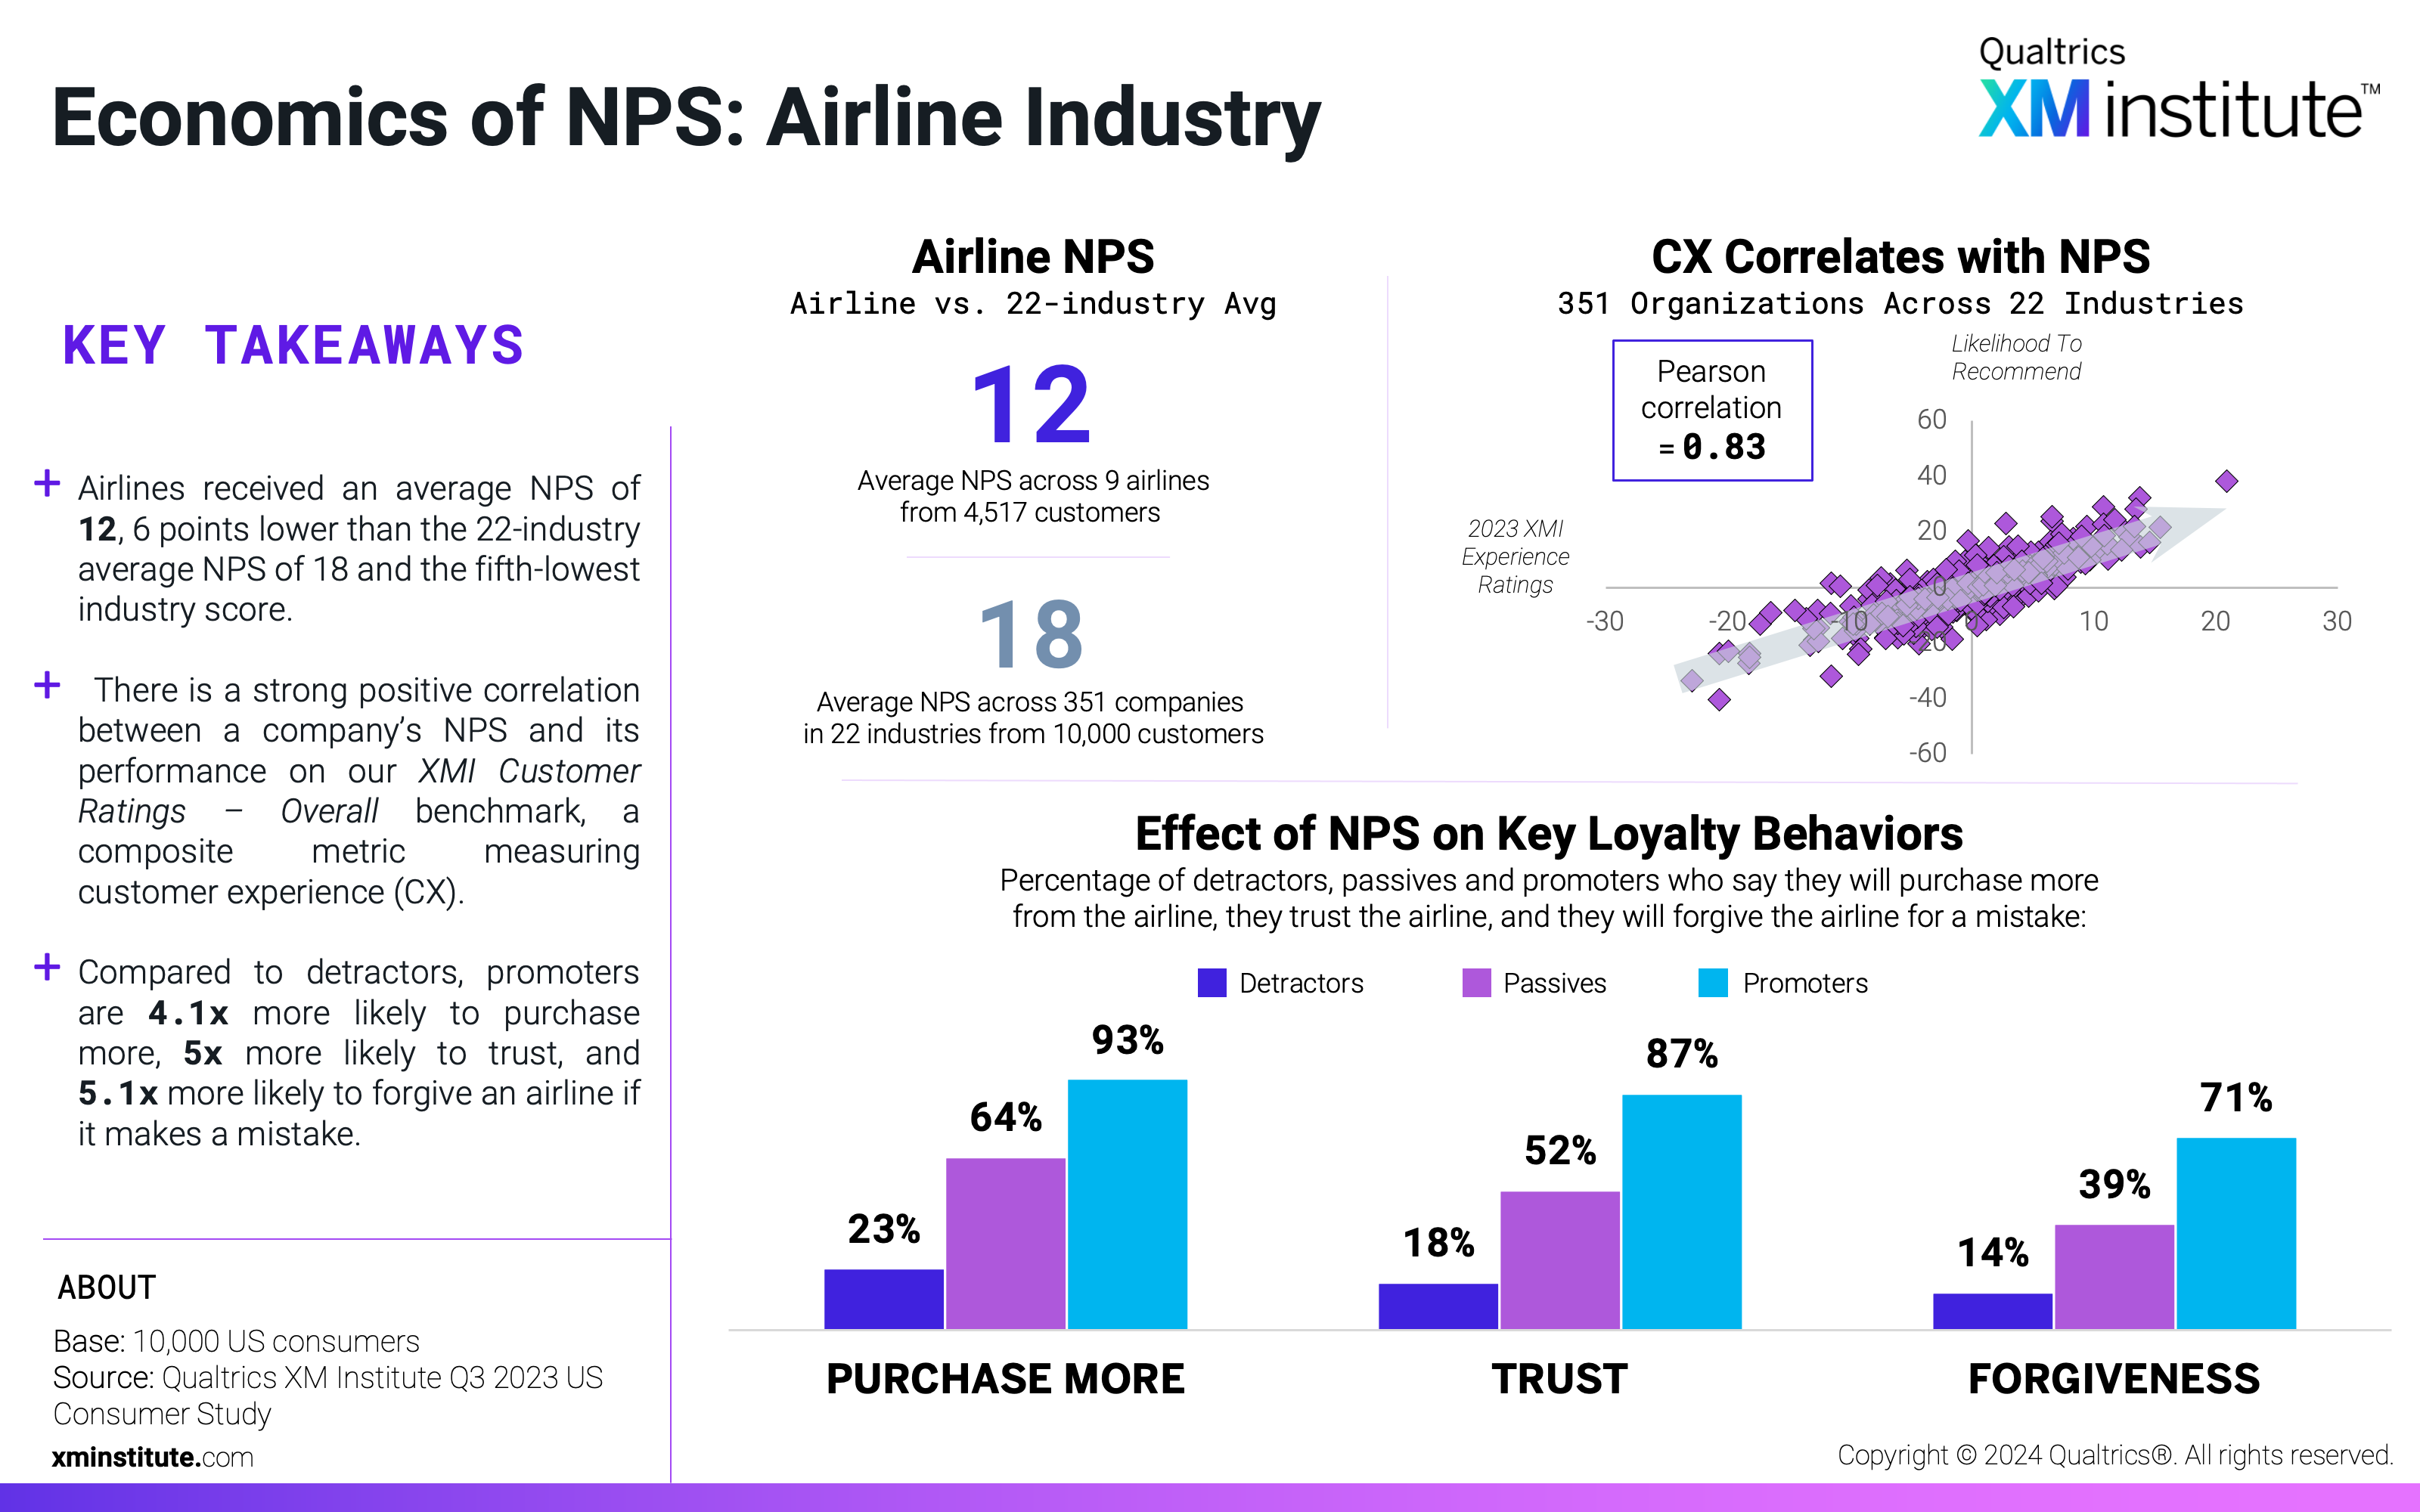
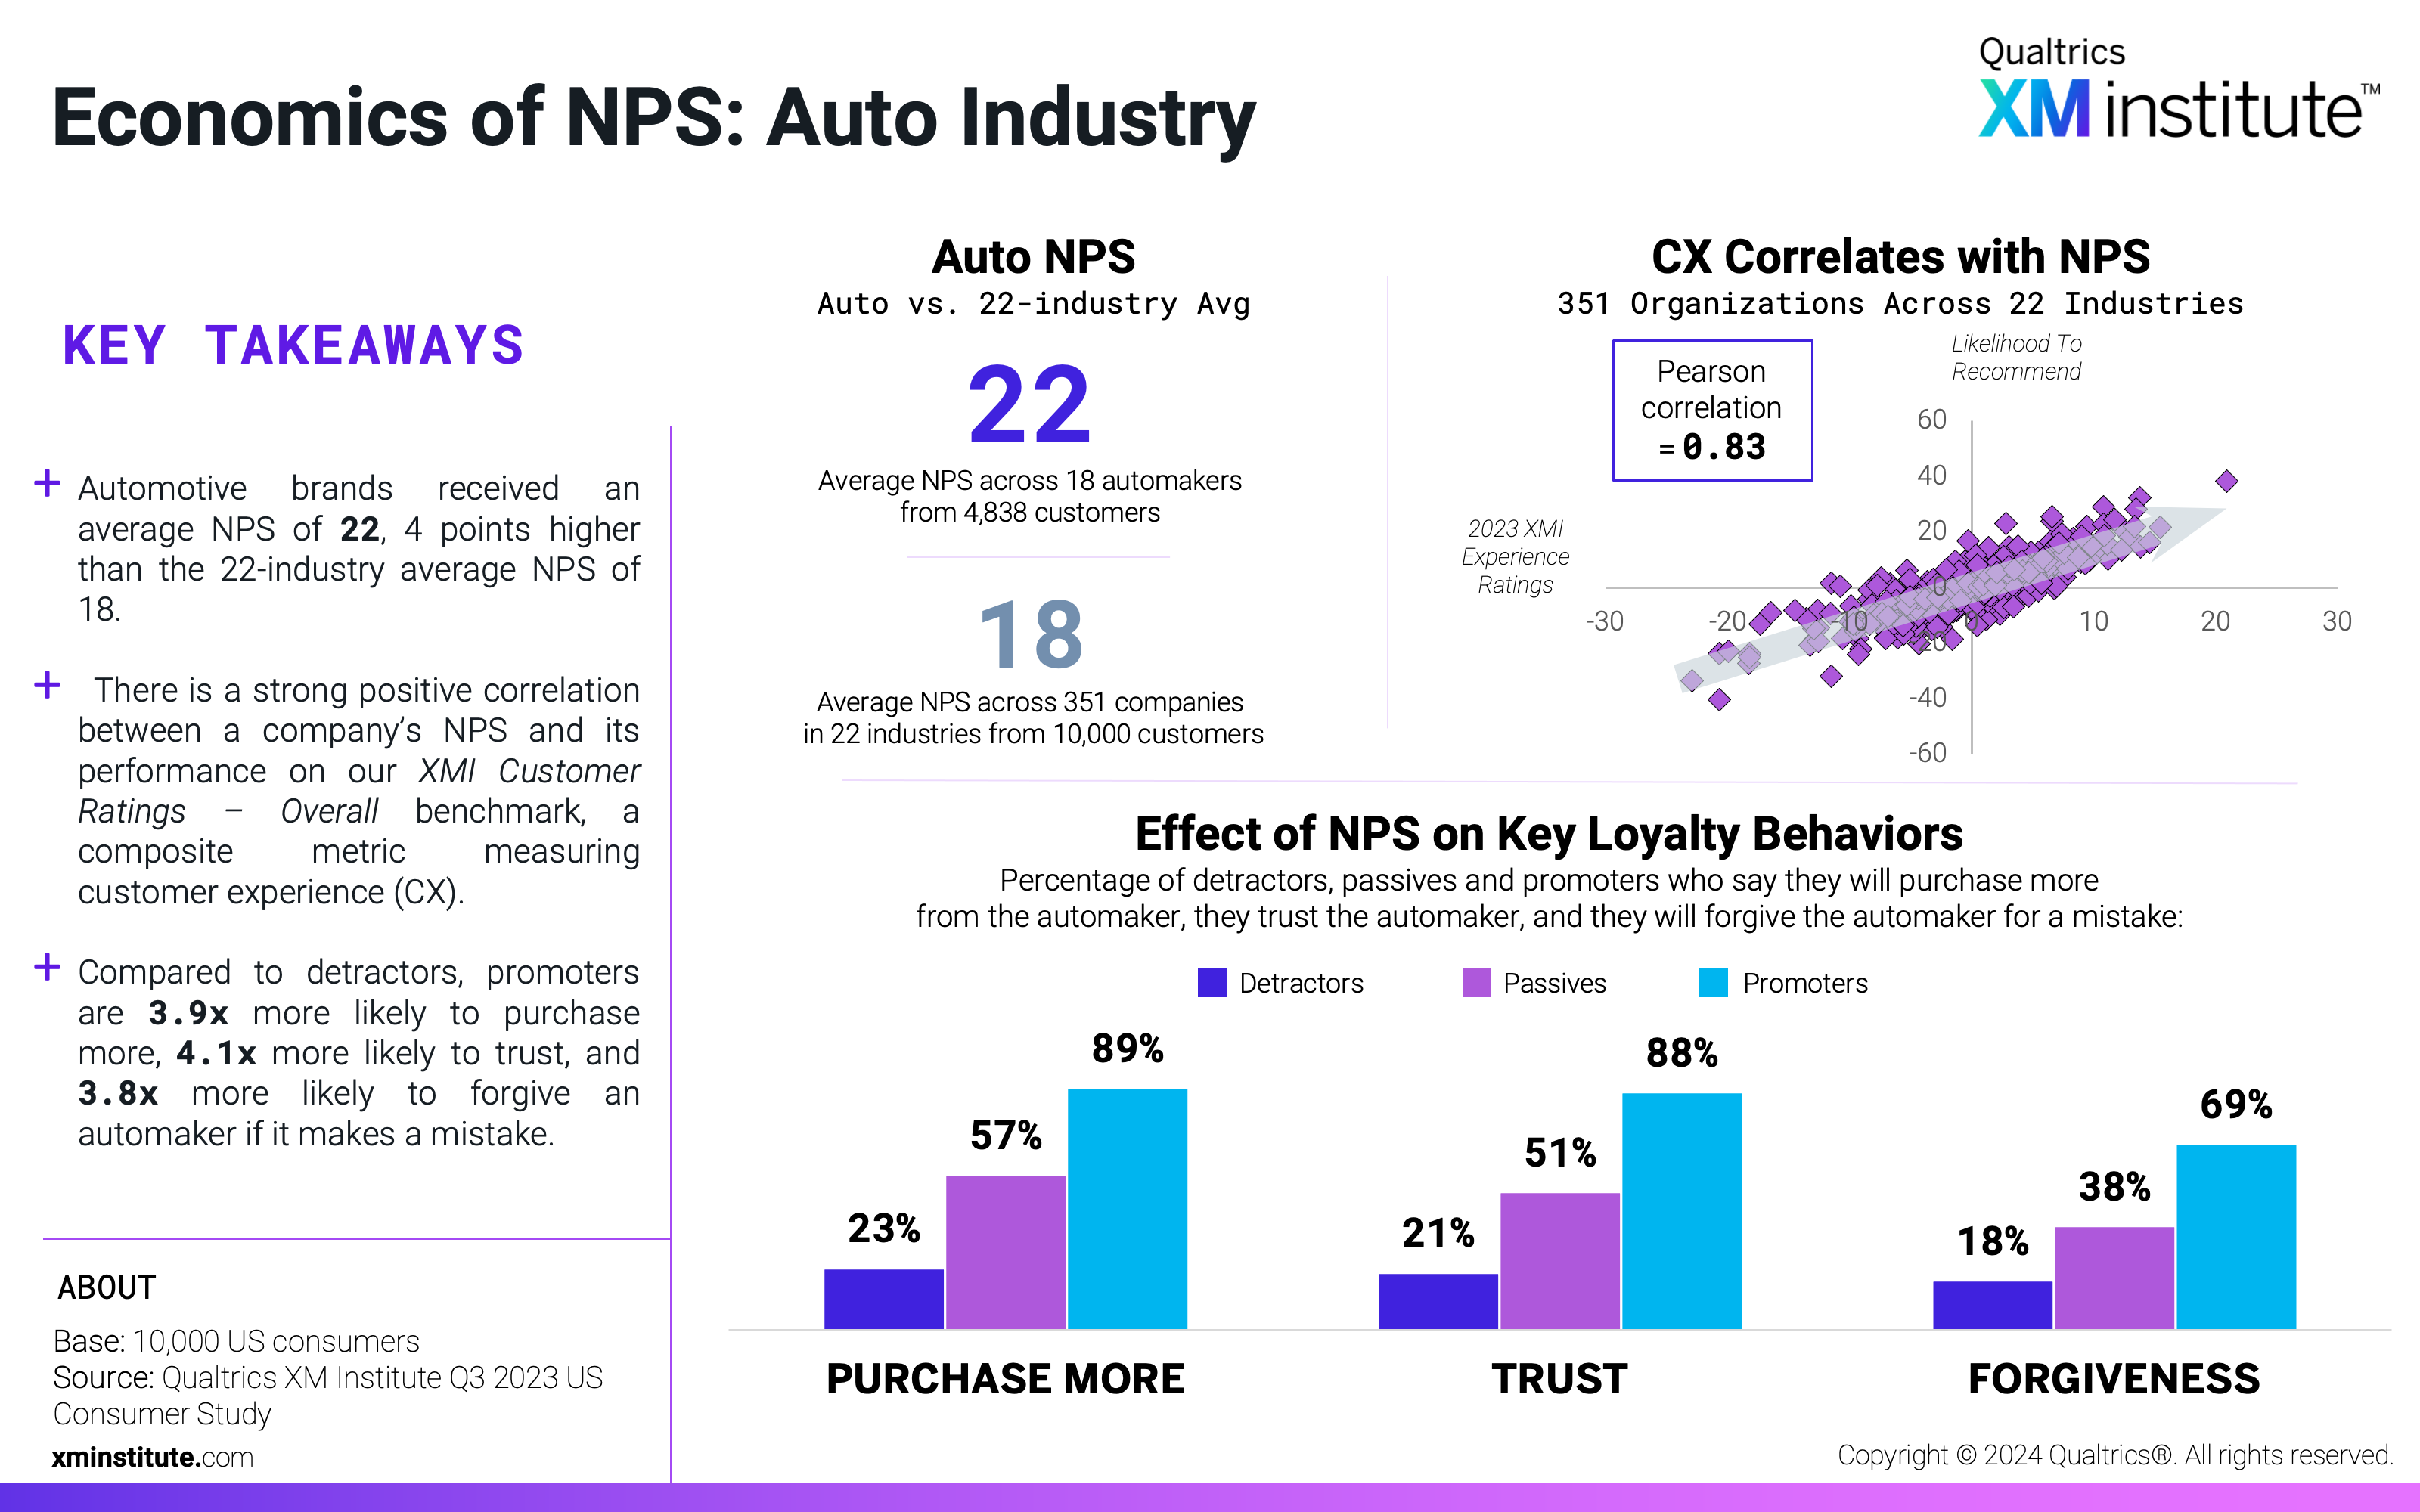
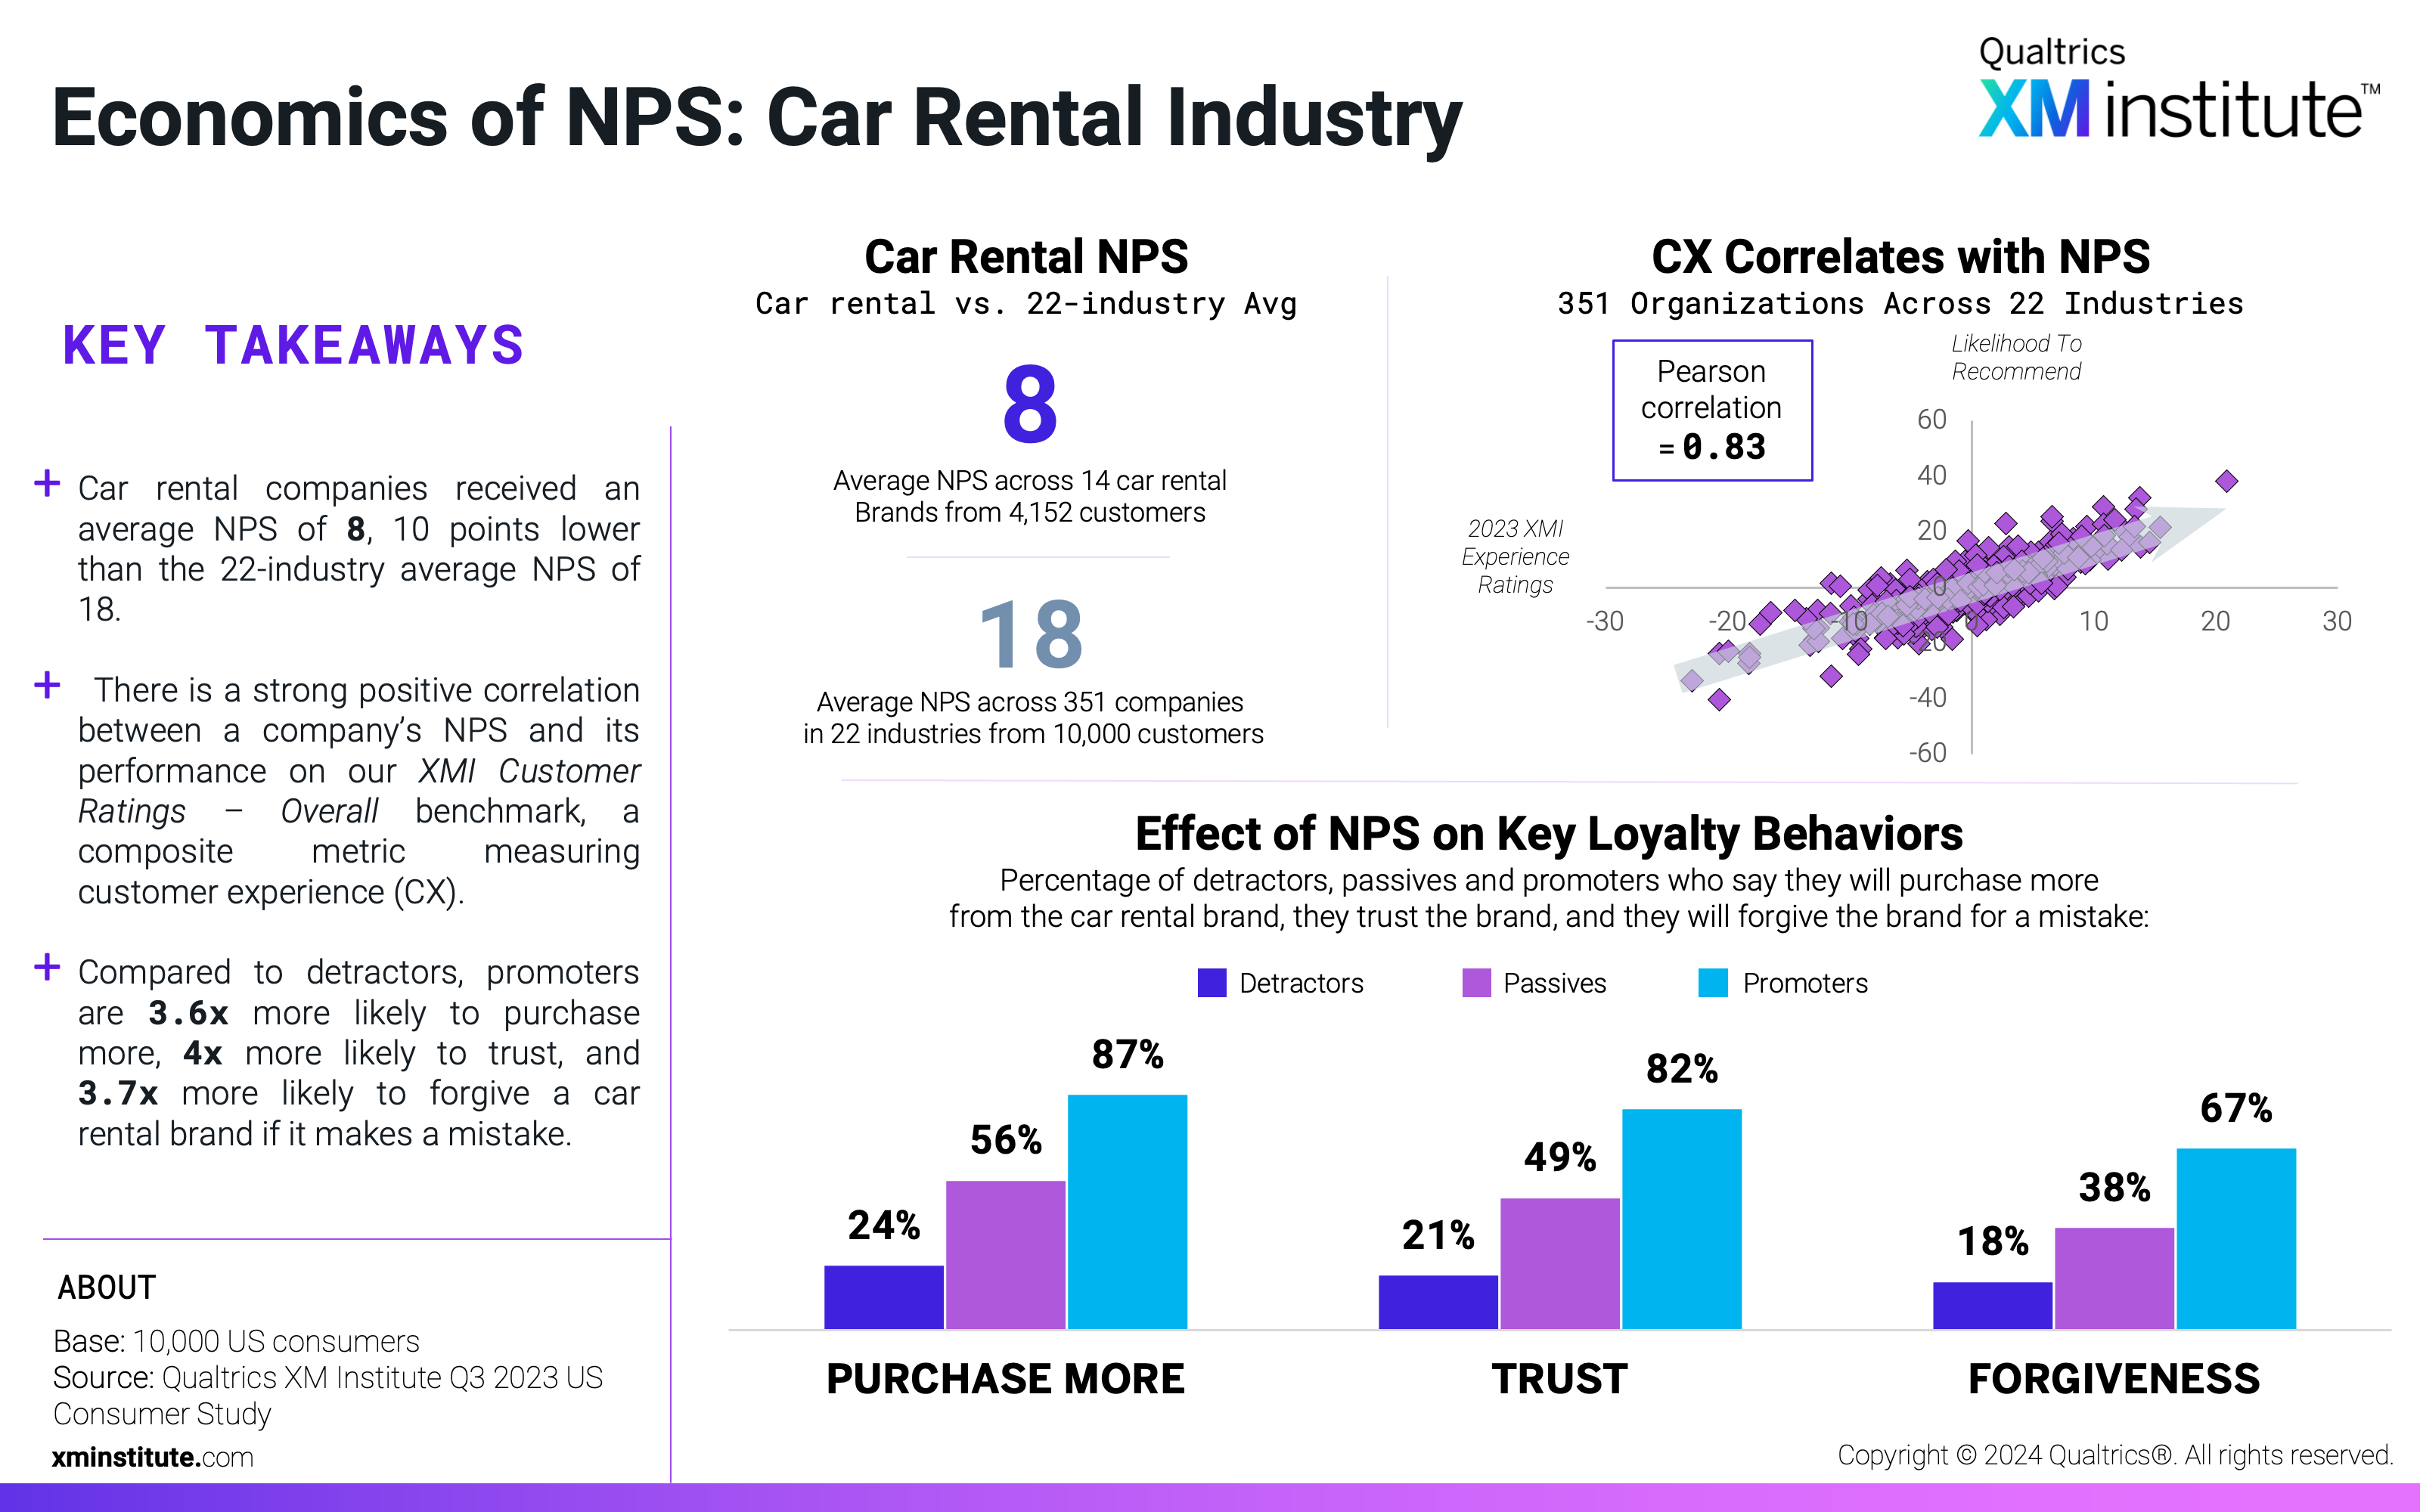
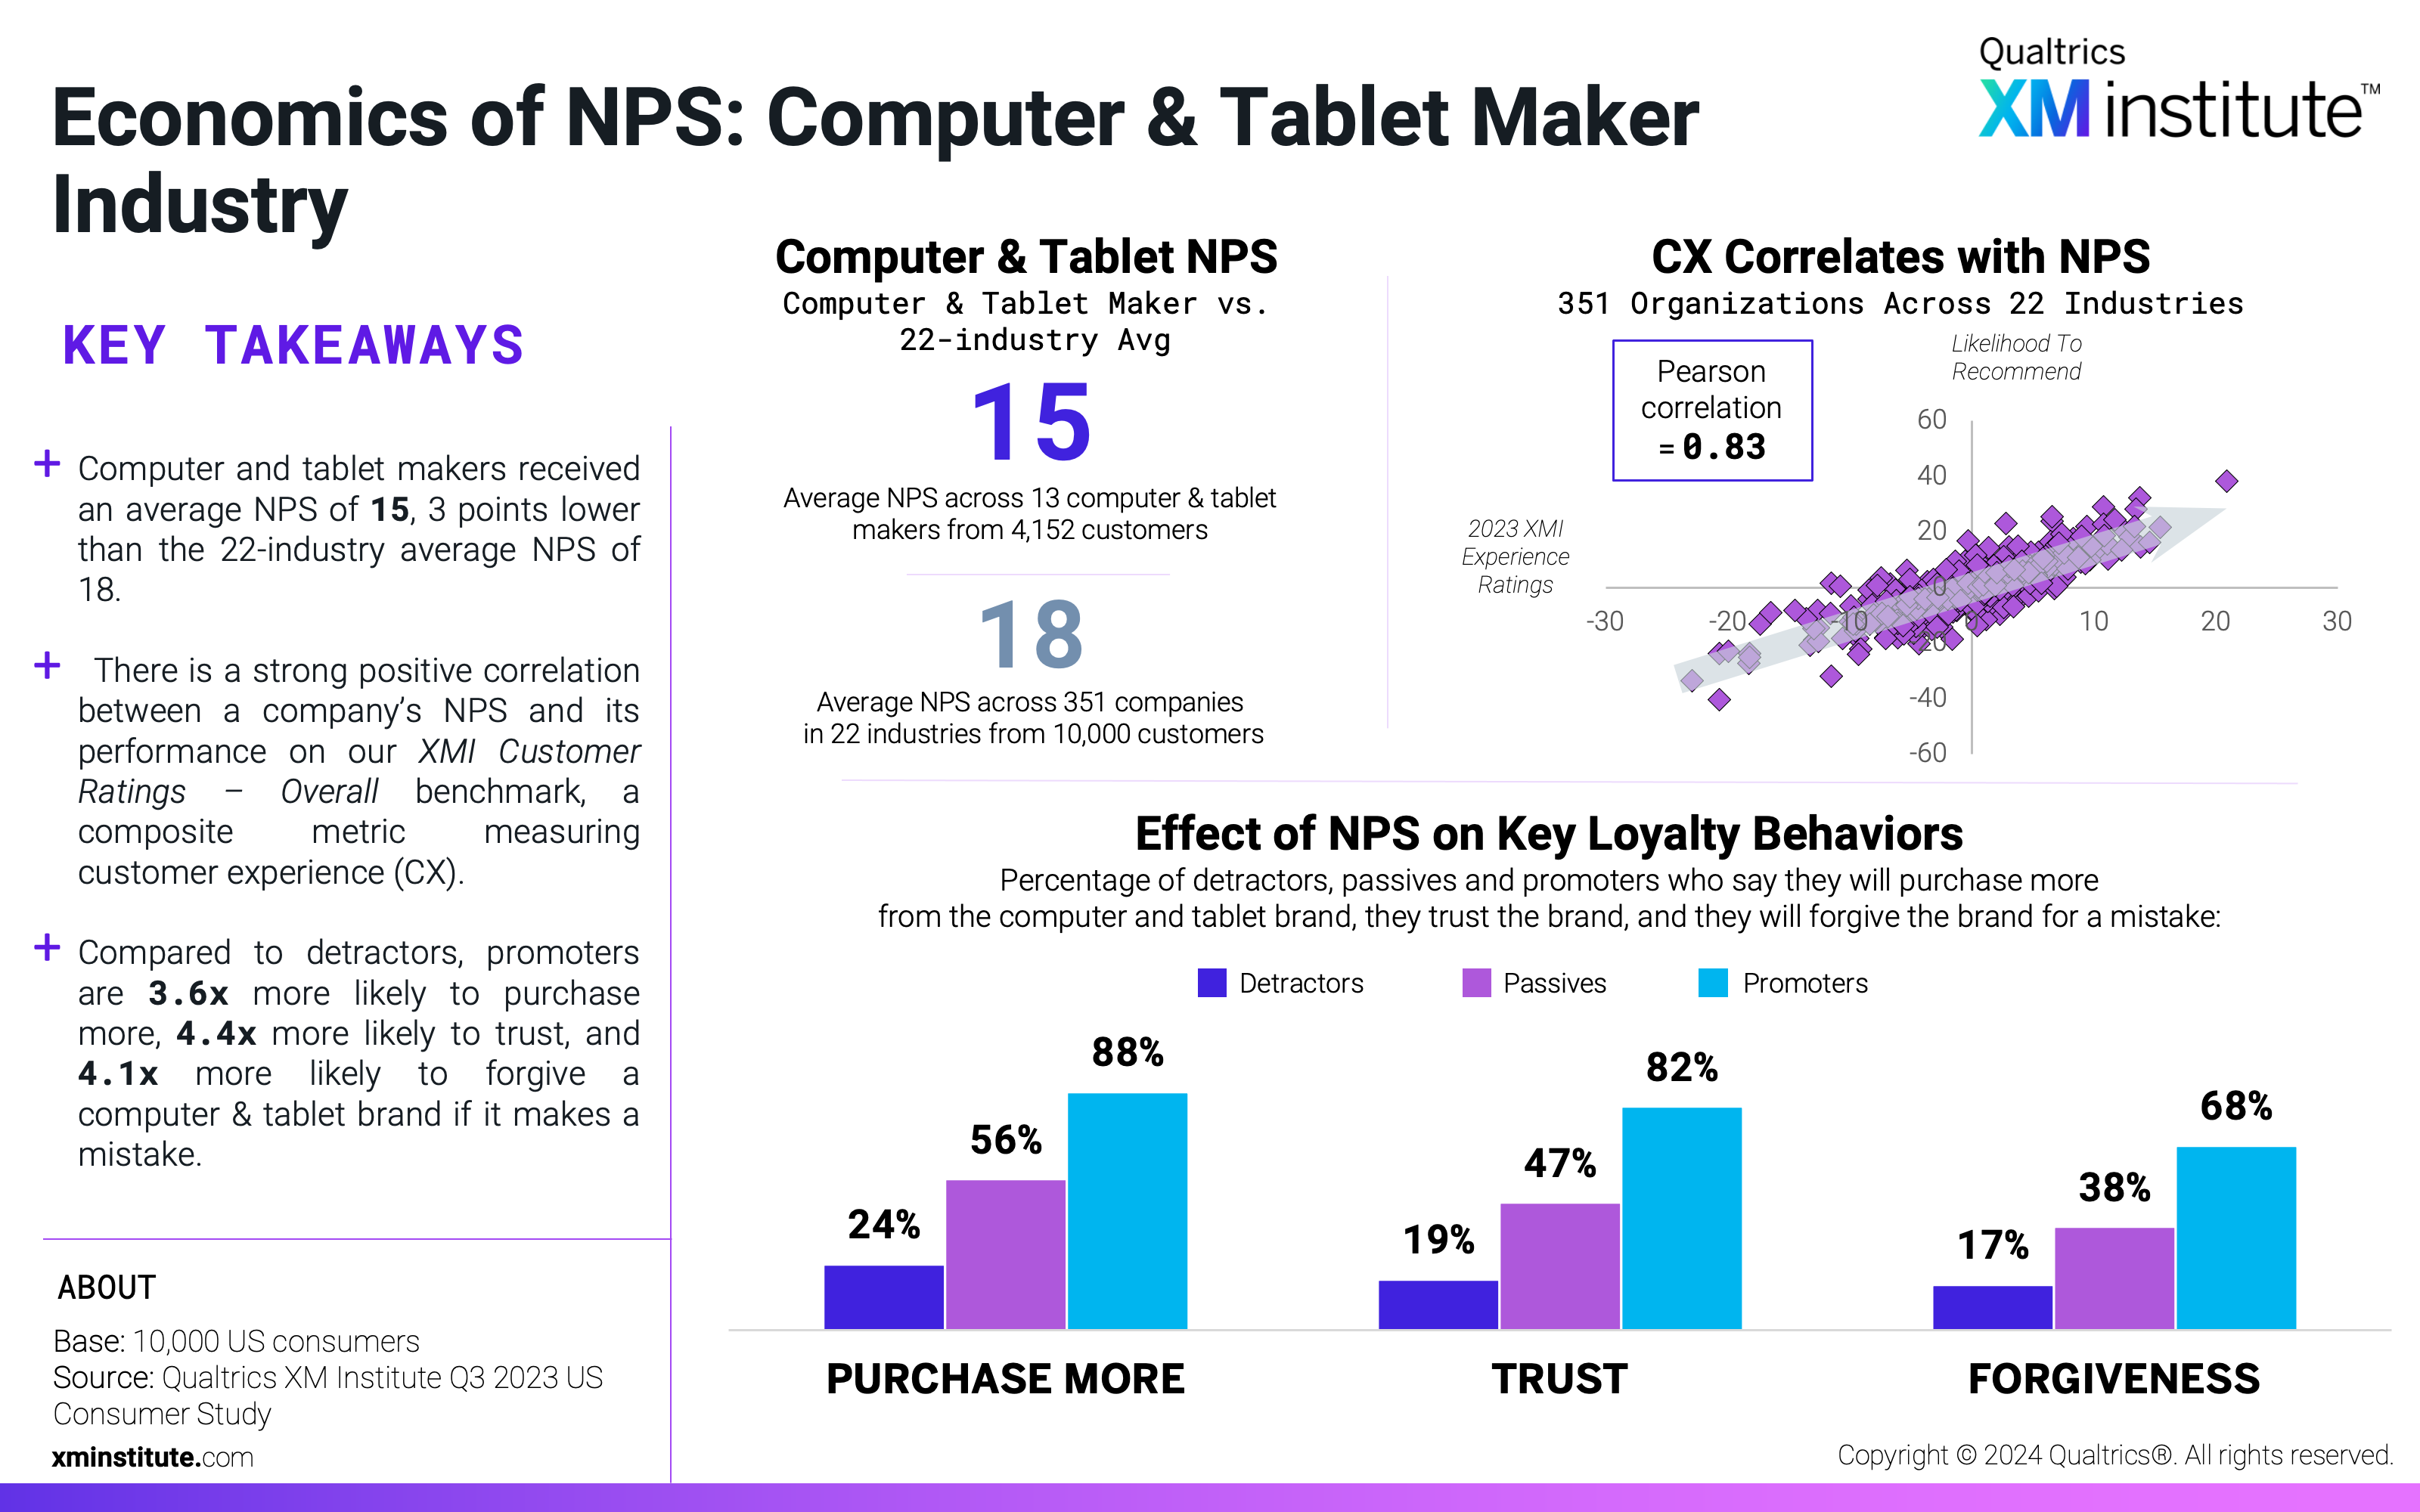
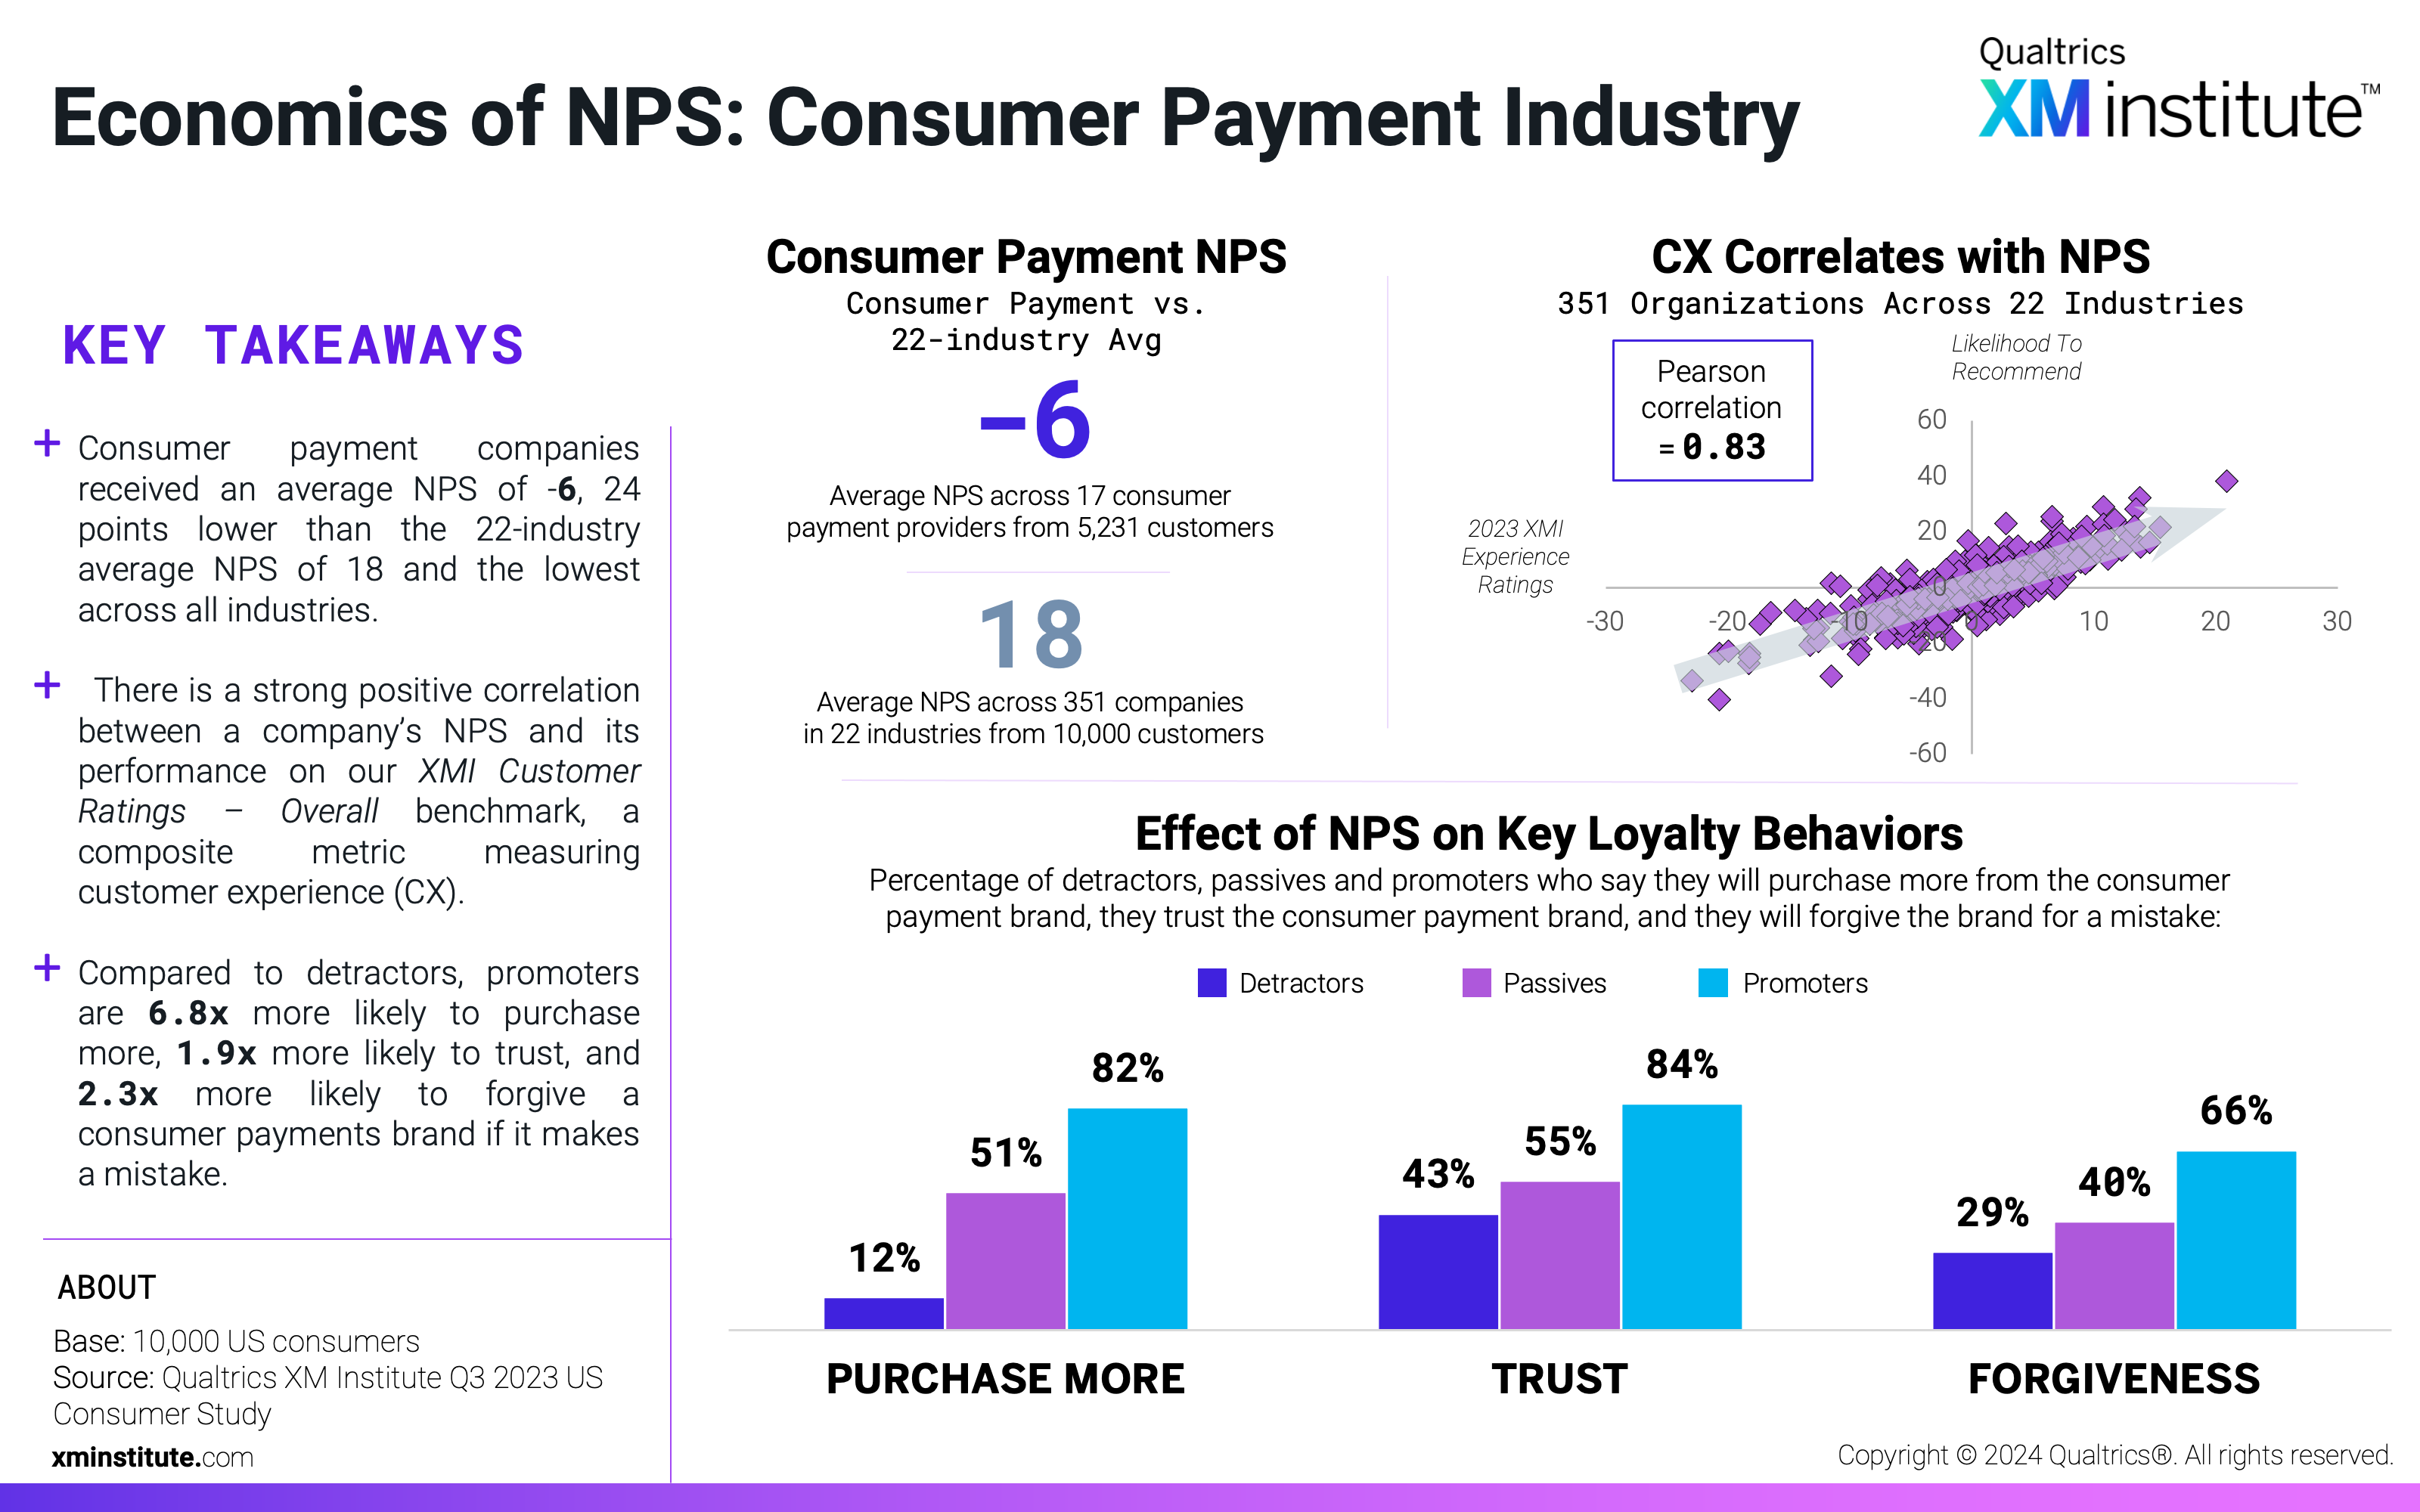
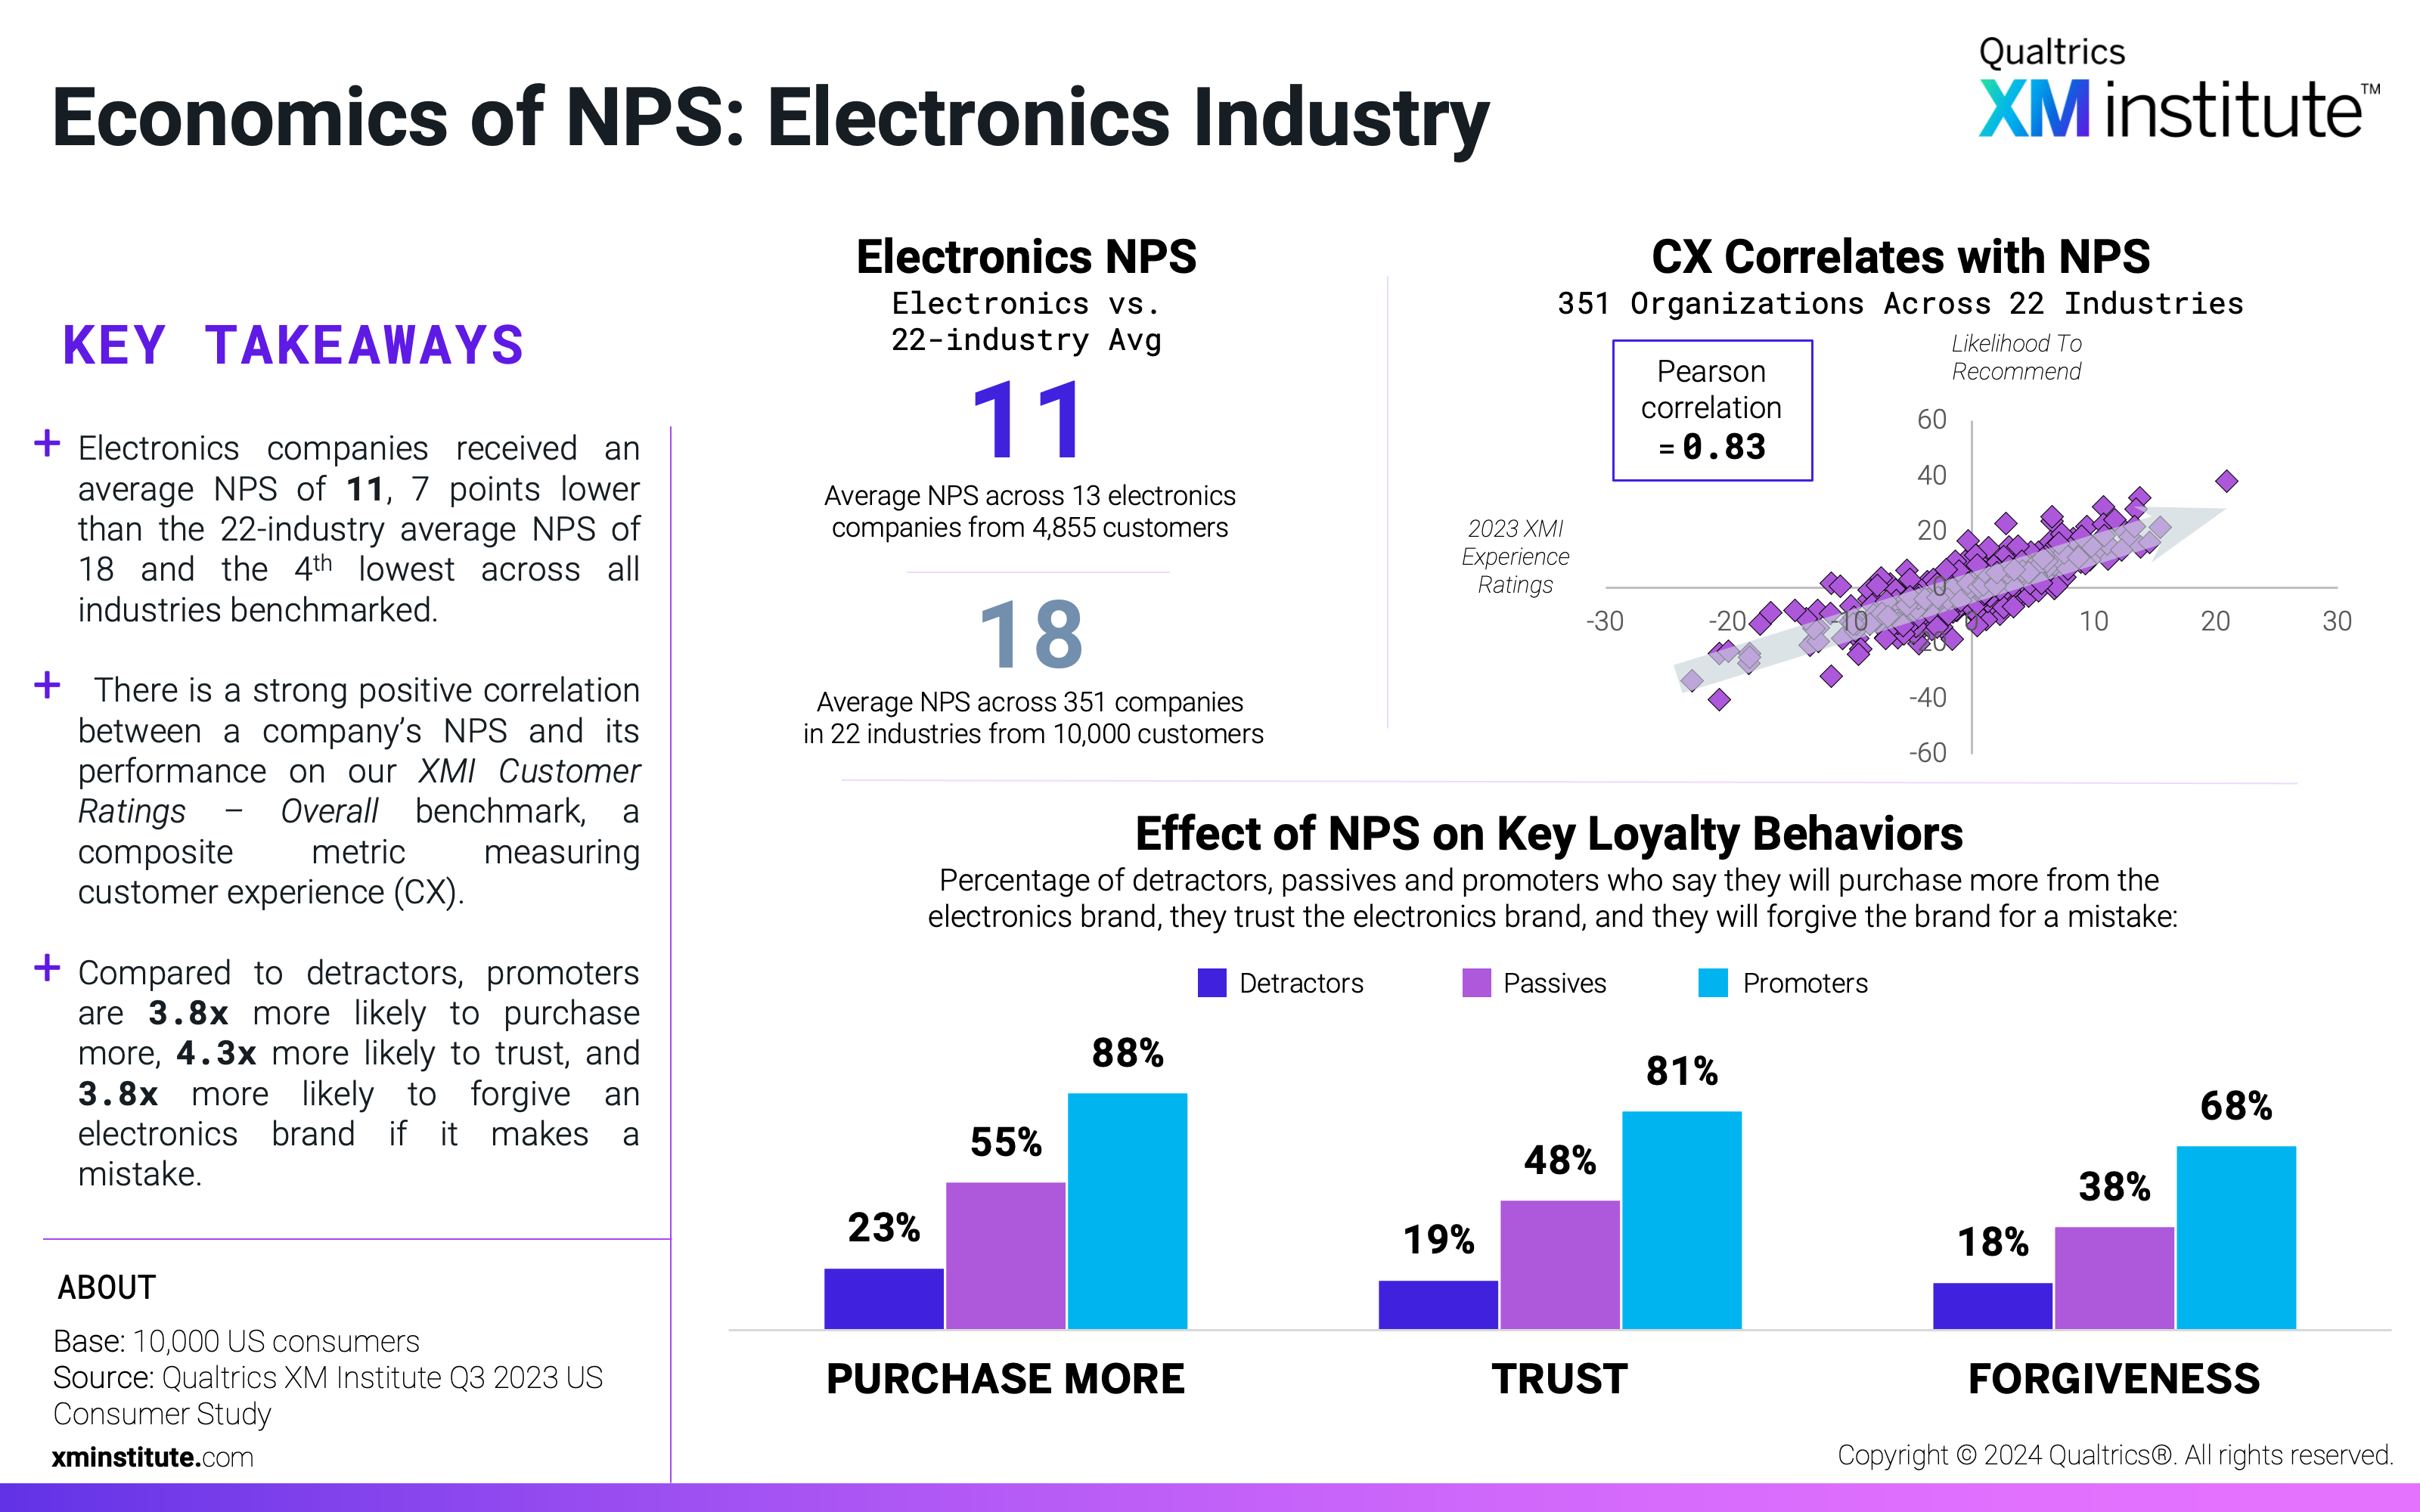
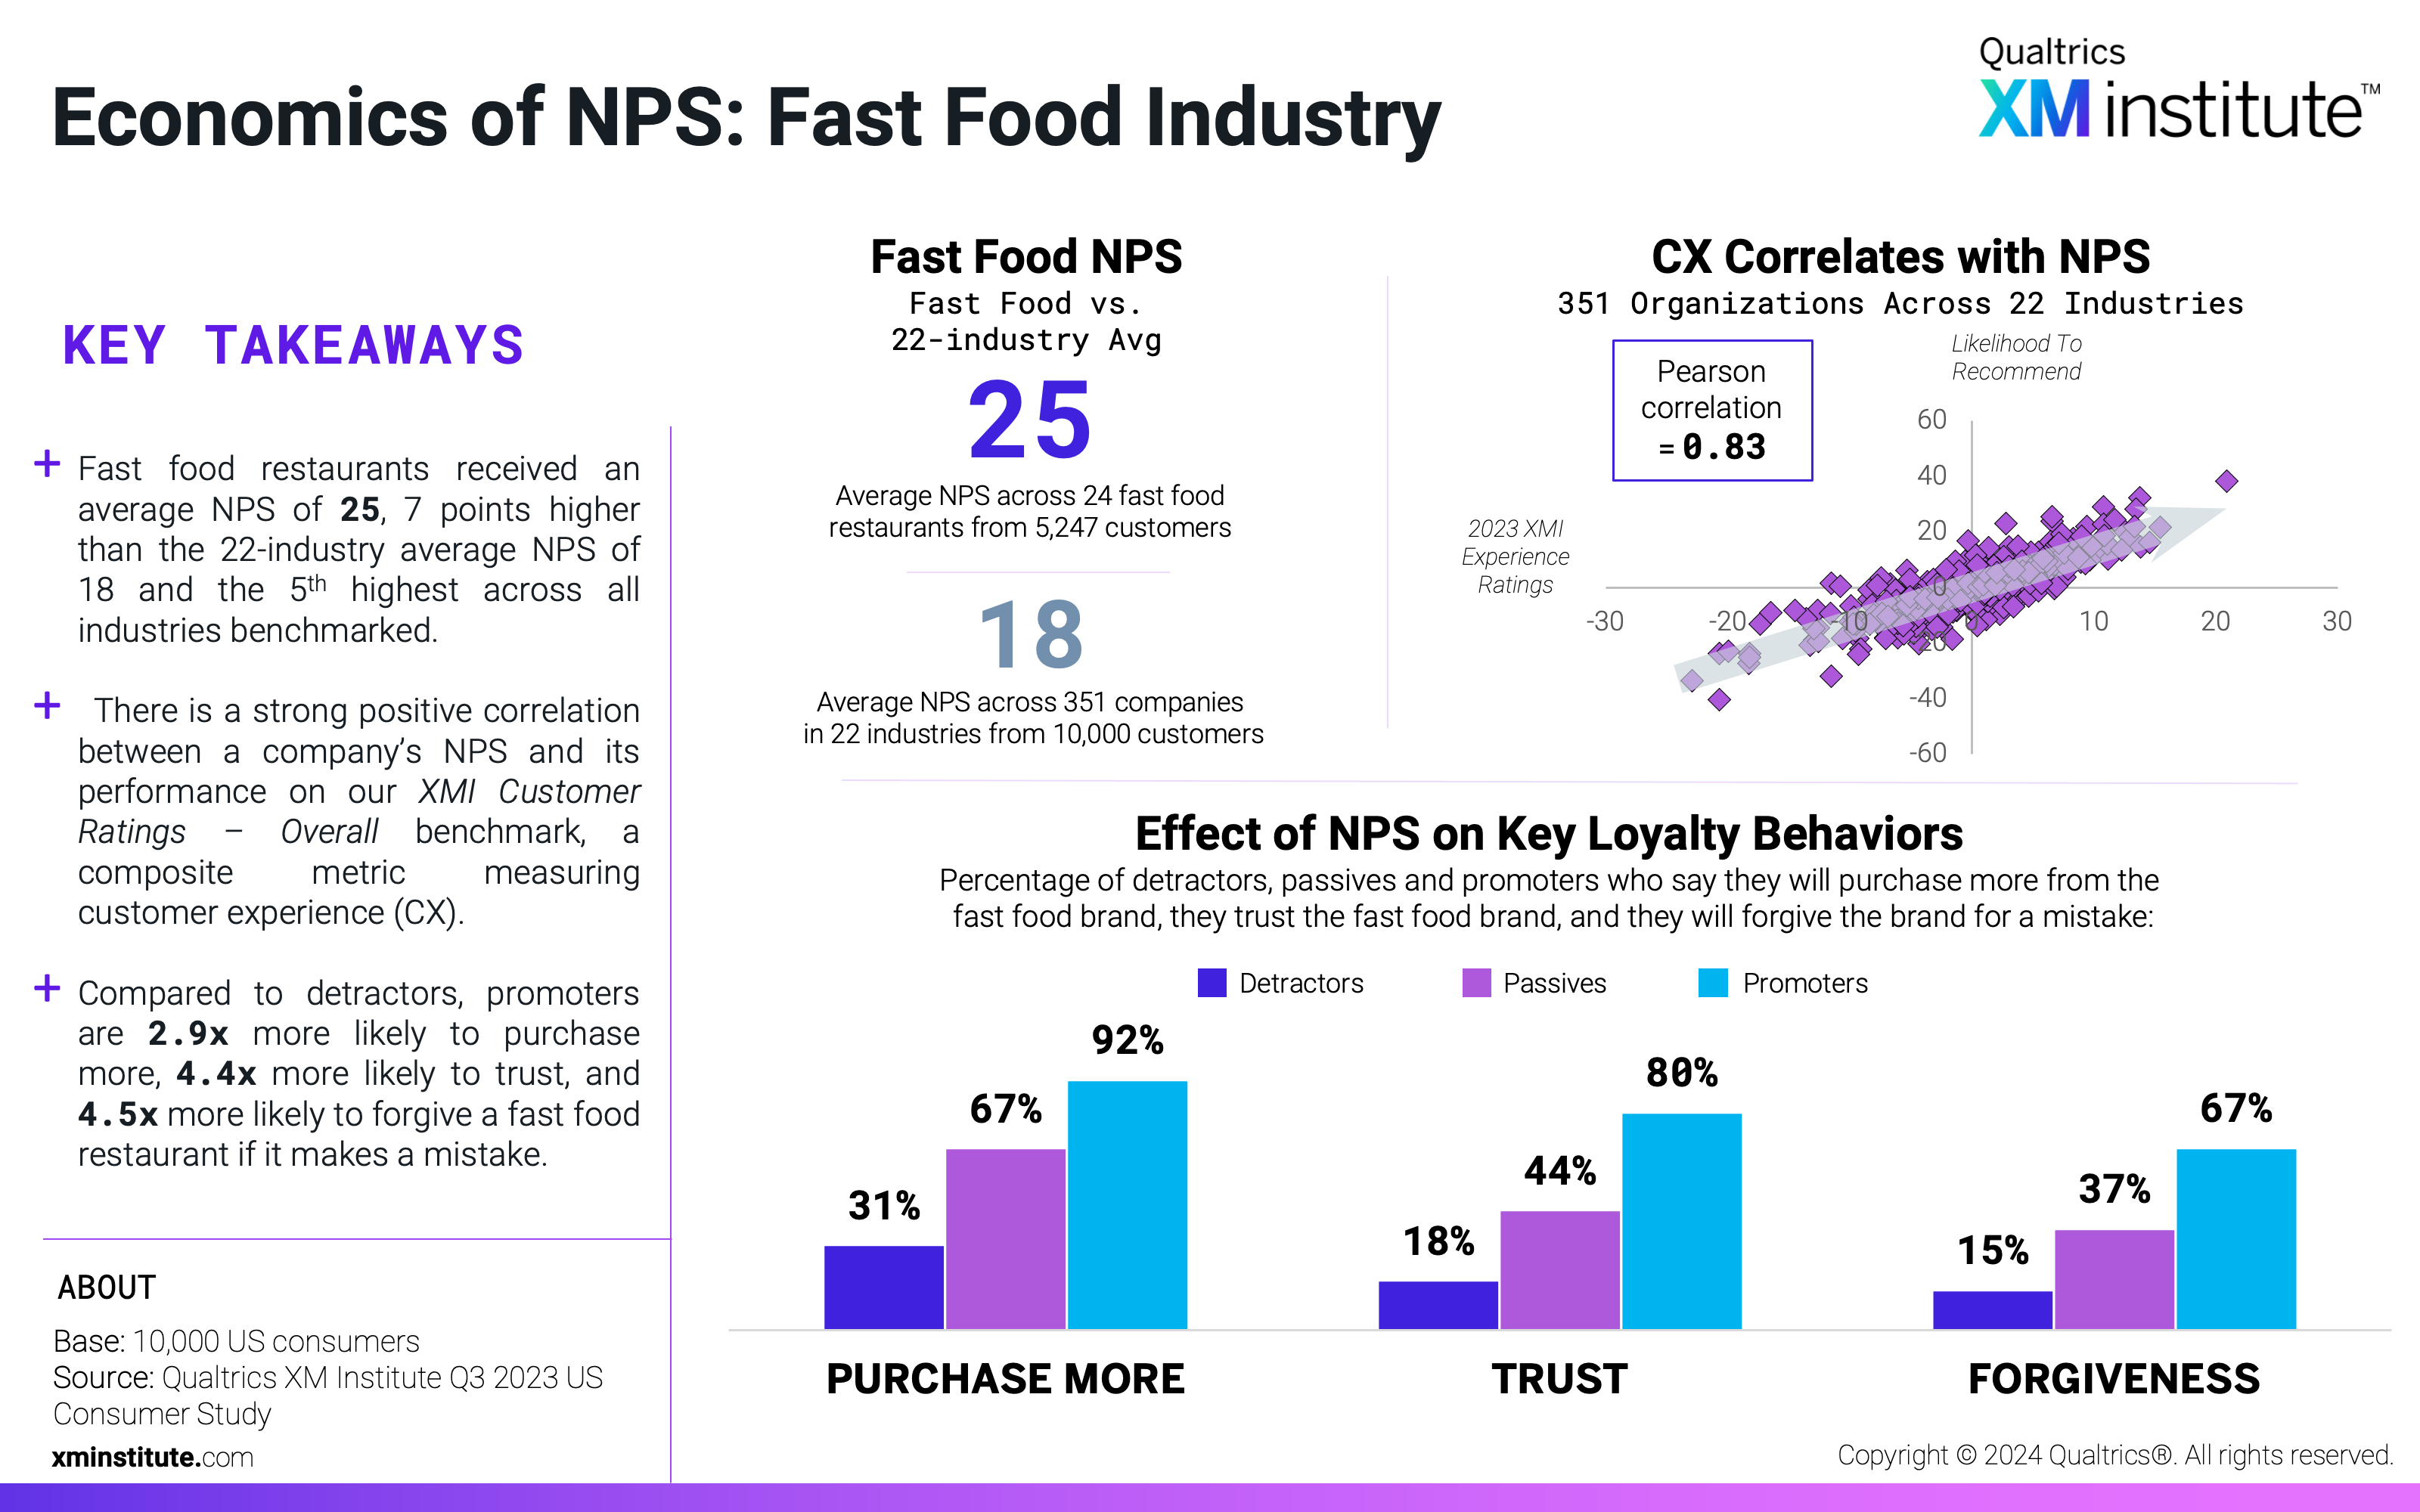
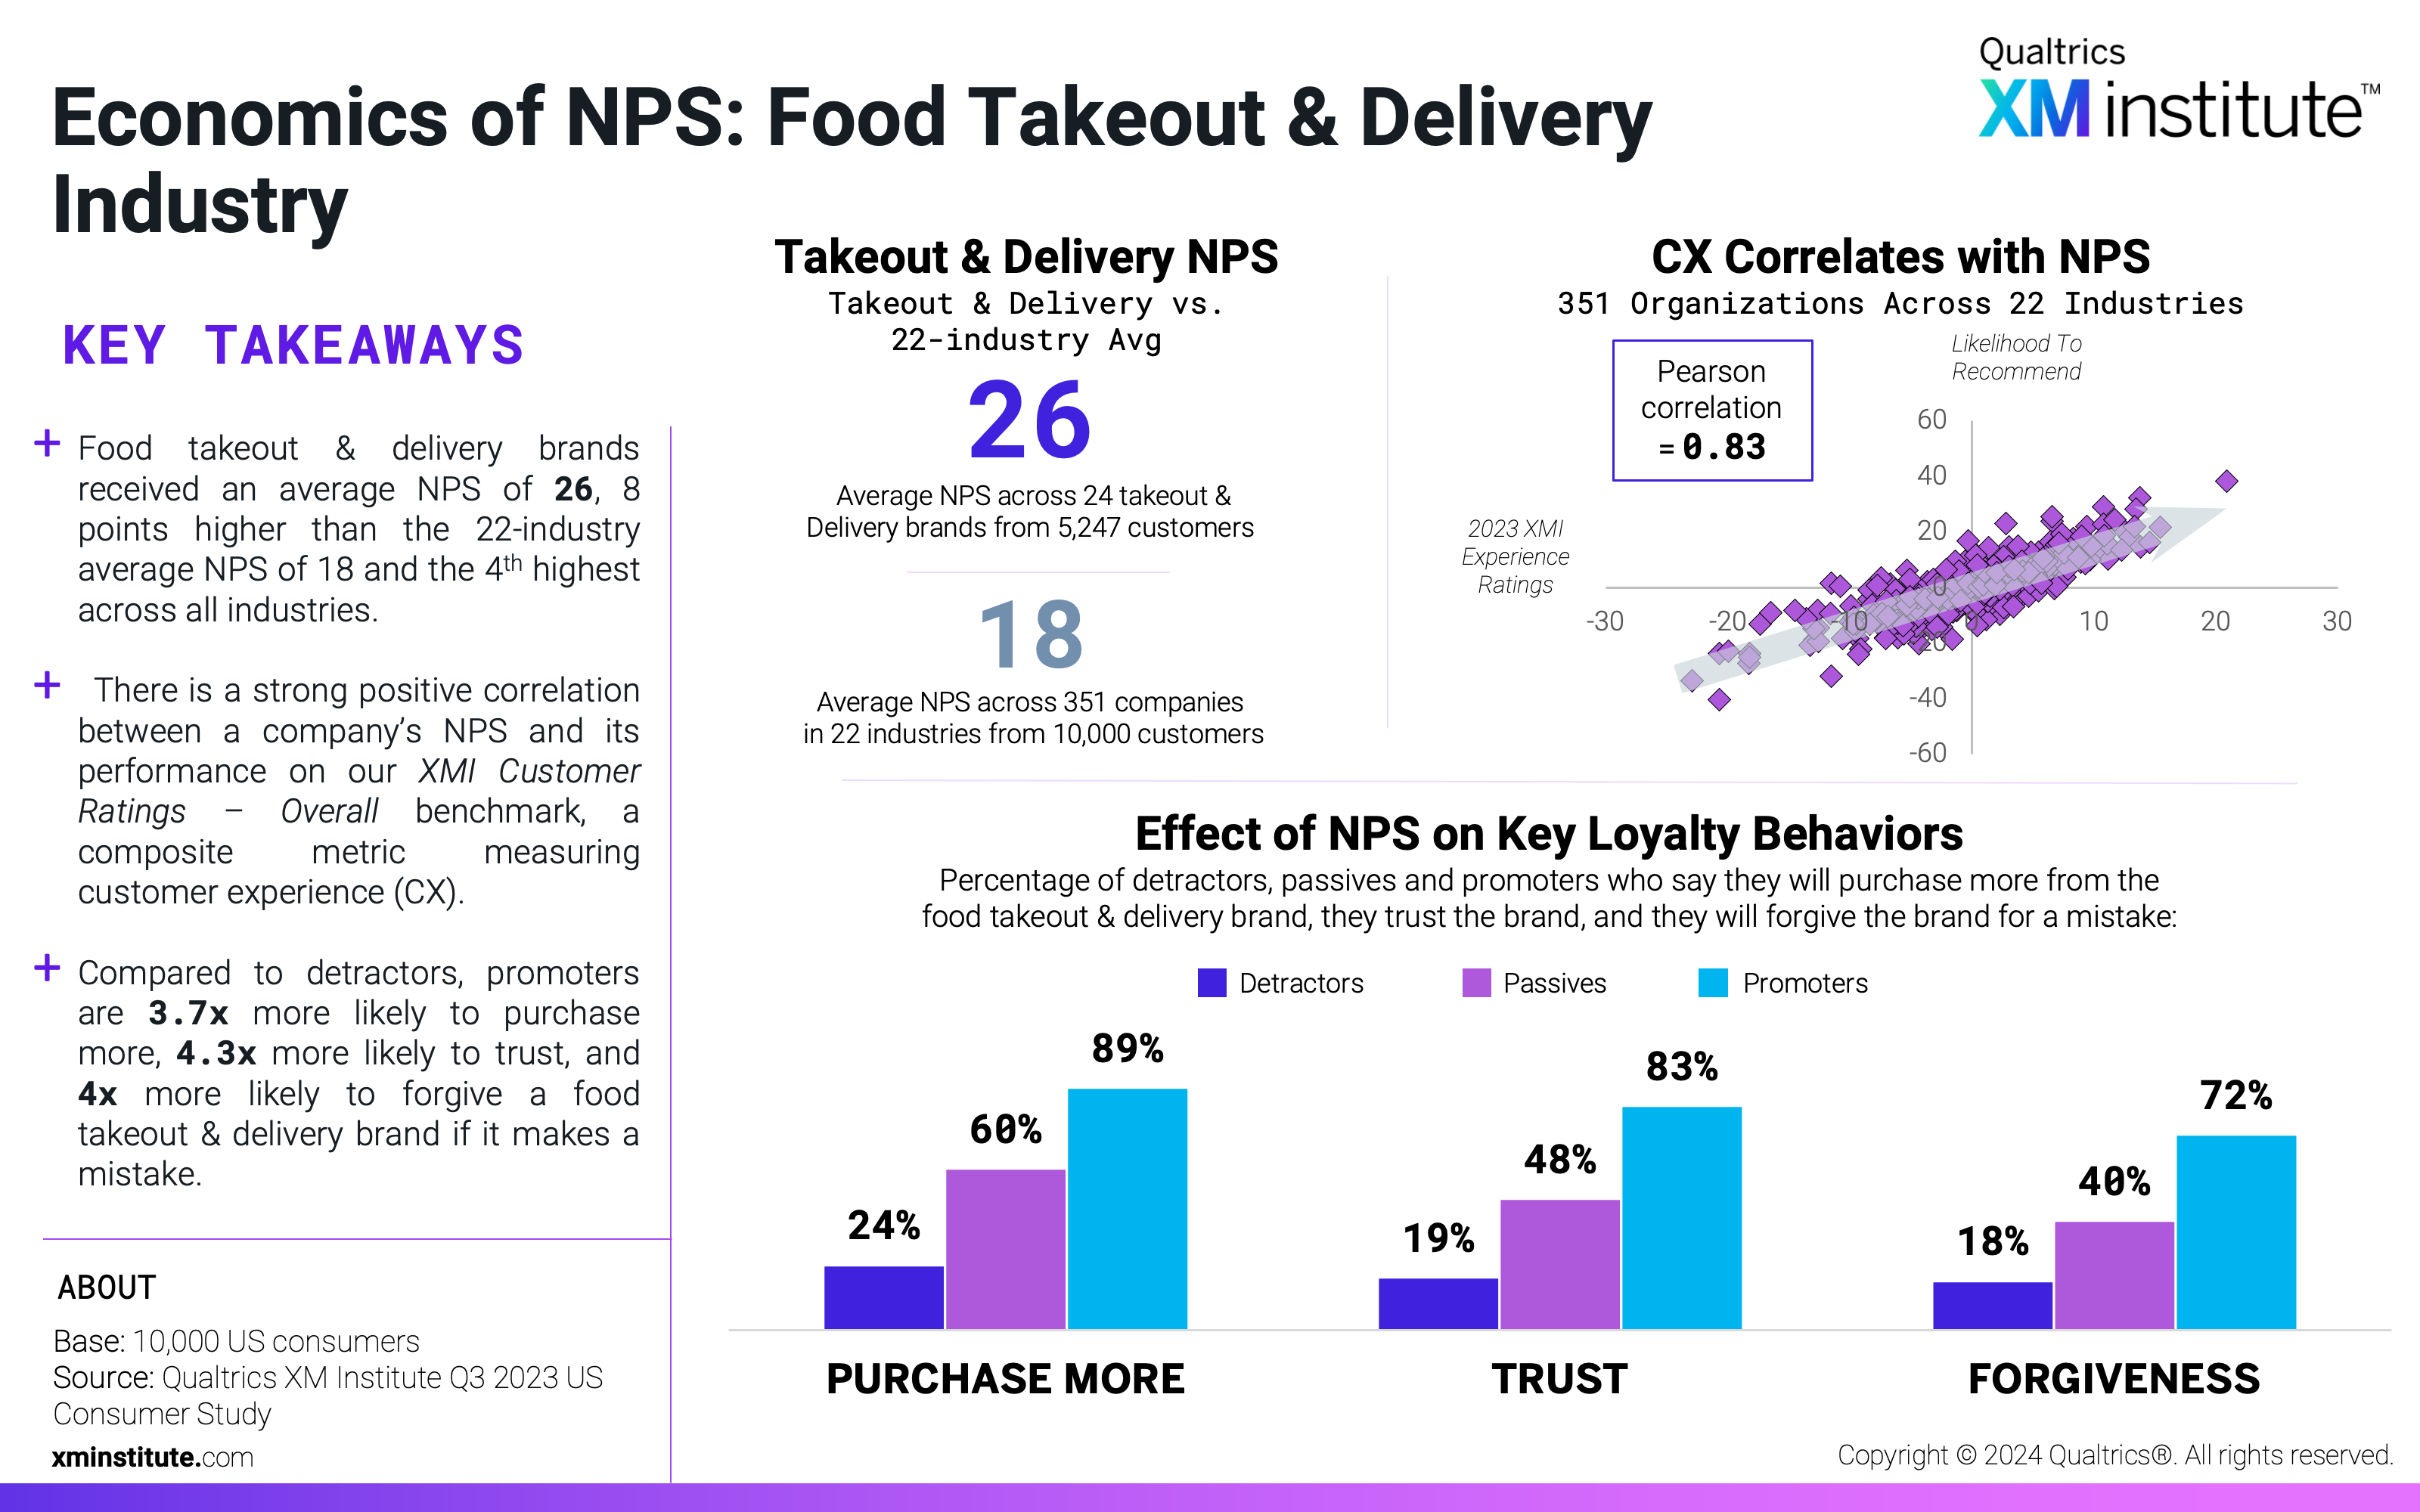
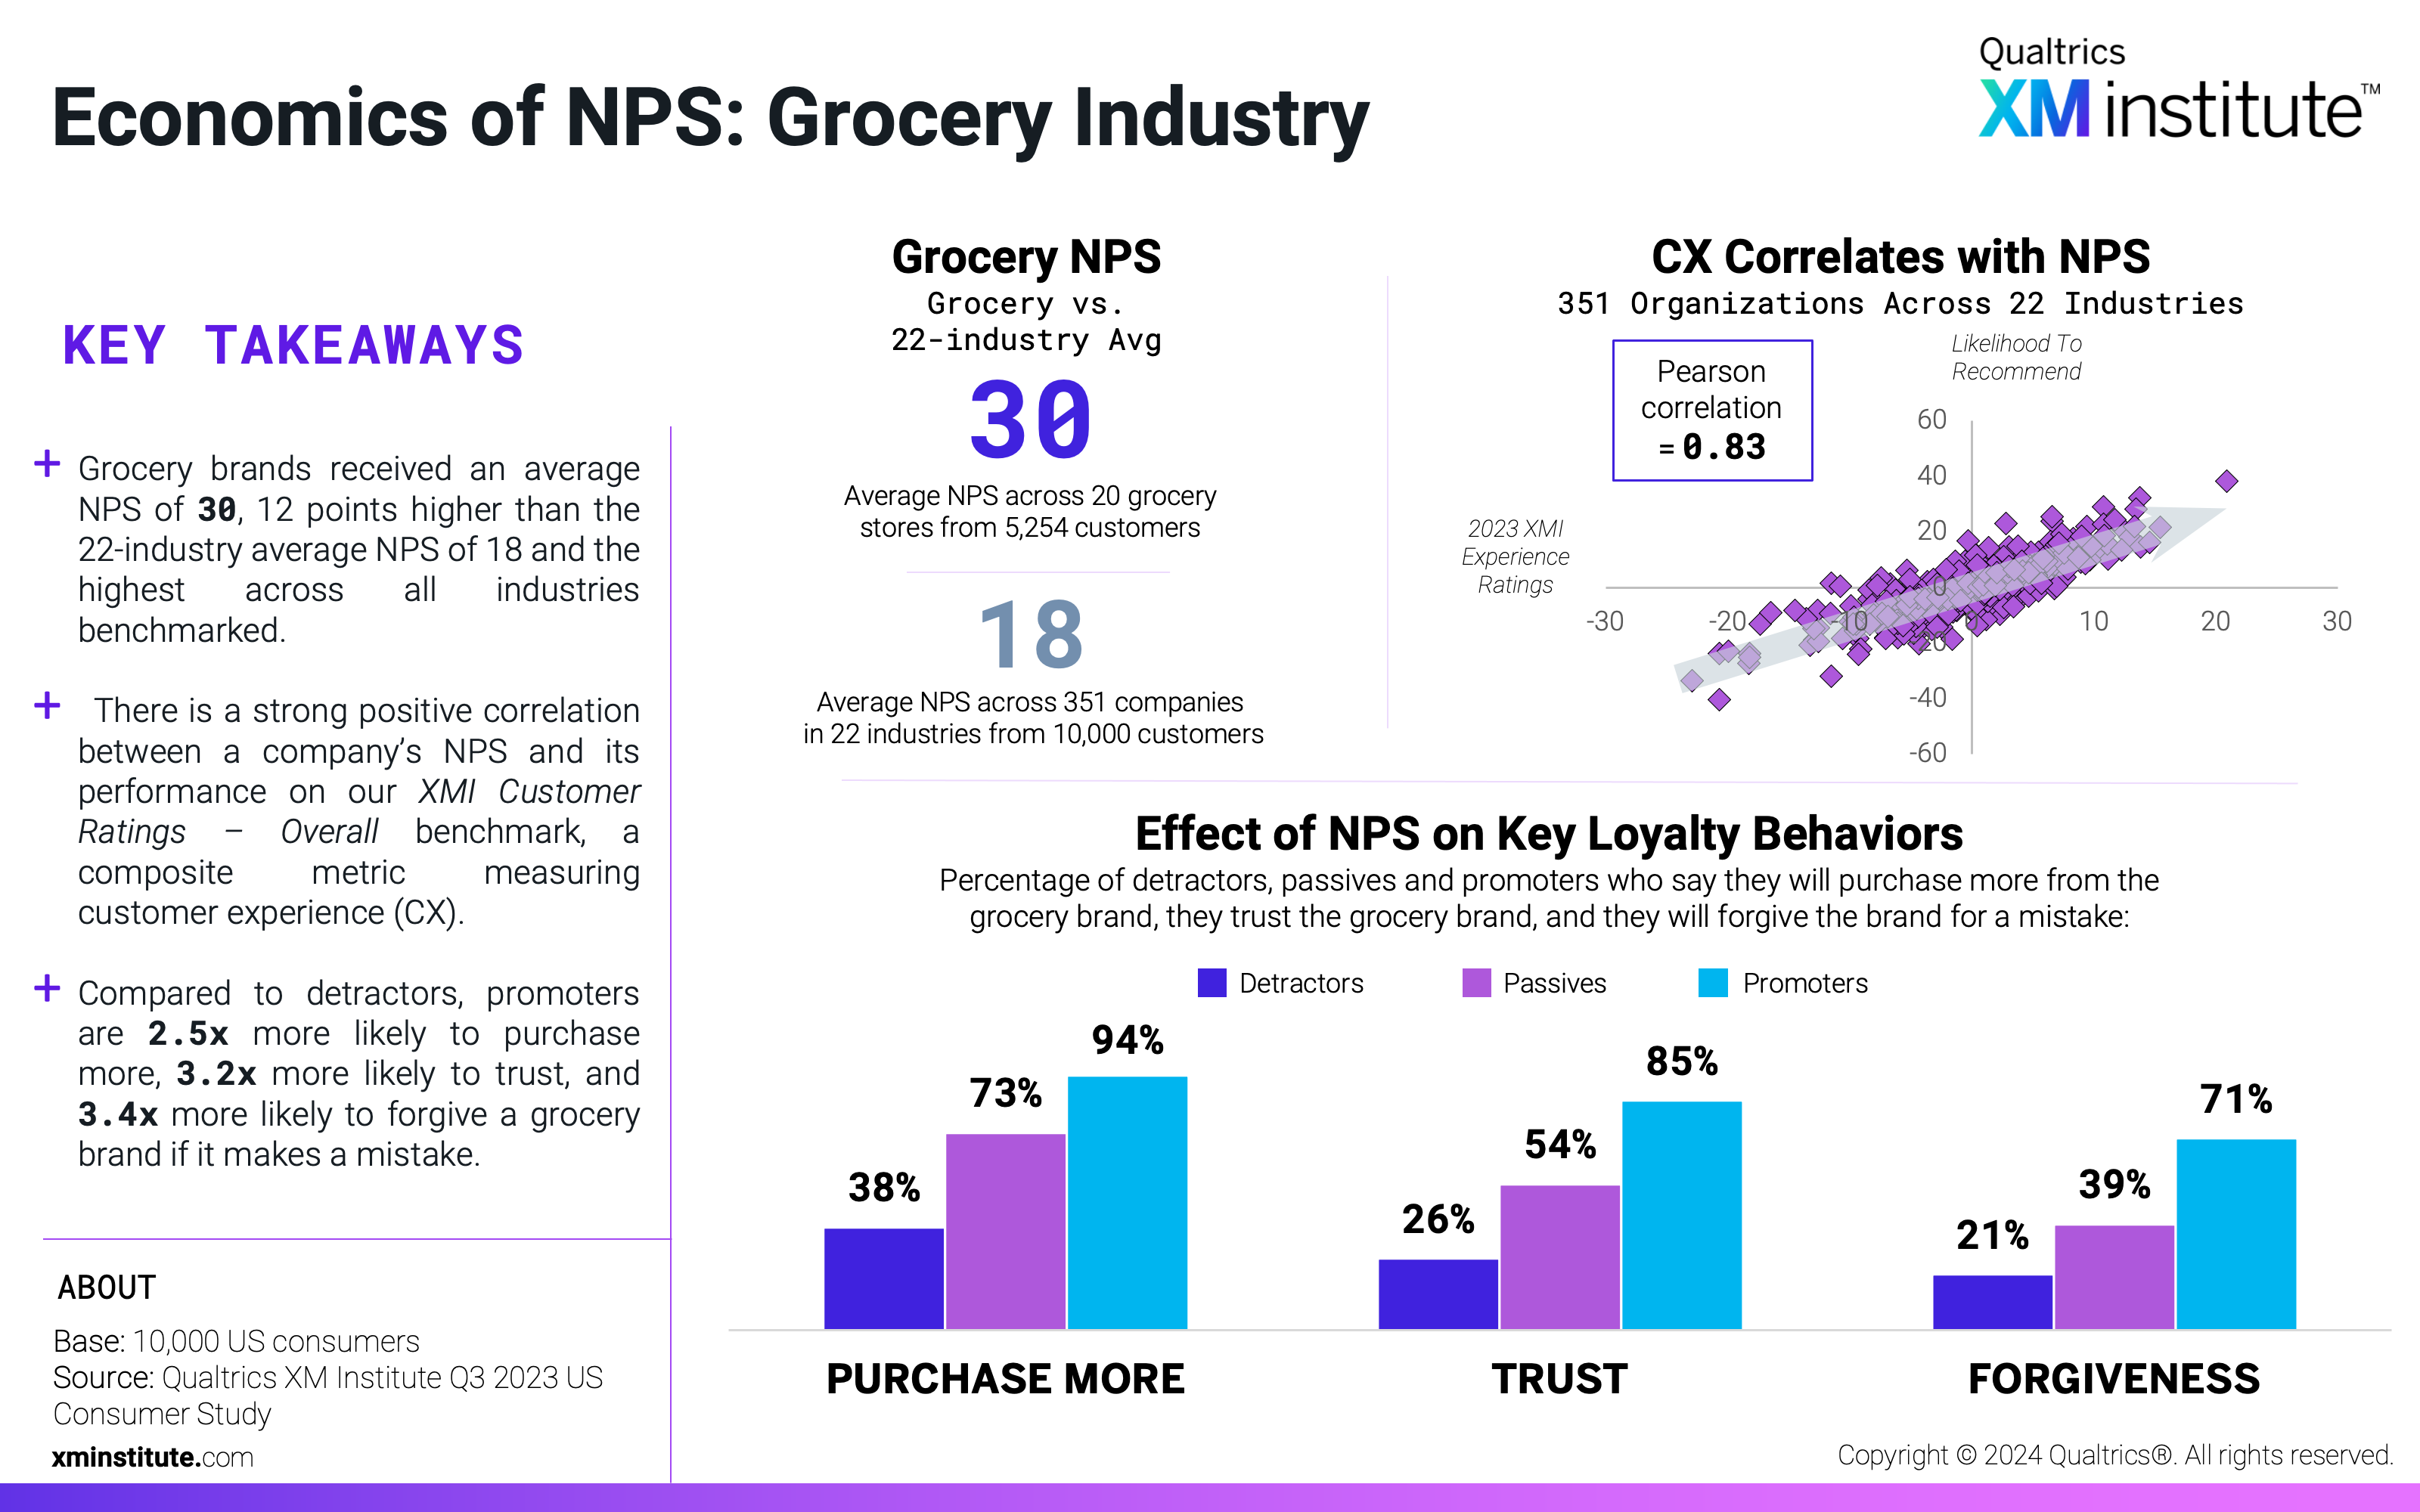
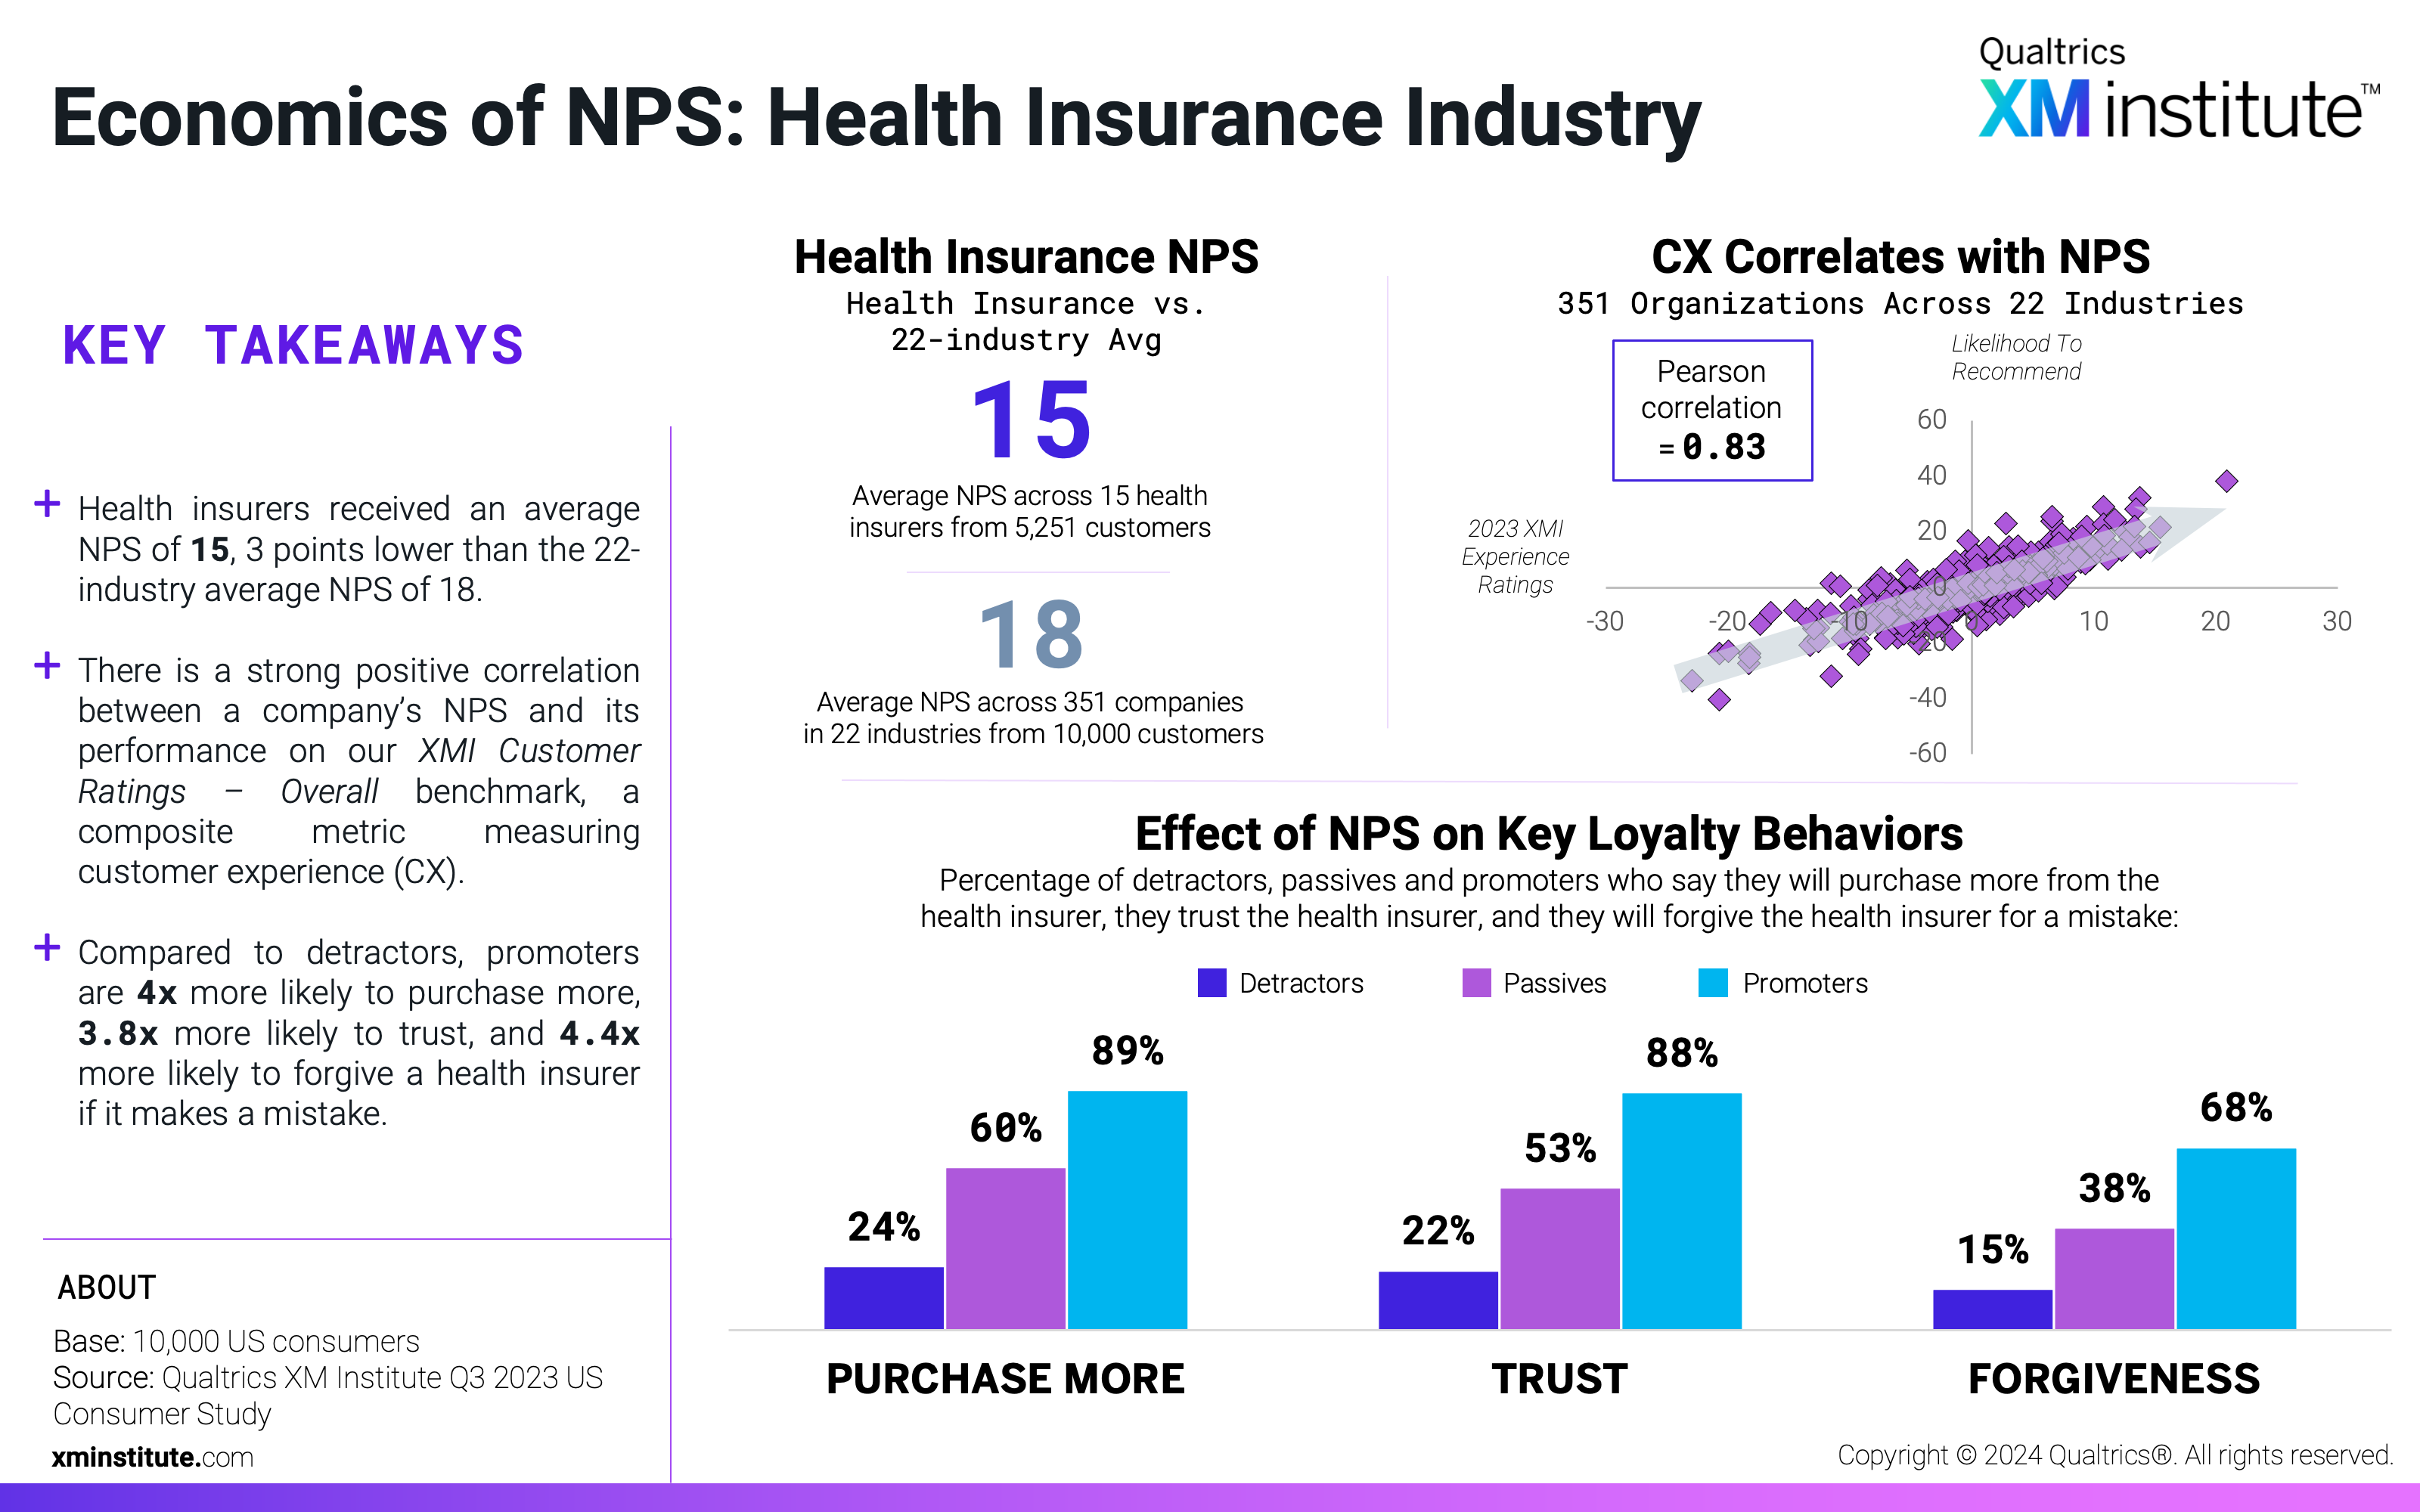
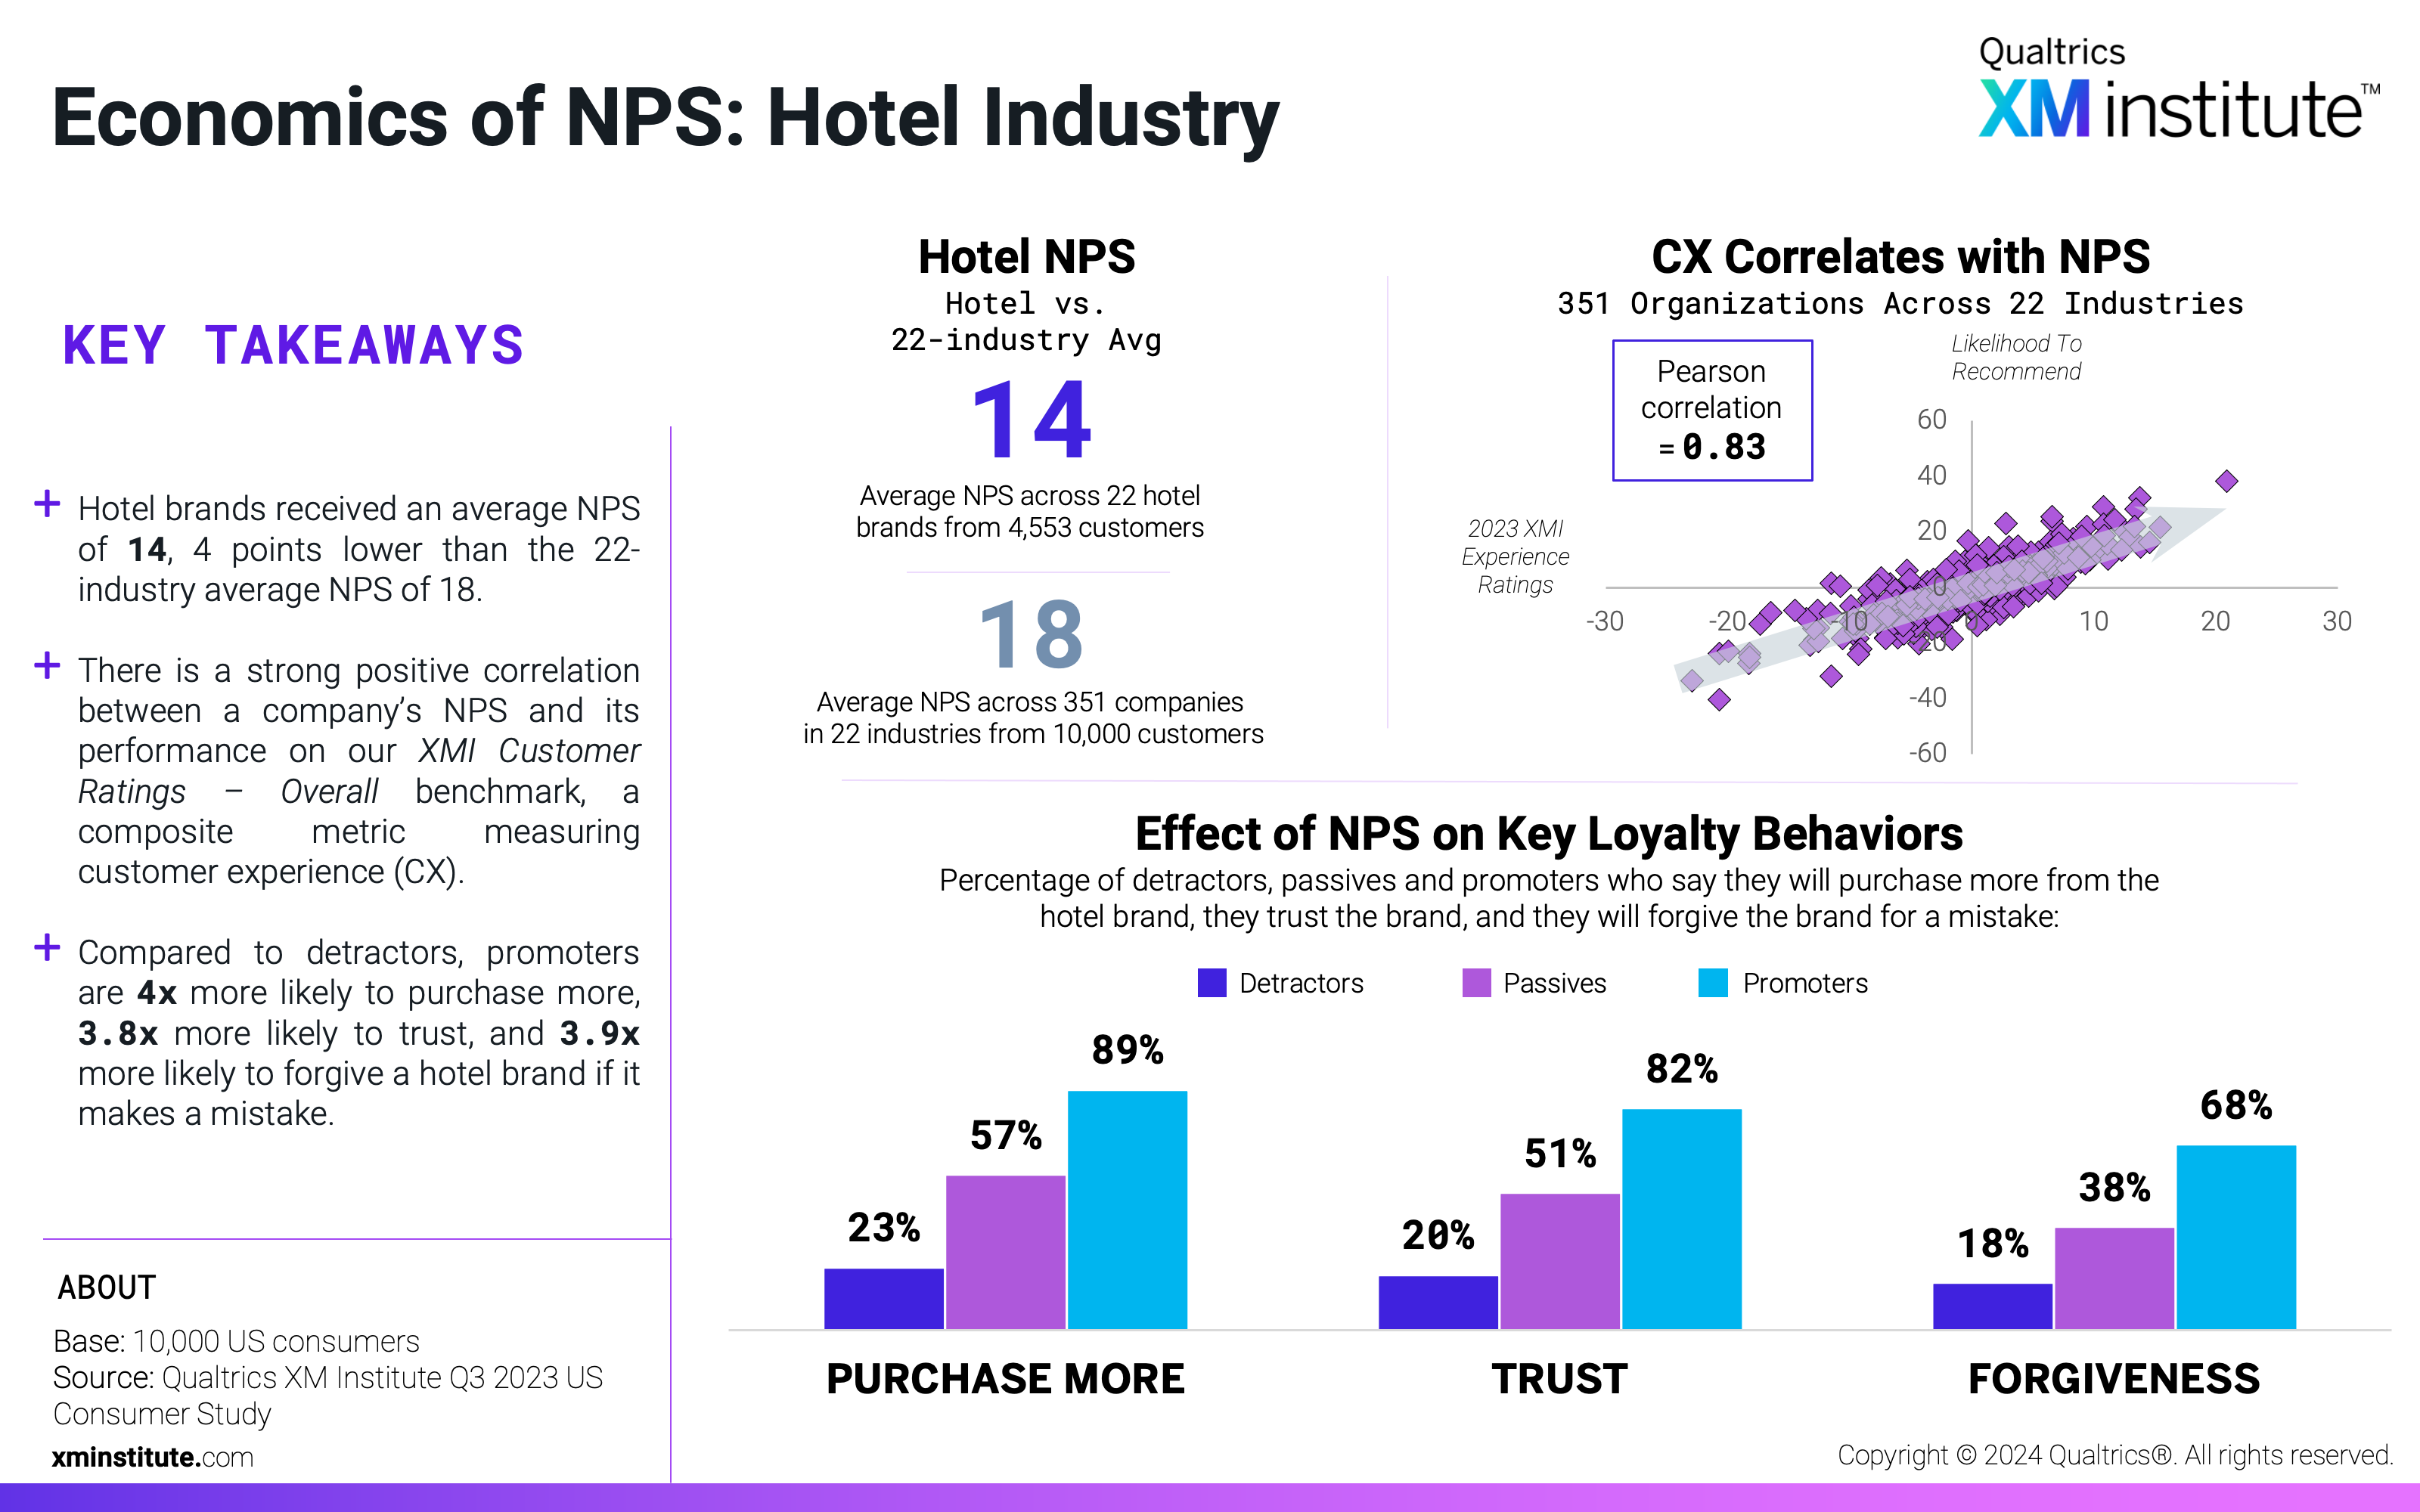
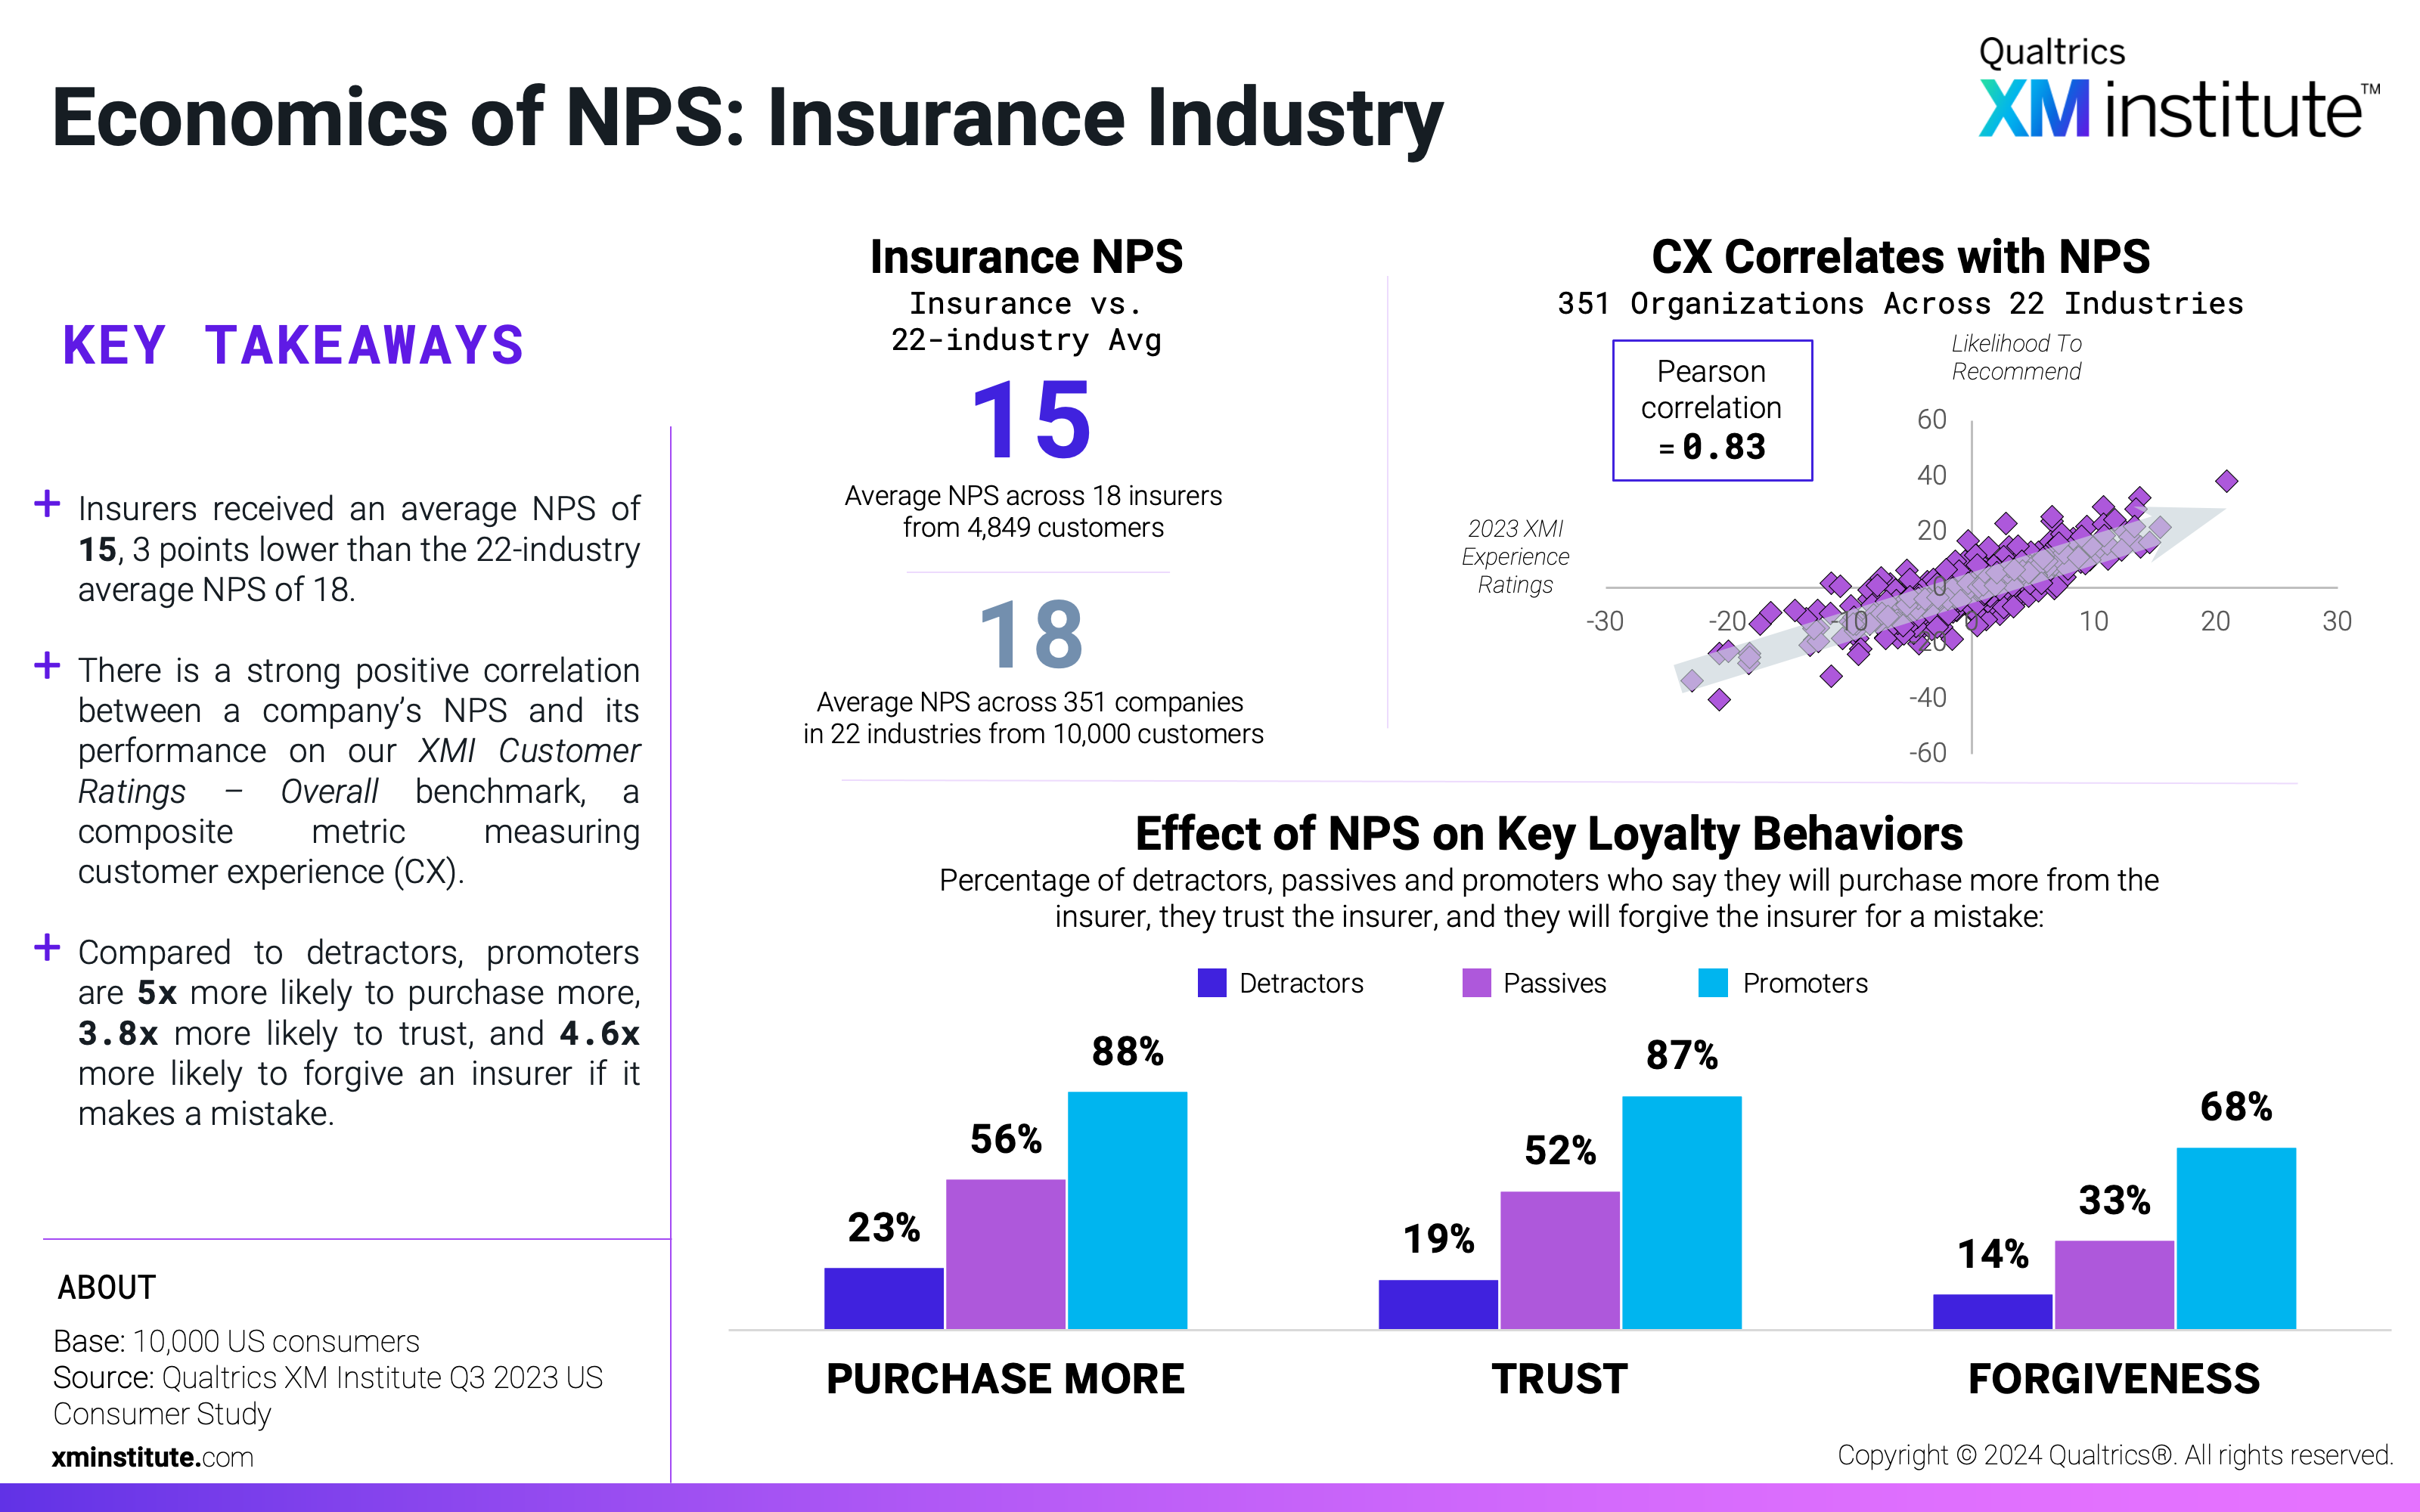
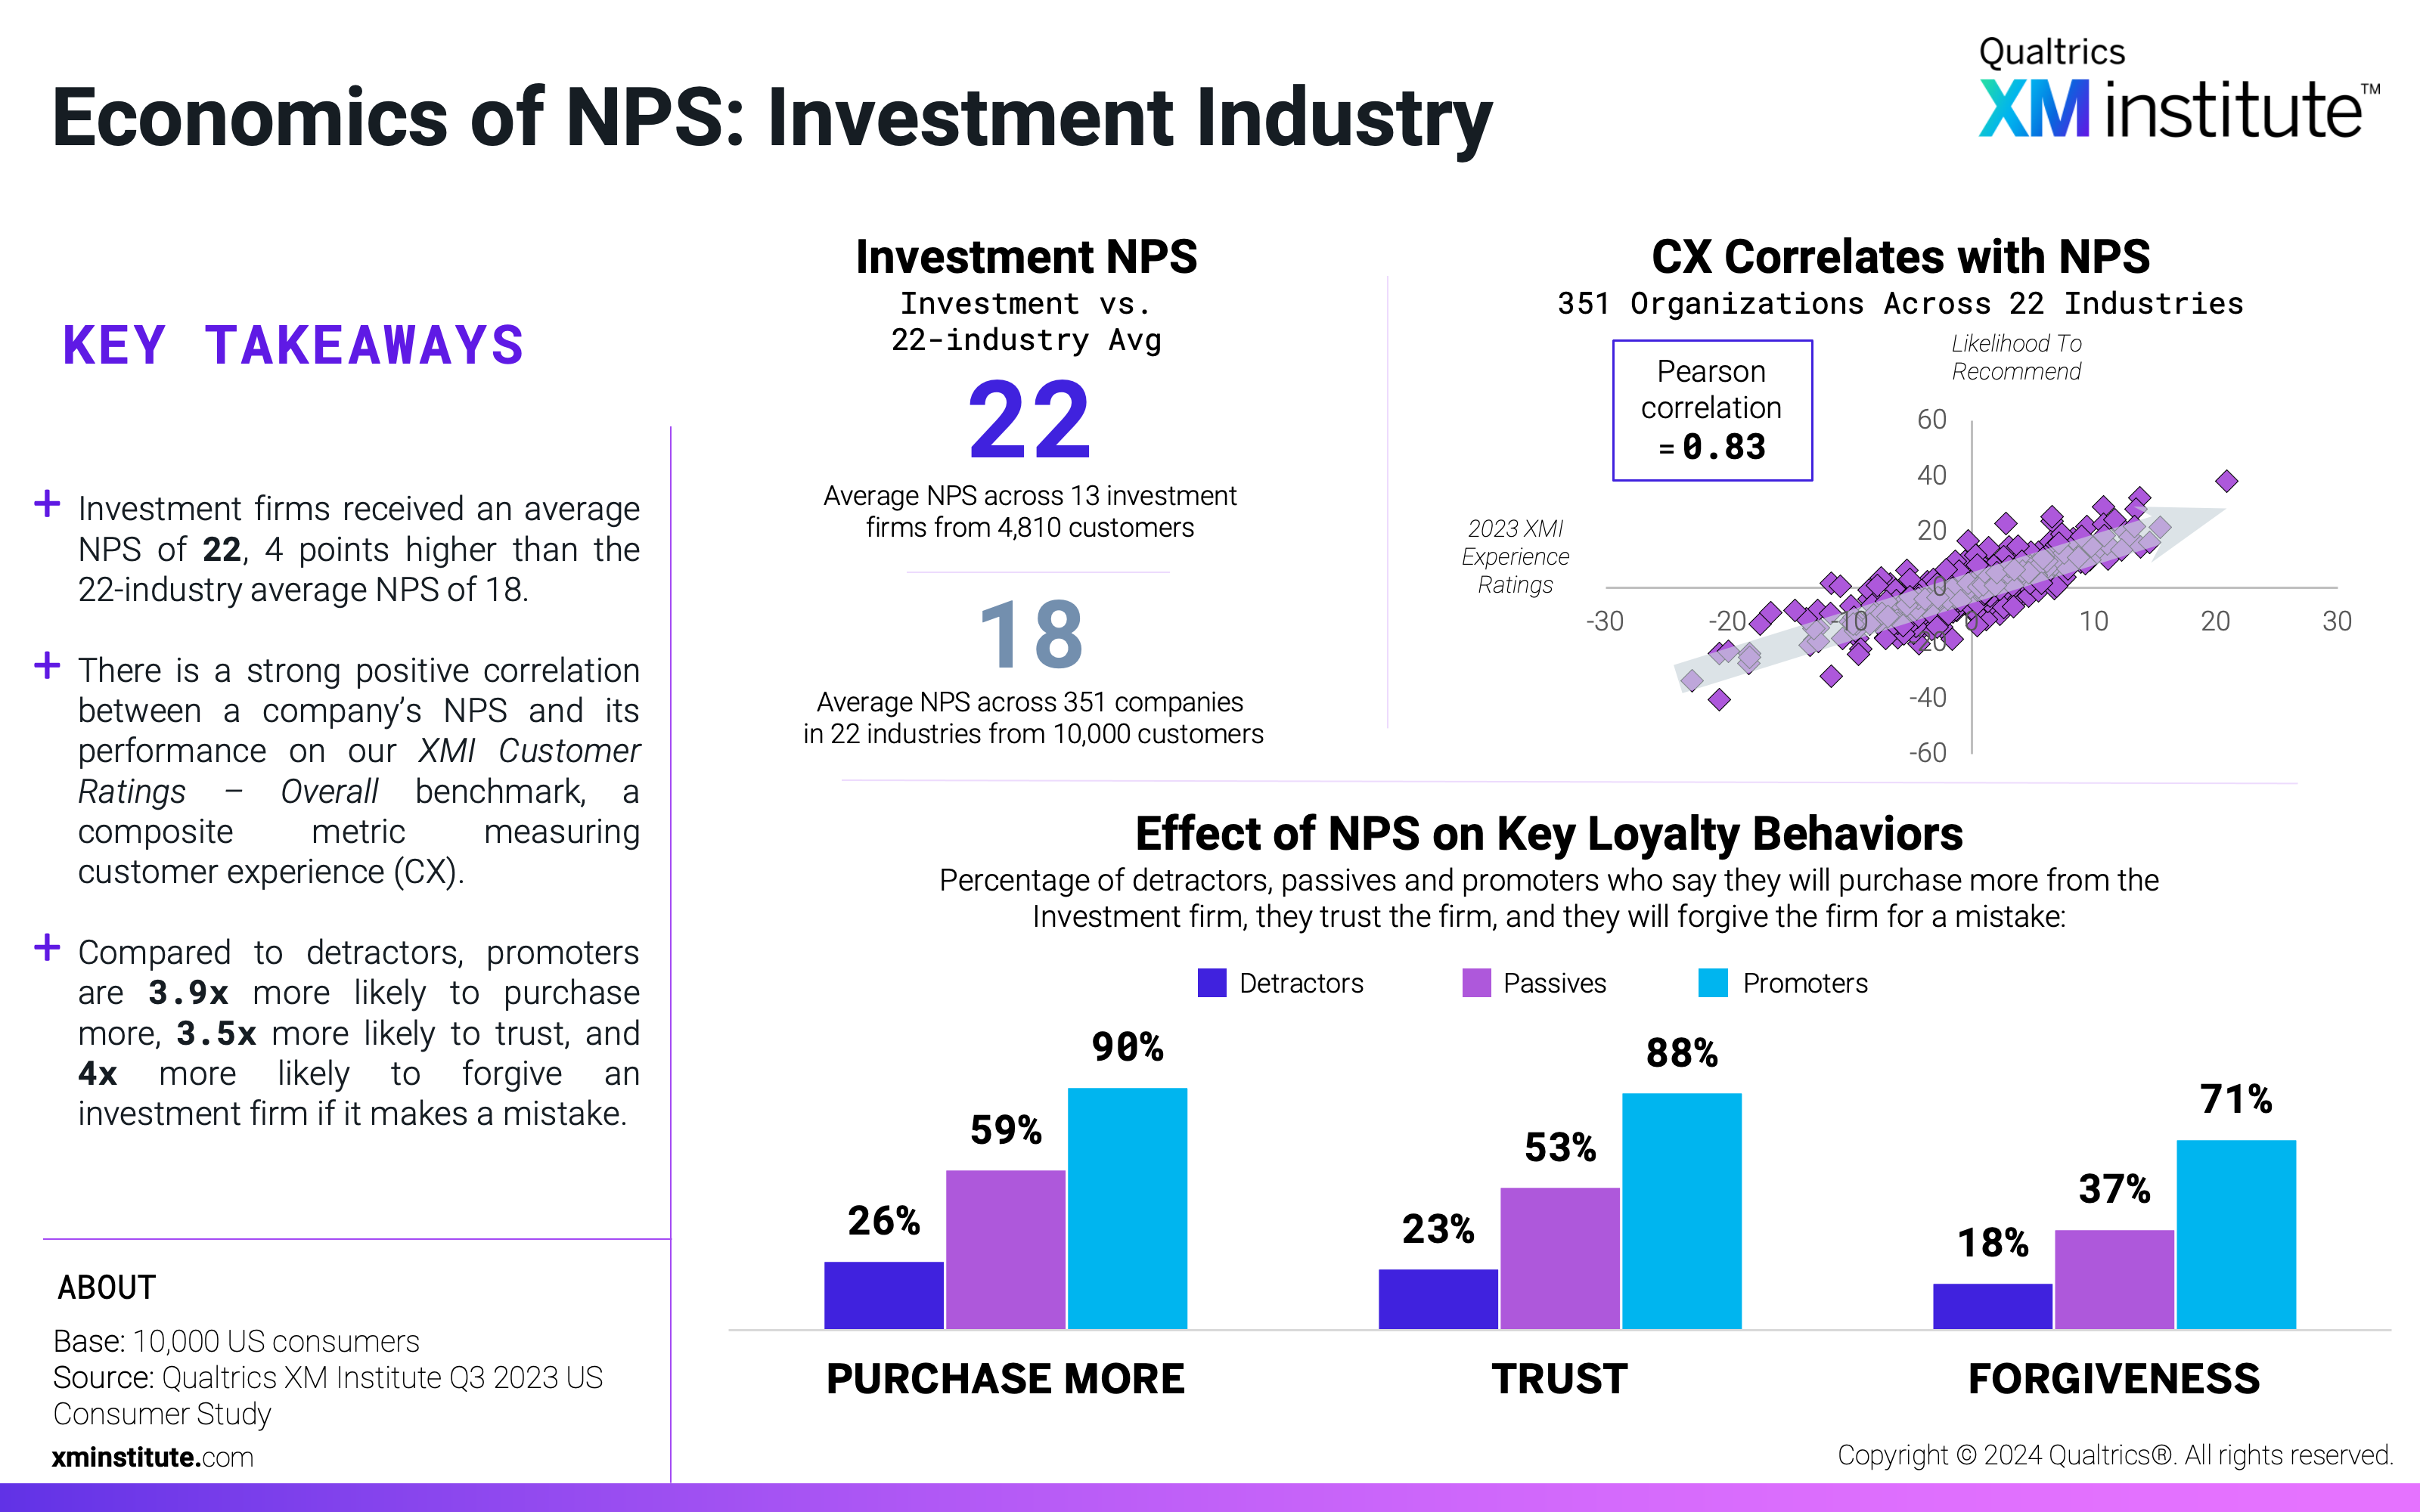
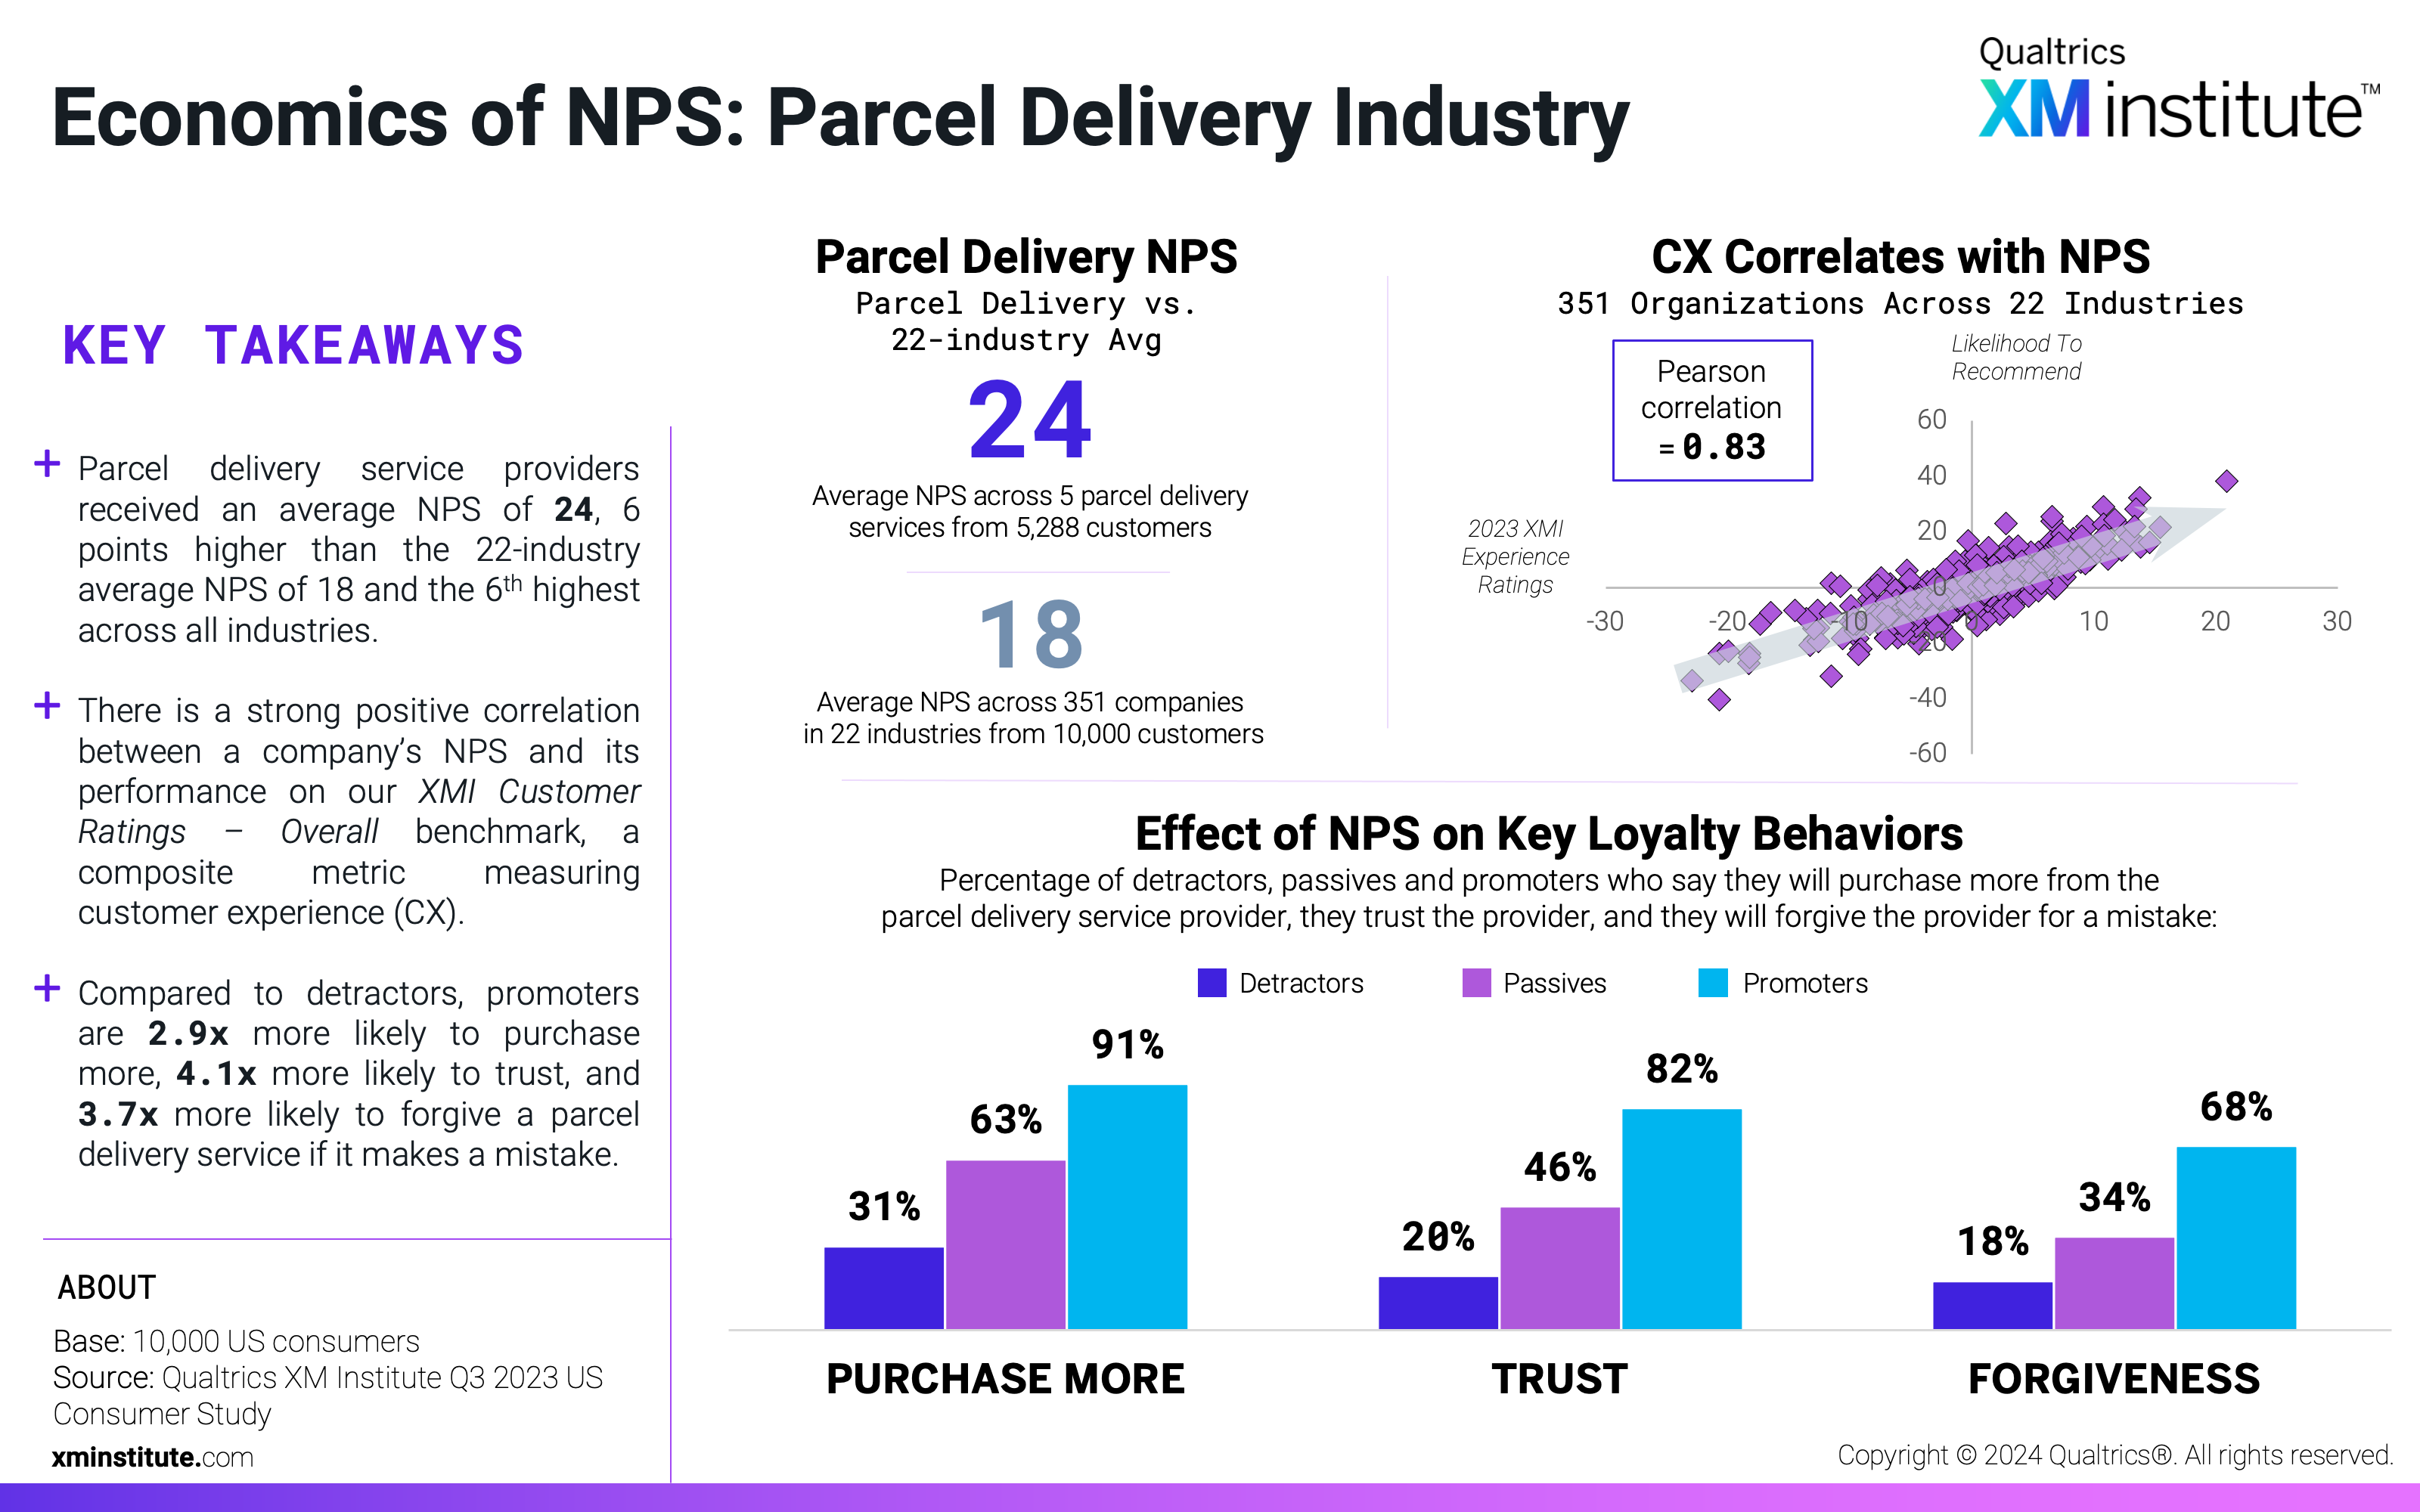
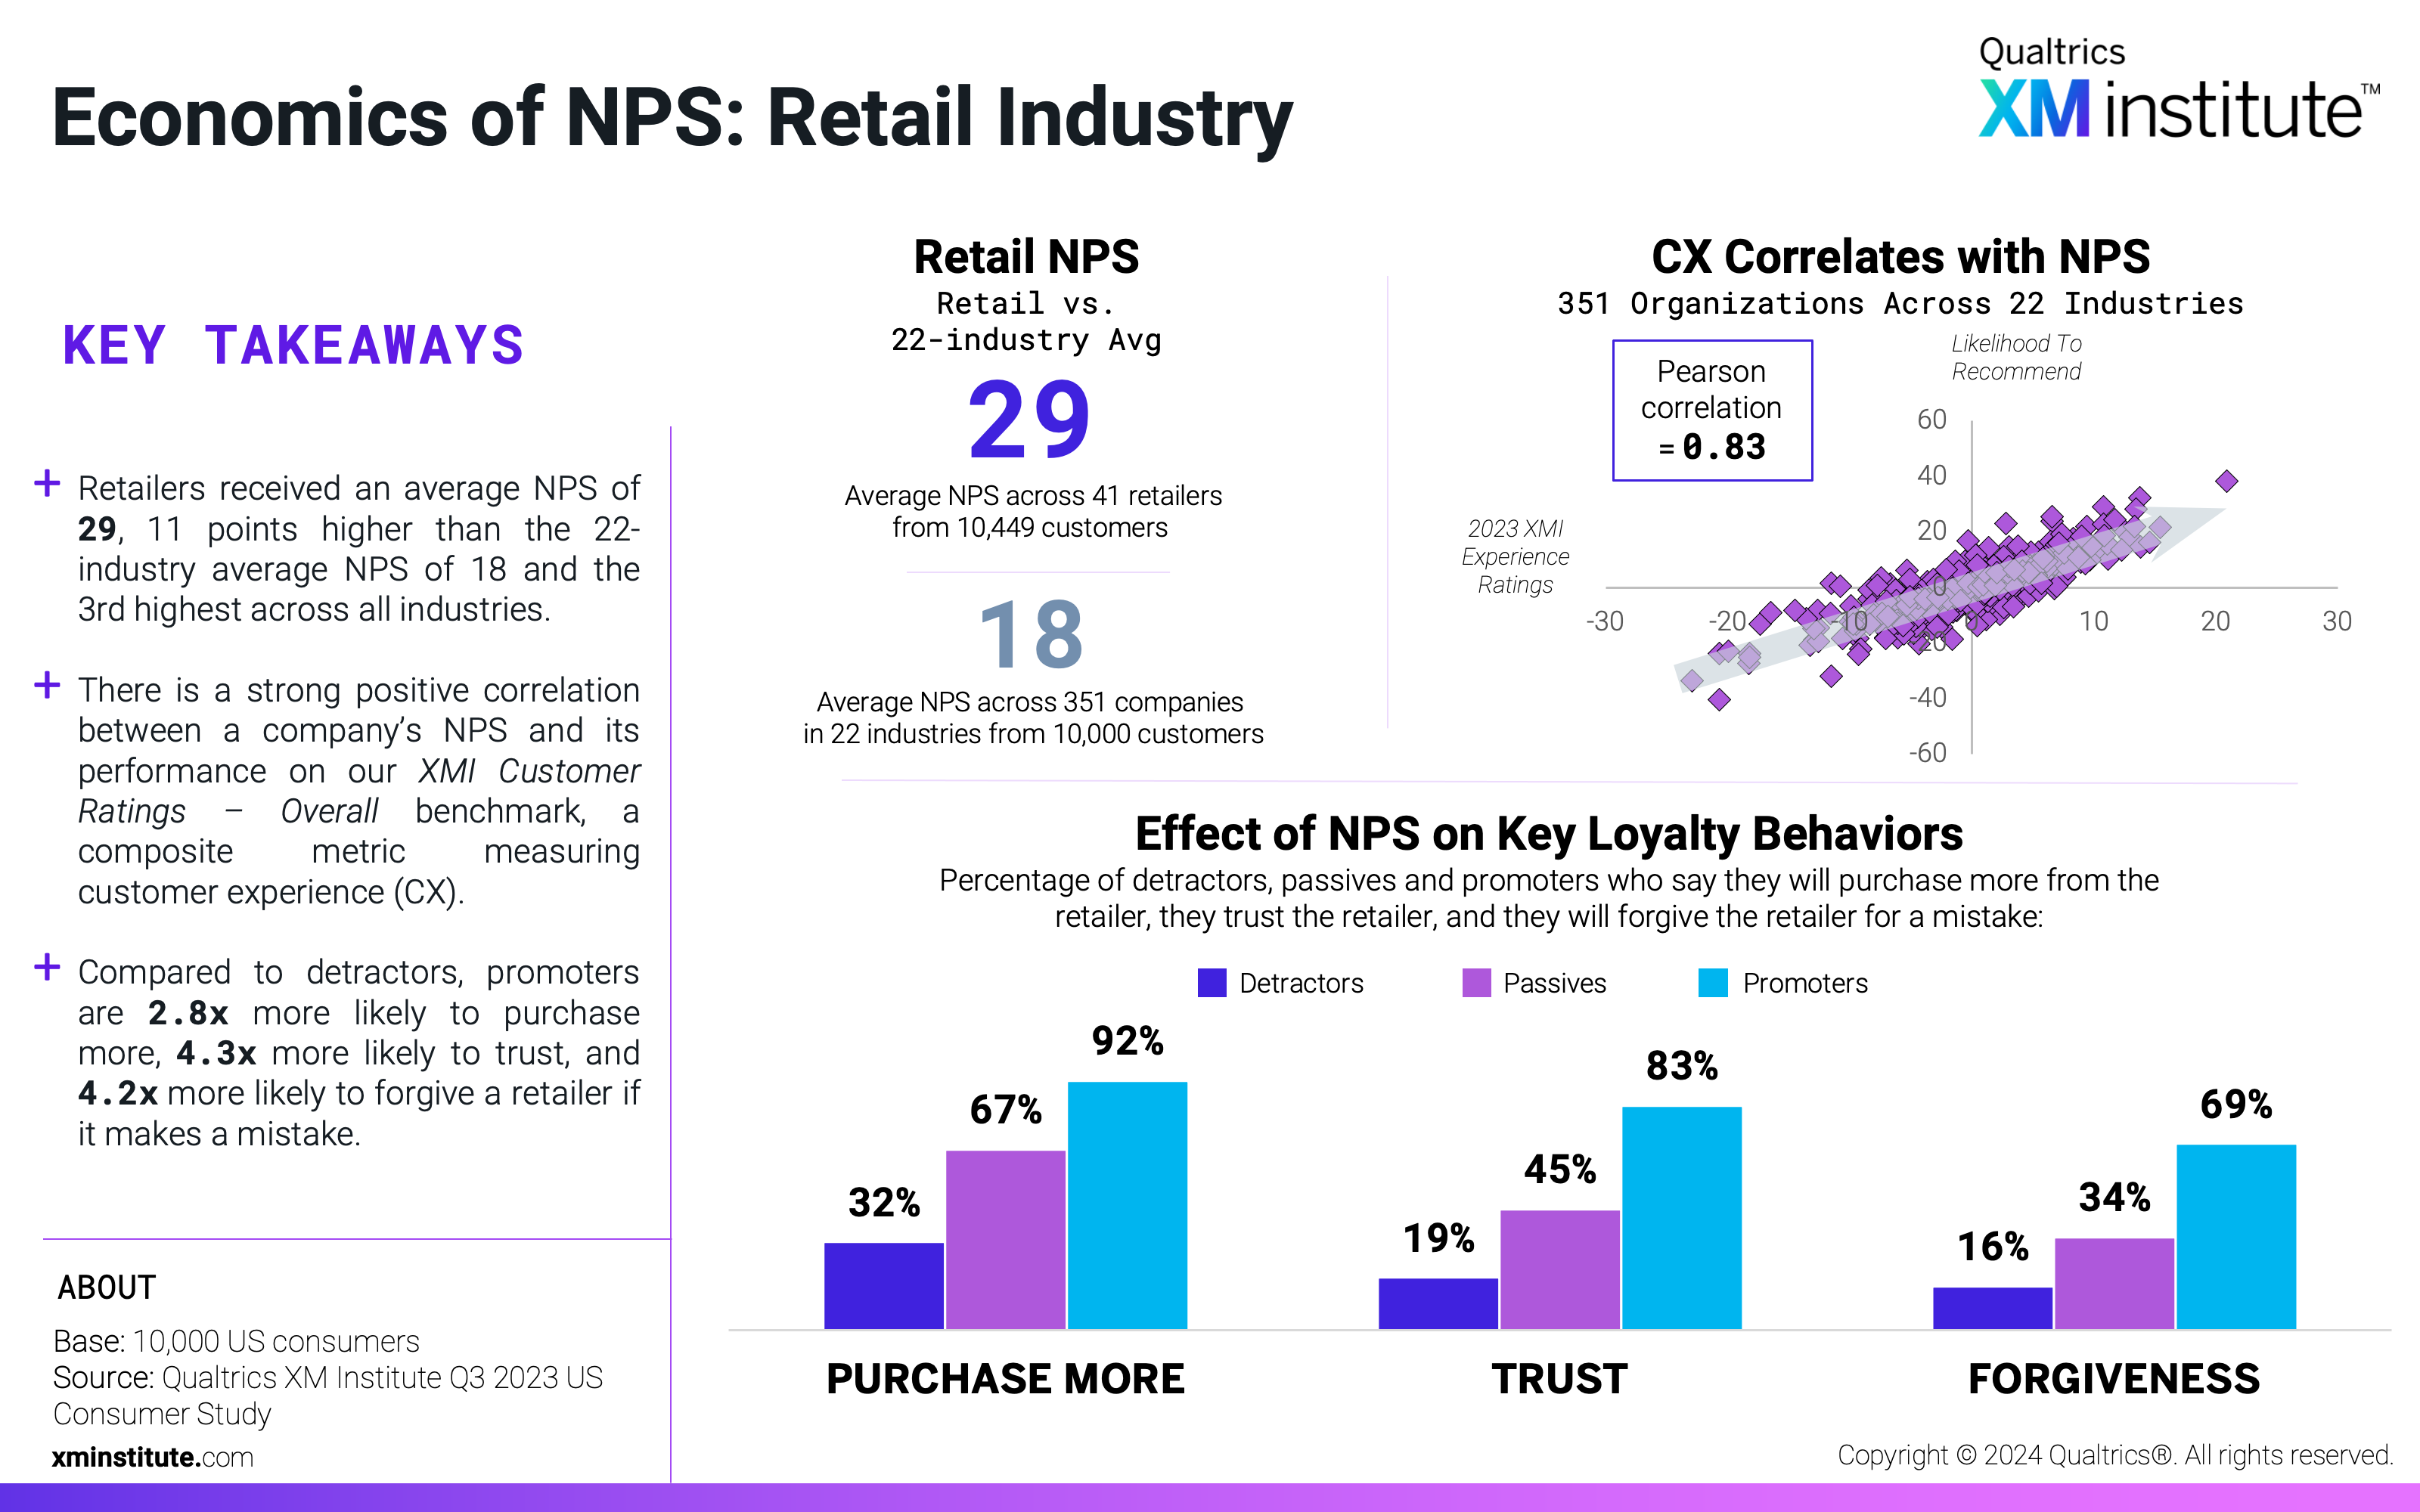
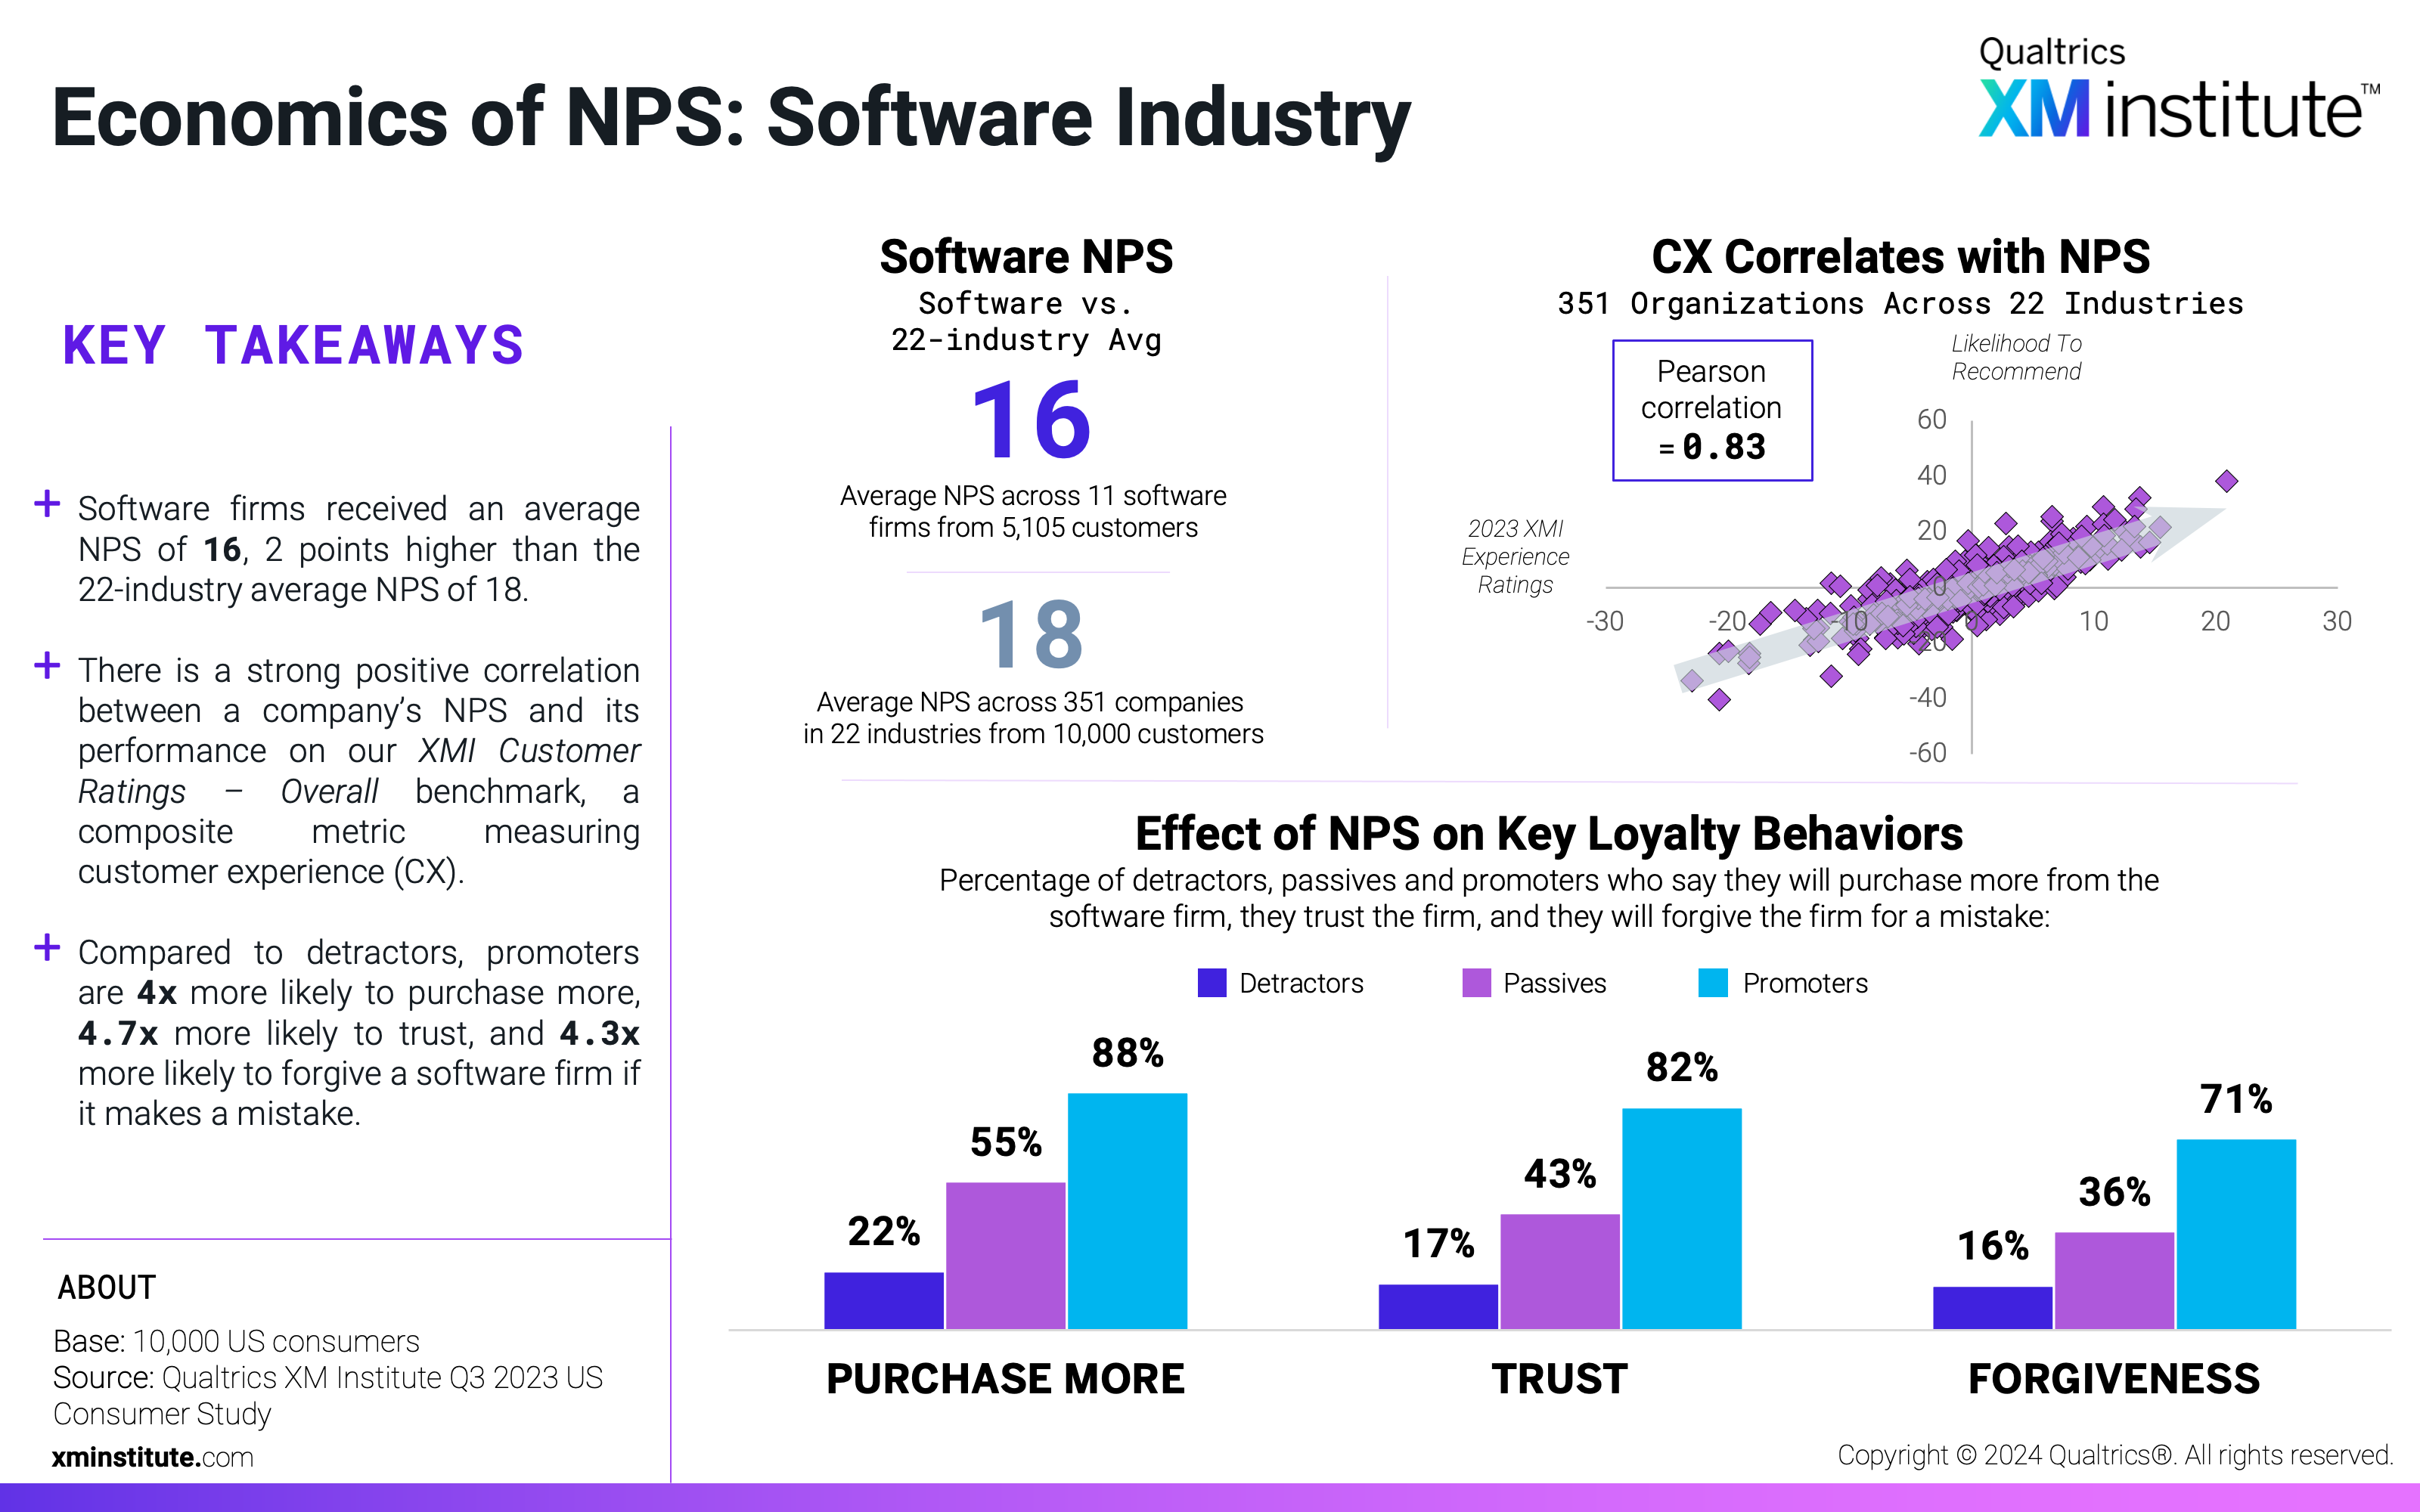
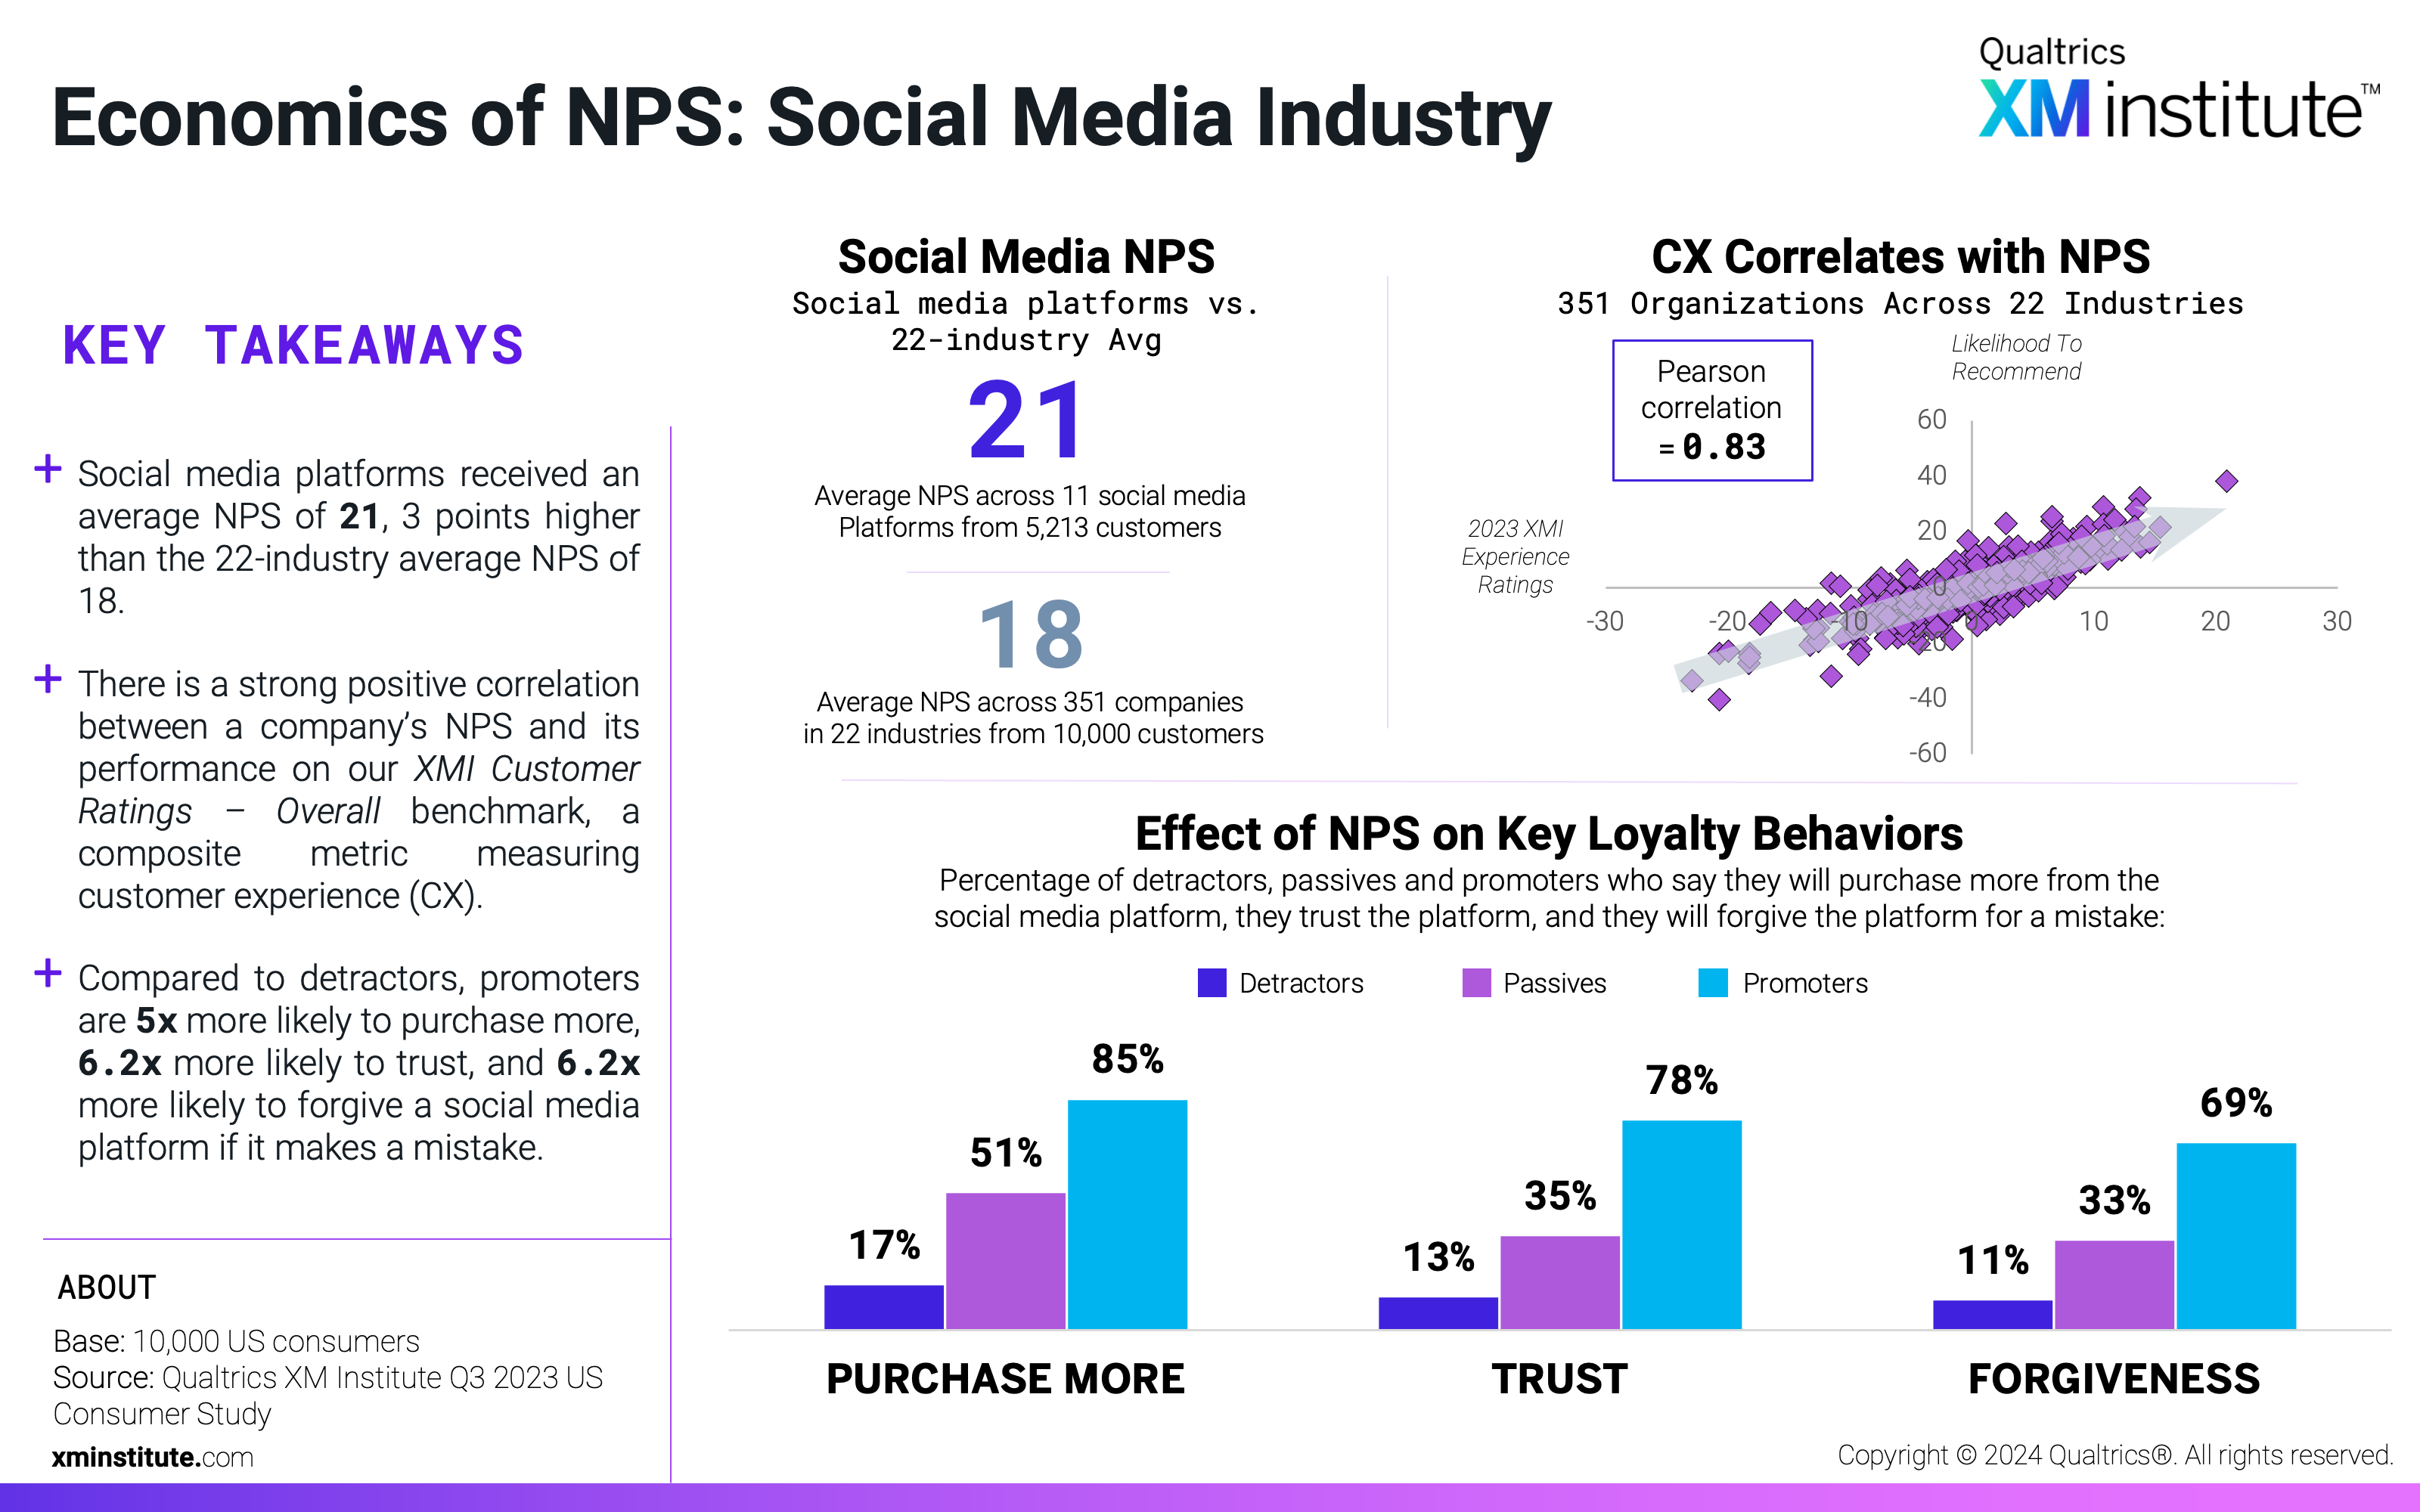
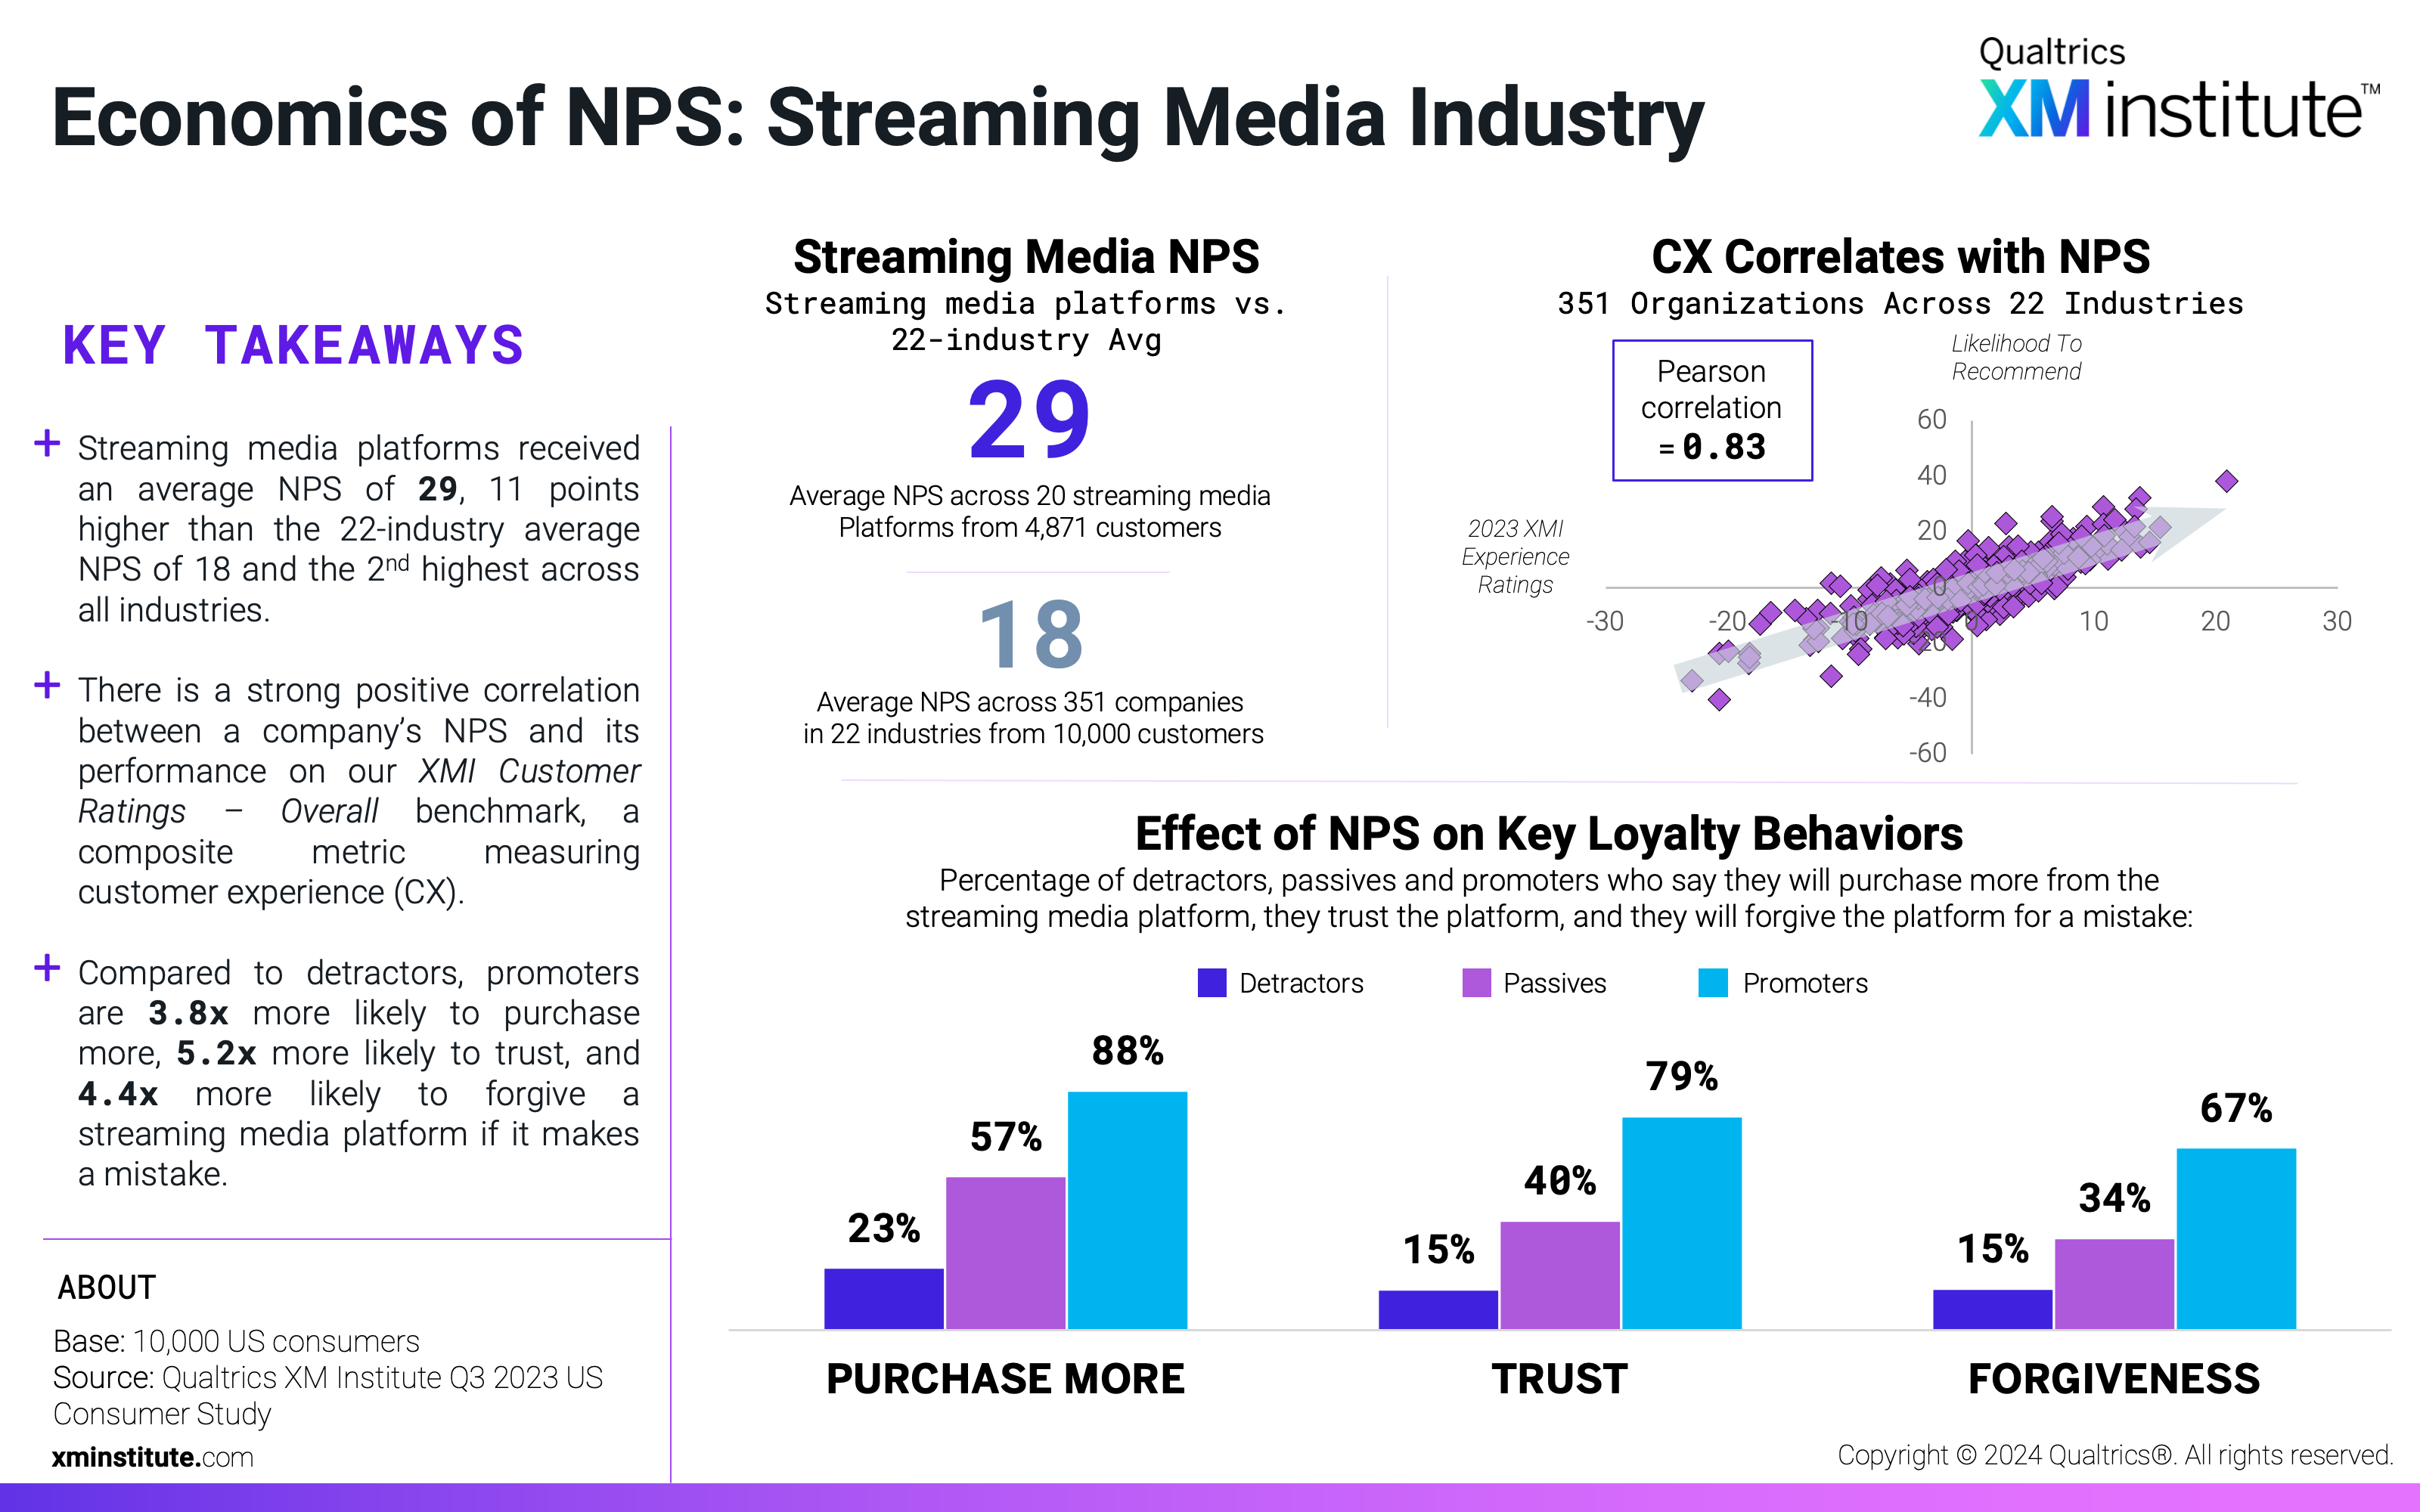
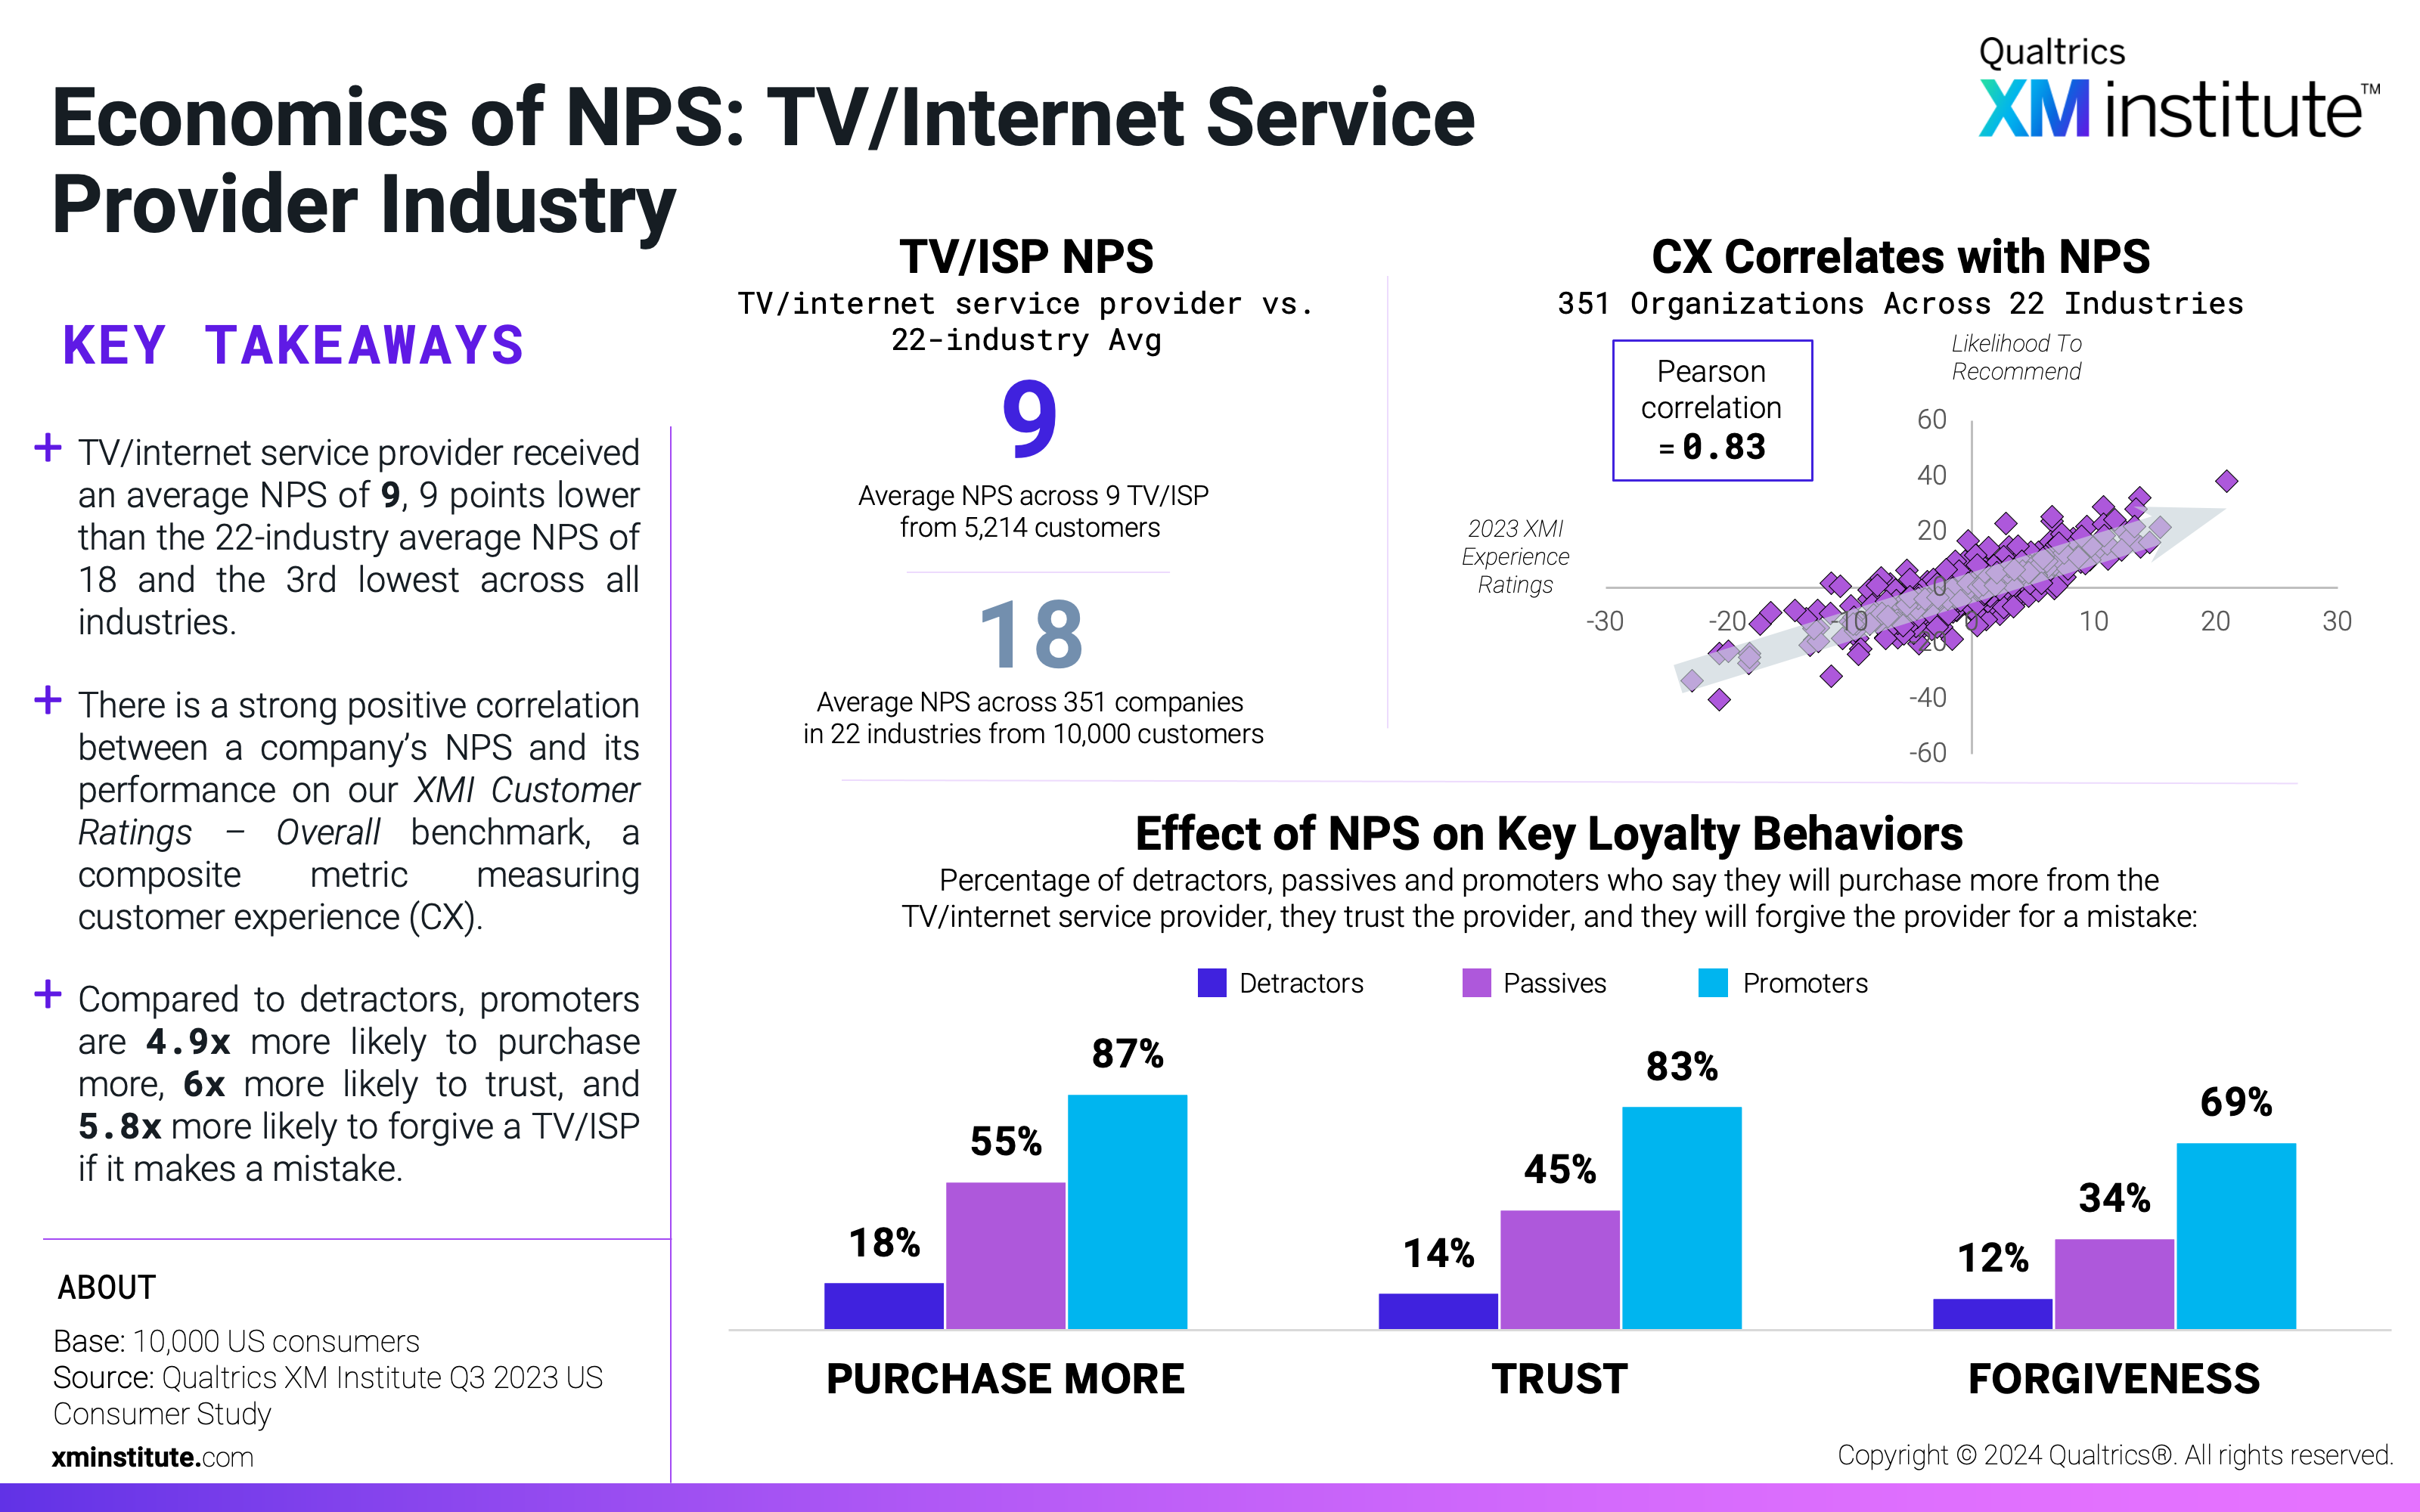
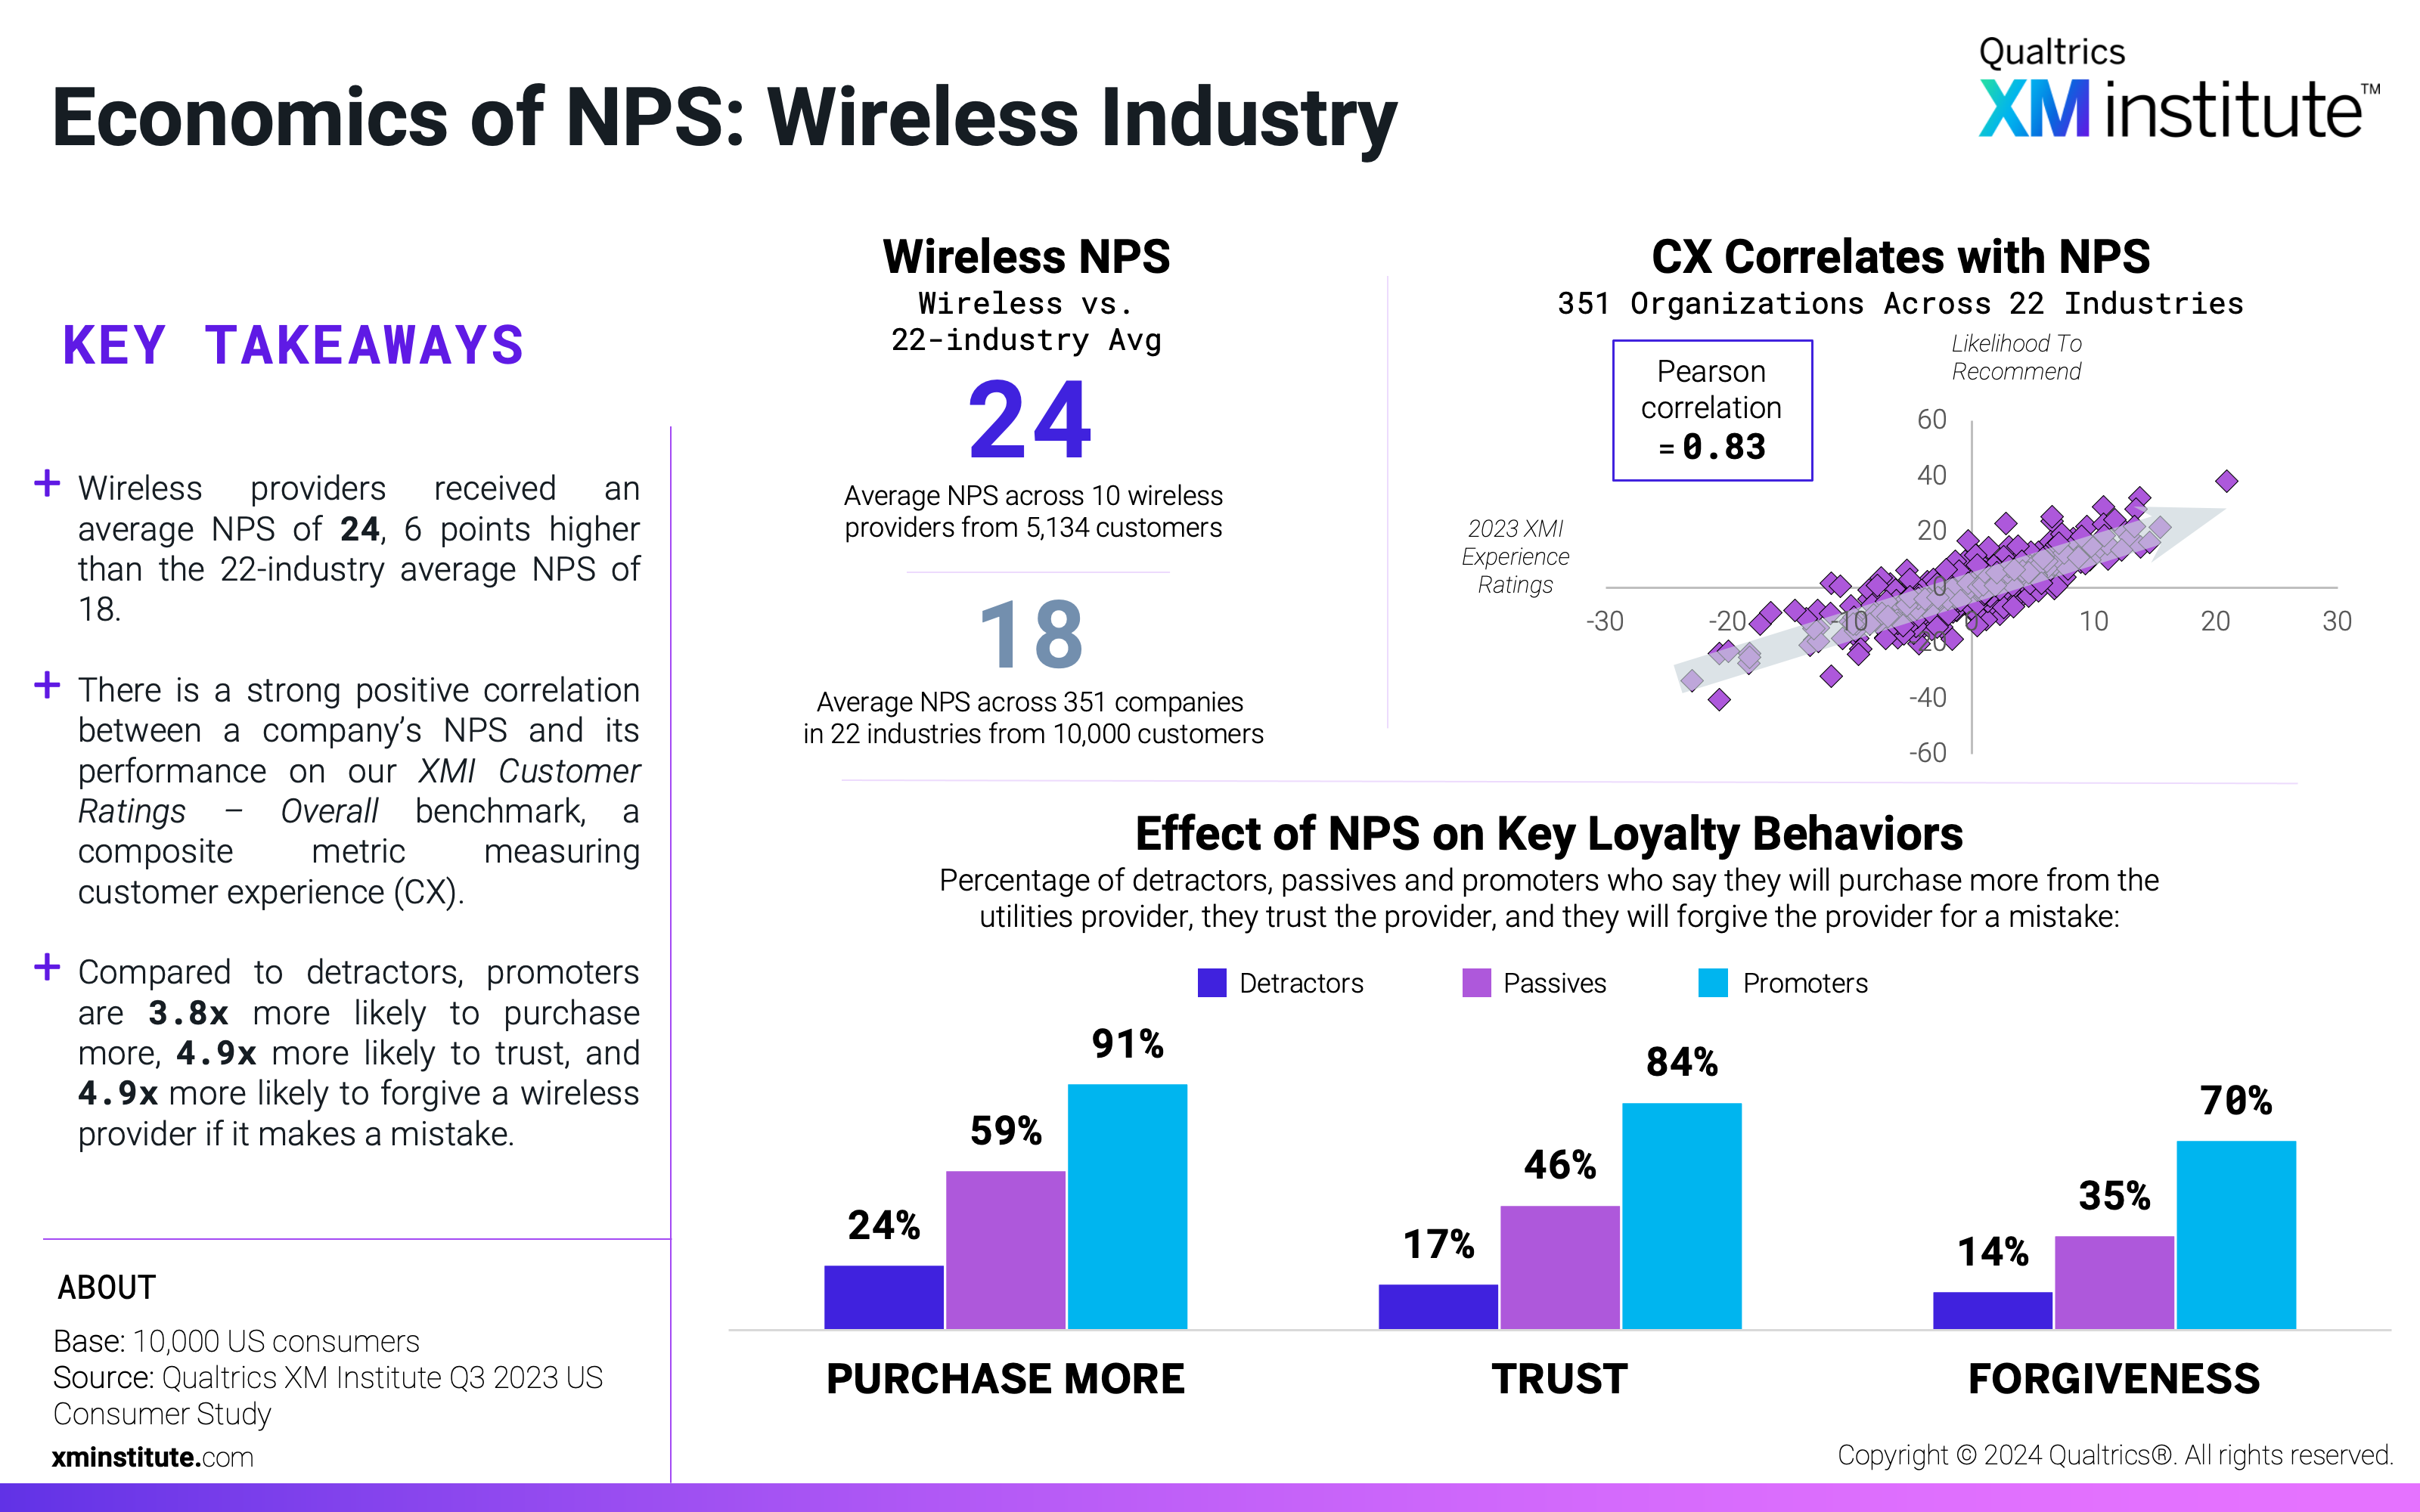
- NPS and CX are highly correlated. Using the XMI Customer Ratings – NPS and the XMI Customer Ratings – Overall scores calculated for each company, we found that NPS and customer experience are highly correlated, with a Pearson correlation coefficient of 0.83.
- Grocery received the highest industry NPS. The average NPS for the grocery industry is 30, the highest across all industries studied. Streaming media and retail come in second and third, respectively, each with a score of 29. At the other end of the spectrum, consumer payments (-6), car rentals (8), and TV/internet service providers (9) received the lowest scores.
- Consumer payments have the most to gain by converting detractors to promoters. Compared to detractors, promoters of consumer payments brands say they are likely to purchase more from the company 6.8 times more frequently, the largest difference across all industries. The grocery industry has the smallest differential – promoters are likely to purchase more just 2.5 times more frequently than detractors.
- Social media has the largest trust differential. Promoters of social media brands are significantly more likely to trust the company compared to detractors – they are 6.2 times as likely to trust, the largest gap in trust across all industries. Social media promoters also have the largest likelihood to forgive differential (6.2 times). Meanwhile, consumer payments promoters have the smallest forgiveness (2.3 times) and smallest trust (1.9 times) differentials.
Figures
Here are the figures in this data snapshot:
- Economics of NPS: Airline Industry (see Figure 1)
- Economics of NPS: Auto Industry (see Figure 2)
- Economics of NPS: Banking Industry (see Figure 3)
- Economics of NPS: Car Rental Industry (see Figure 4)
- Economics of NPS: Computer & Tablet Industry (see Figure 5)
- Economics of NPS: Consumer Payment Industry (see Figure 6)
- Economics of NPS: Electronics Industry (see Figure 7)
- Economics of NPS: Fast Food Industry (see Figure 8)
- Economics of NPS: Food Takeout & Delivery Industry (see Figure 9)
- Economics of NPS: Grocery Industry (see Figure 10)
- Economics of NPS: Health Insurance Industry (see Figure 11)
- Economics of NPS: Hotel Industry (see Figure 12)
- Economics of NPS: Insurance Industry (see Figure 13)
- Economics of NPS: Investment Industry (see Figure 14)
- Economics of NPS: Parcel Delivery Industry (see Figure 15)
- Economics of NPS: Retail Industry (see Figure 16)
- Economics of NPS: Software Industry (see Figure 17)
- Economics of NPS: Social Media Industry (see Figure 18)
- Economics of NPS: Streaming Media Industry (see Figure 19)
- Economics of NPS: TV/Internet Service Provider Industry (see Figure 20)
- Economics of NPS: Utilities Industry (see Figure 21)
- Economics of NPS: Wireless Industry (see Figure 22)
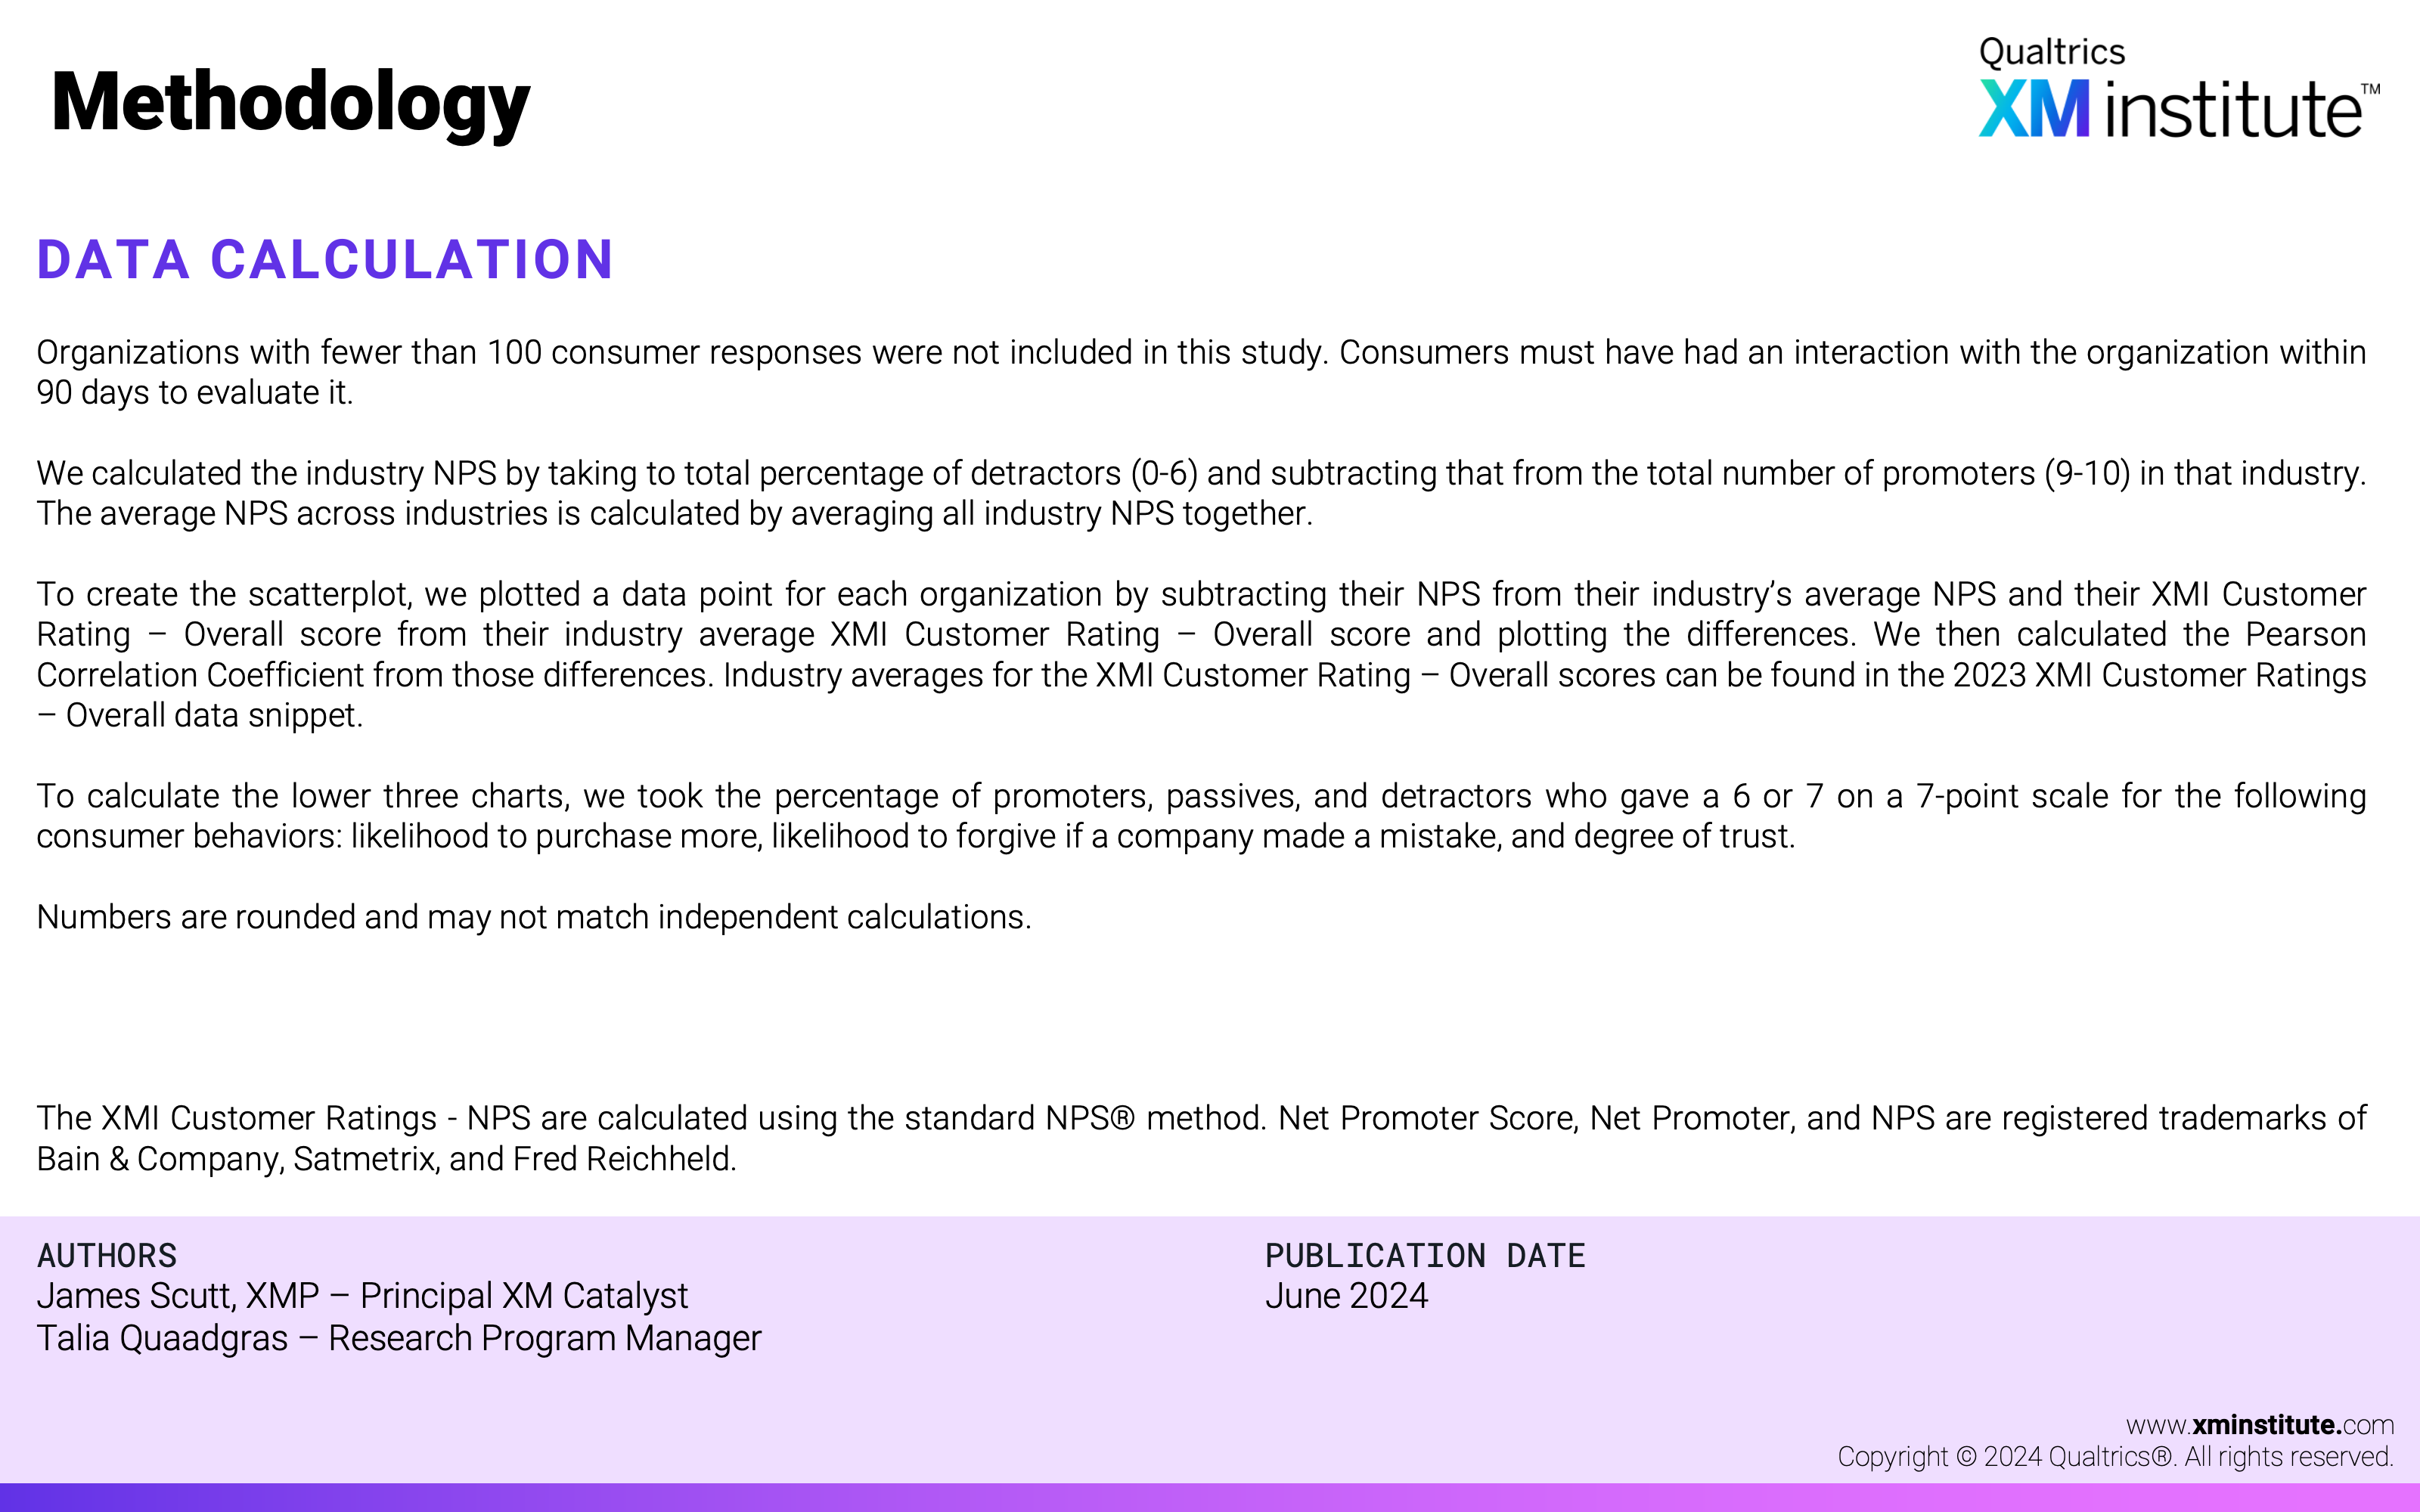
- Methodology (see Figure 23)