Key Findings
As part of Qualtrics’ global employee study, employees from 27 countries rated their current work experience across 14 components. From this study, we were able to analyze five key performance indicators (Engagement, Inclusion, Intent to Stay, Well-Being, and Experience vs Expectations) for employee experience across each country and work levels within each country. In this snapshot, we share the metrics from the Americas*. We found that:
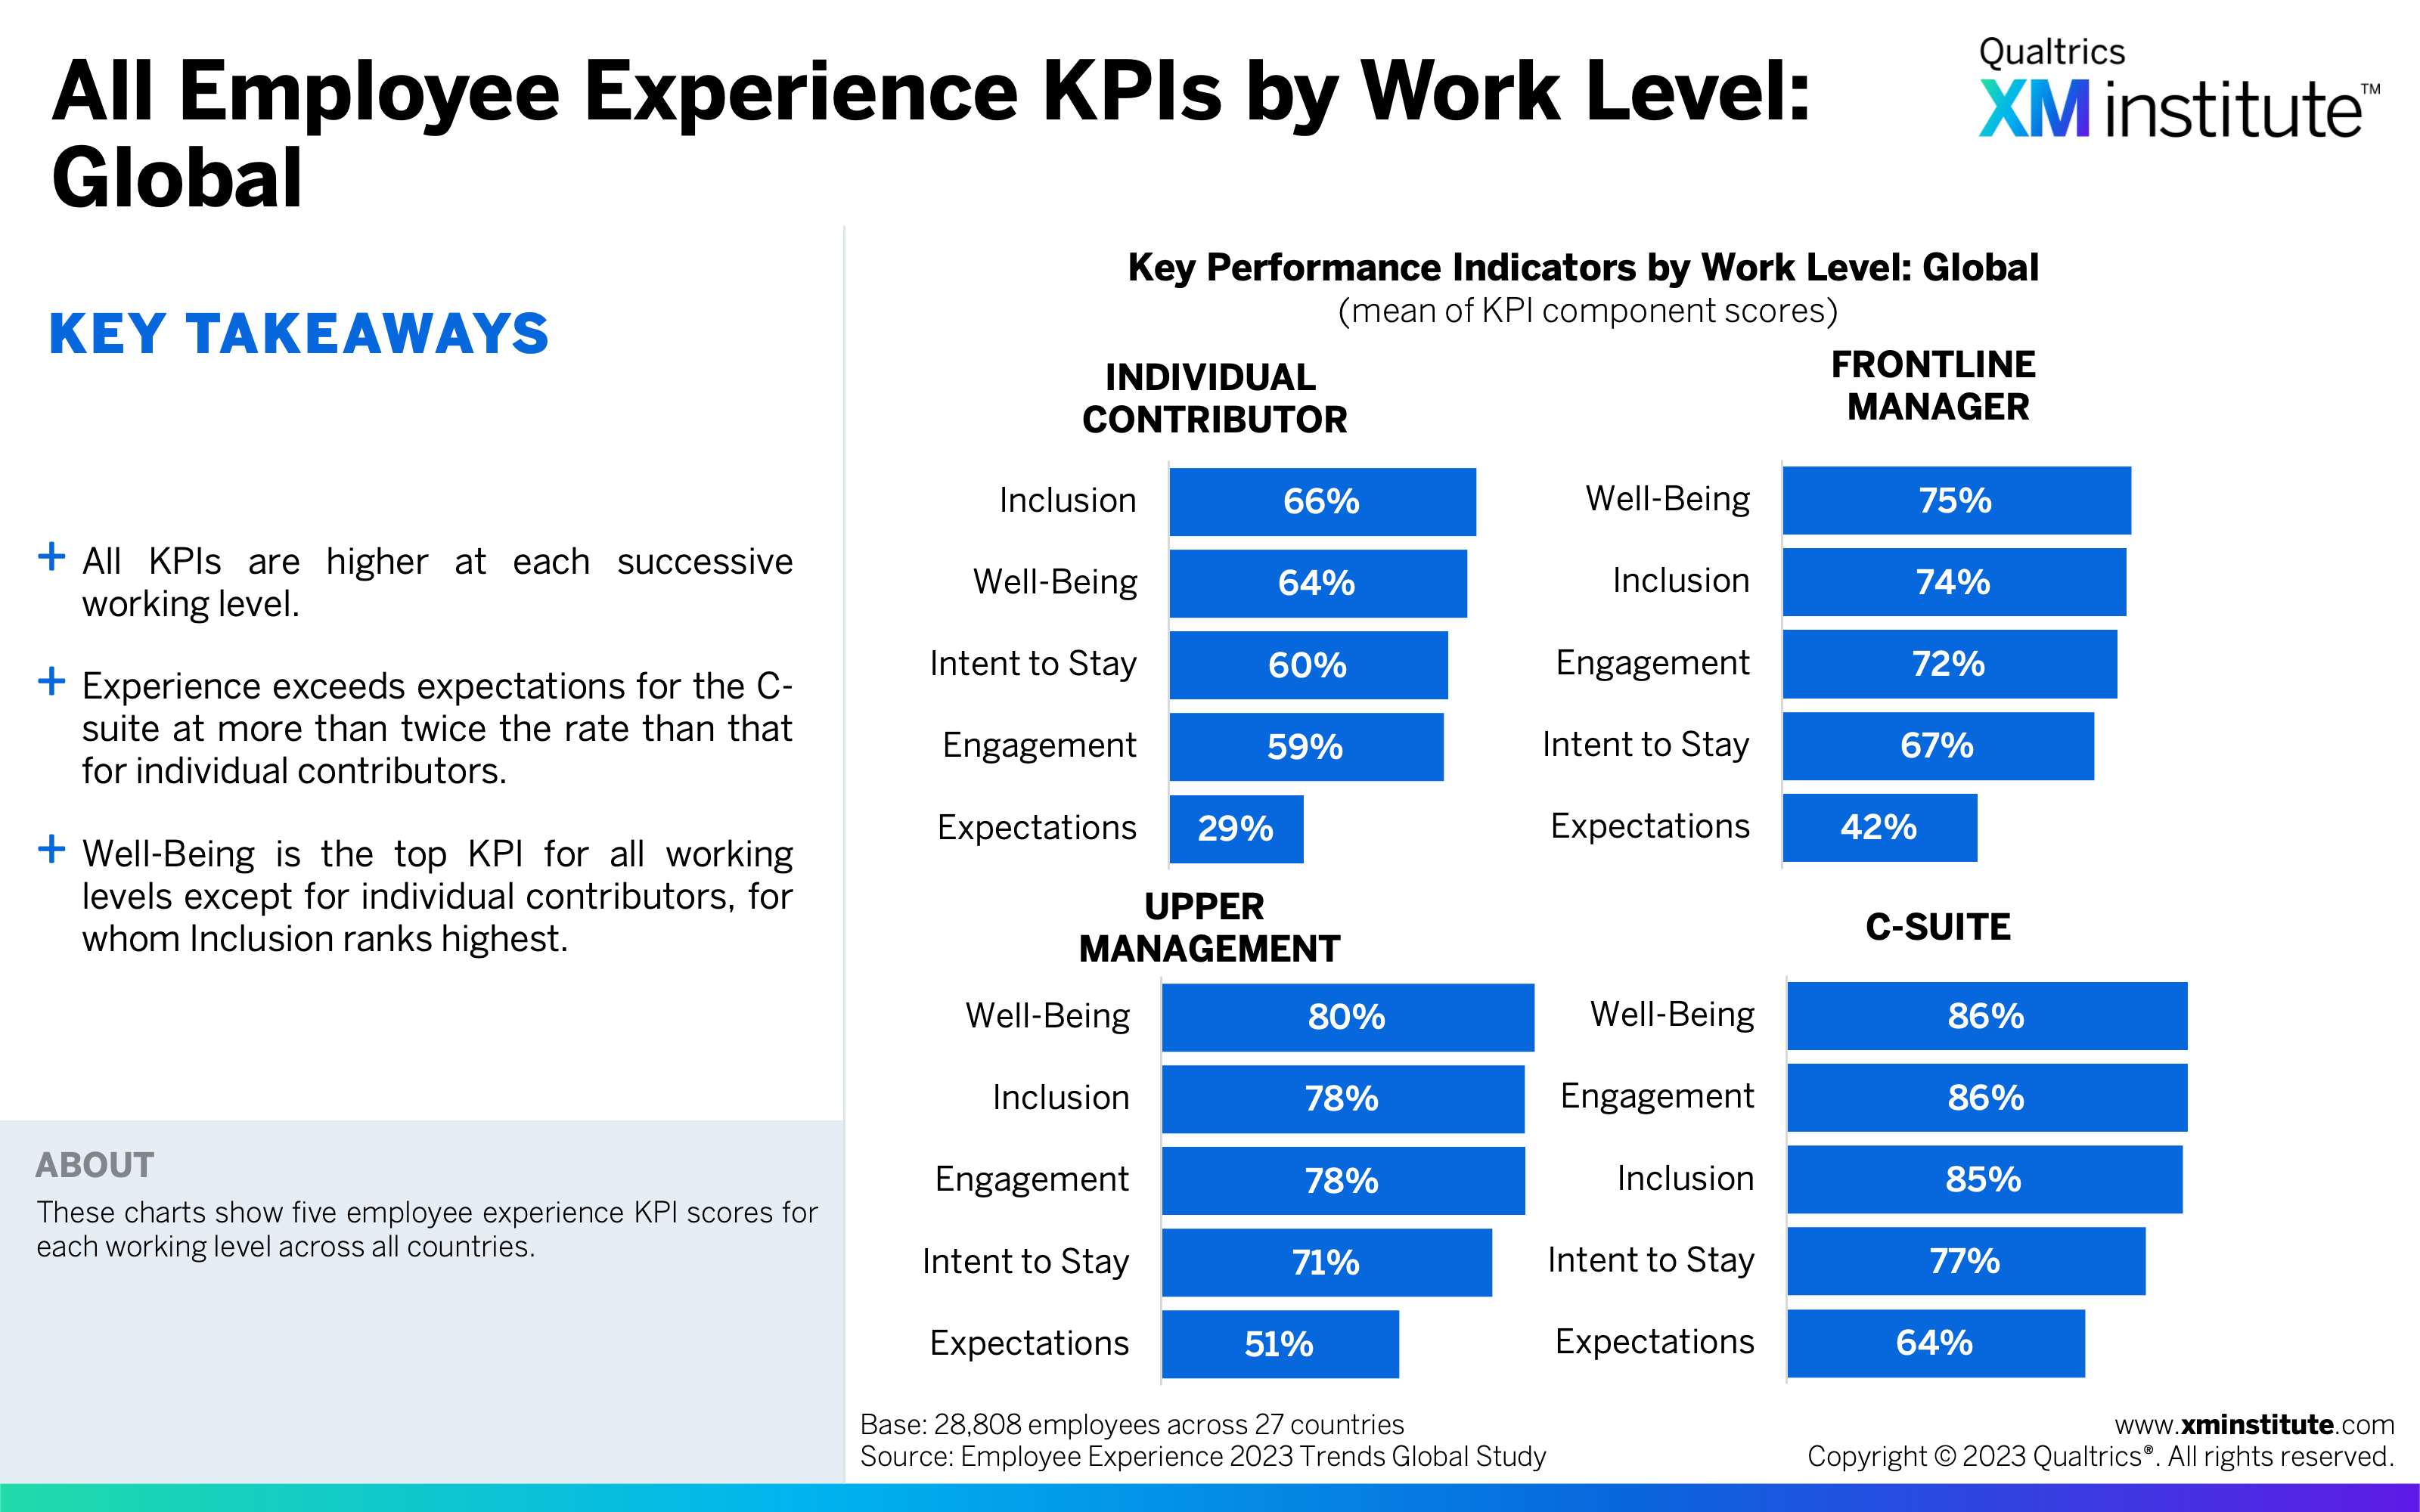
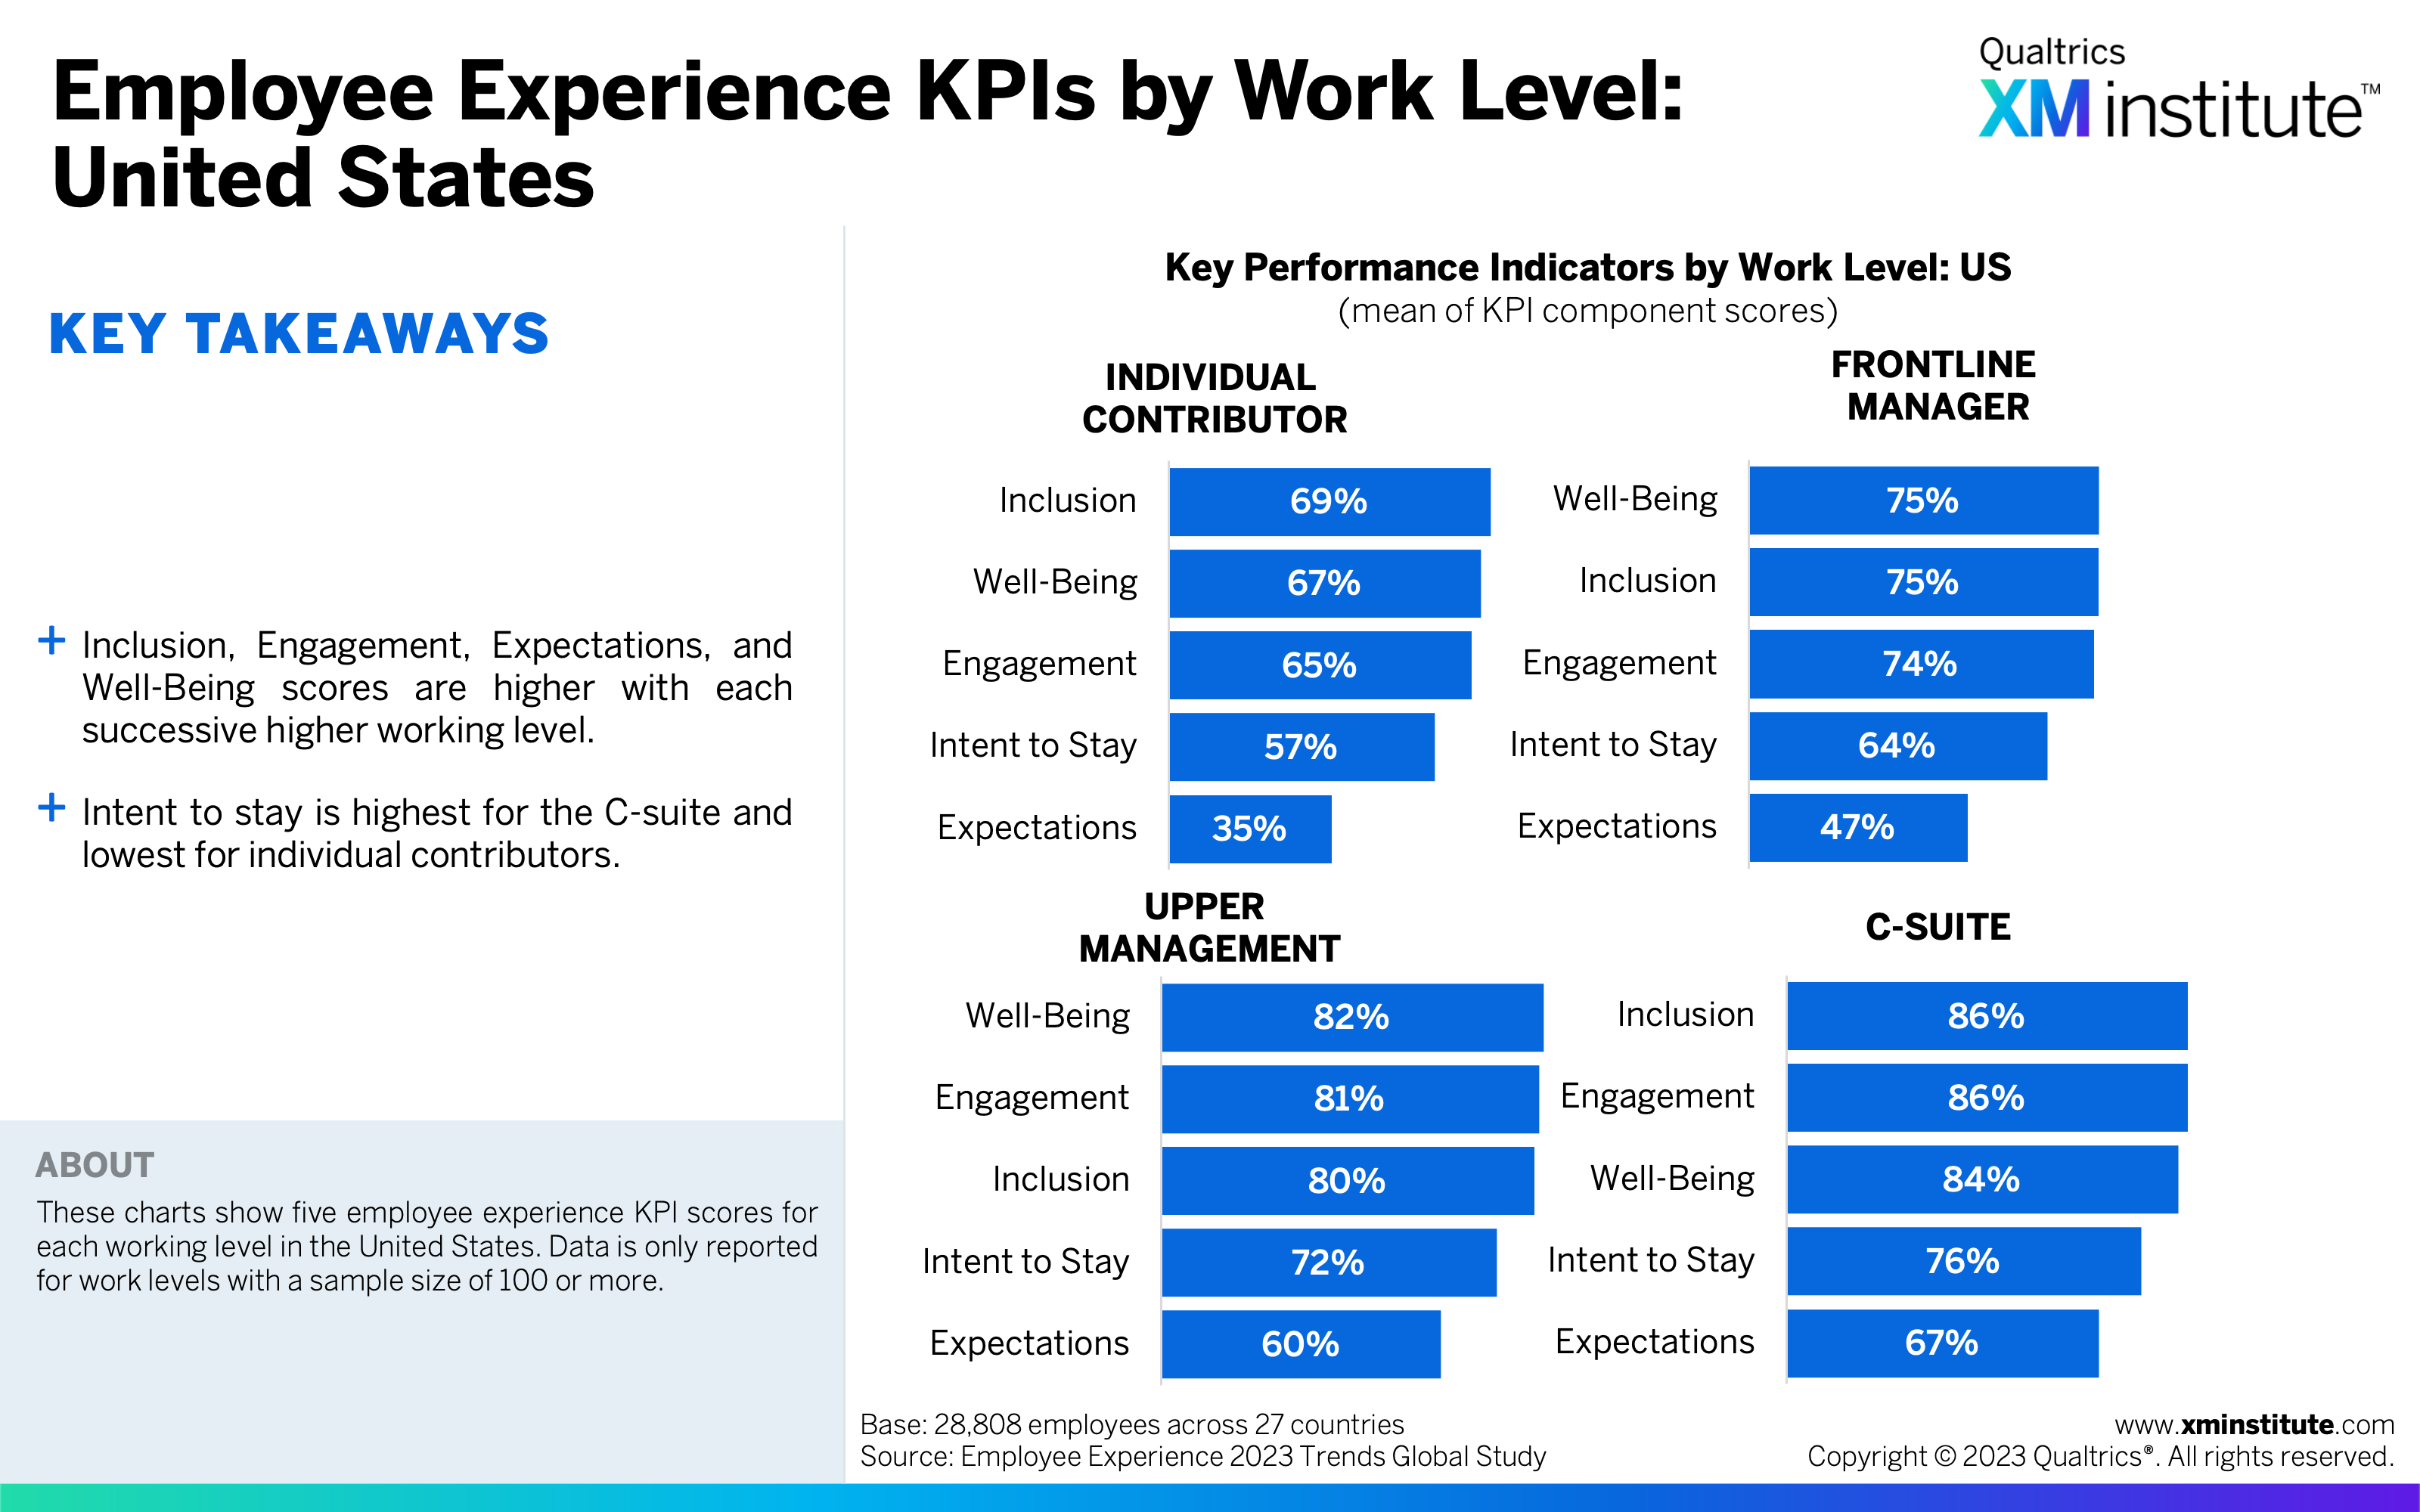
- There is an experience gap between work levels. Individual contributors provide lower Inclusion, Well-Being, and Engagement scores than all other working levels. Frontline managers provide lower KPI scores than higher-level employees. C-suite executives report that their experience exceeded their expectations at twice the rate of individual contributors.
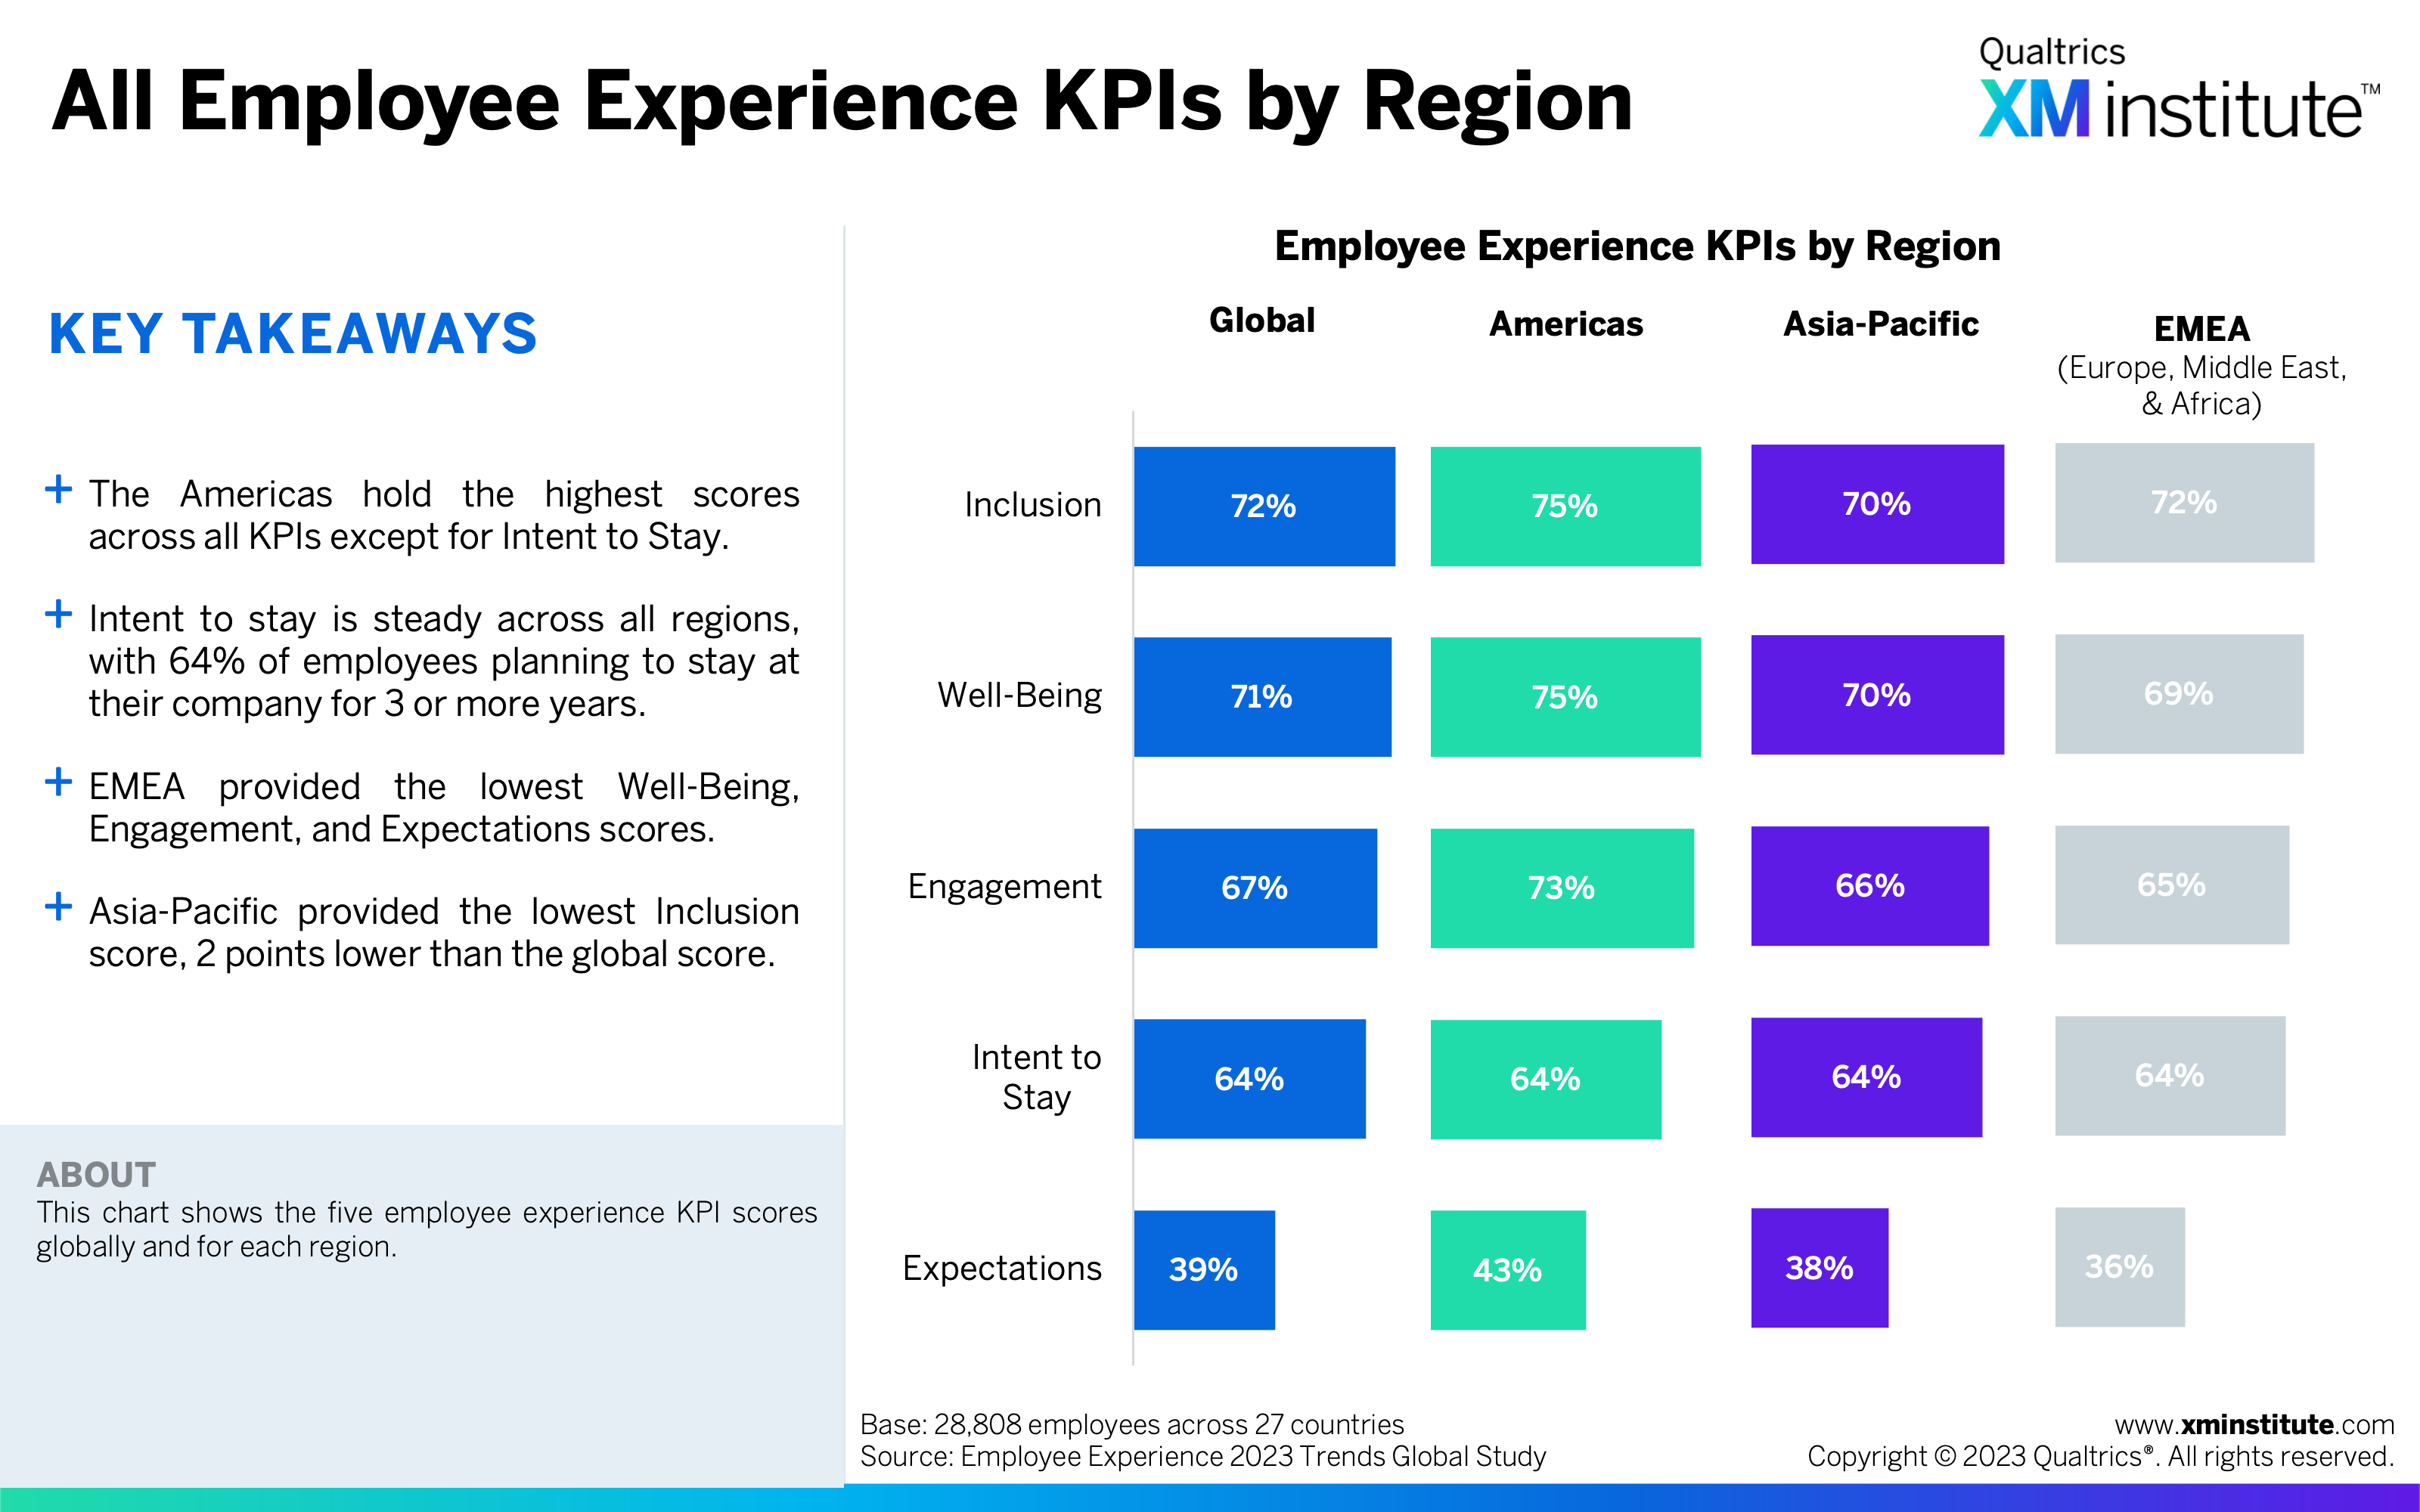
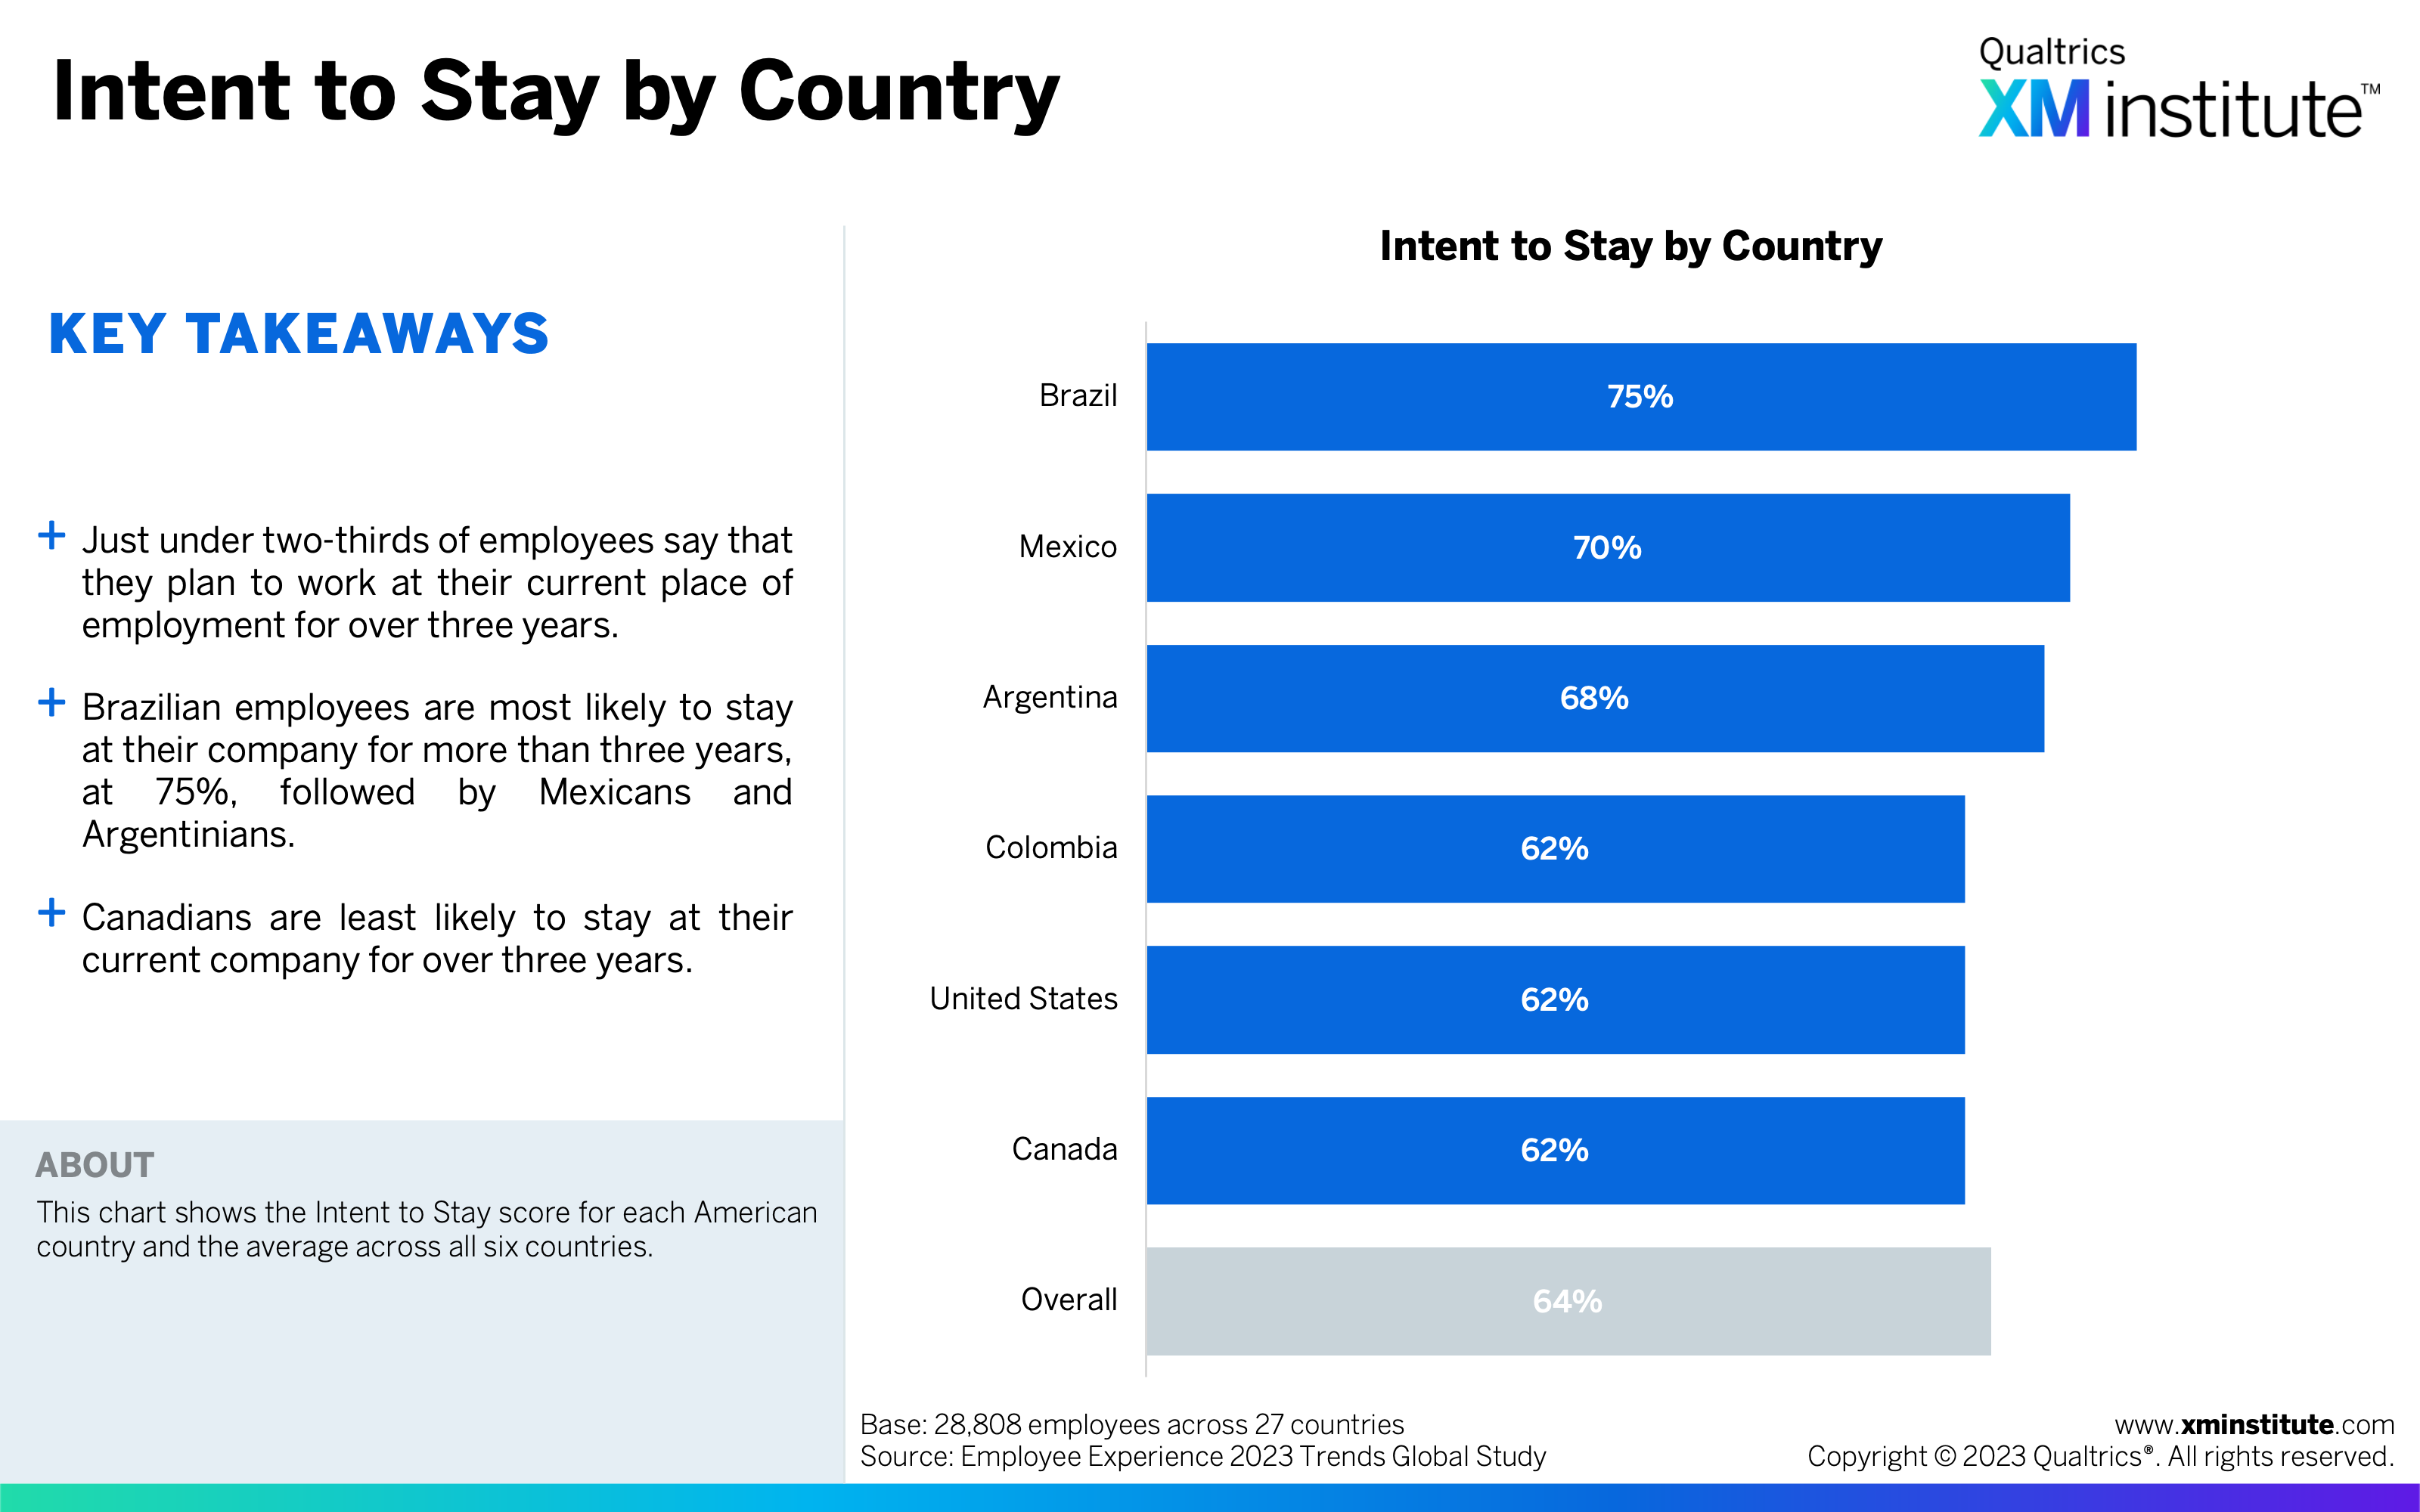
- American companies should expect one-third of their workforce to leave in the next three years. Just 64% of workers plan to stay at their current place of employment for more than three years. Intent to stay is highest for C-suite and lowest for individual contributors. Brazilians have the highest propensity to stay, while Canadians are most likely to move on to a new company.
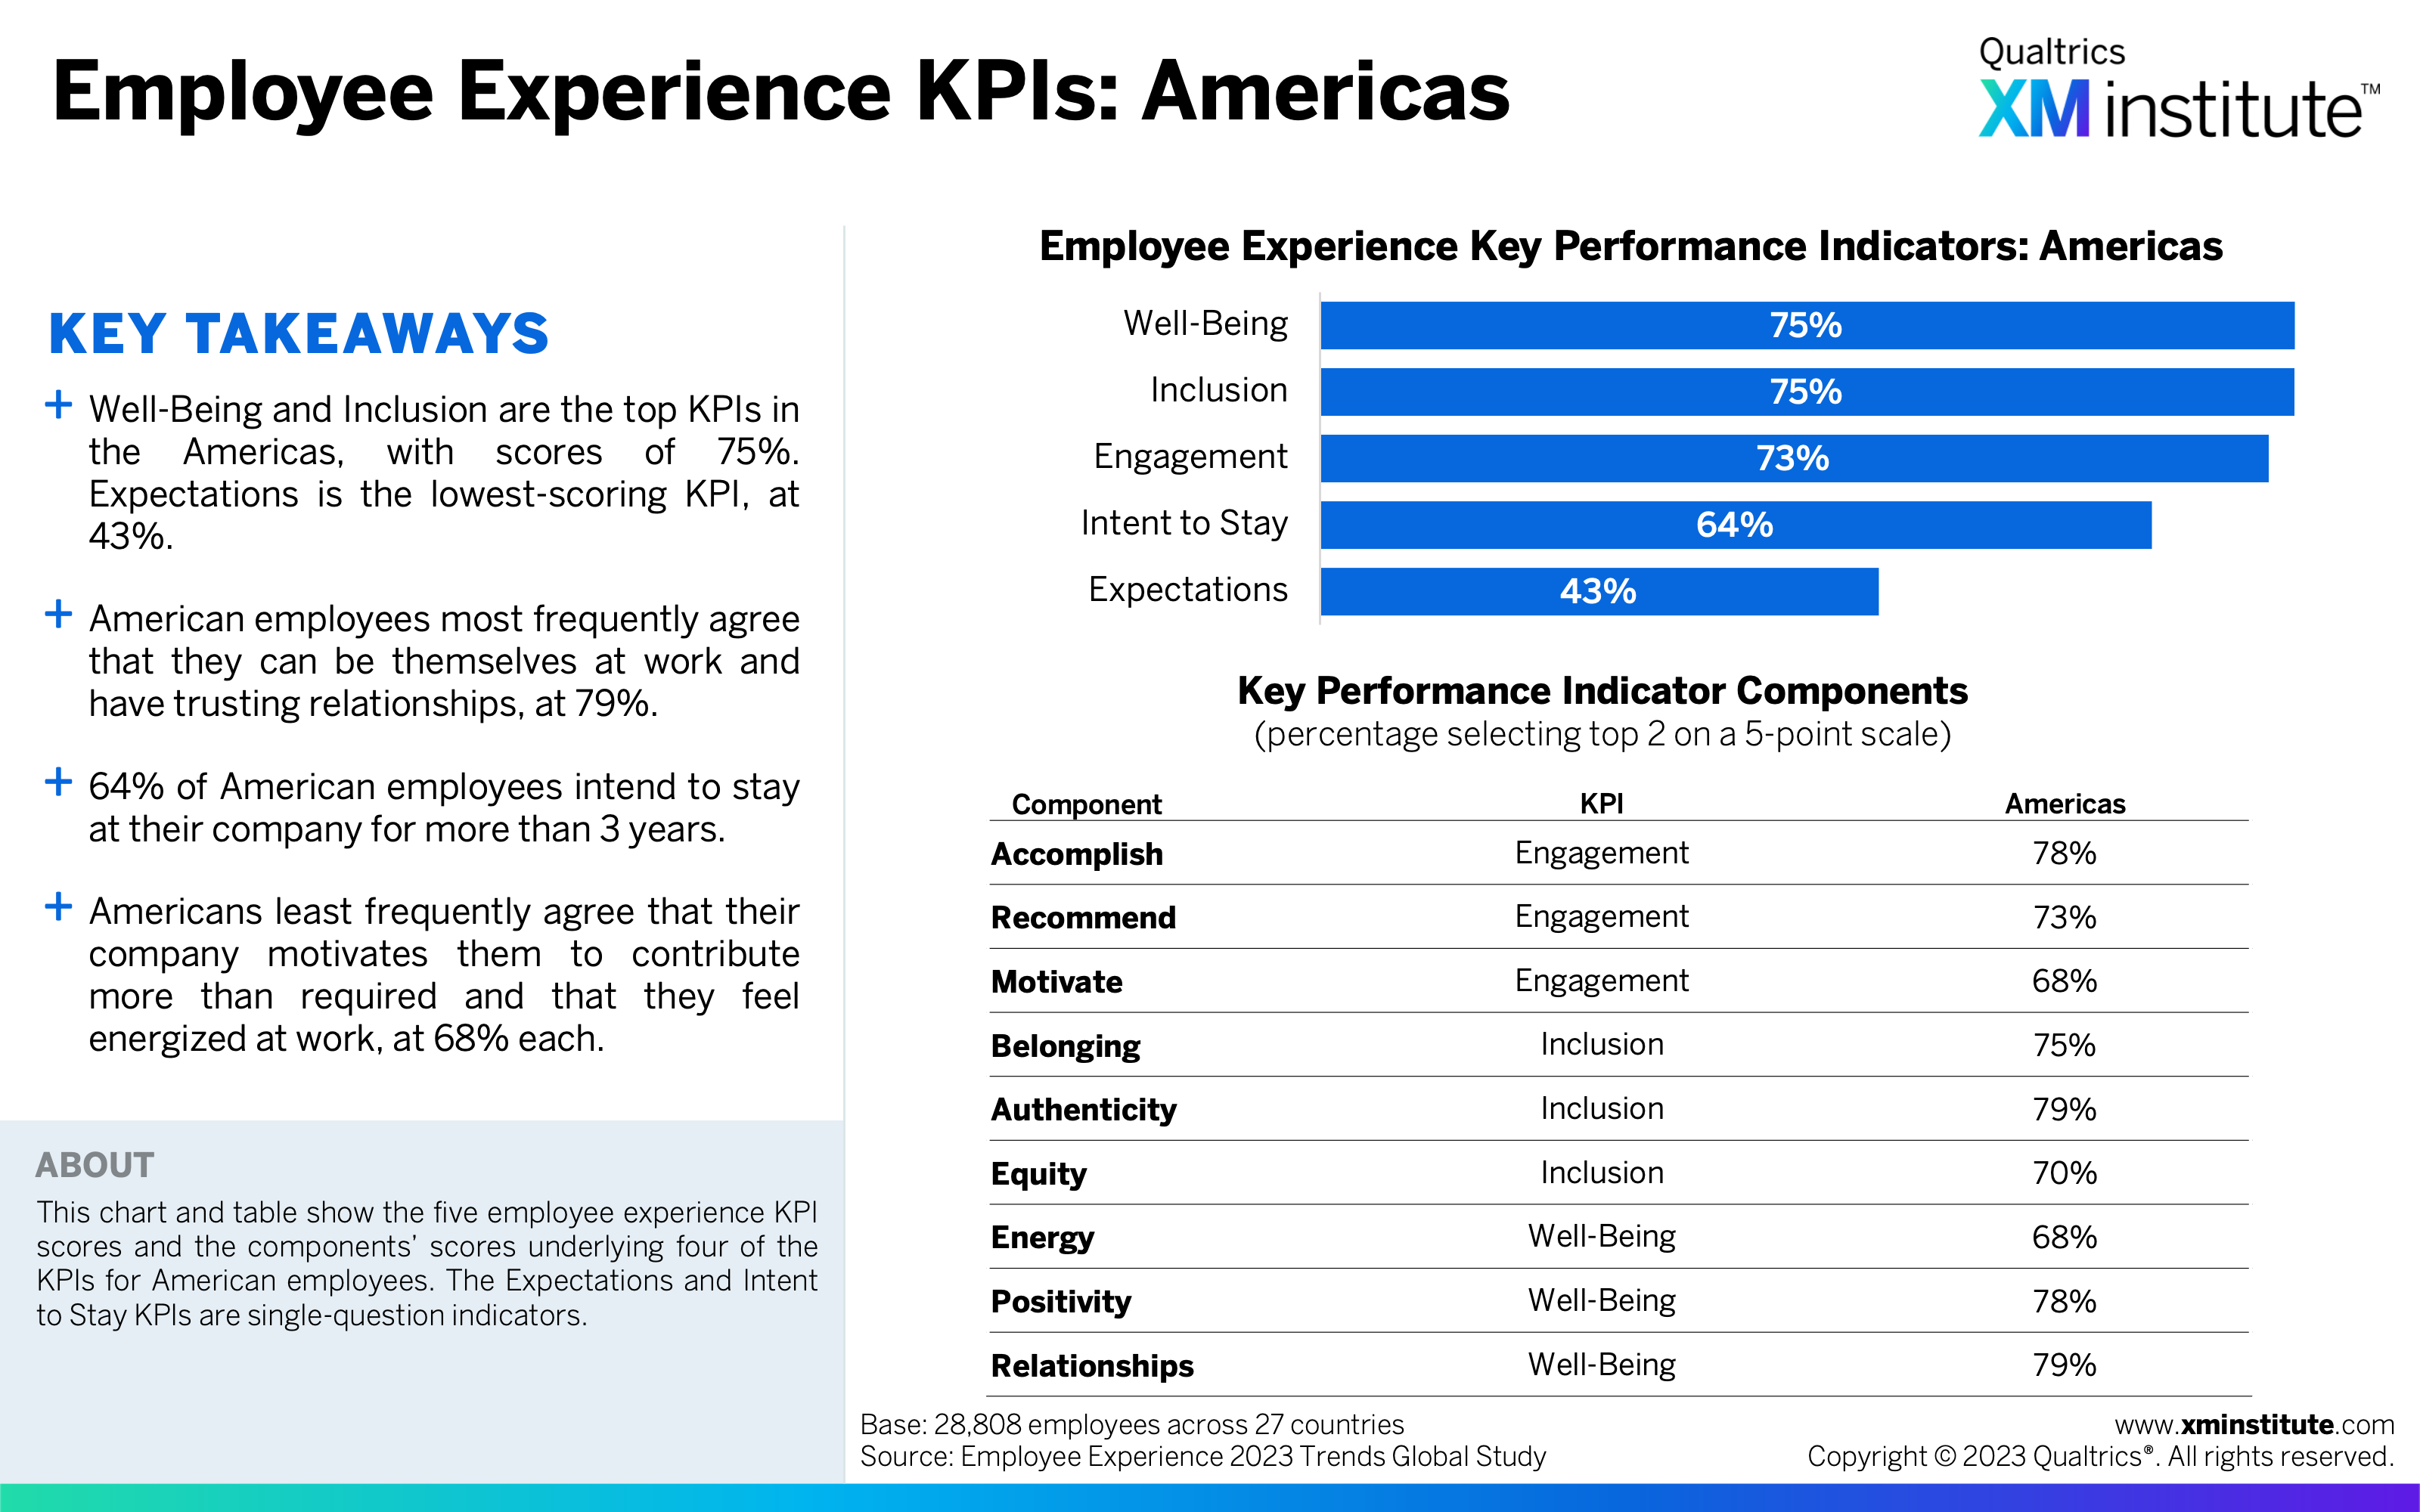
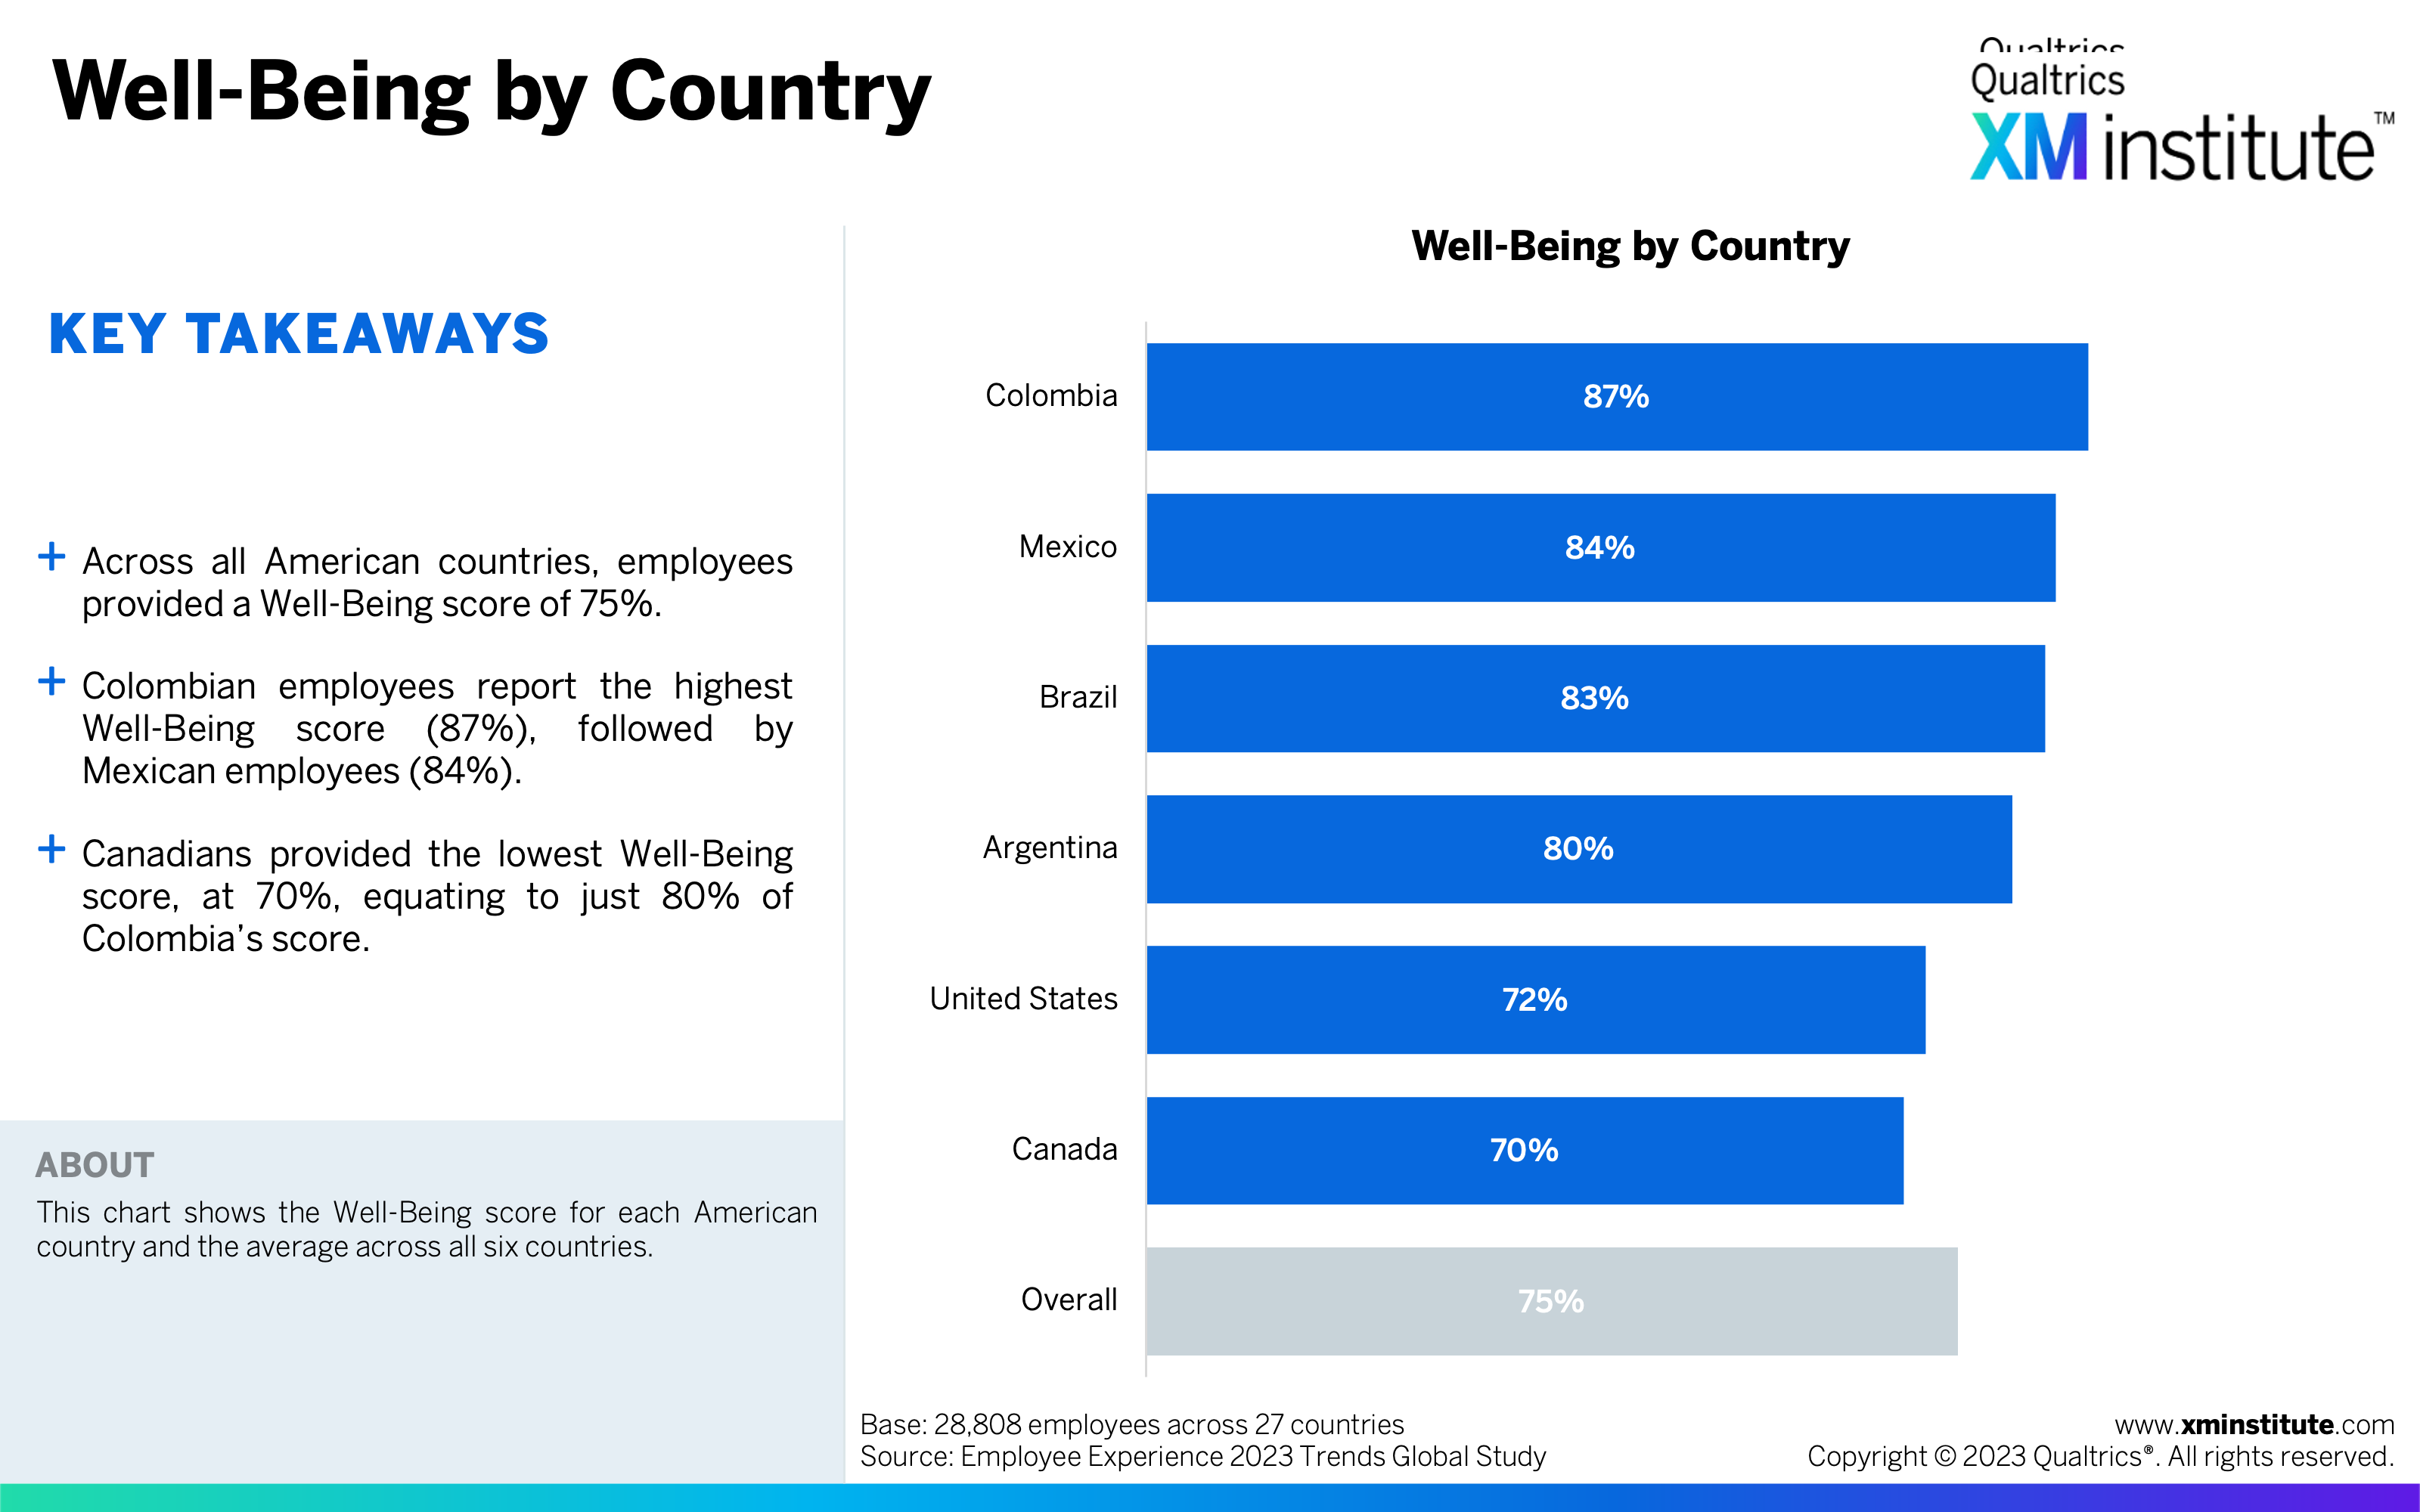
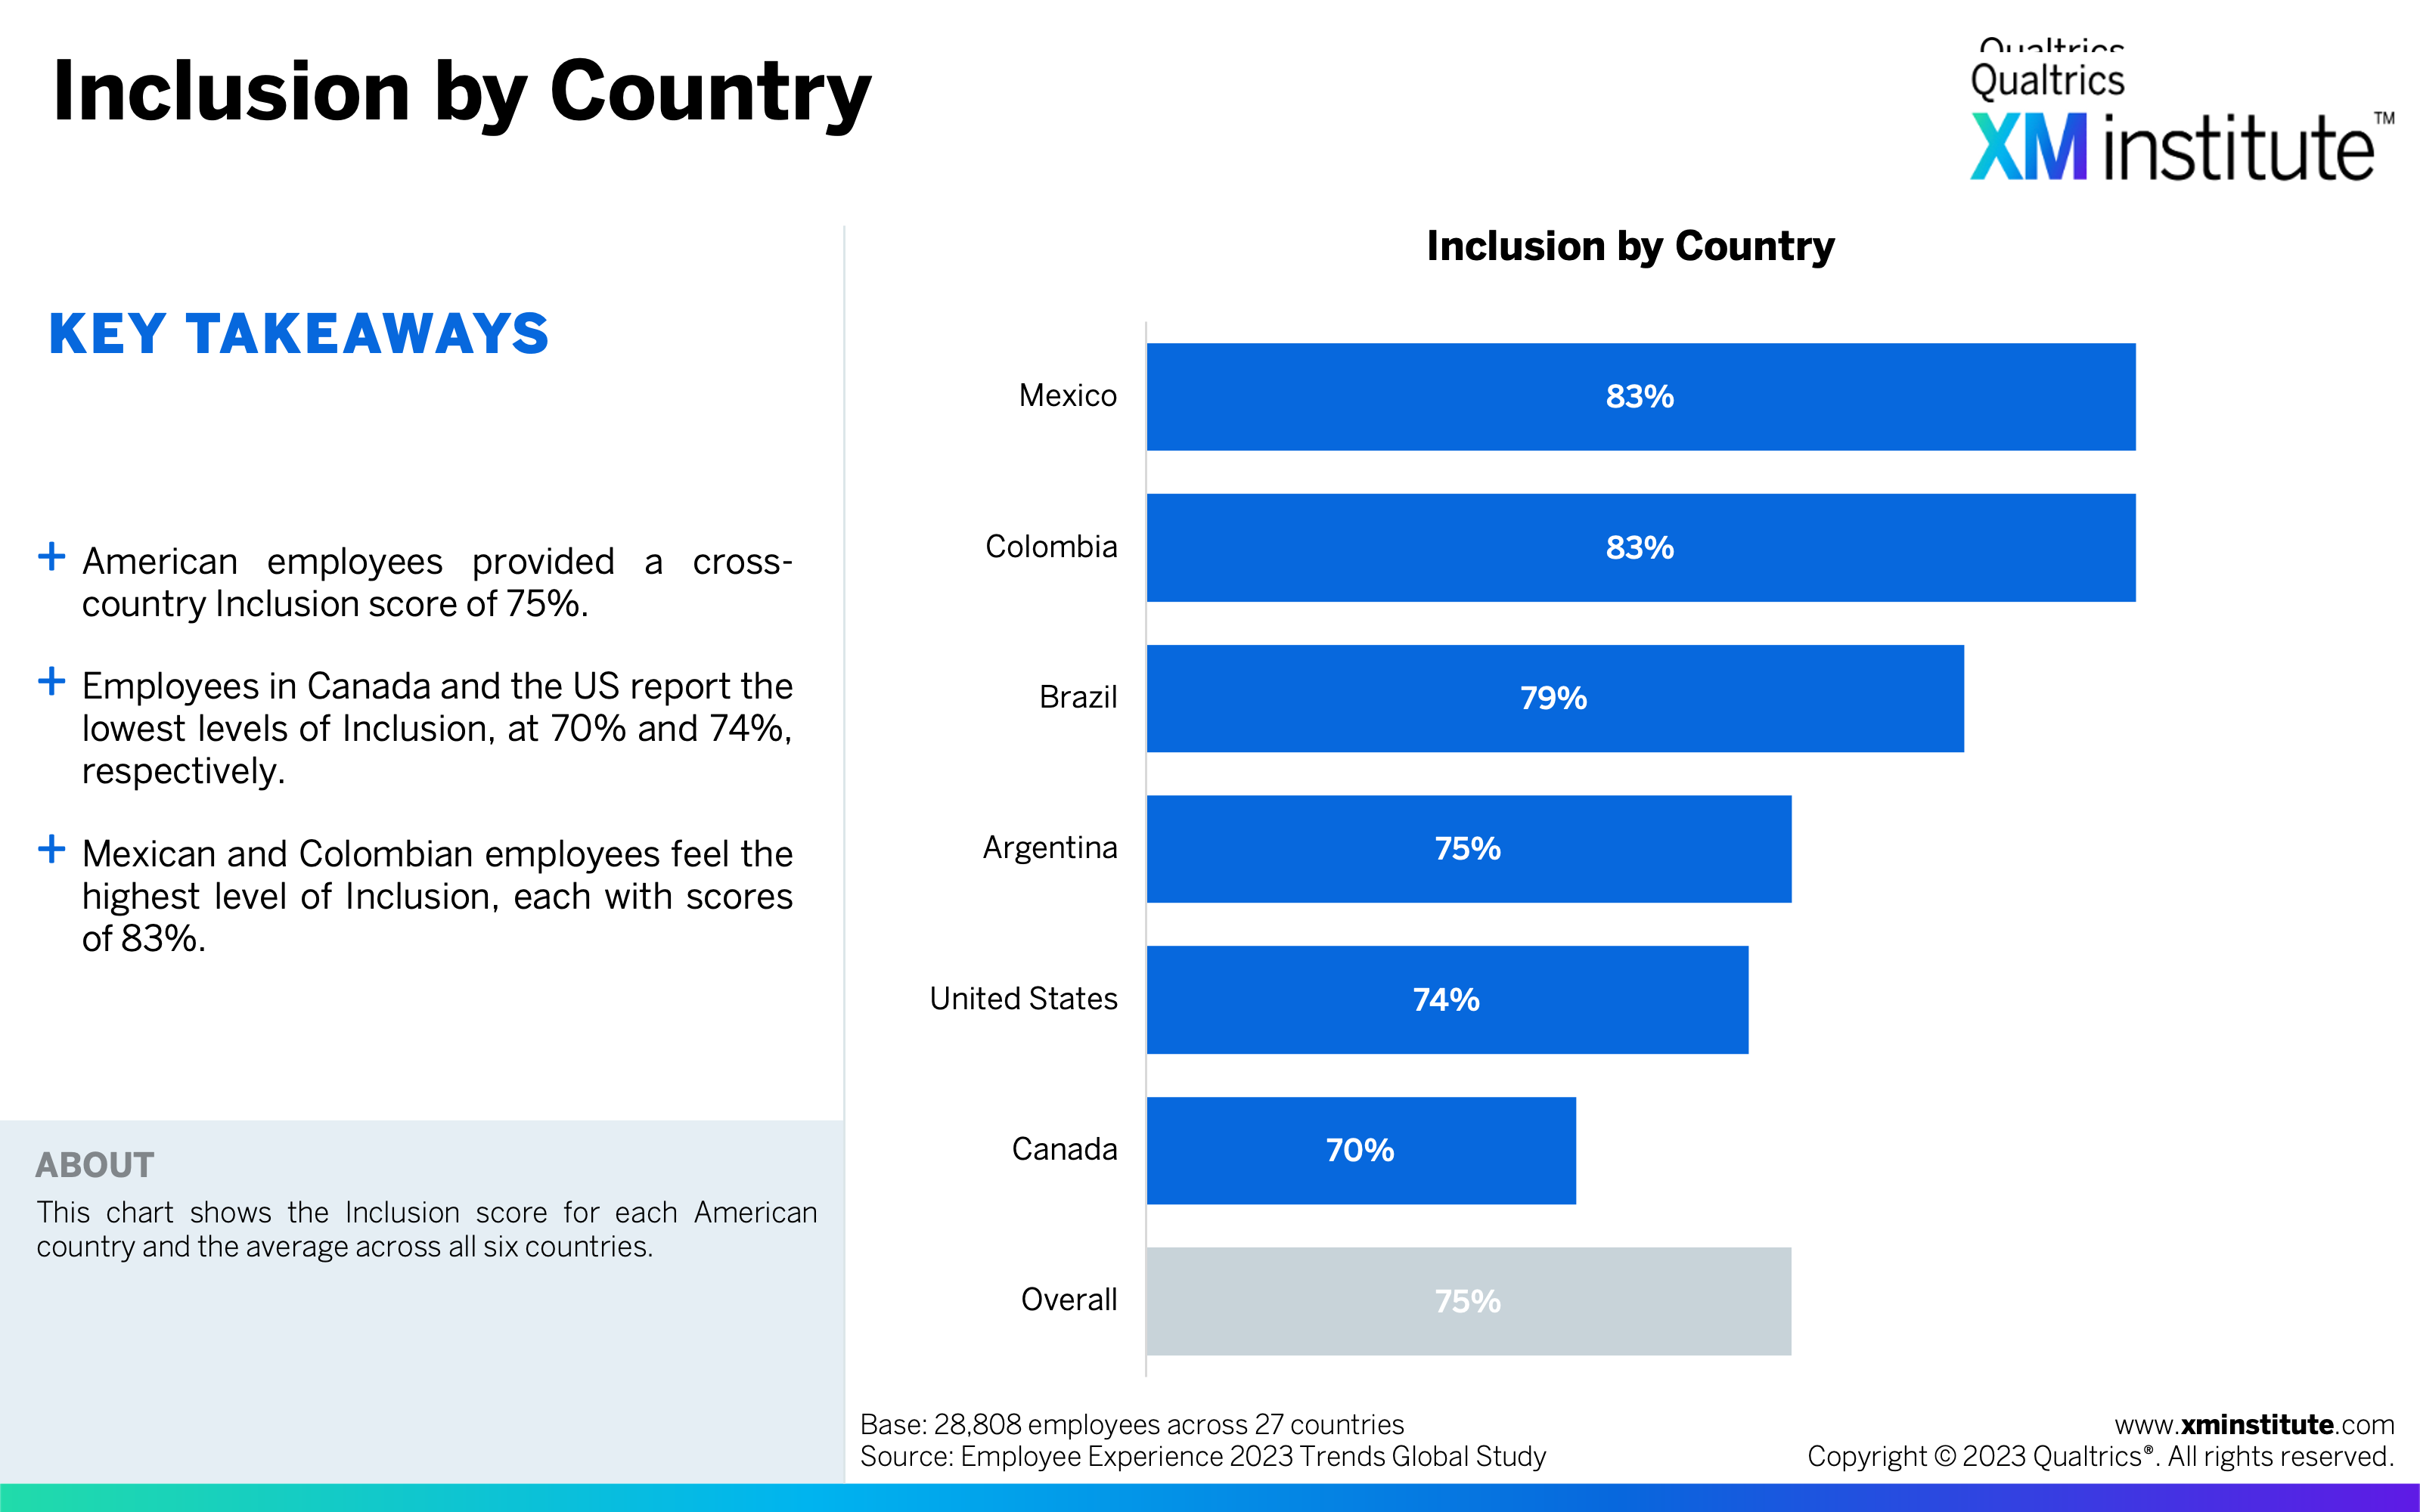
- American employees provided high Inclusion and Well-Being scores. Across all regions, the Americas scored their workplaces highest on the Inclusion and Well-Being KPIs (75%), higher than these KPIs in both Asia-Pacific and EMEA. Mexico and Colombia both provided the top scores for each of these KPIs.
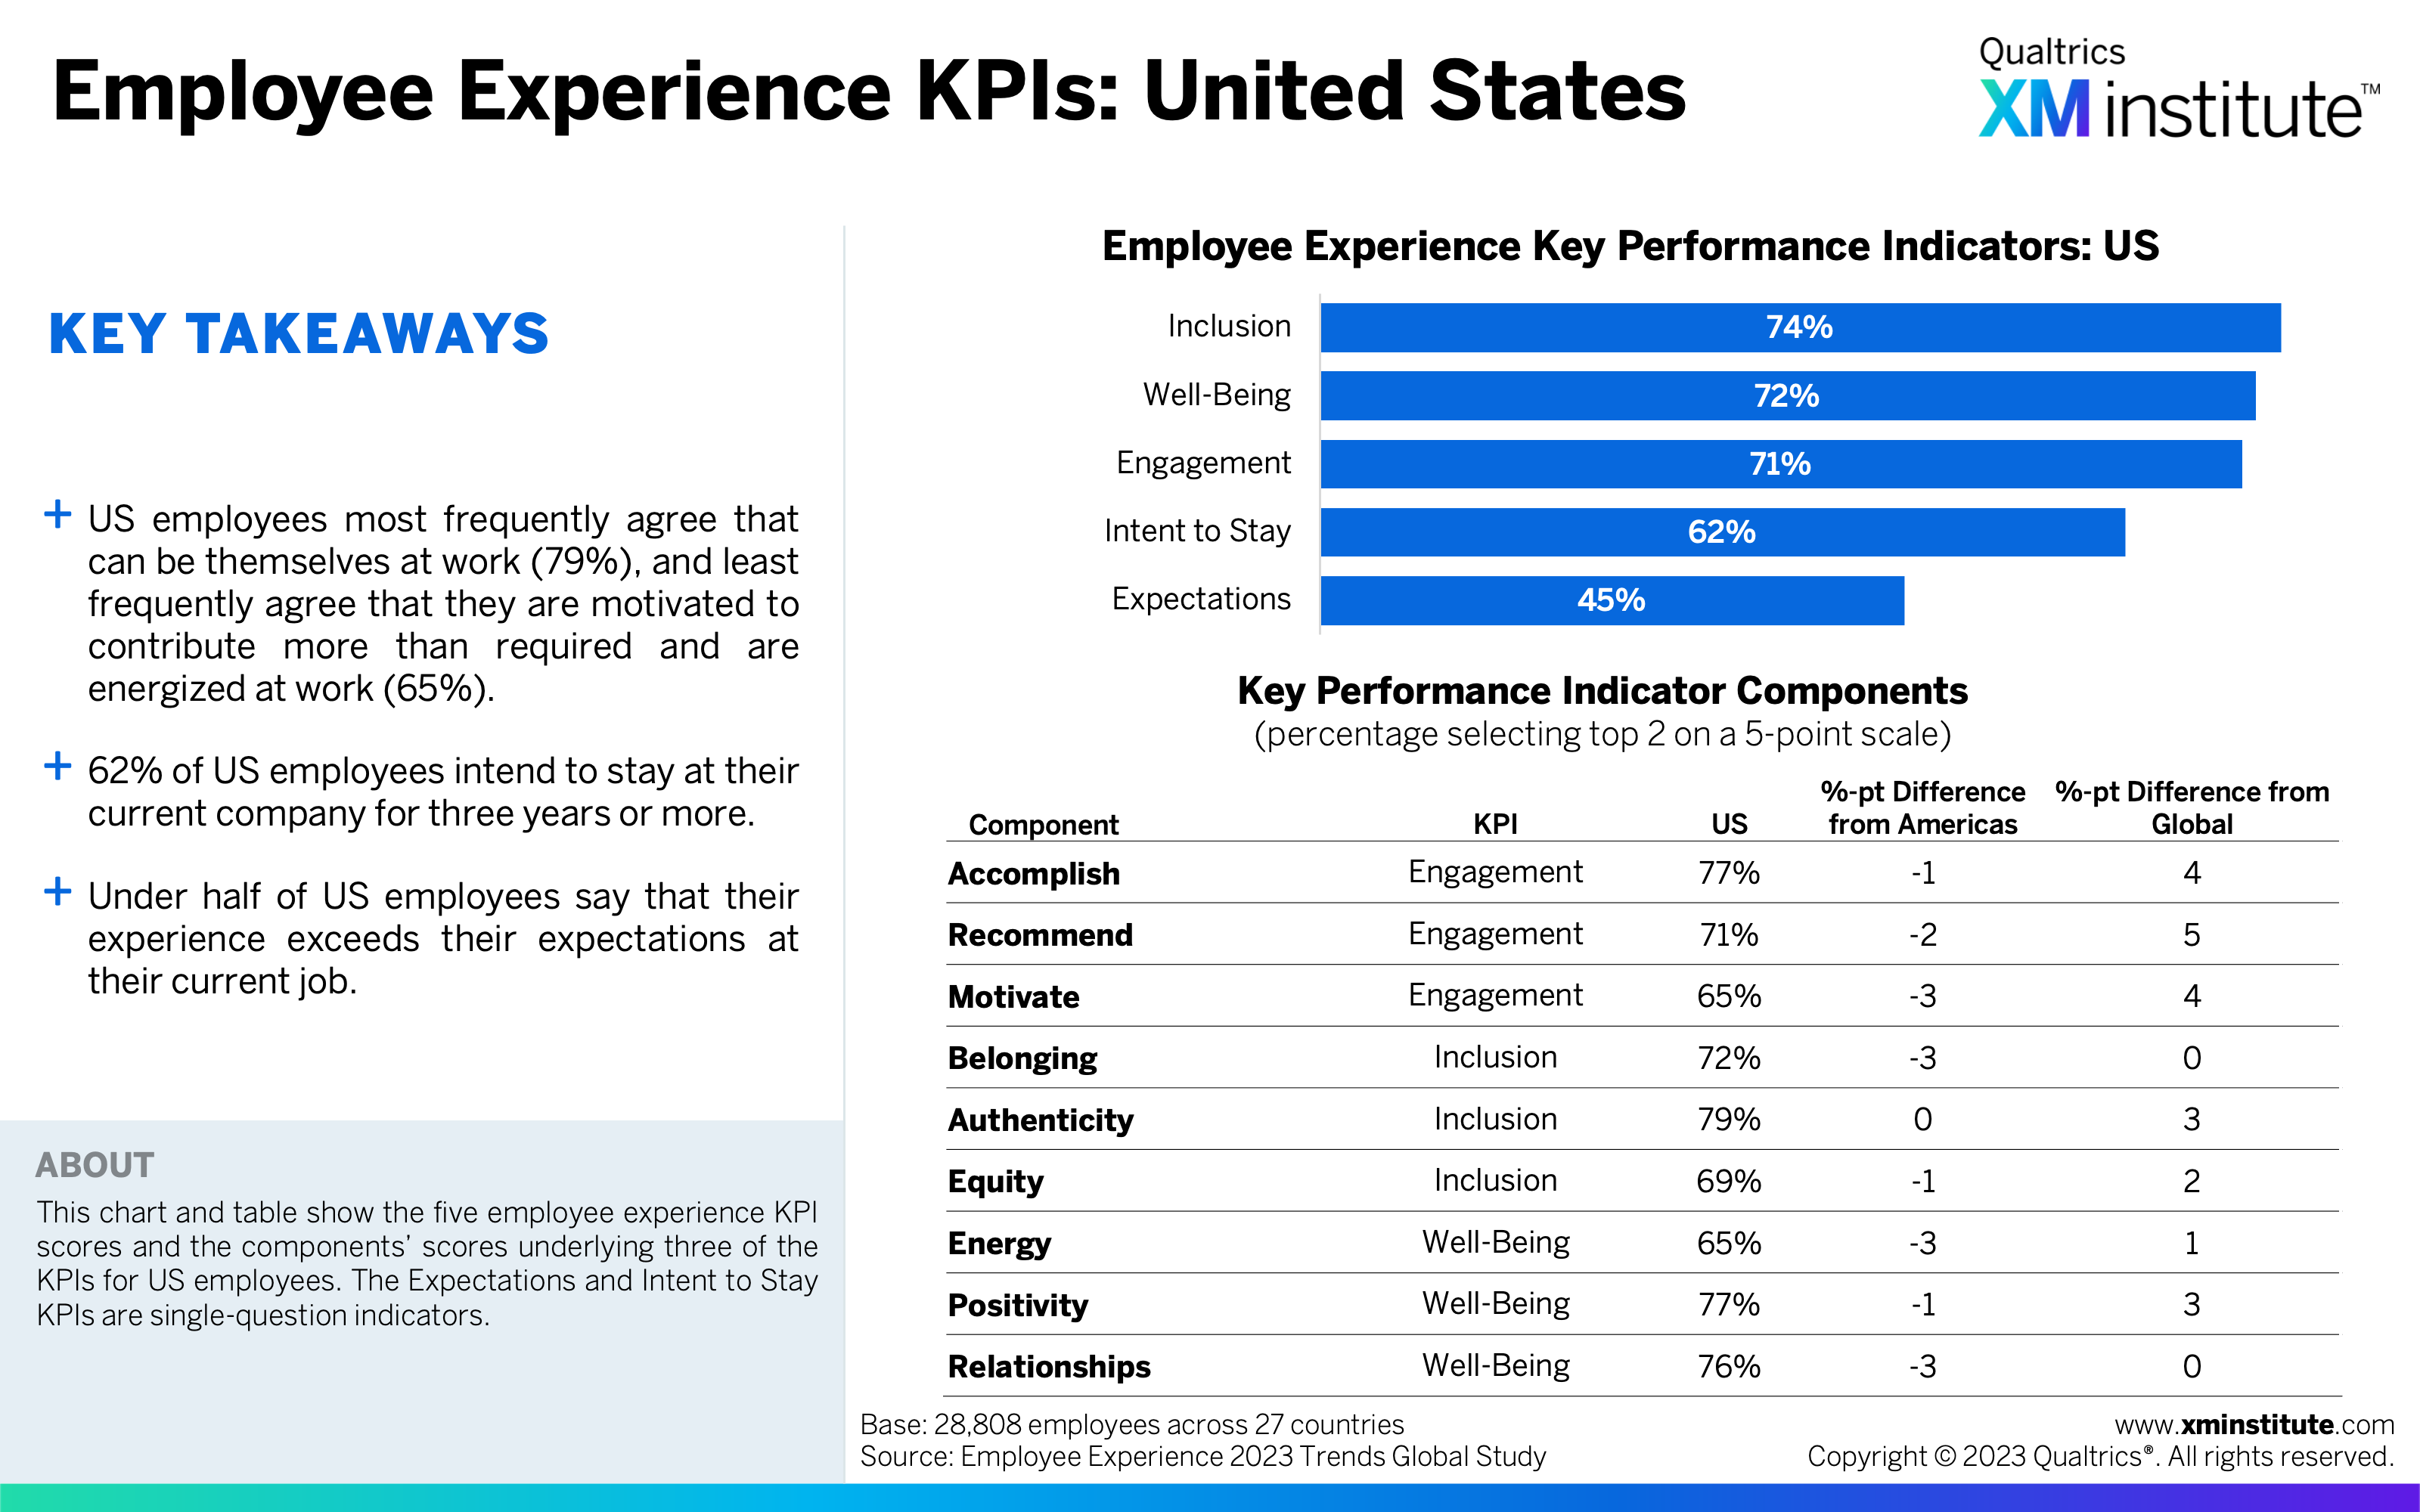
- Americans have good working relationships. Seventy-nine percent of Americans agree that they have trusting relationships at work, three points higher than the global metrics. The same percentage of Americans also agree that they can be themselves at work, with Colombian and Mexican employees saying this most frequently.
*In this data snapshot, all residents of North and South America are referred to as Americans.
Figures
Here are the figures in this data snapshot:
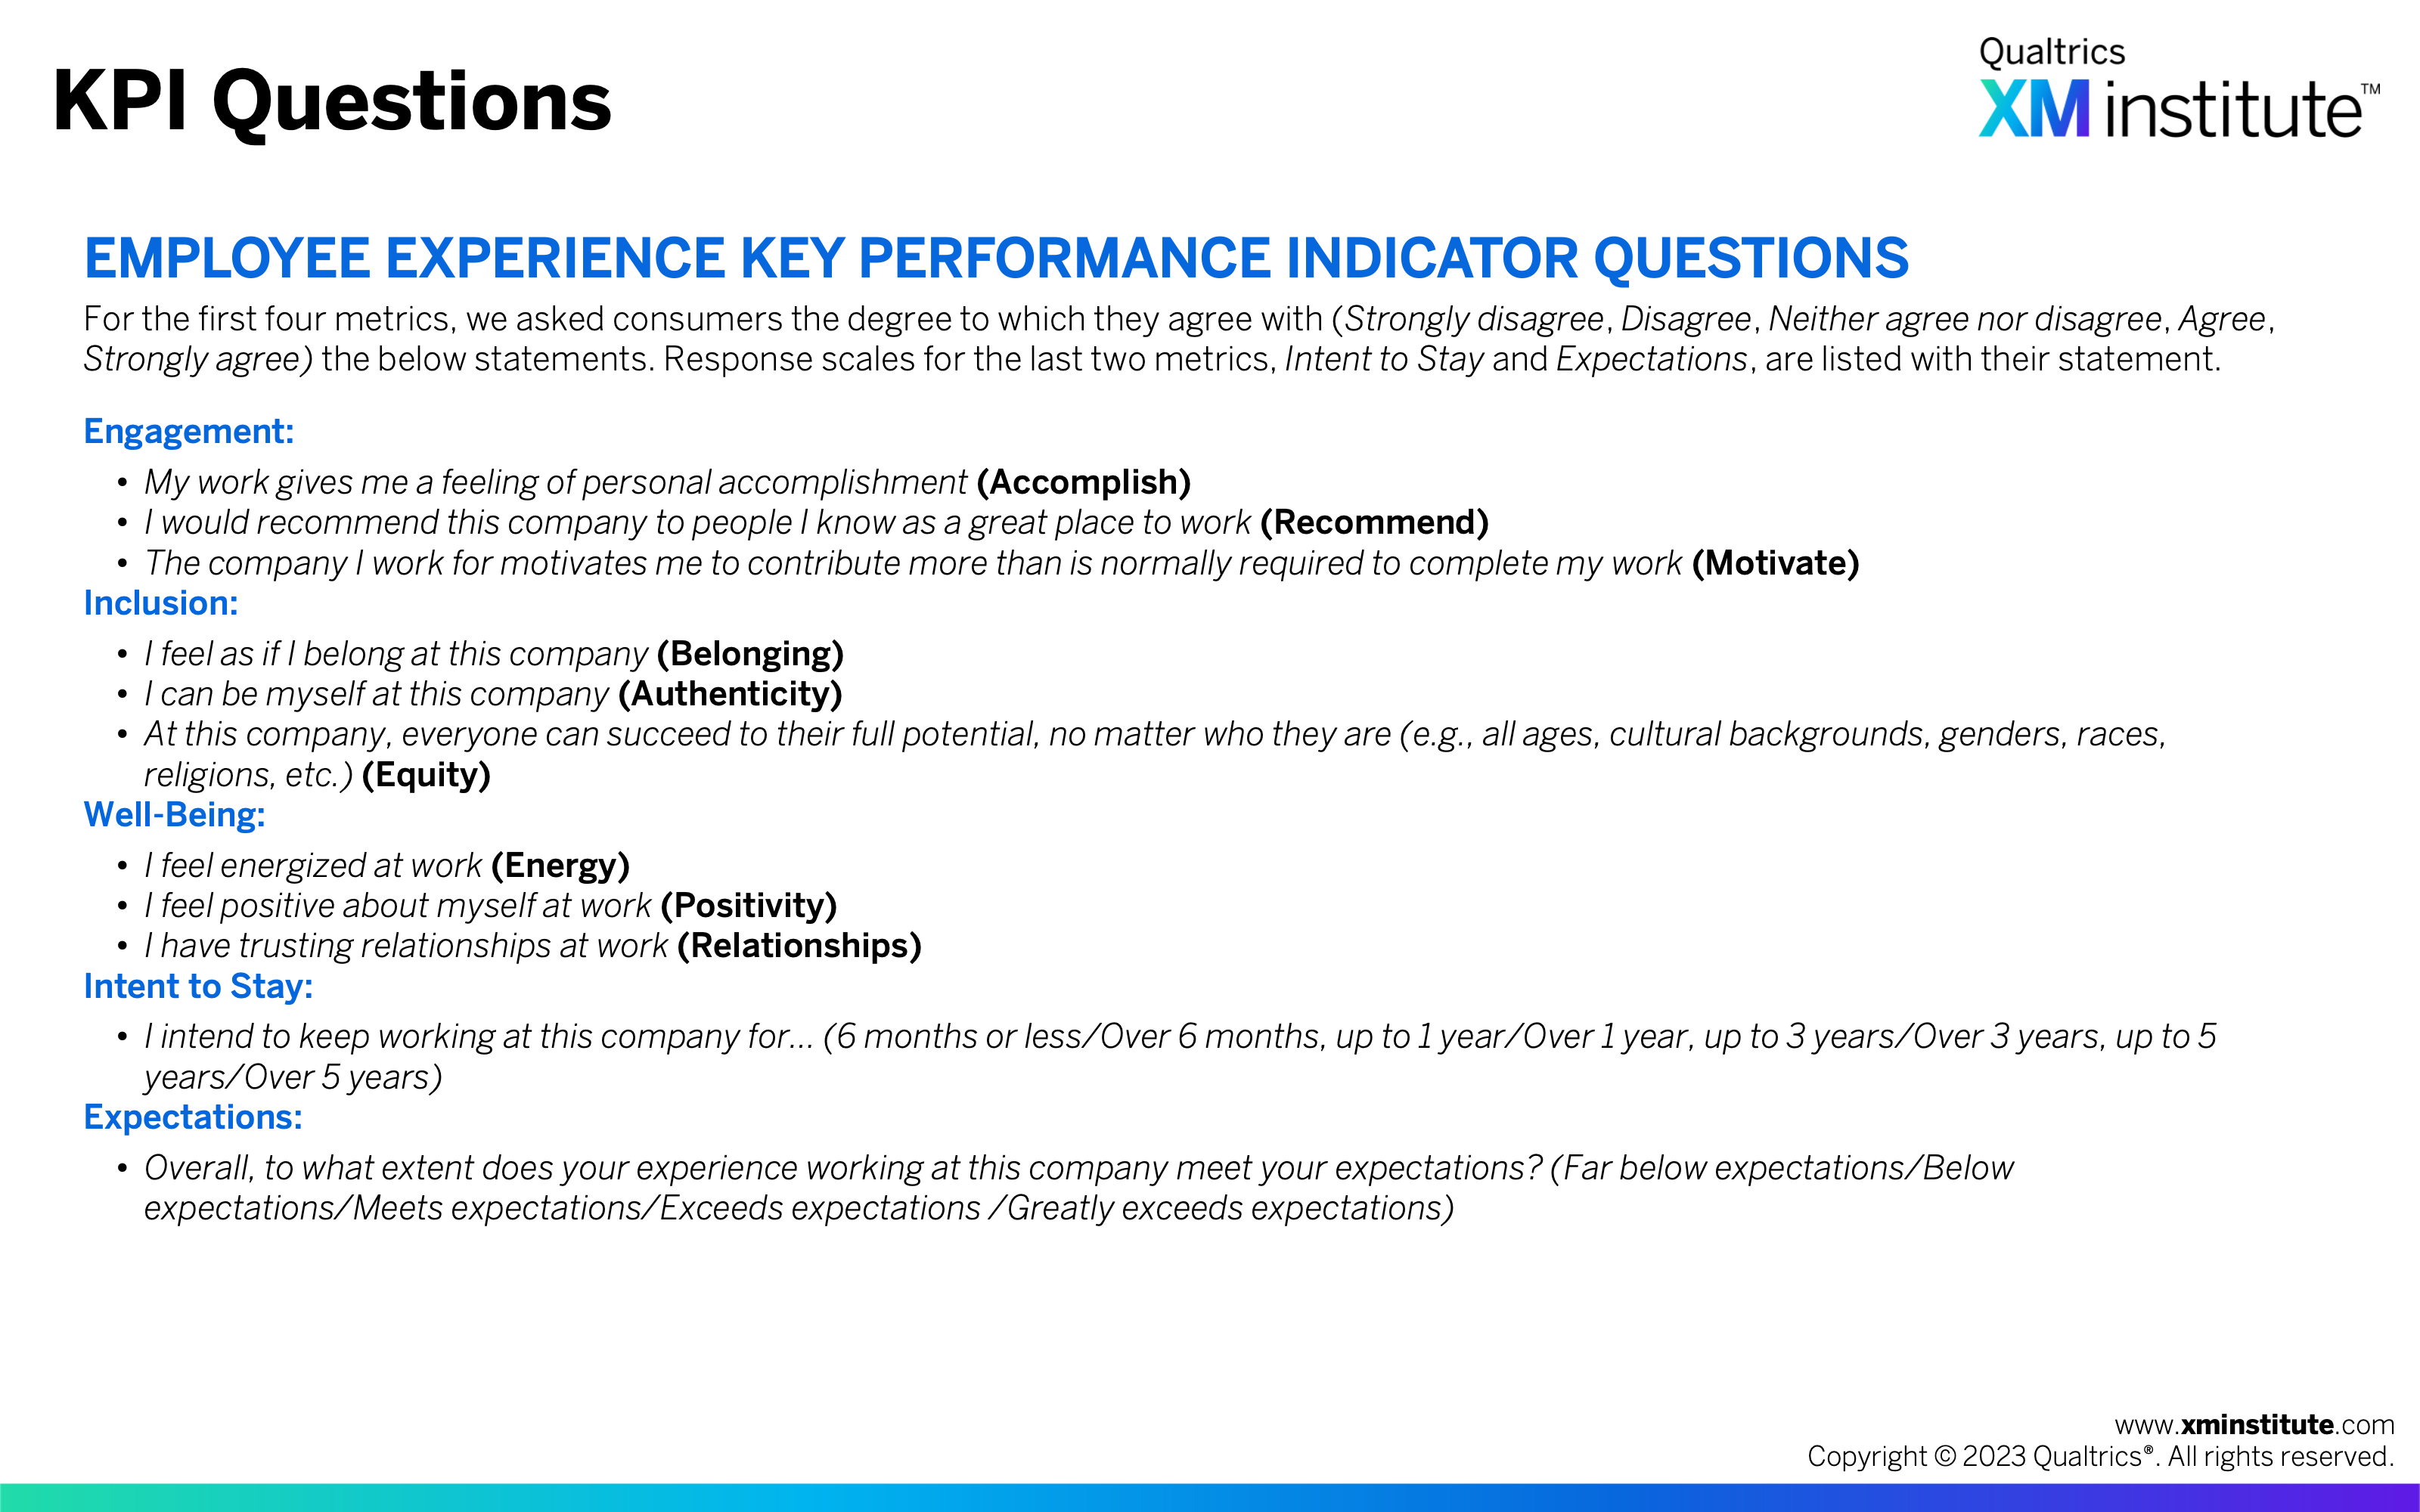
- KPI Questions (see Figure 1)
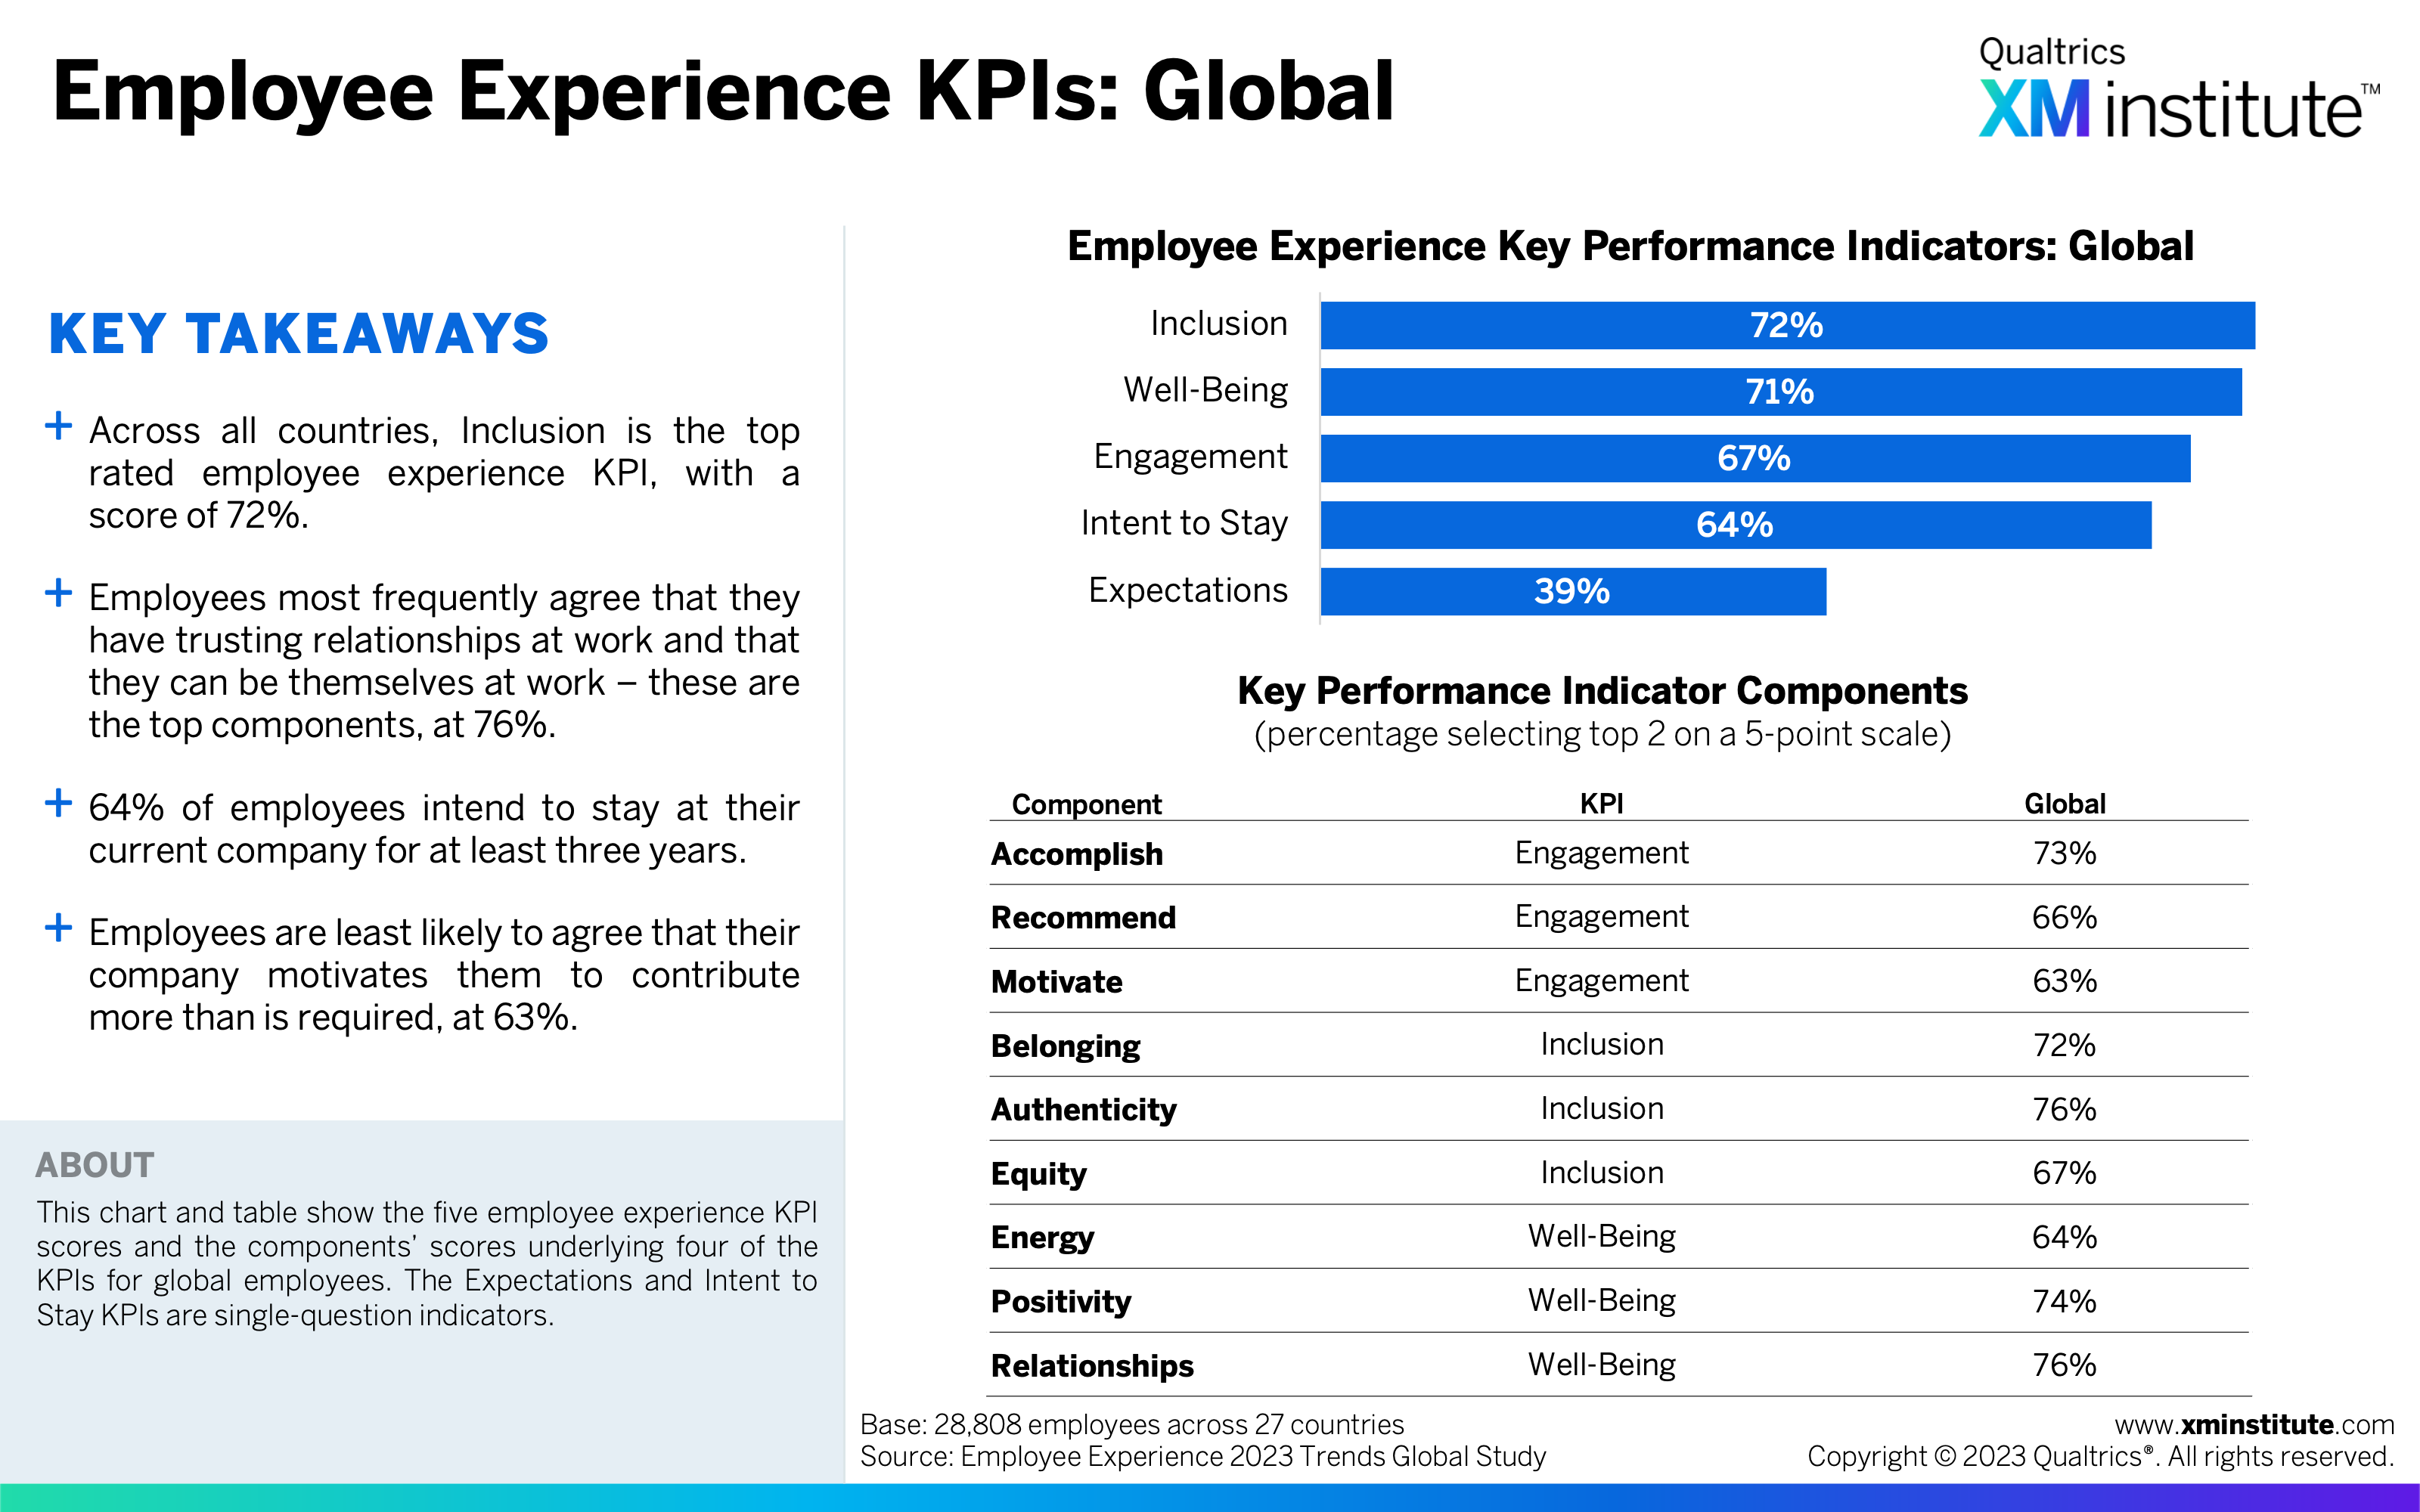
- Employee Experience KPIs: Global (see Figure 2)
- All Employee Experience KPIs by Work Level: Global (see Figure 3)
- Employee Experience KPIs: Americas (see Figure 4)
- All Employee Experience KPIs by Work Level: Americas (see Figure 5)
- All Employee Experience KPIs by Region (see Figure 6)
- Well-Being by Country (see Figure 7)
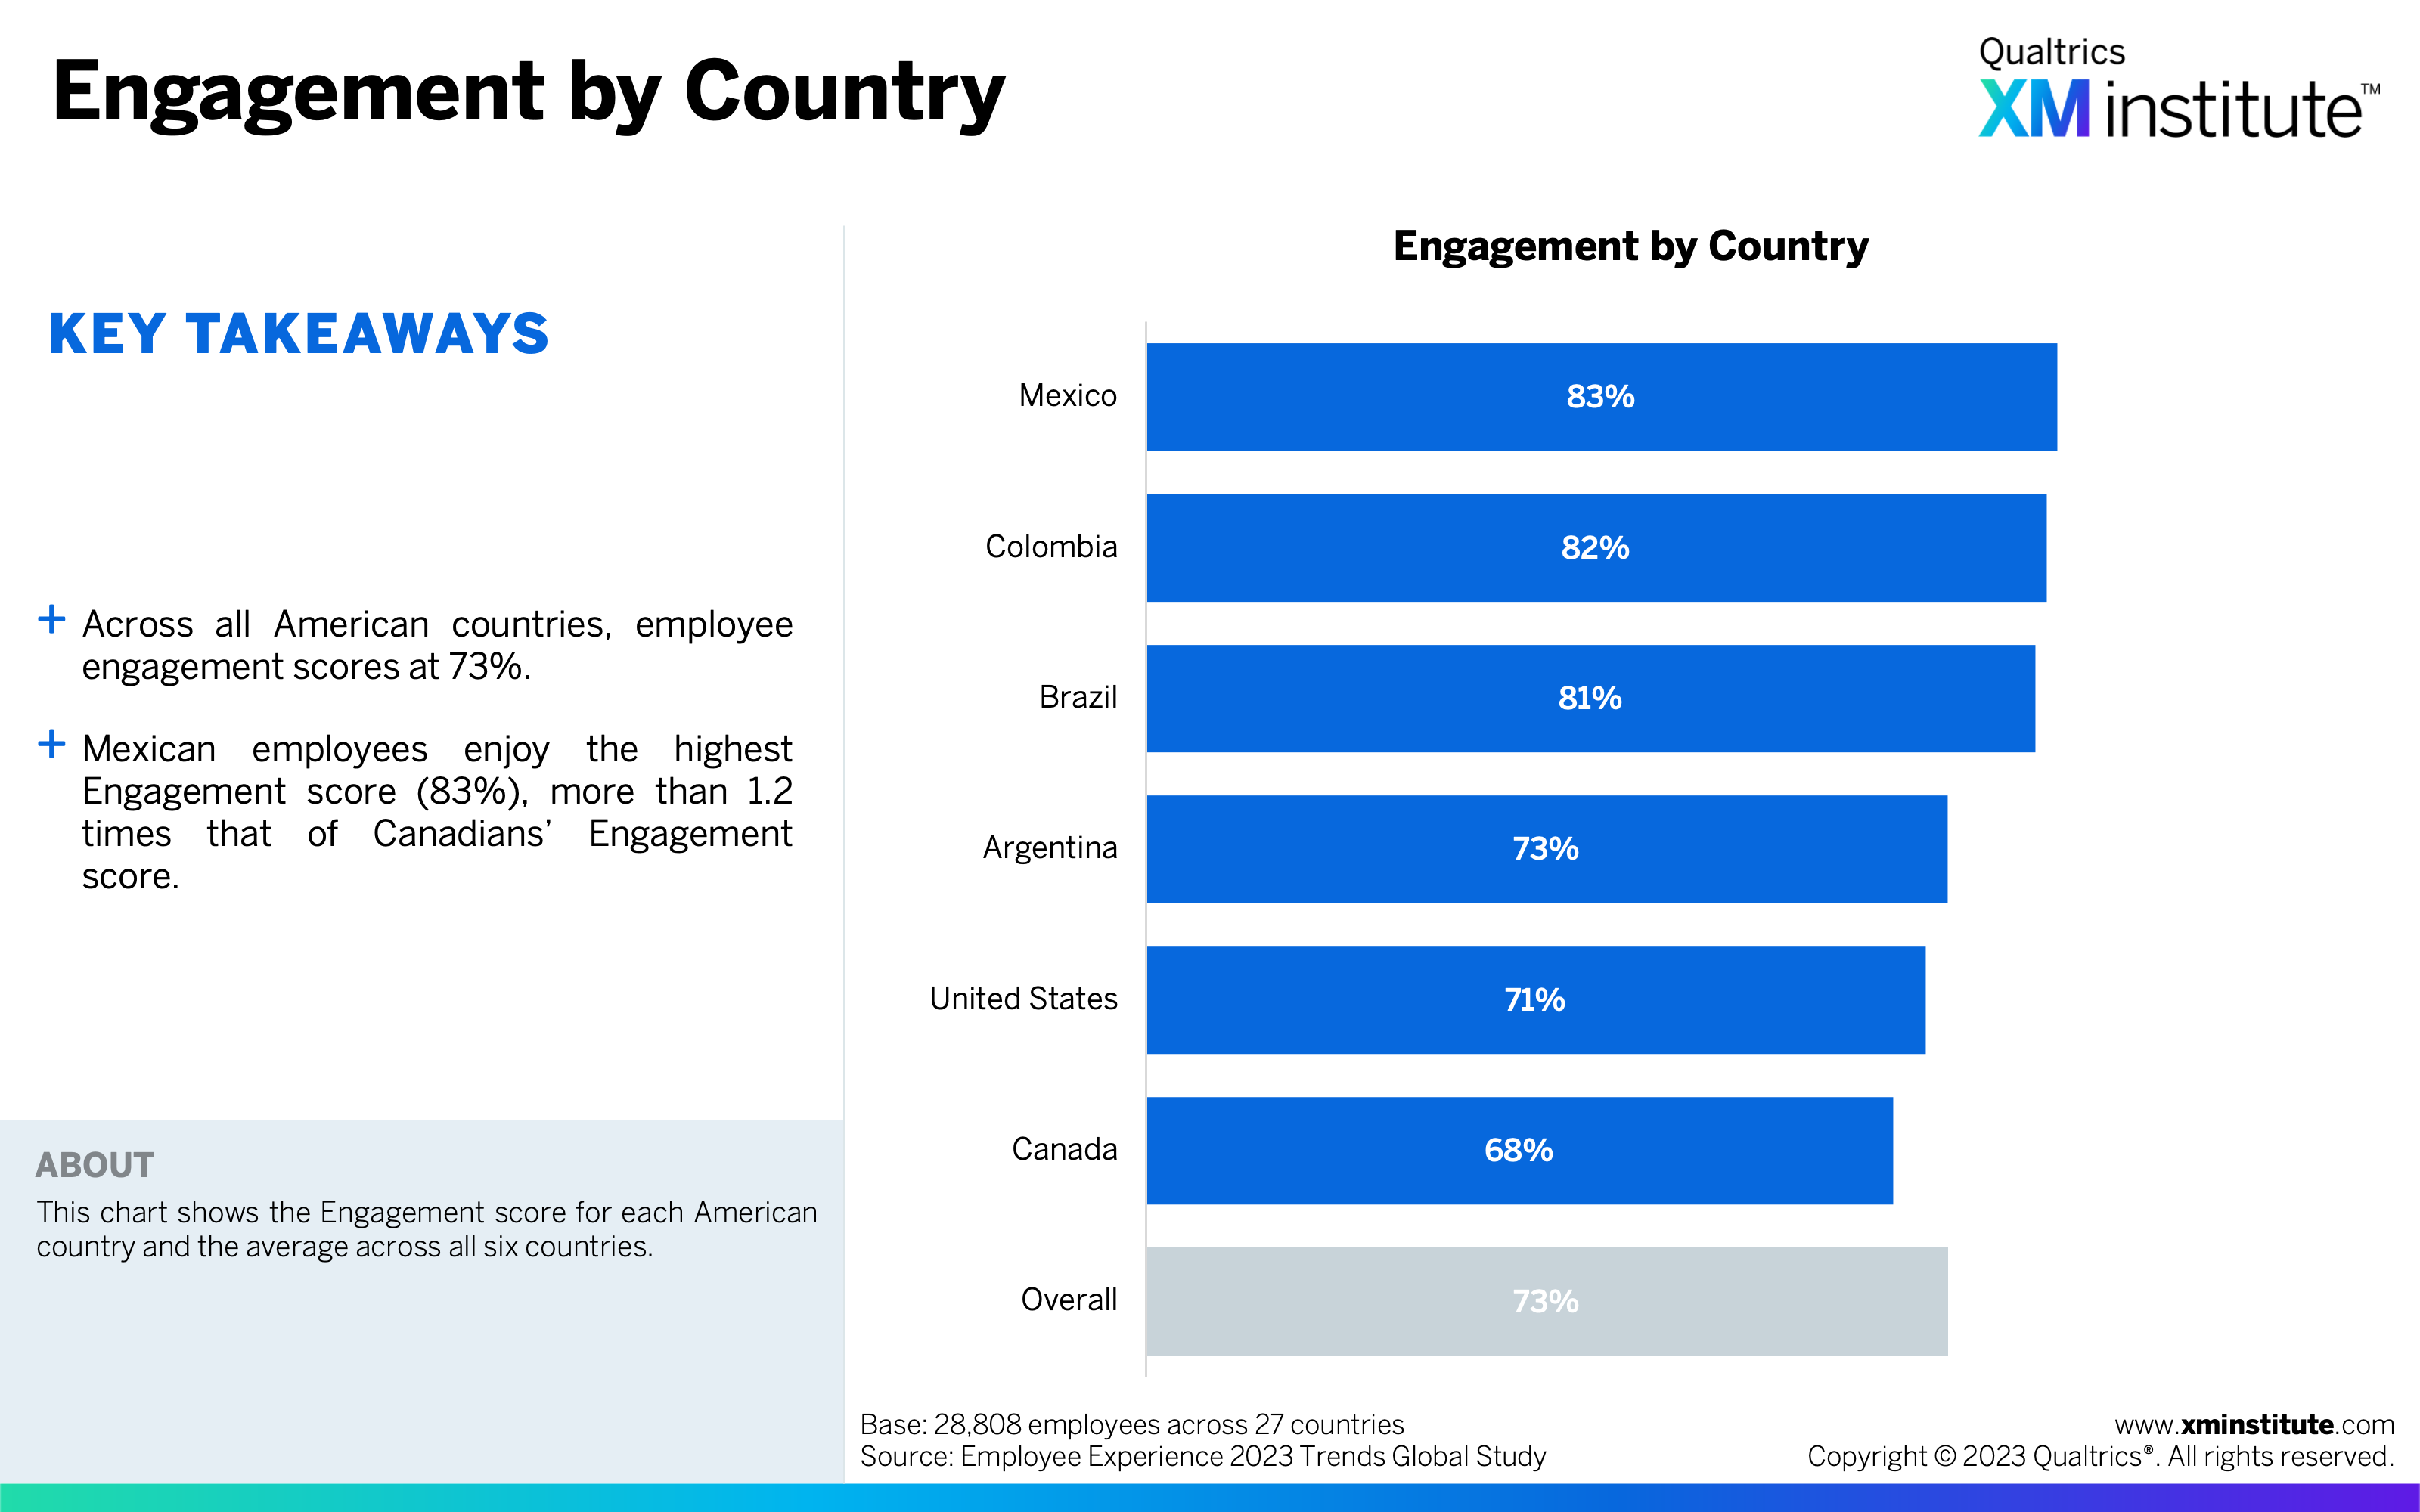
- Engagement by Country (see Figure 8)
- Intent to Stay by Country (see Figure 9)
- Inclusion by Country (see Figure 10)
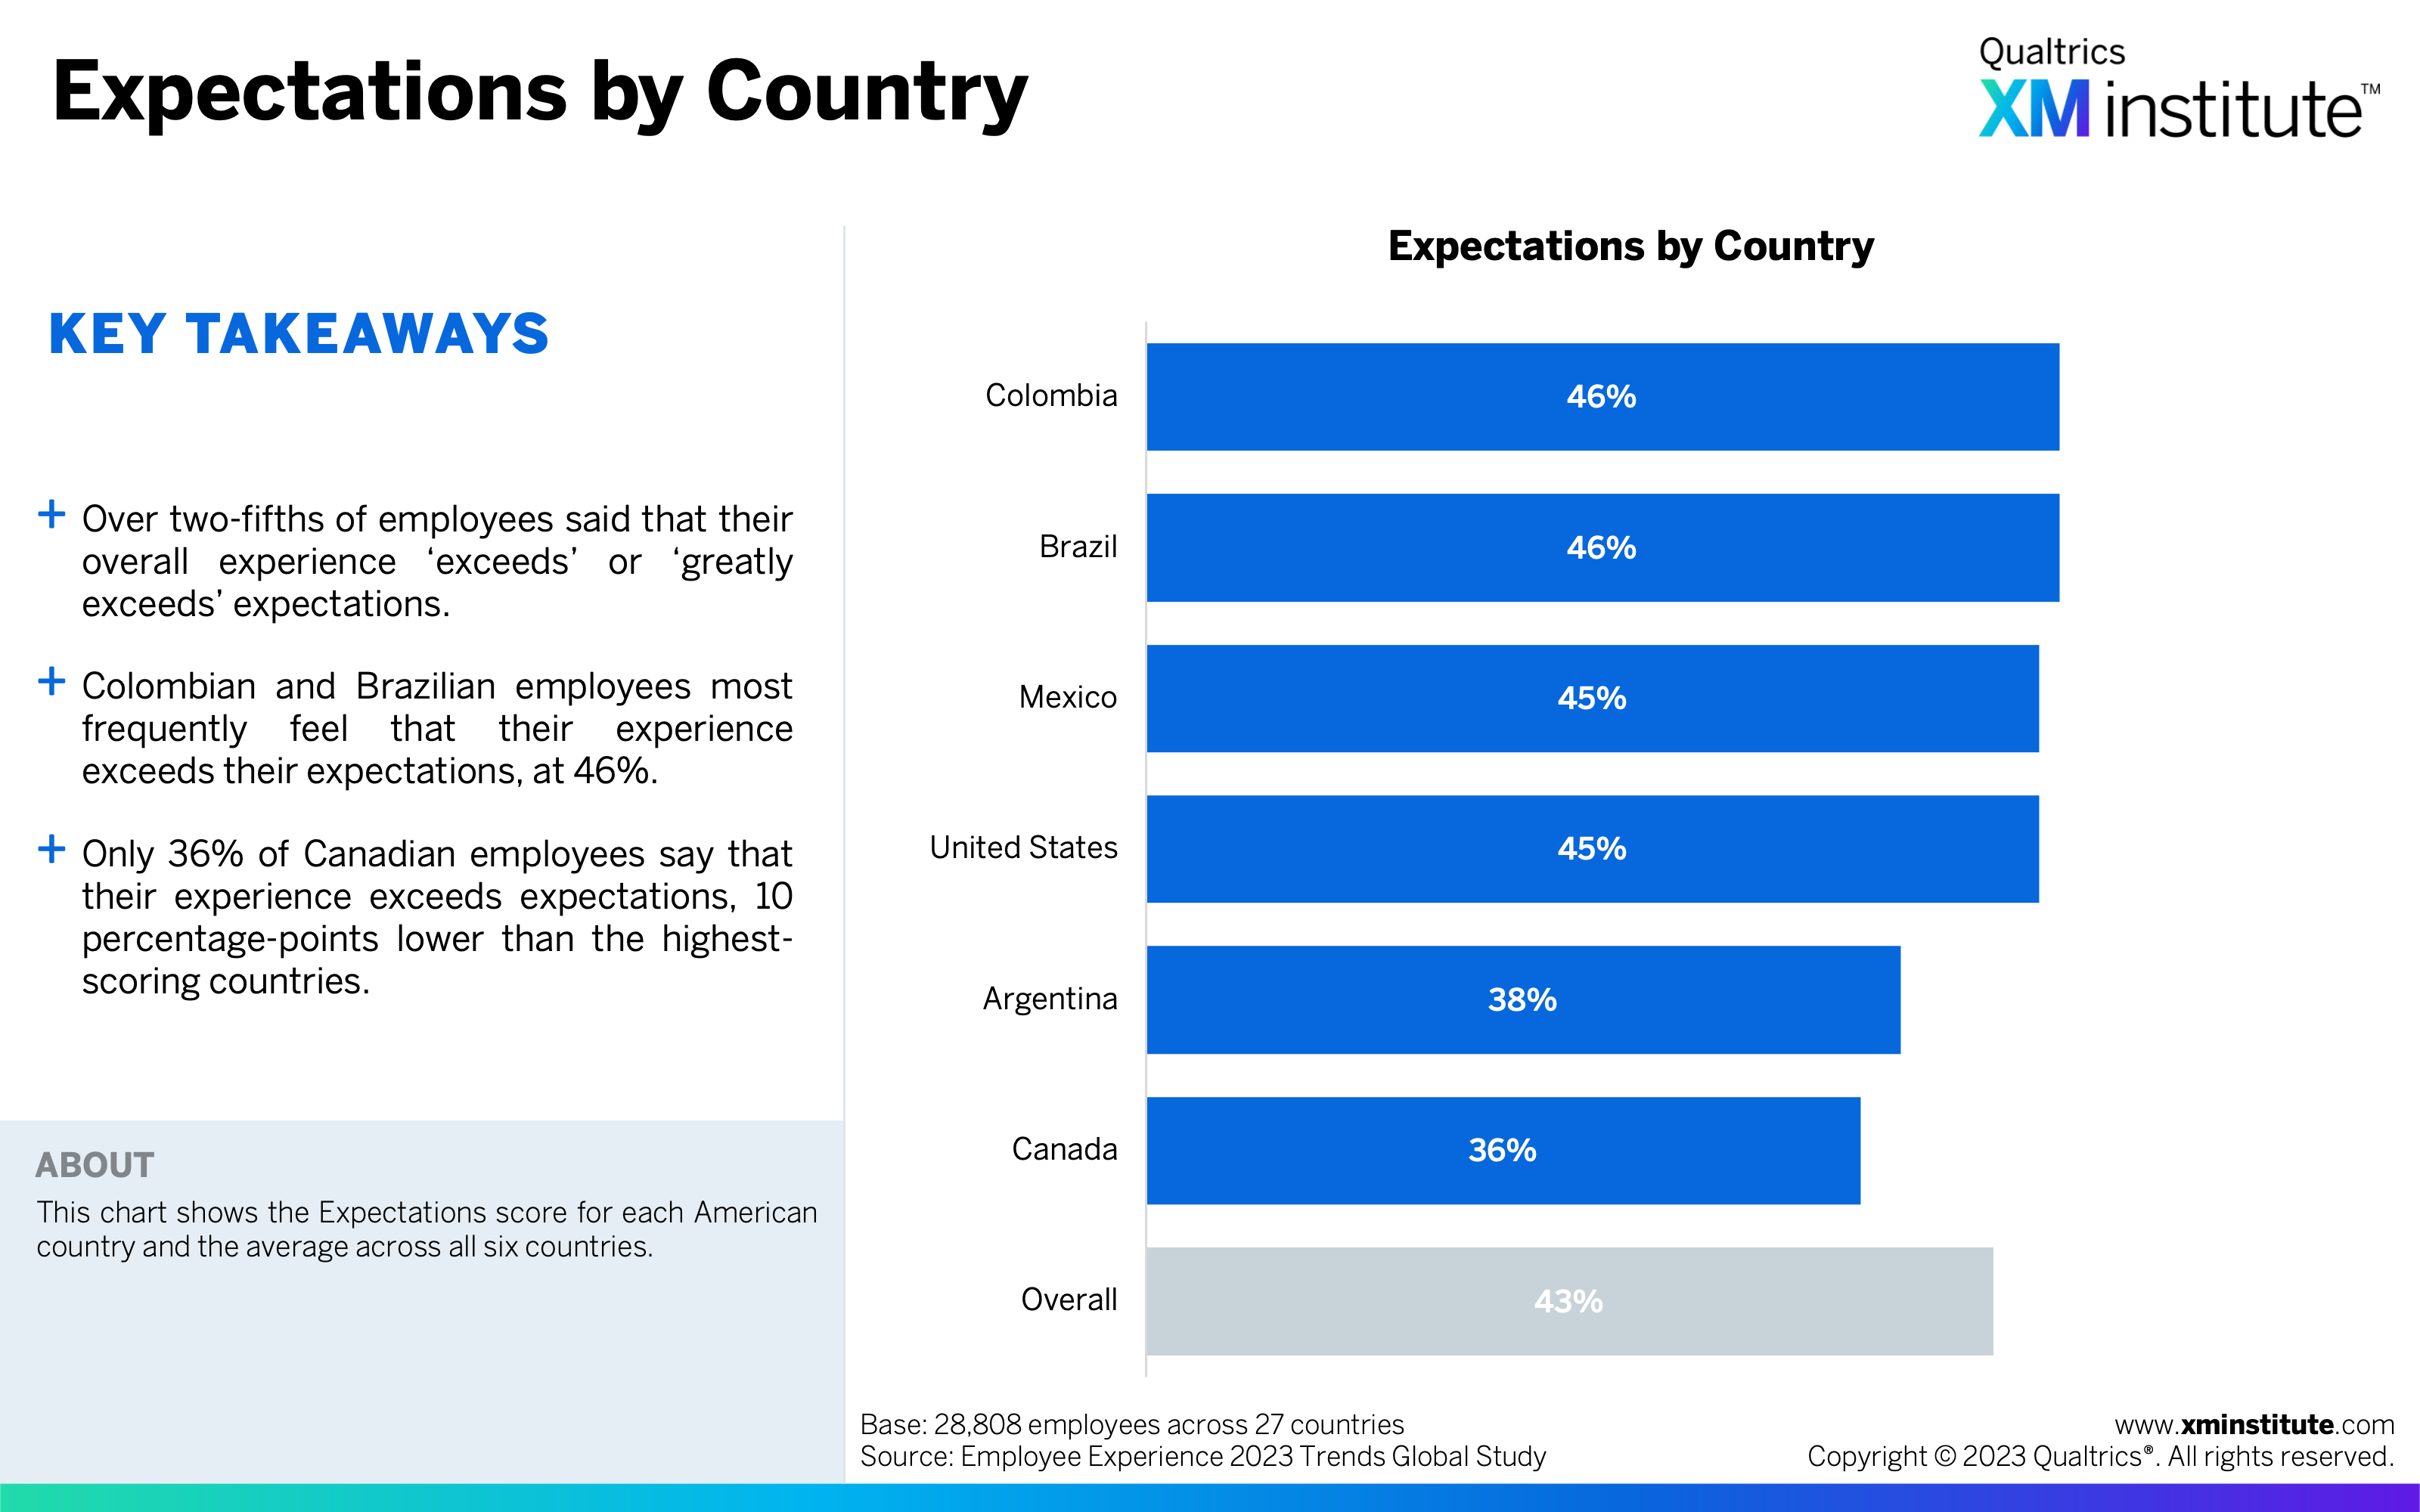
- Expectations by Country (see Figure 11)
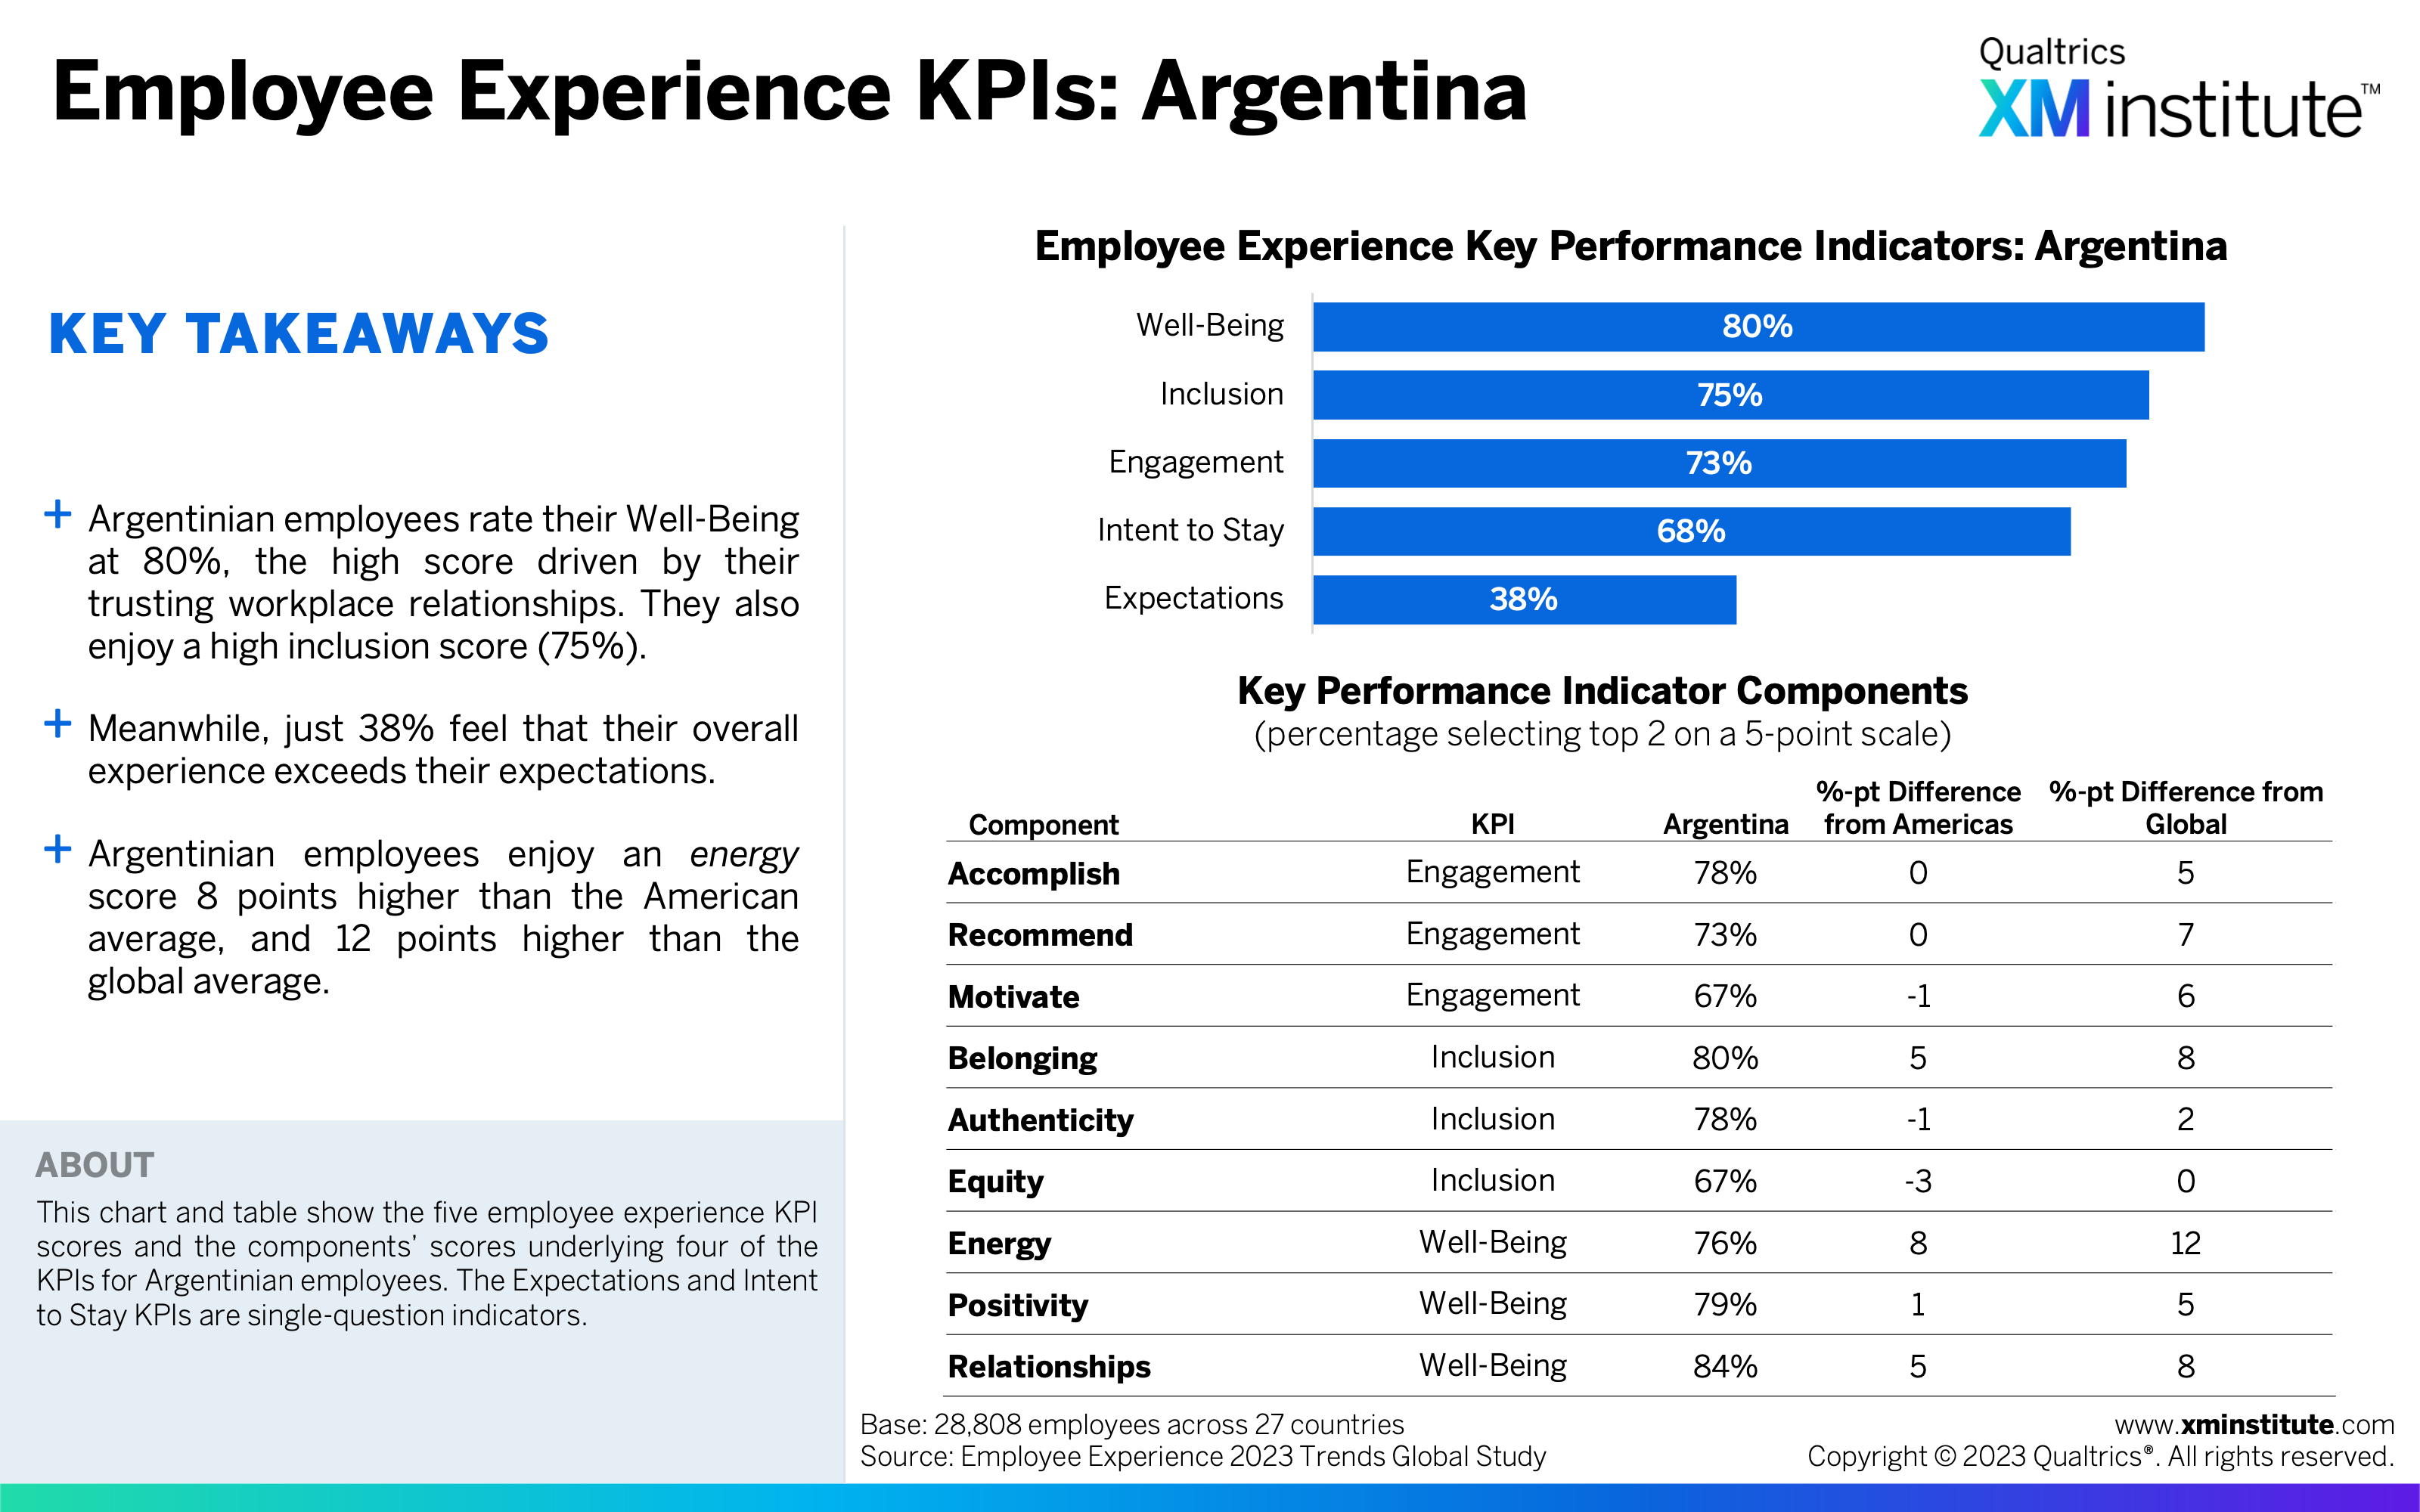
- Employee Experience KPIs: Argentina (see Figure 12)
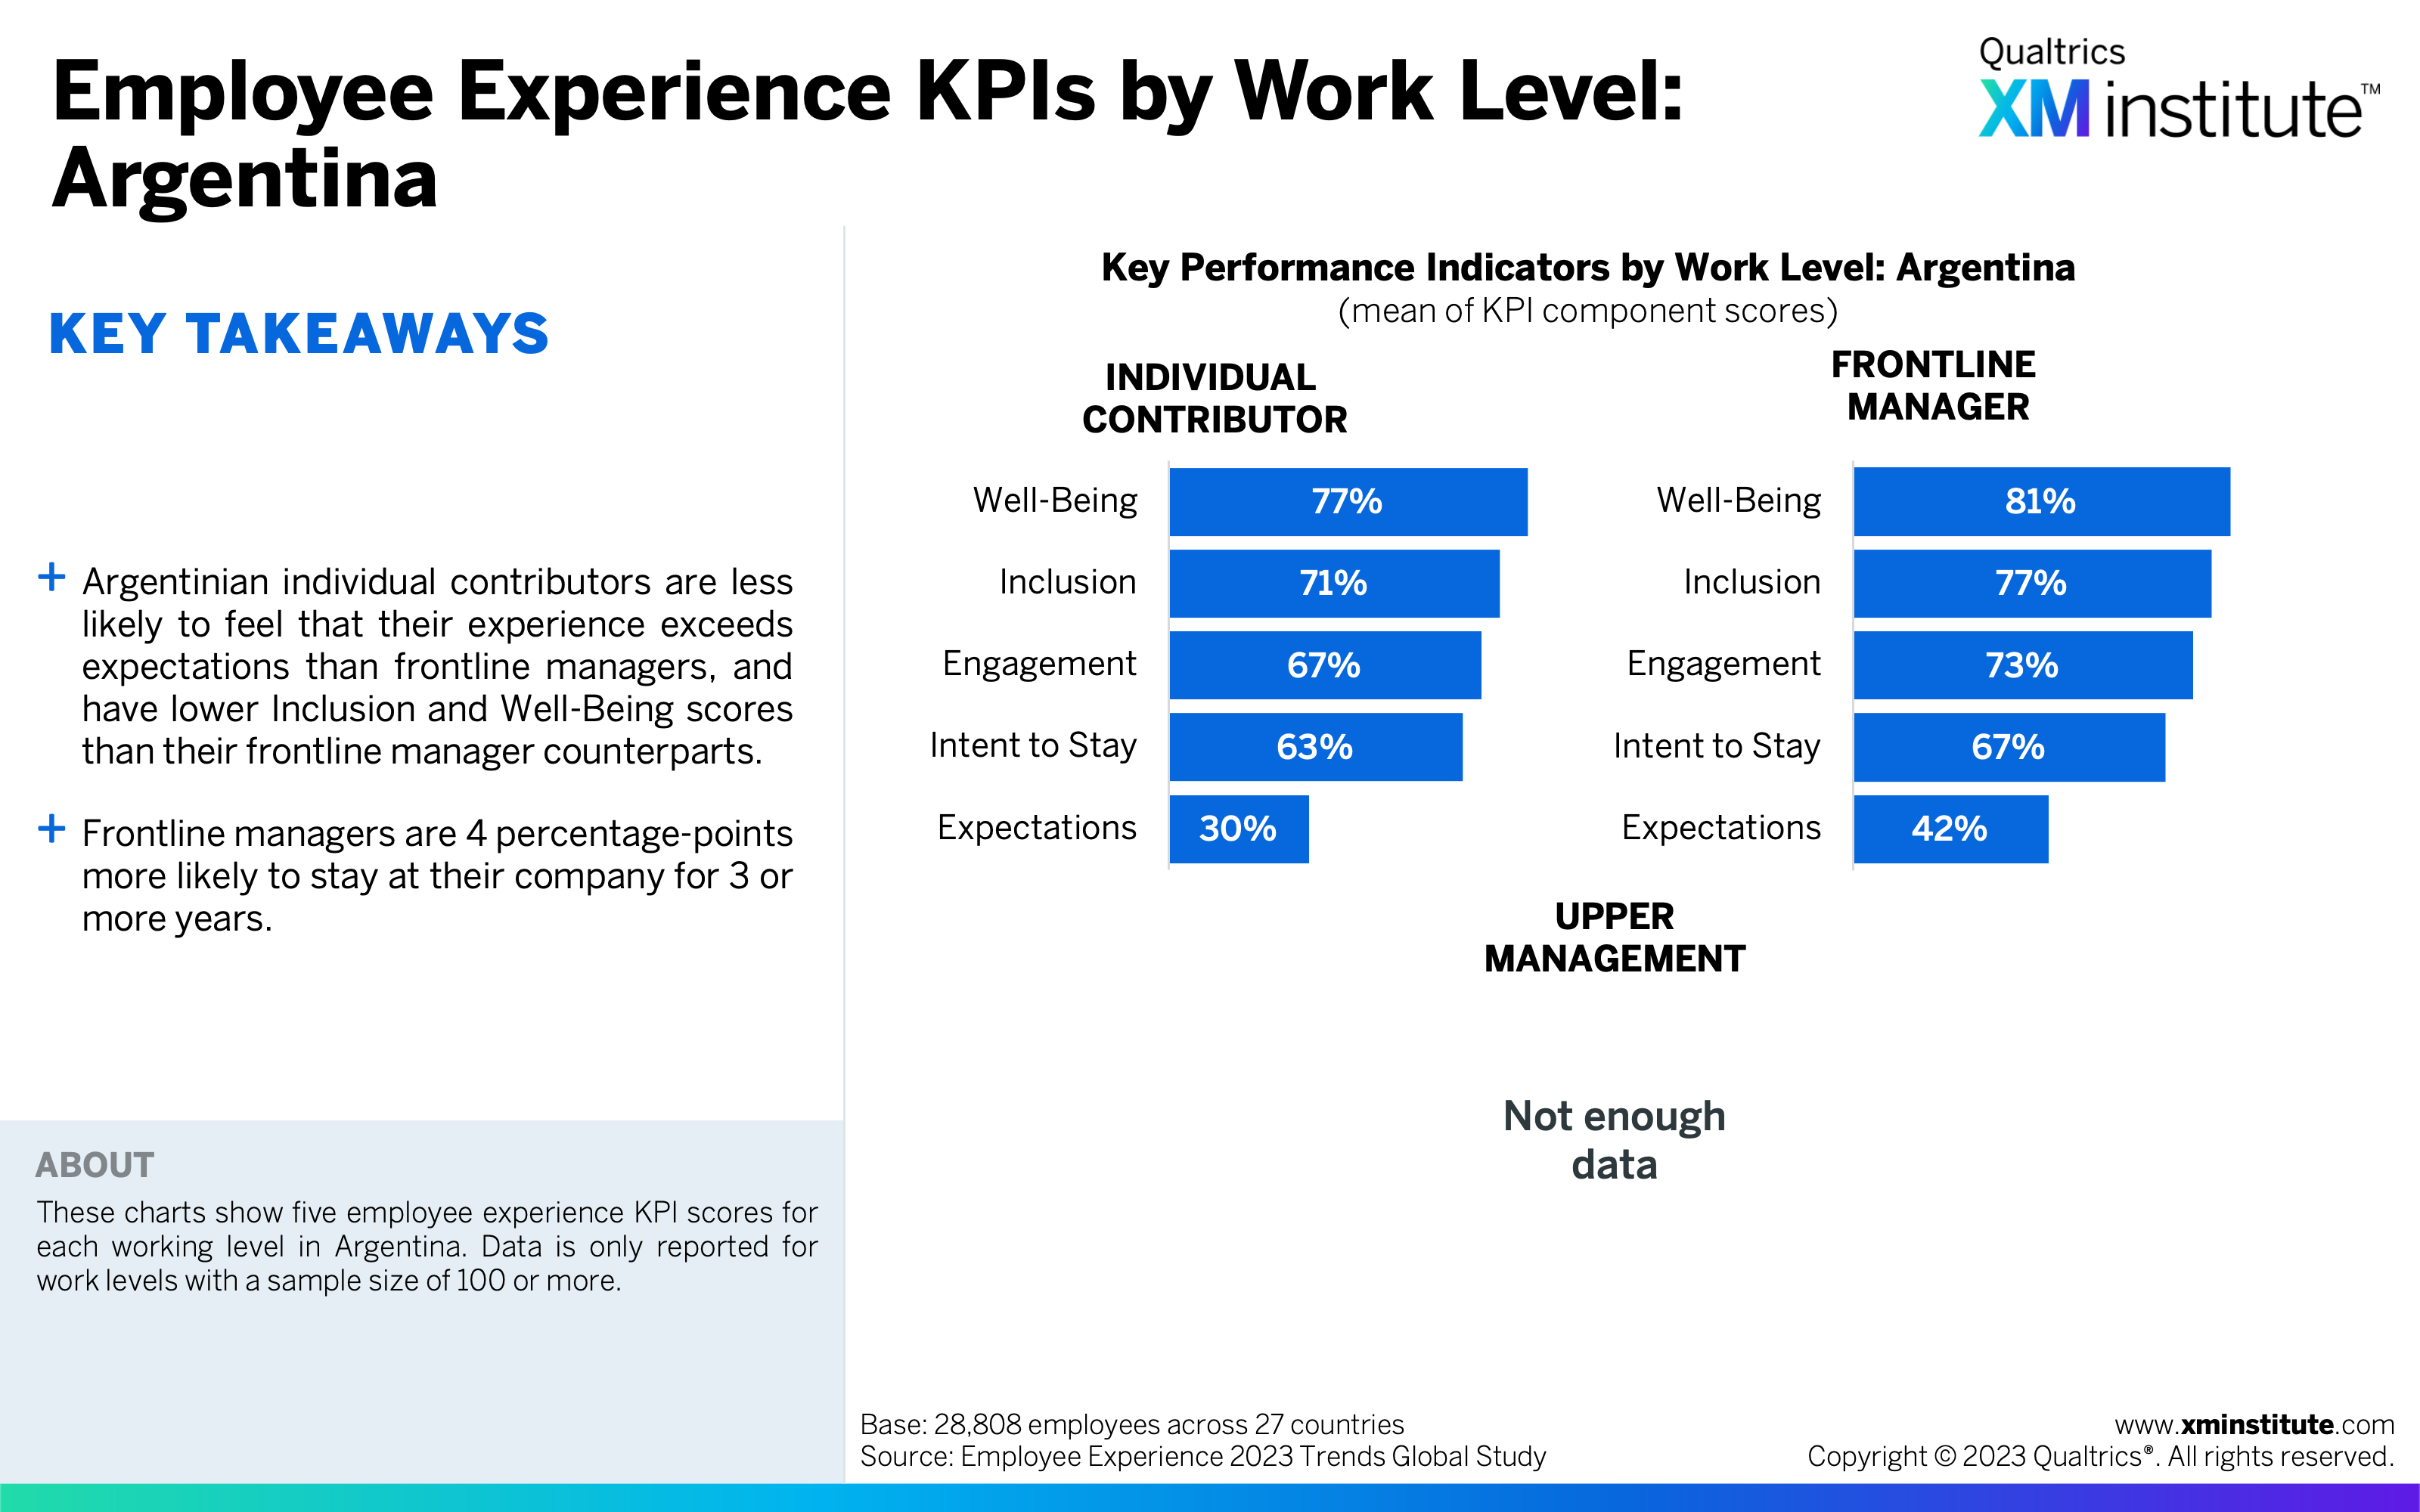
- Employee Experience KPIs by Work Level: Argentina (see Figure 13)
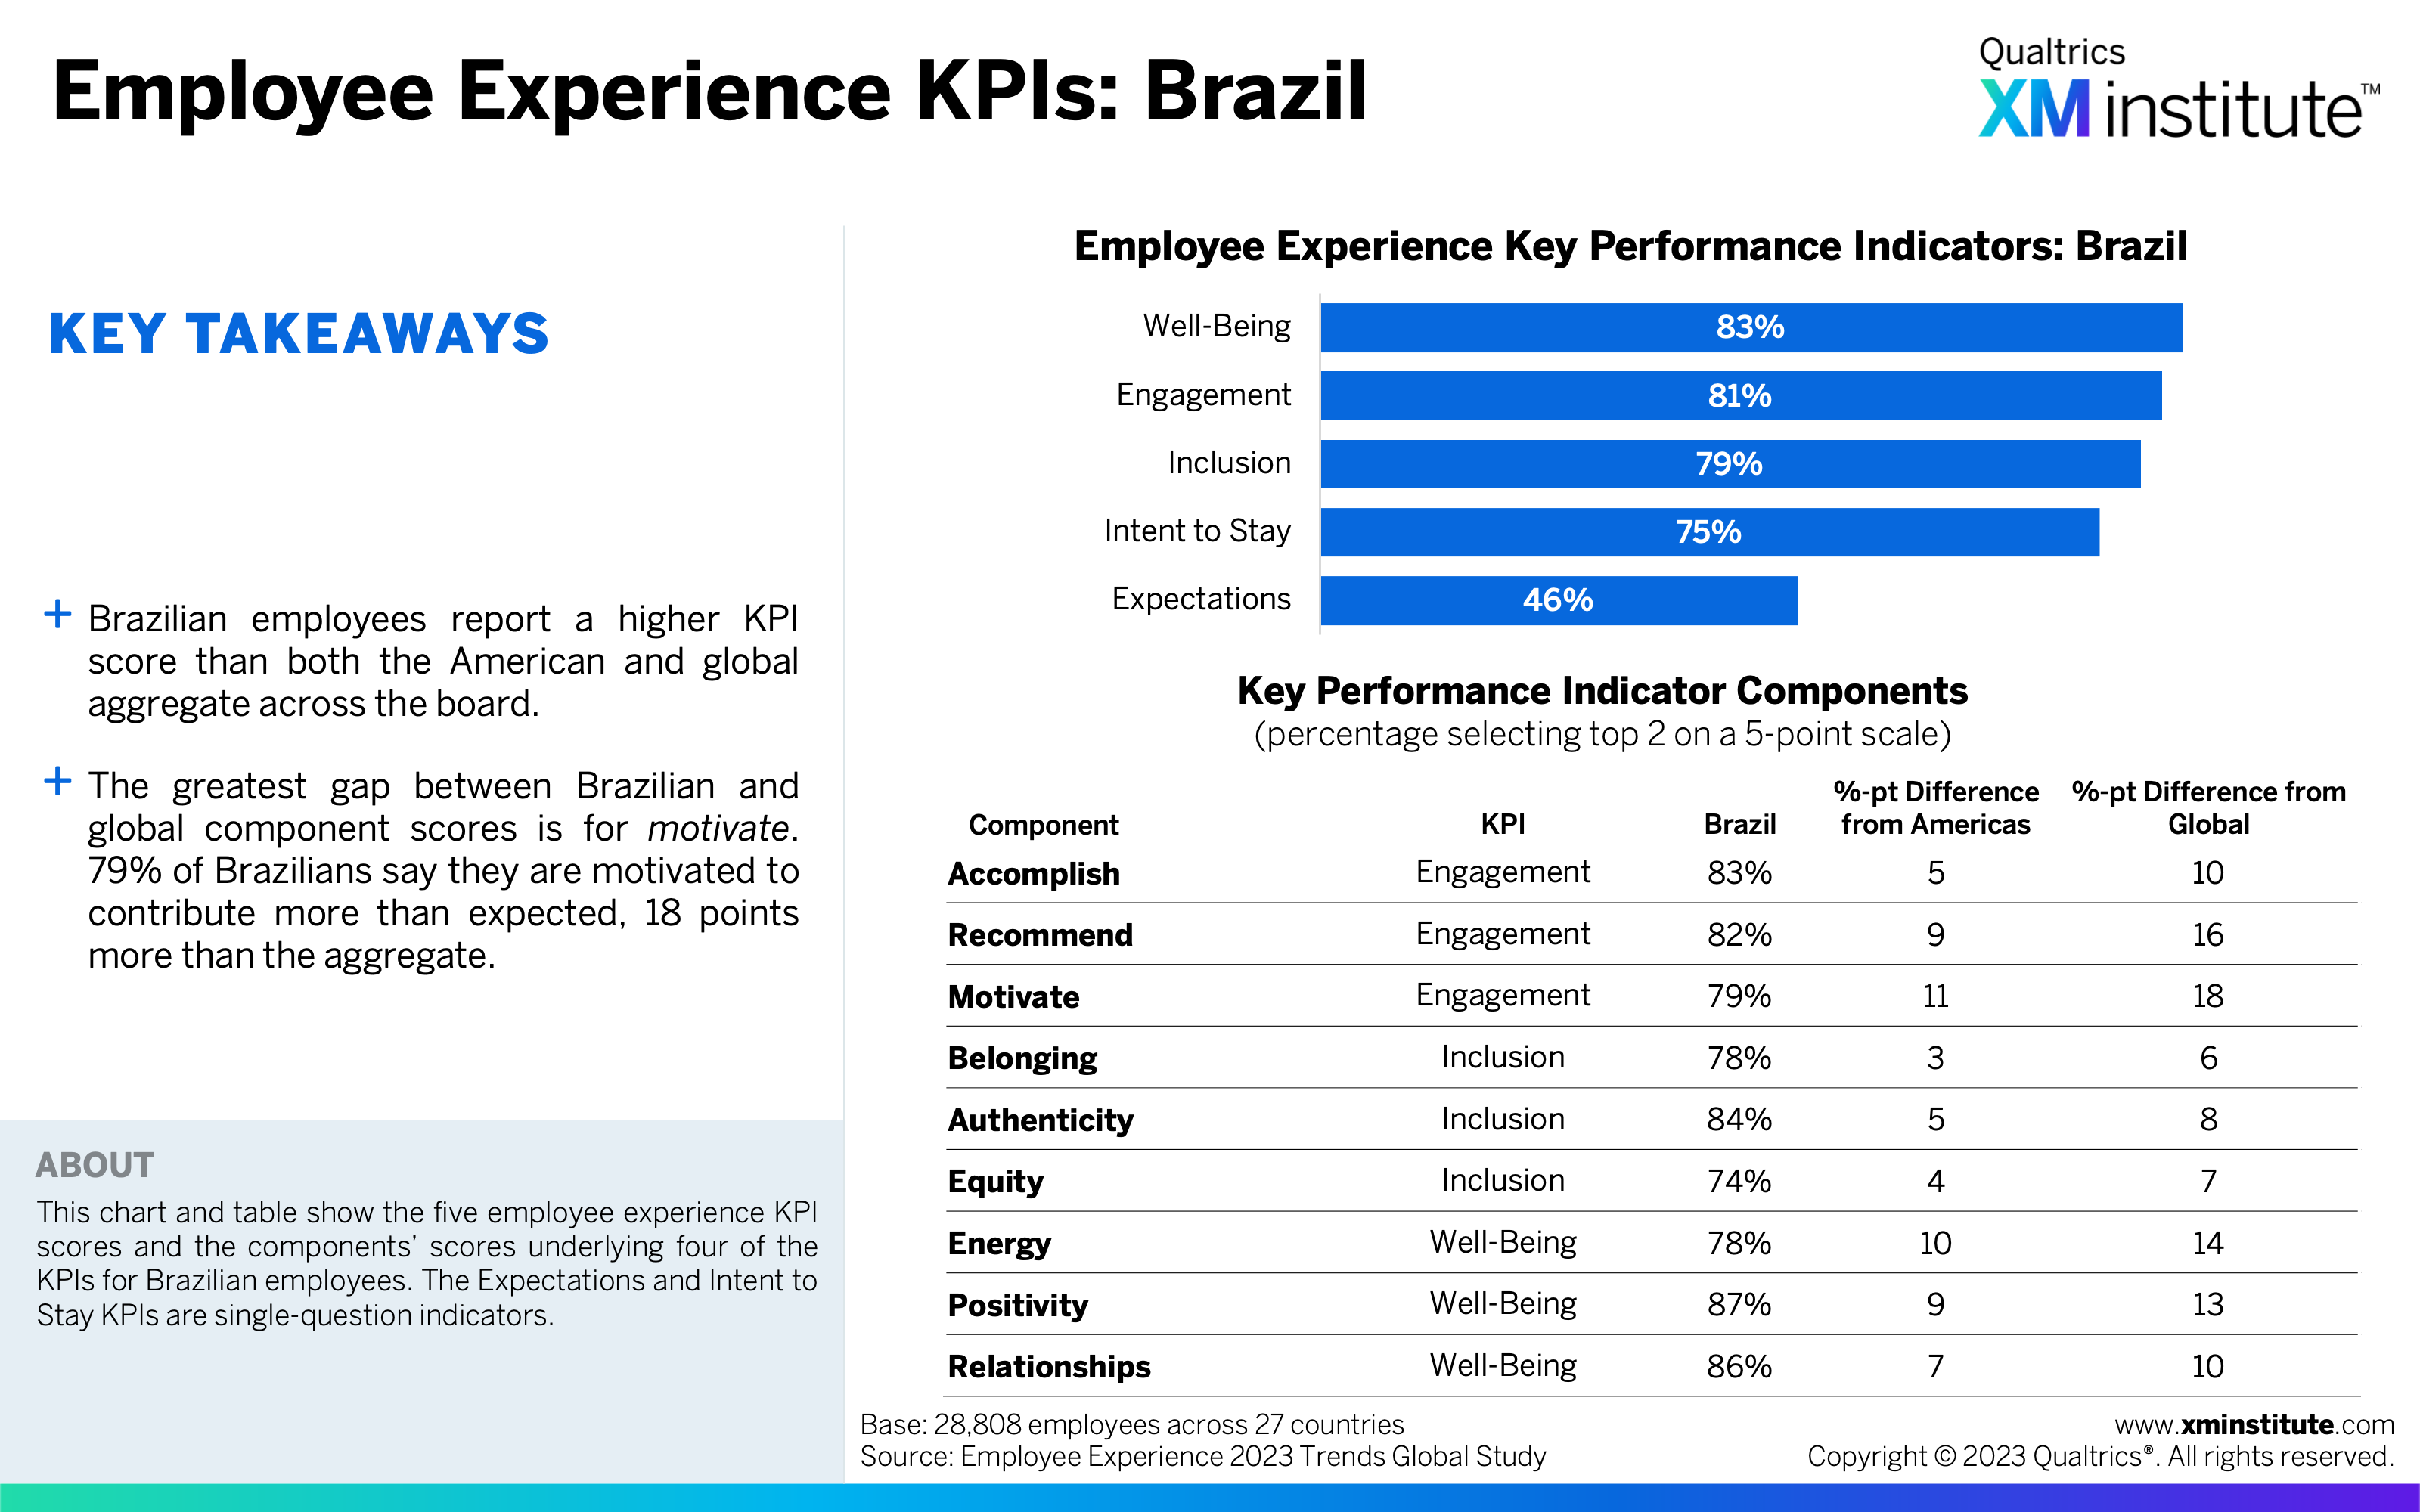
- Employee Experience KPIs: Brazil (see Figure 14)
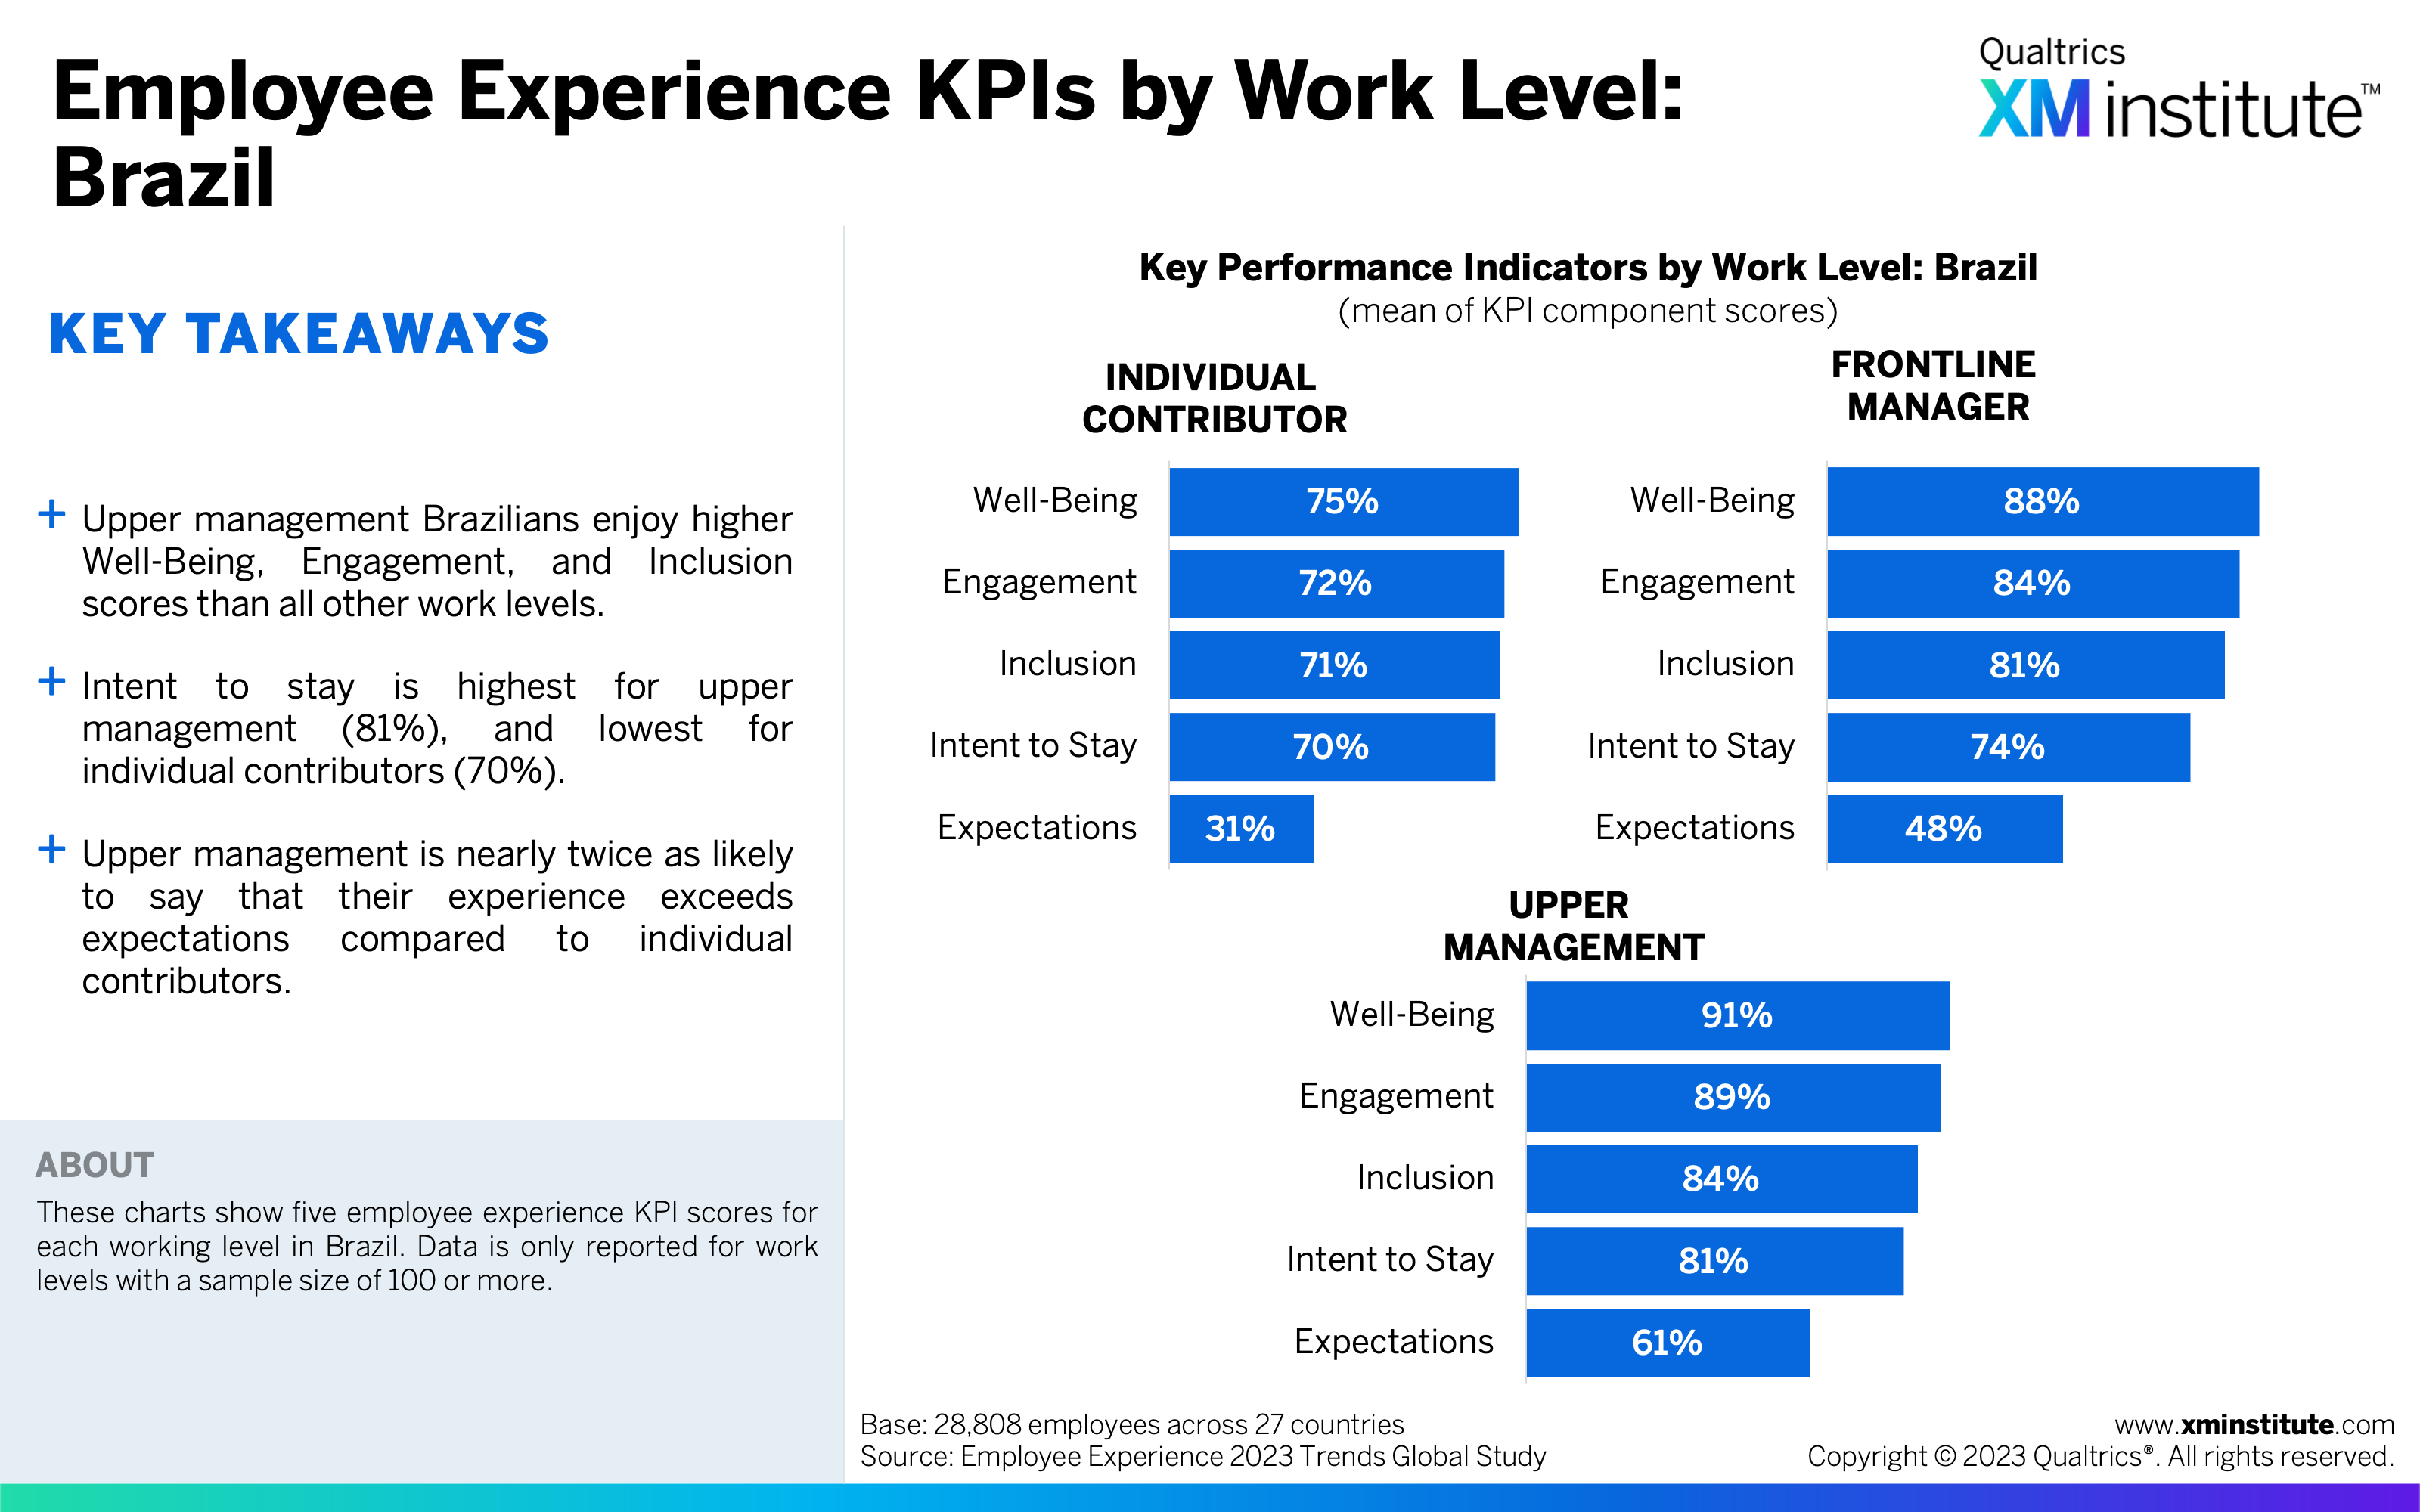
- Employee Experience KPIs by Work Level: Brazil (see Figure 15)
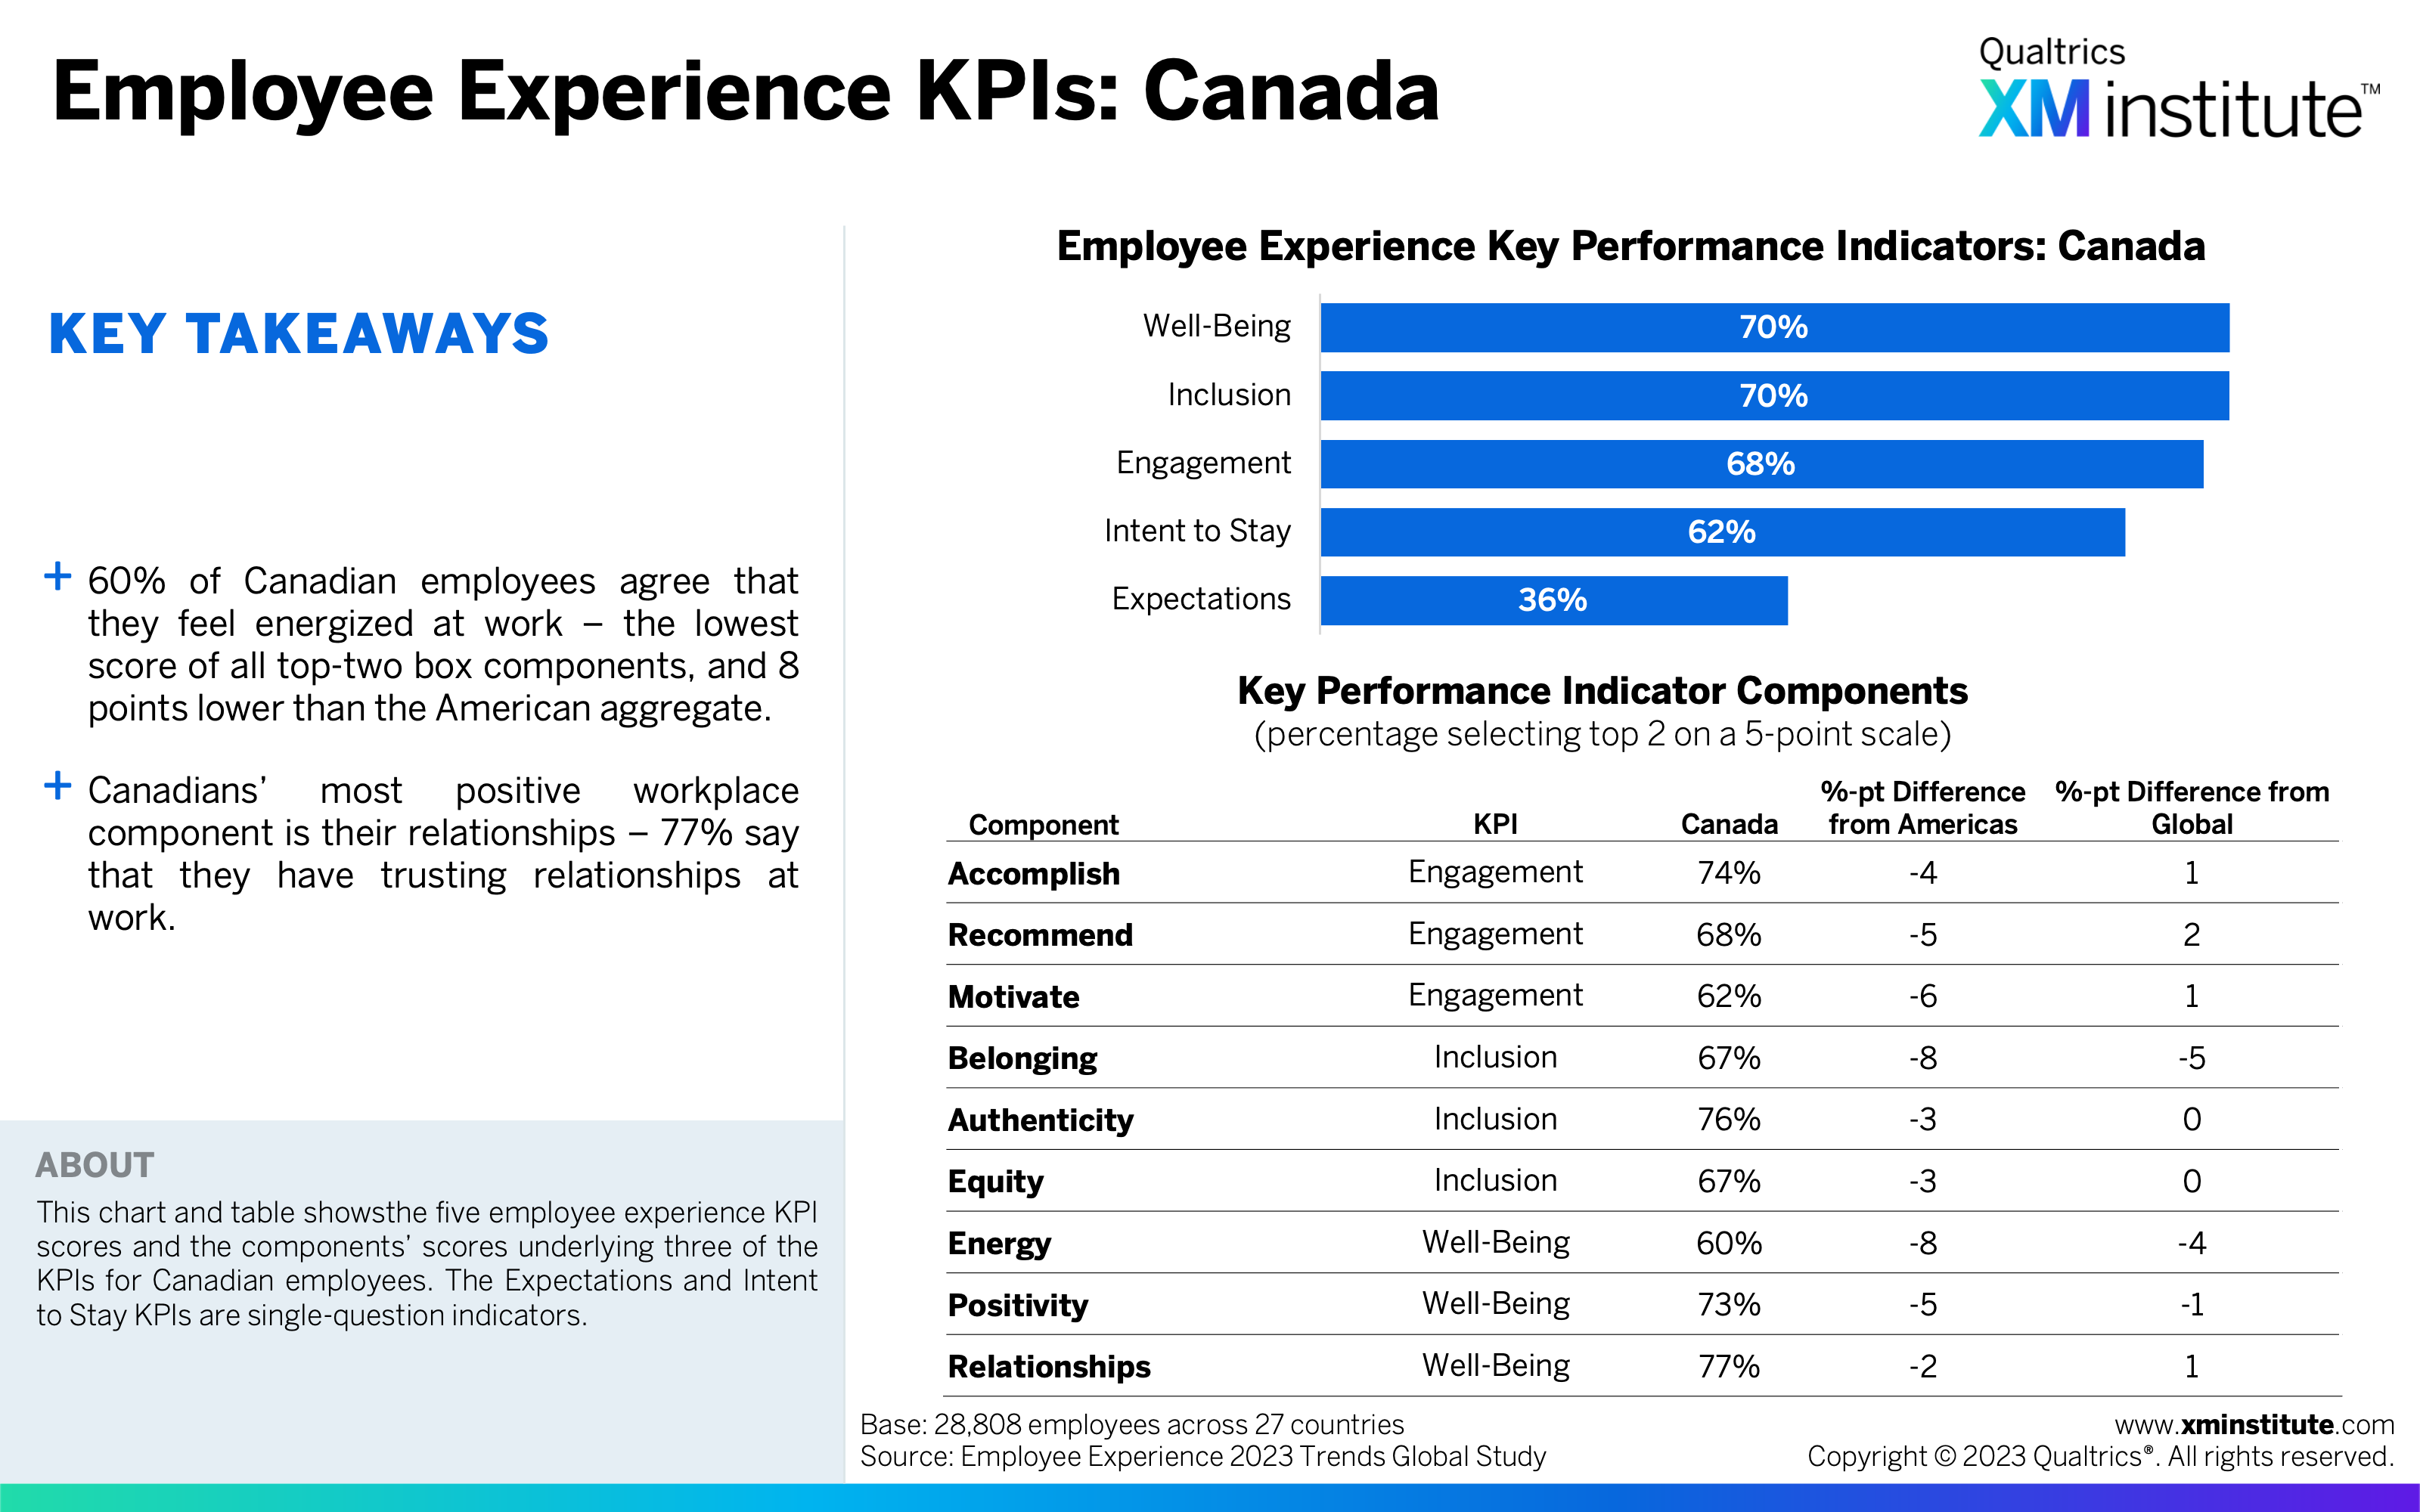
- Employee Experience KPIs: Canada (see Figure 16)
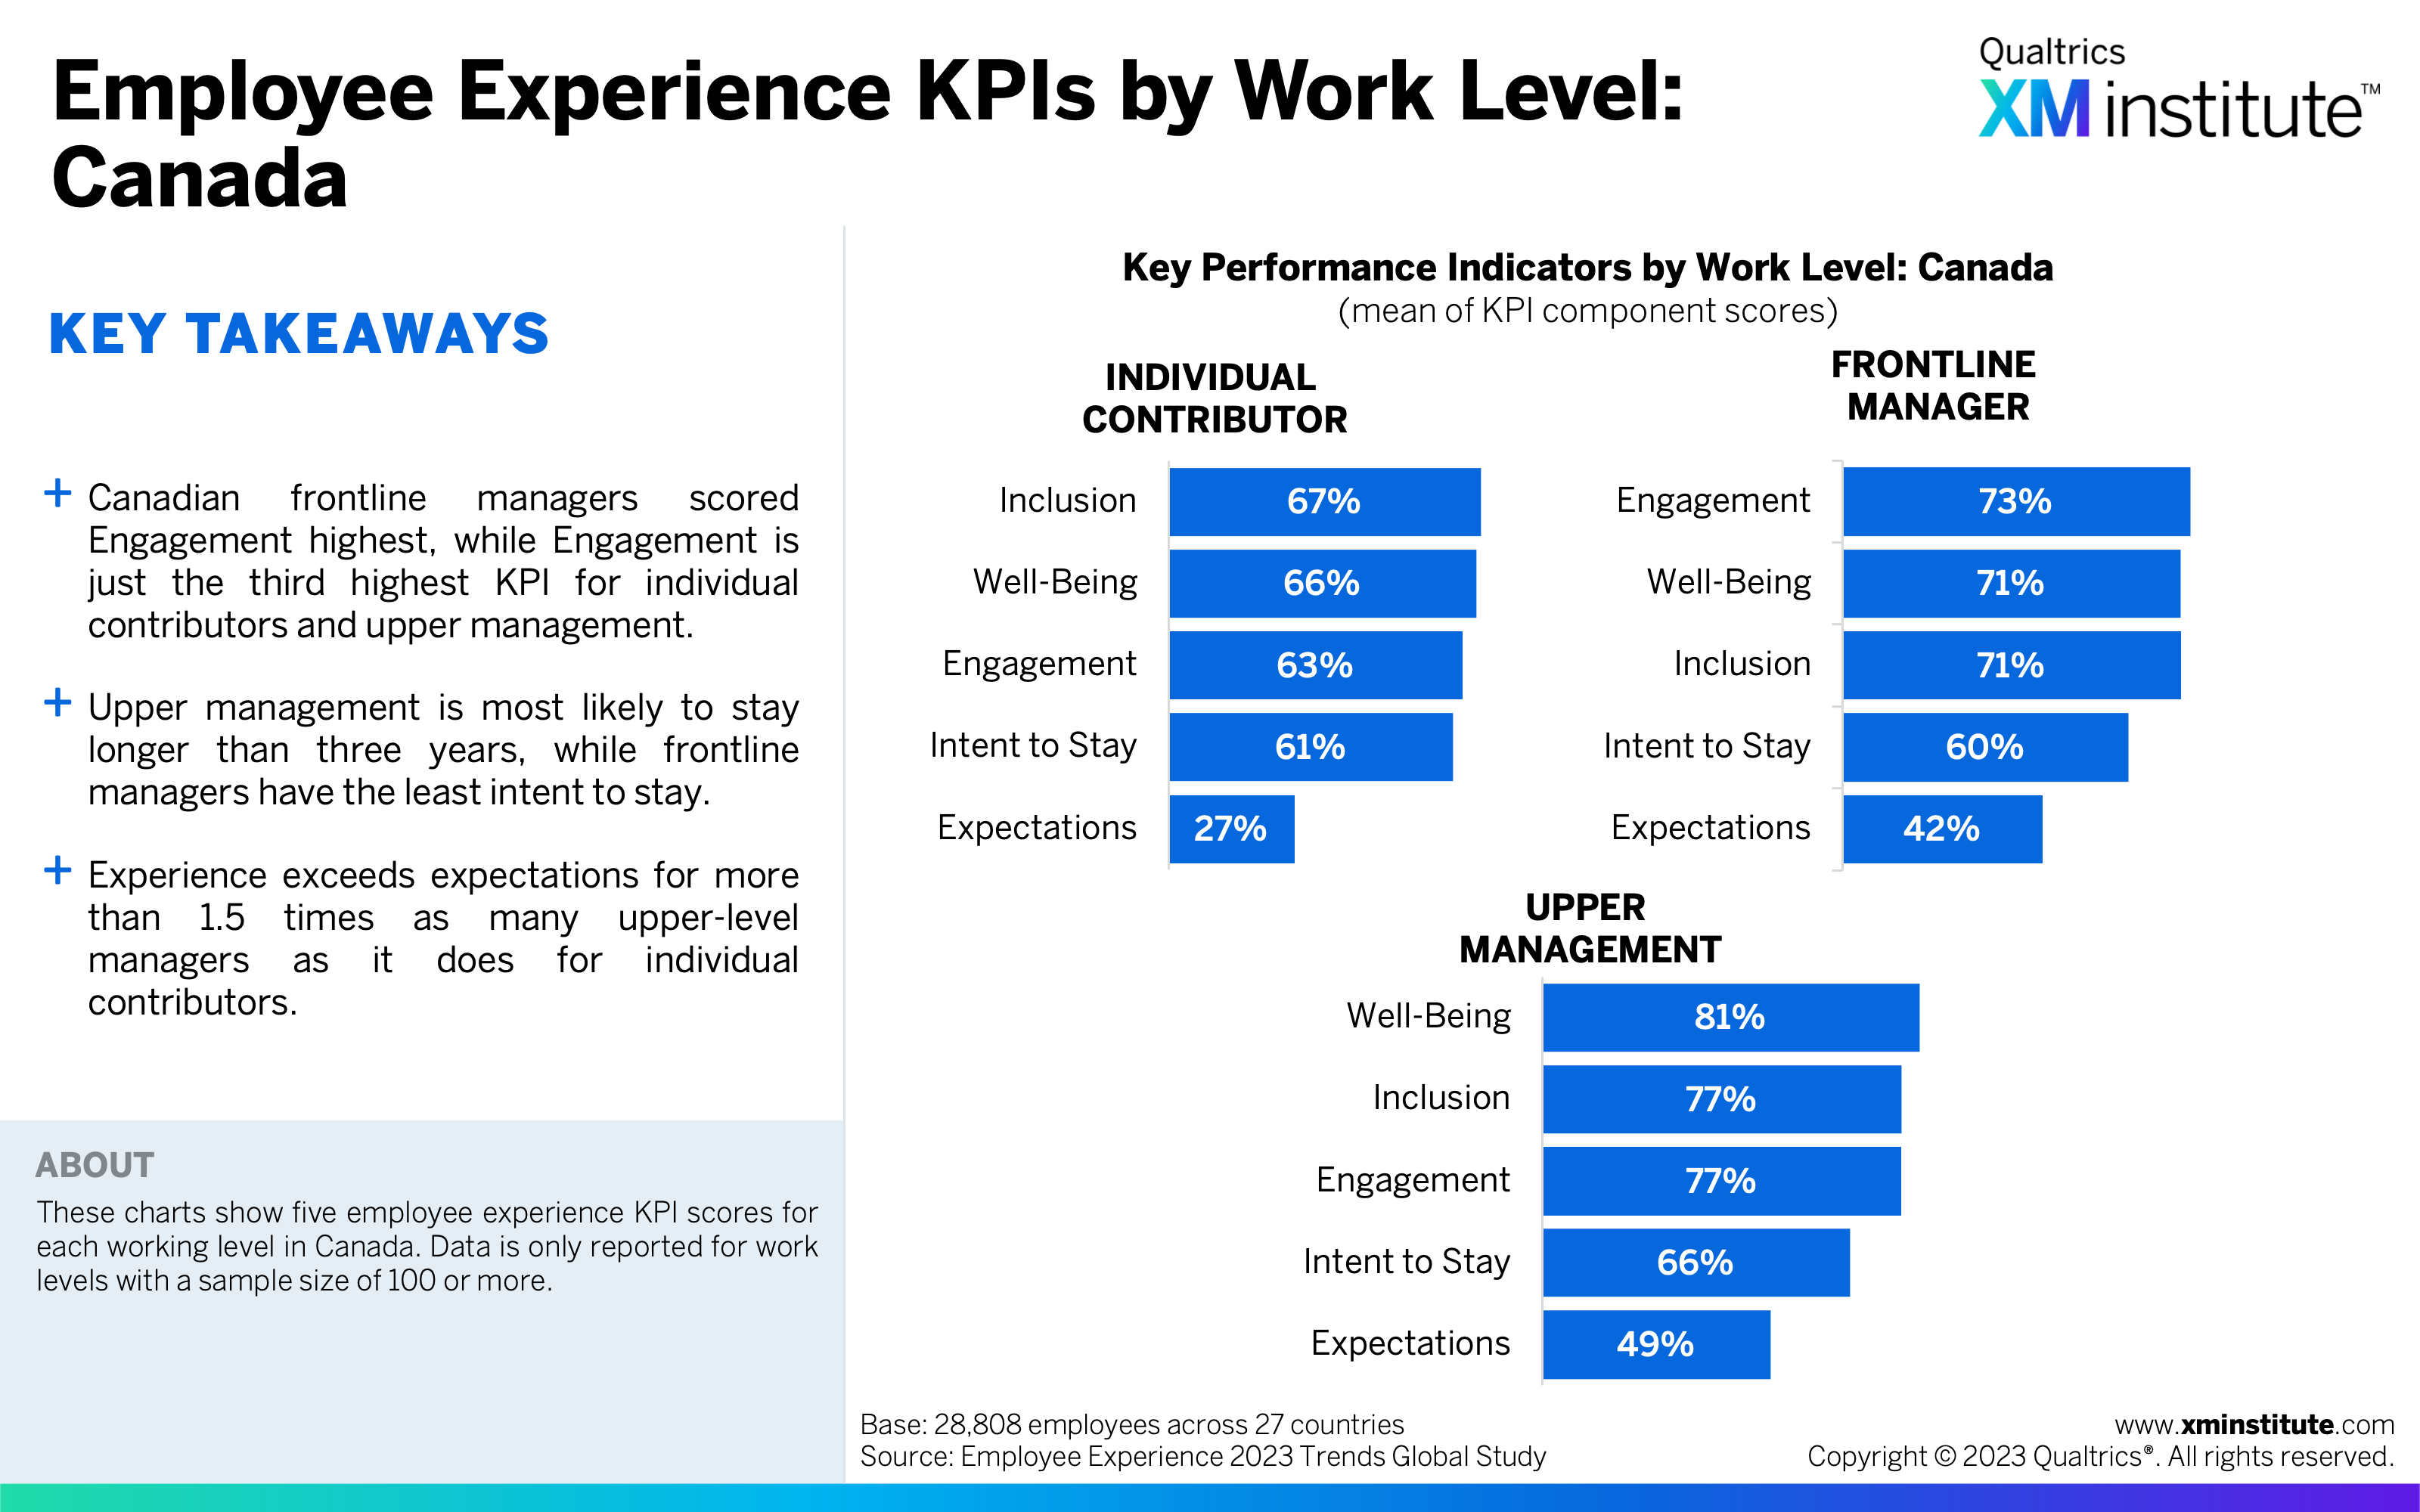
- Employee Experience KPIs by Work Level: Canada (see Figure 17)
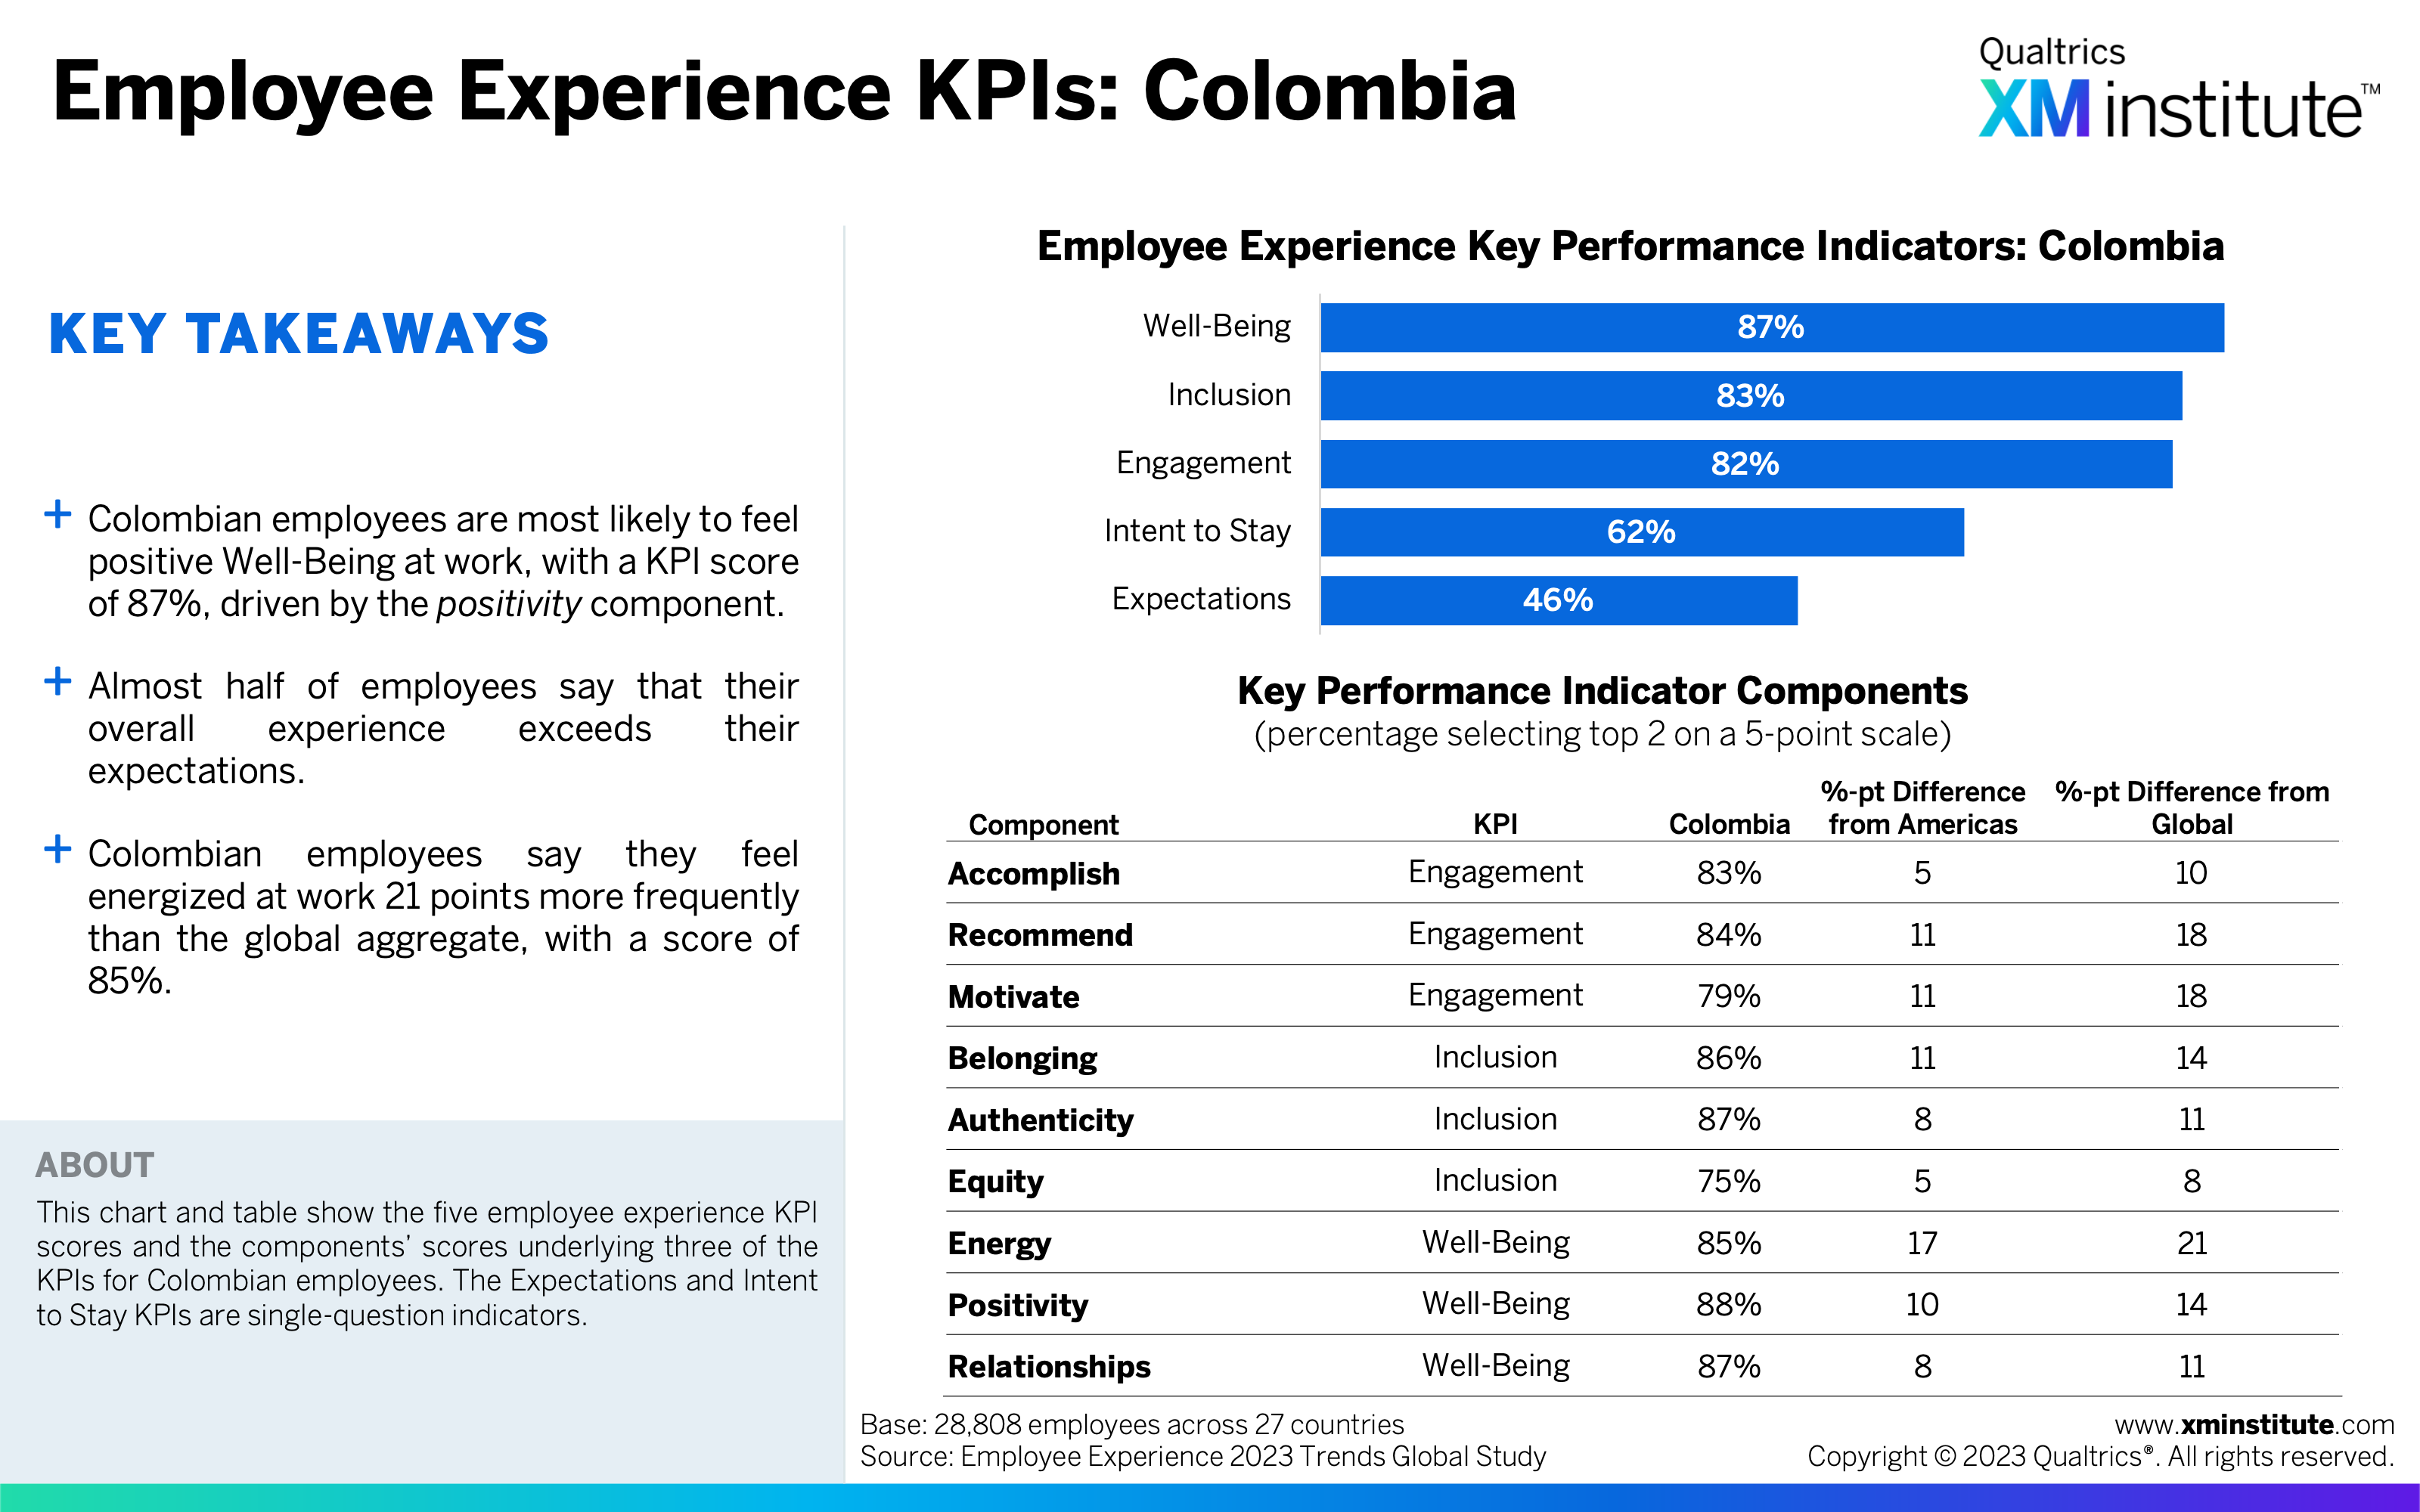
- Employee Experience KPIs: Colombia (see Figure 18)
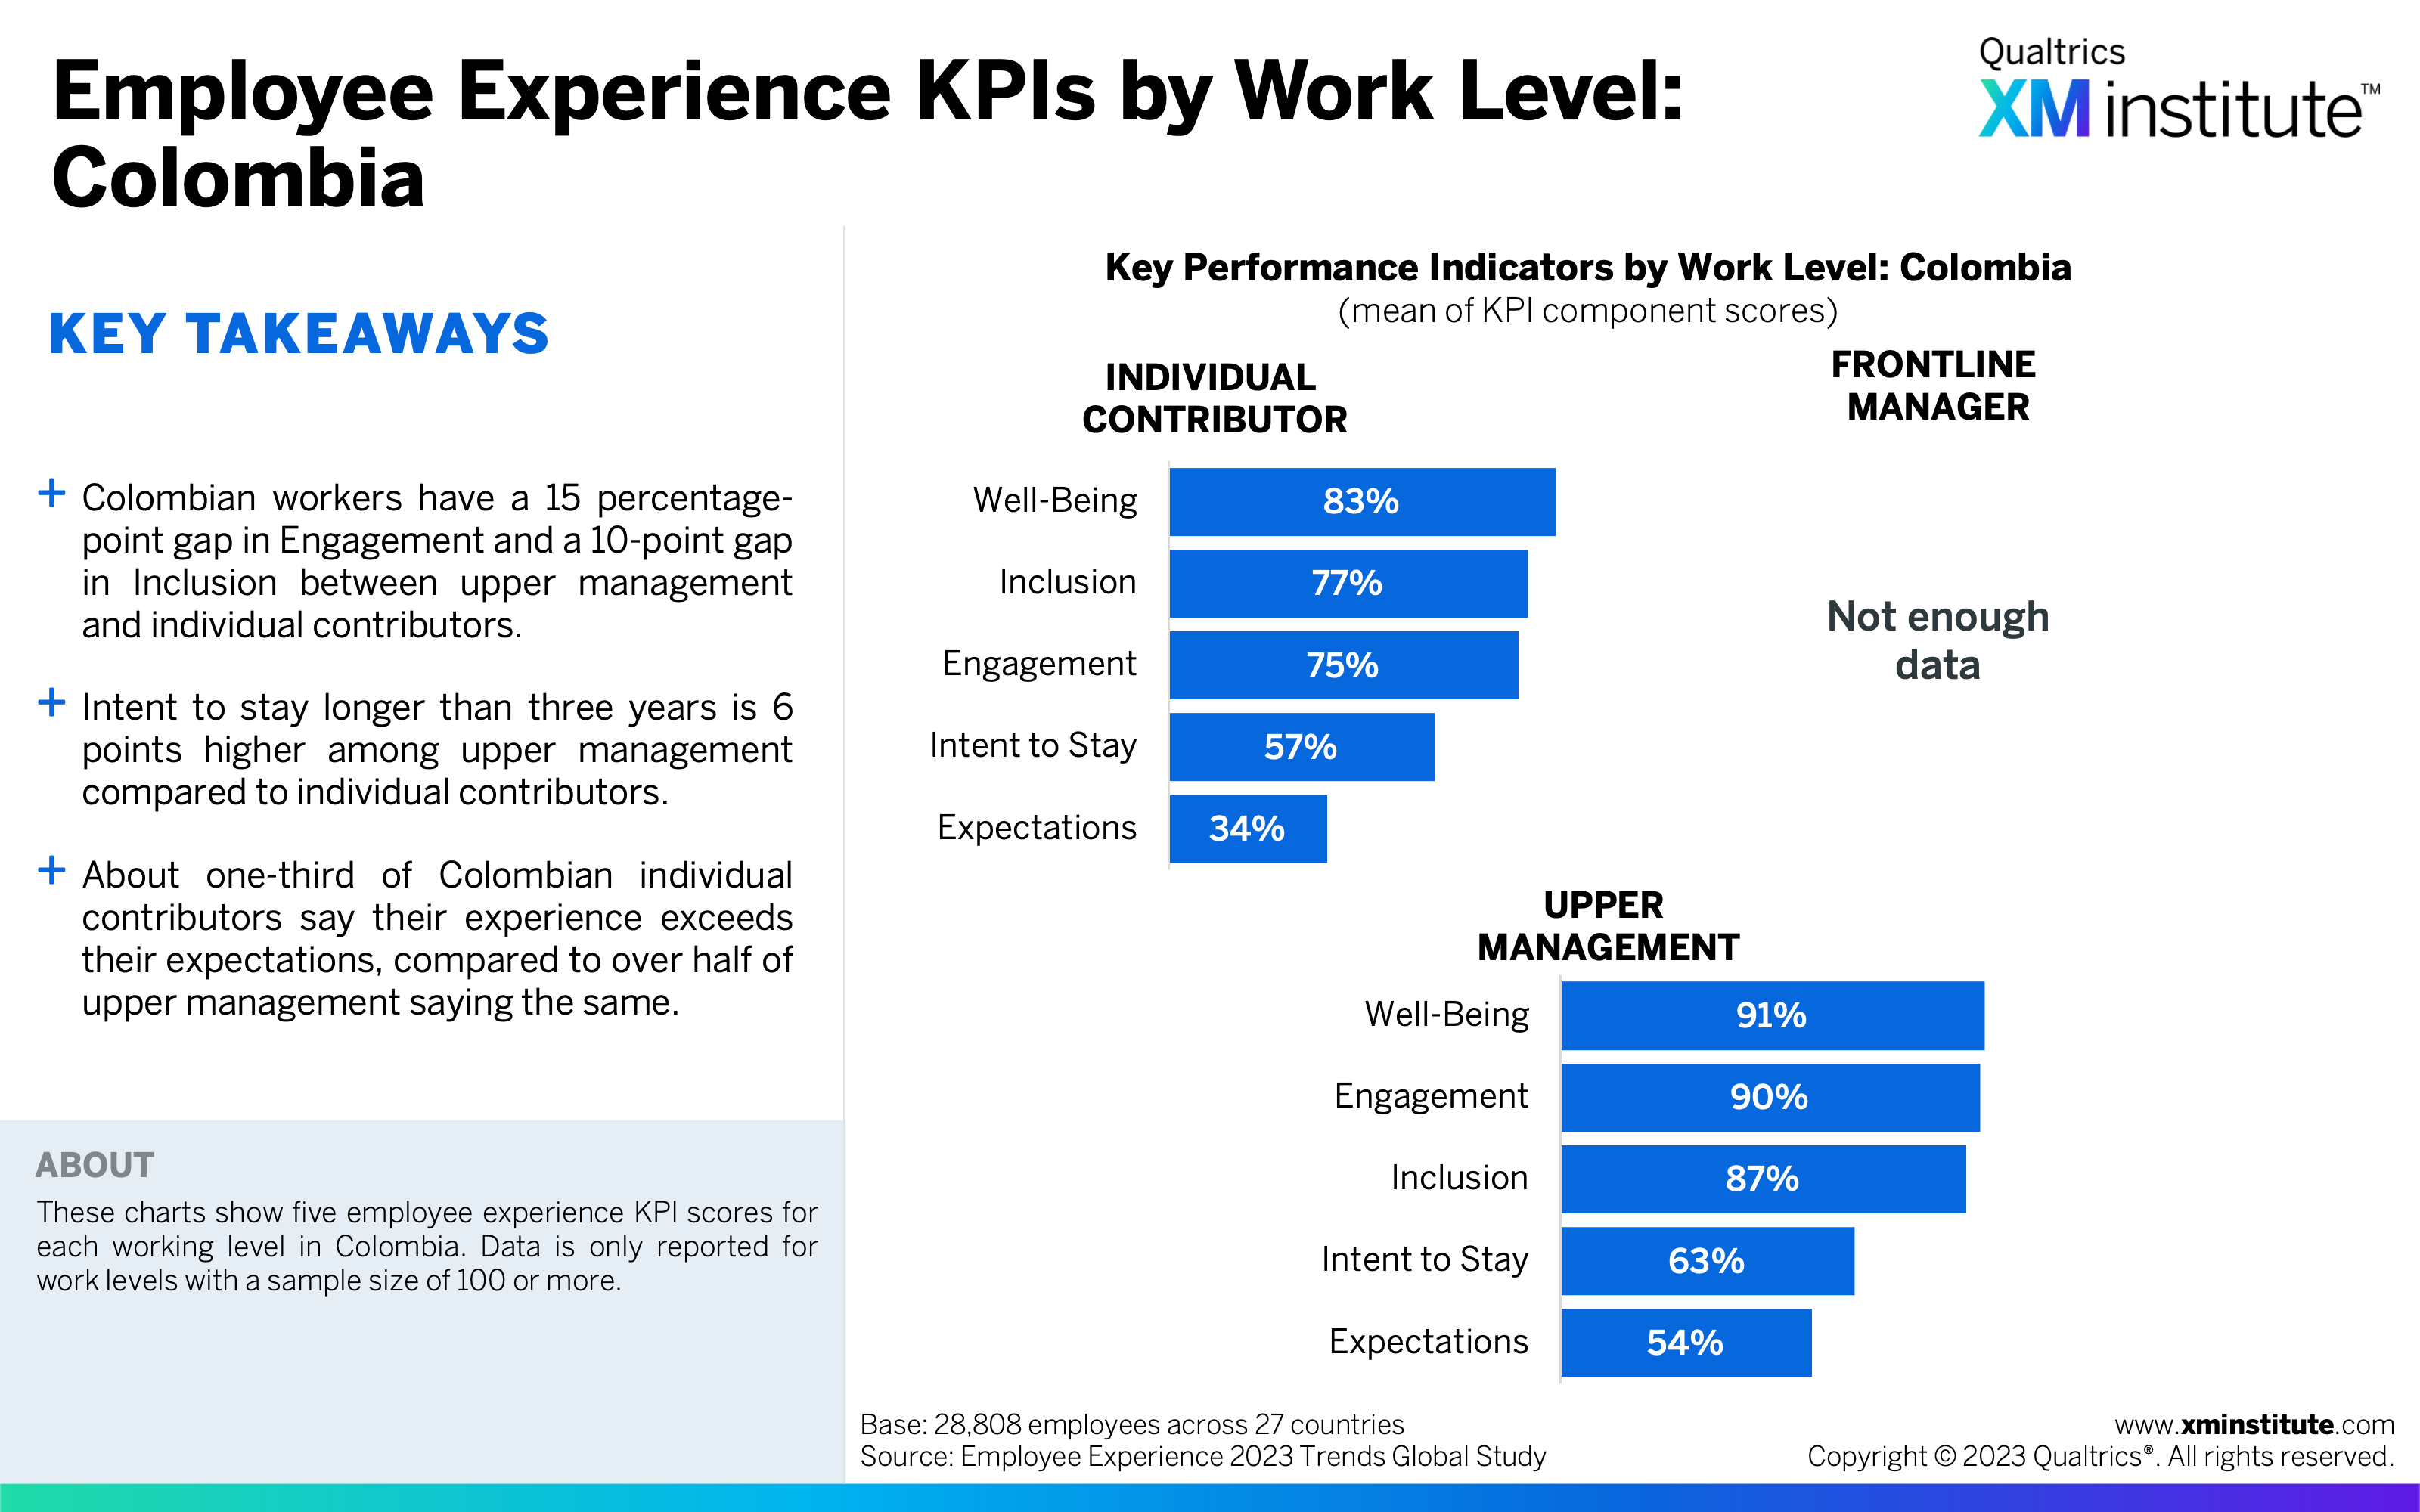
- Employee Experience KPIs by Work Level: Colombia (see Figure 19)
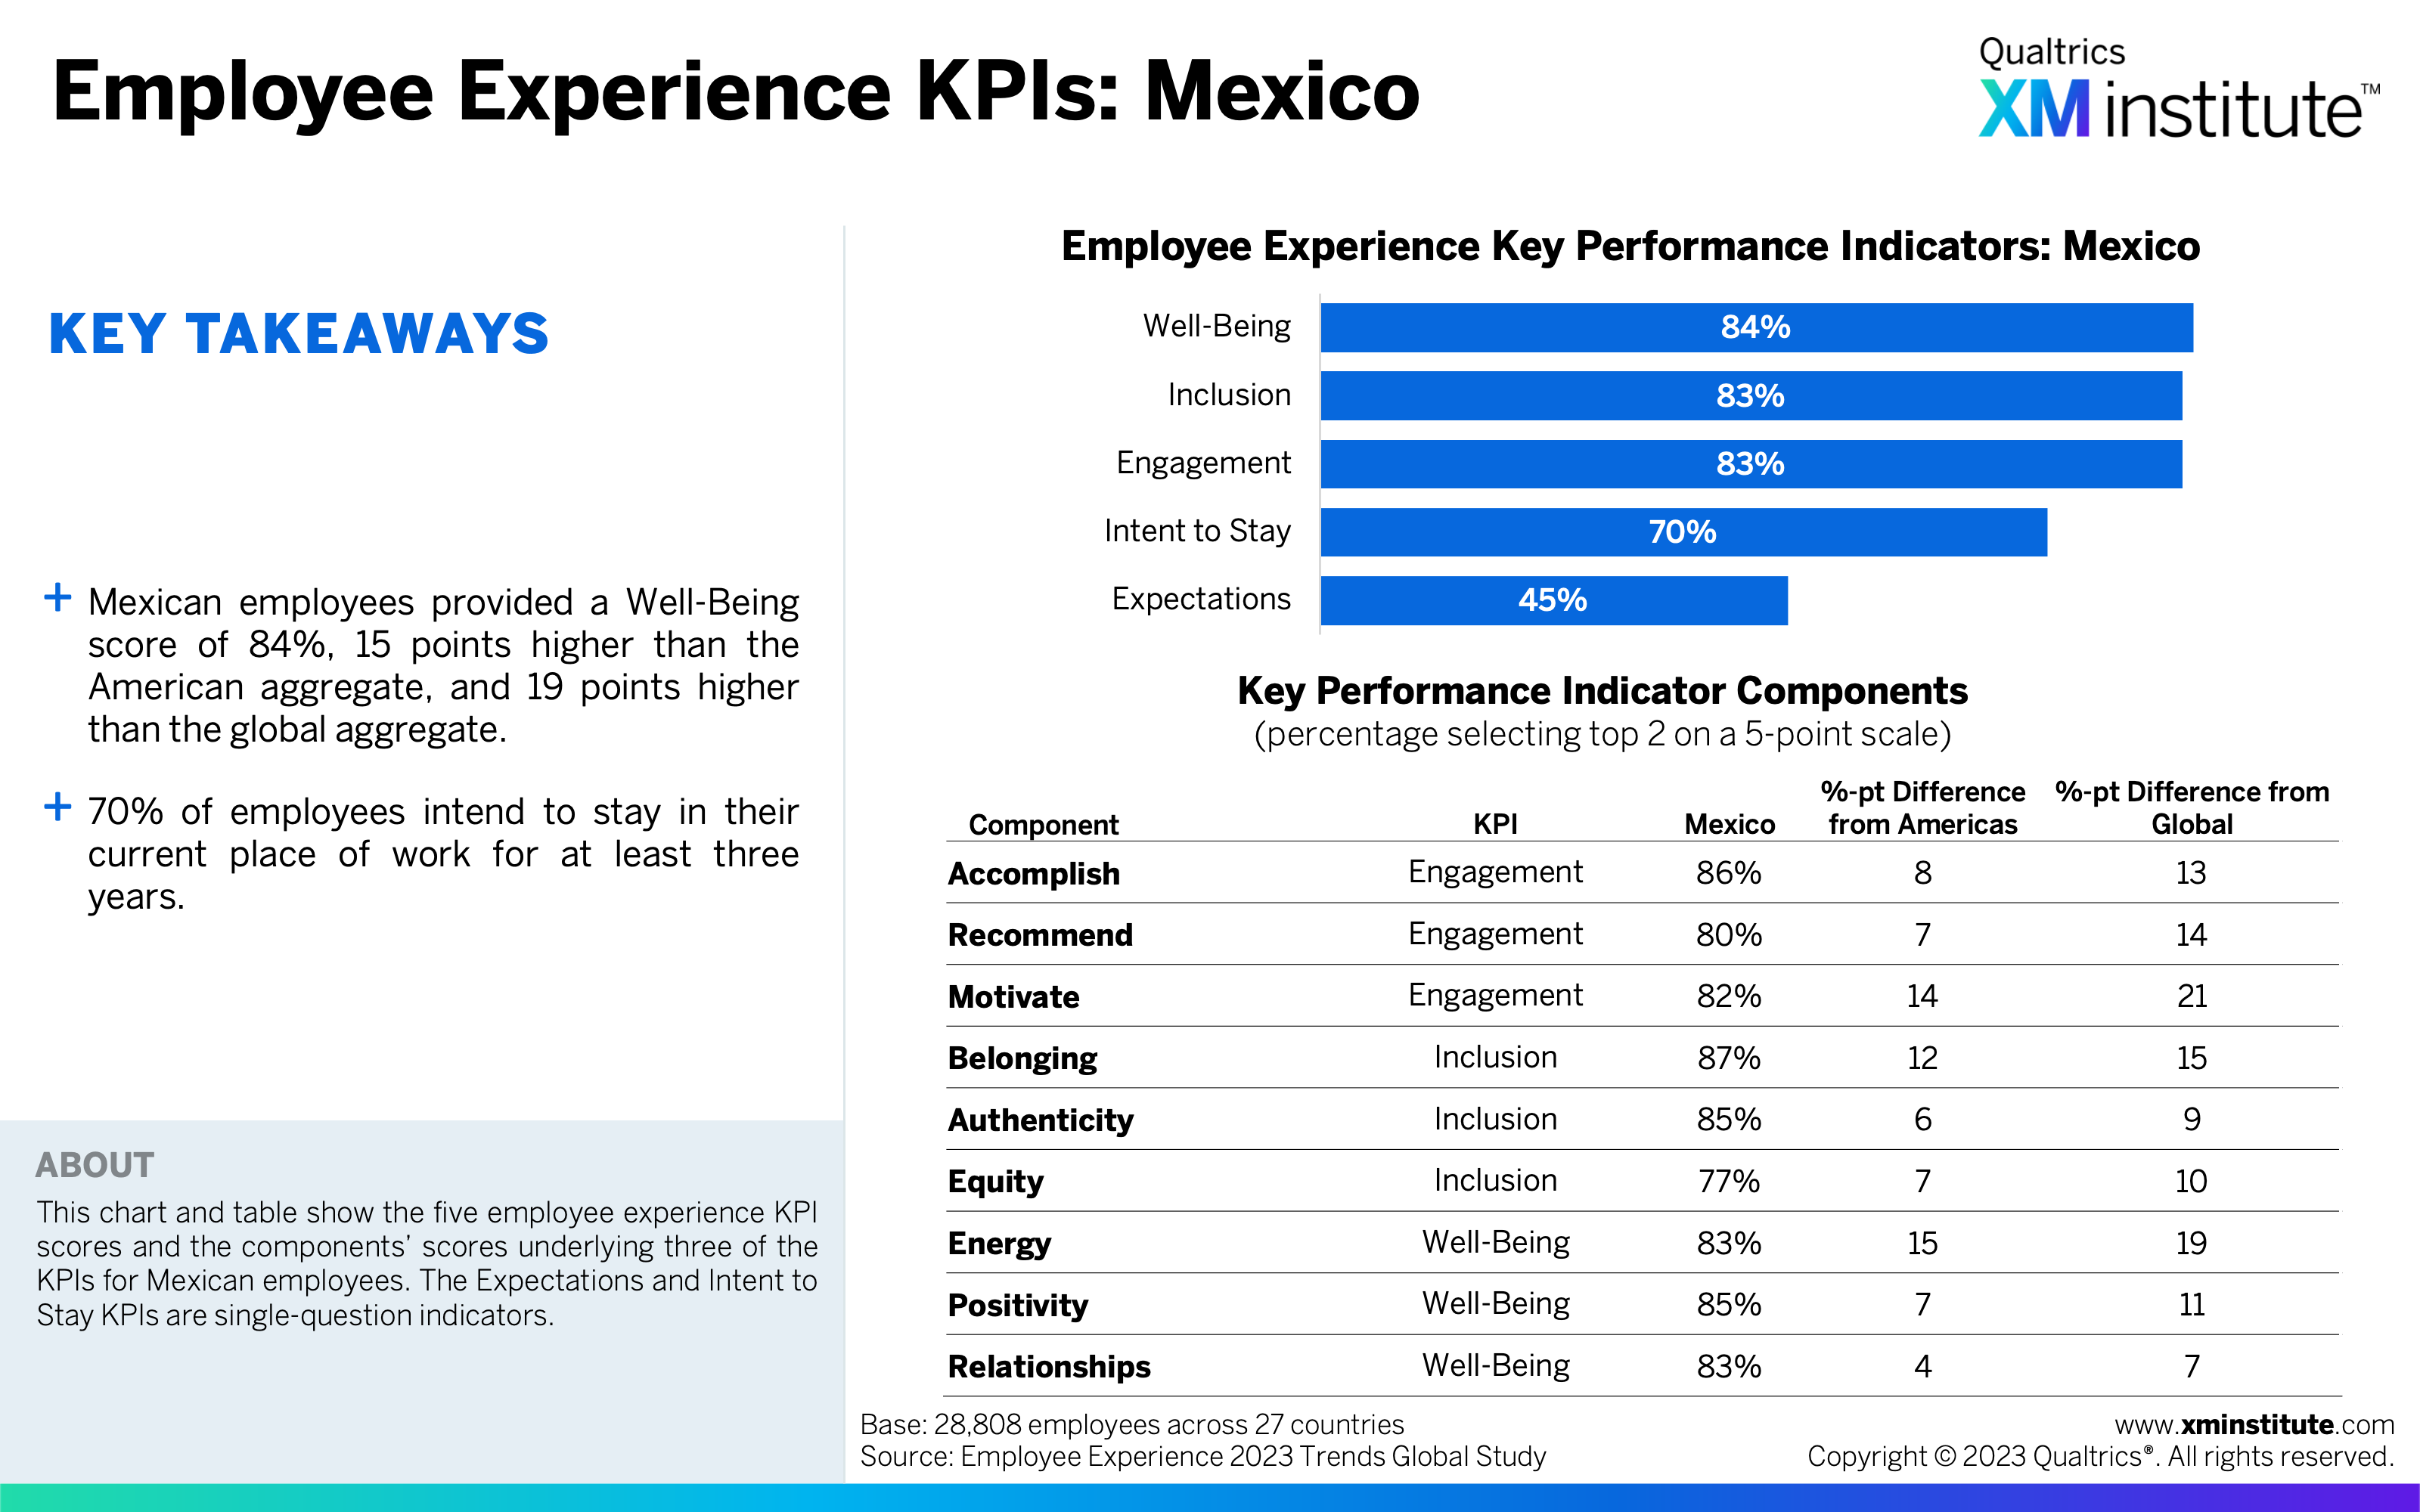
- Employee Experience KPIs: Mexico (see Figure 20)
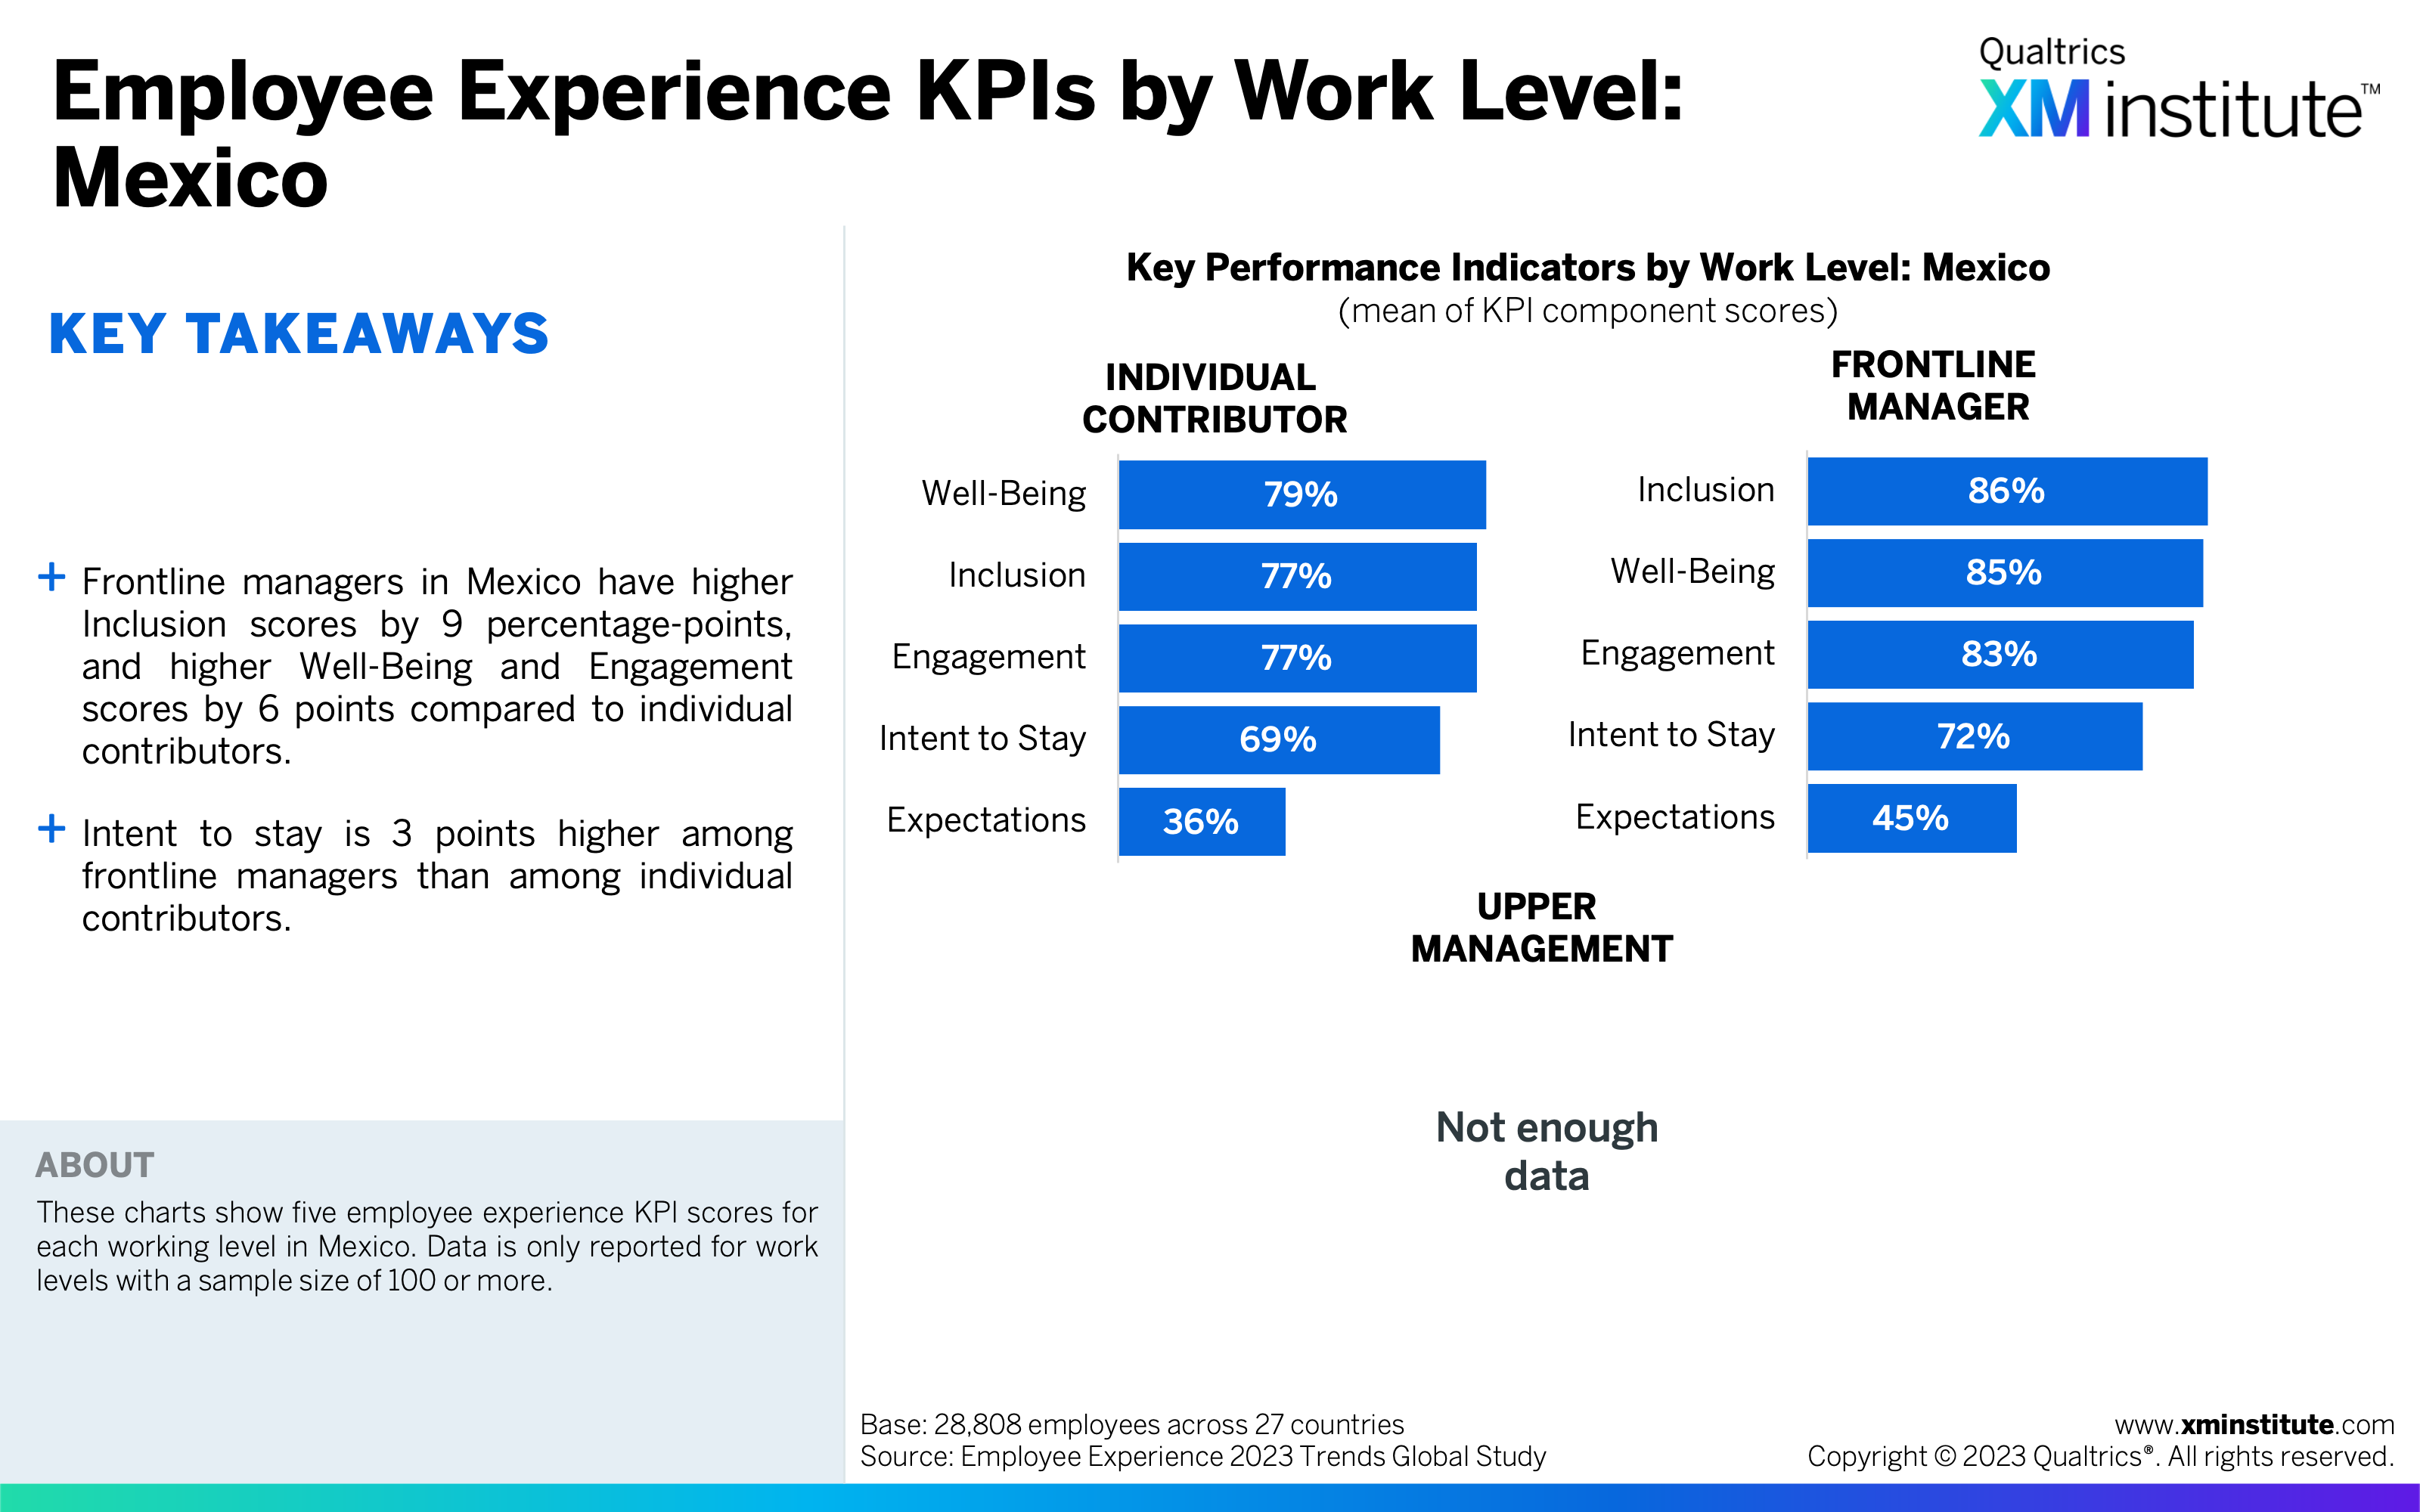
- Employee Experience KPIs by Work Level: Mexico (see Figure 21)
- Employee Experience KPIs: United States (see Figure 22)
- Employee Experience KPIs by Work Level: United States (see Figure 23)
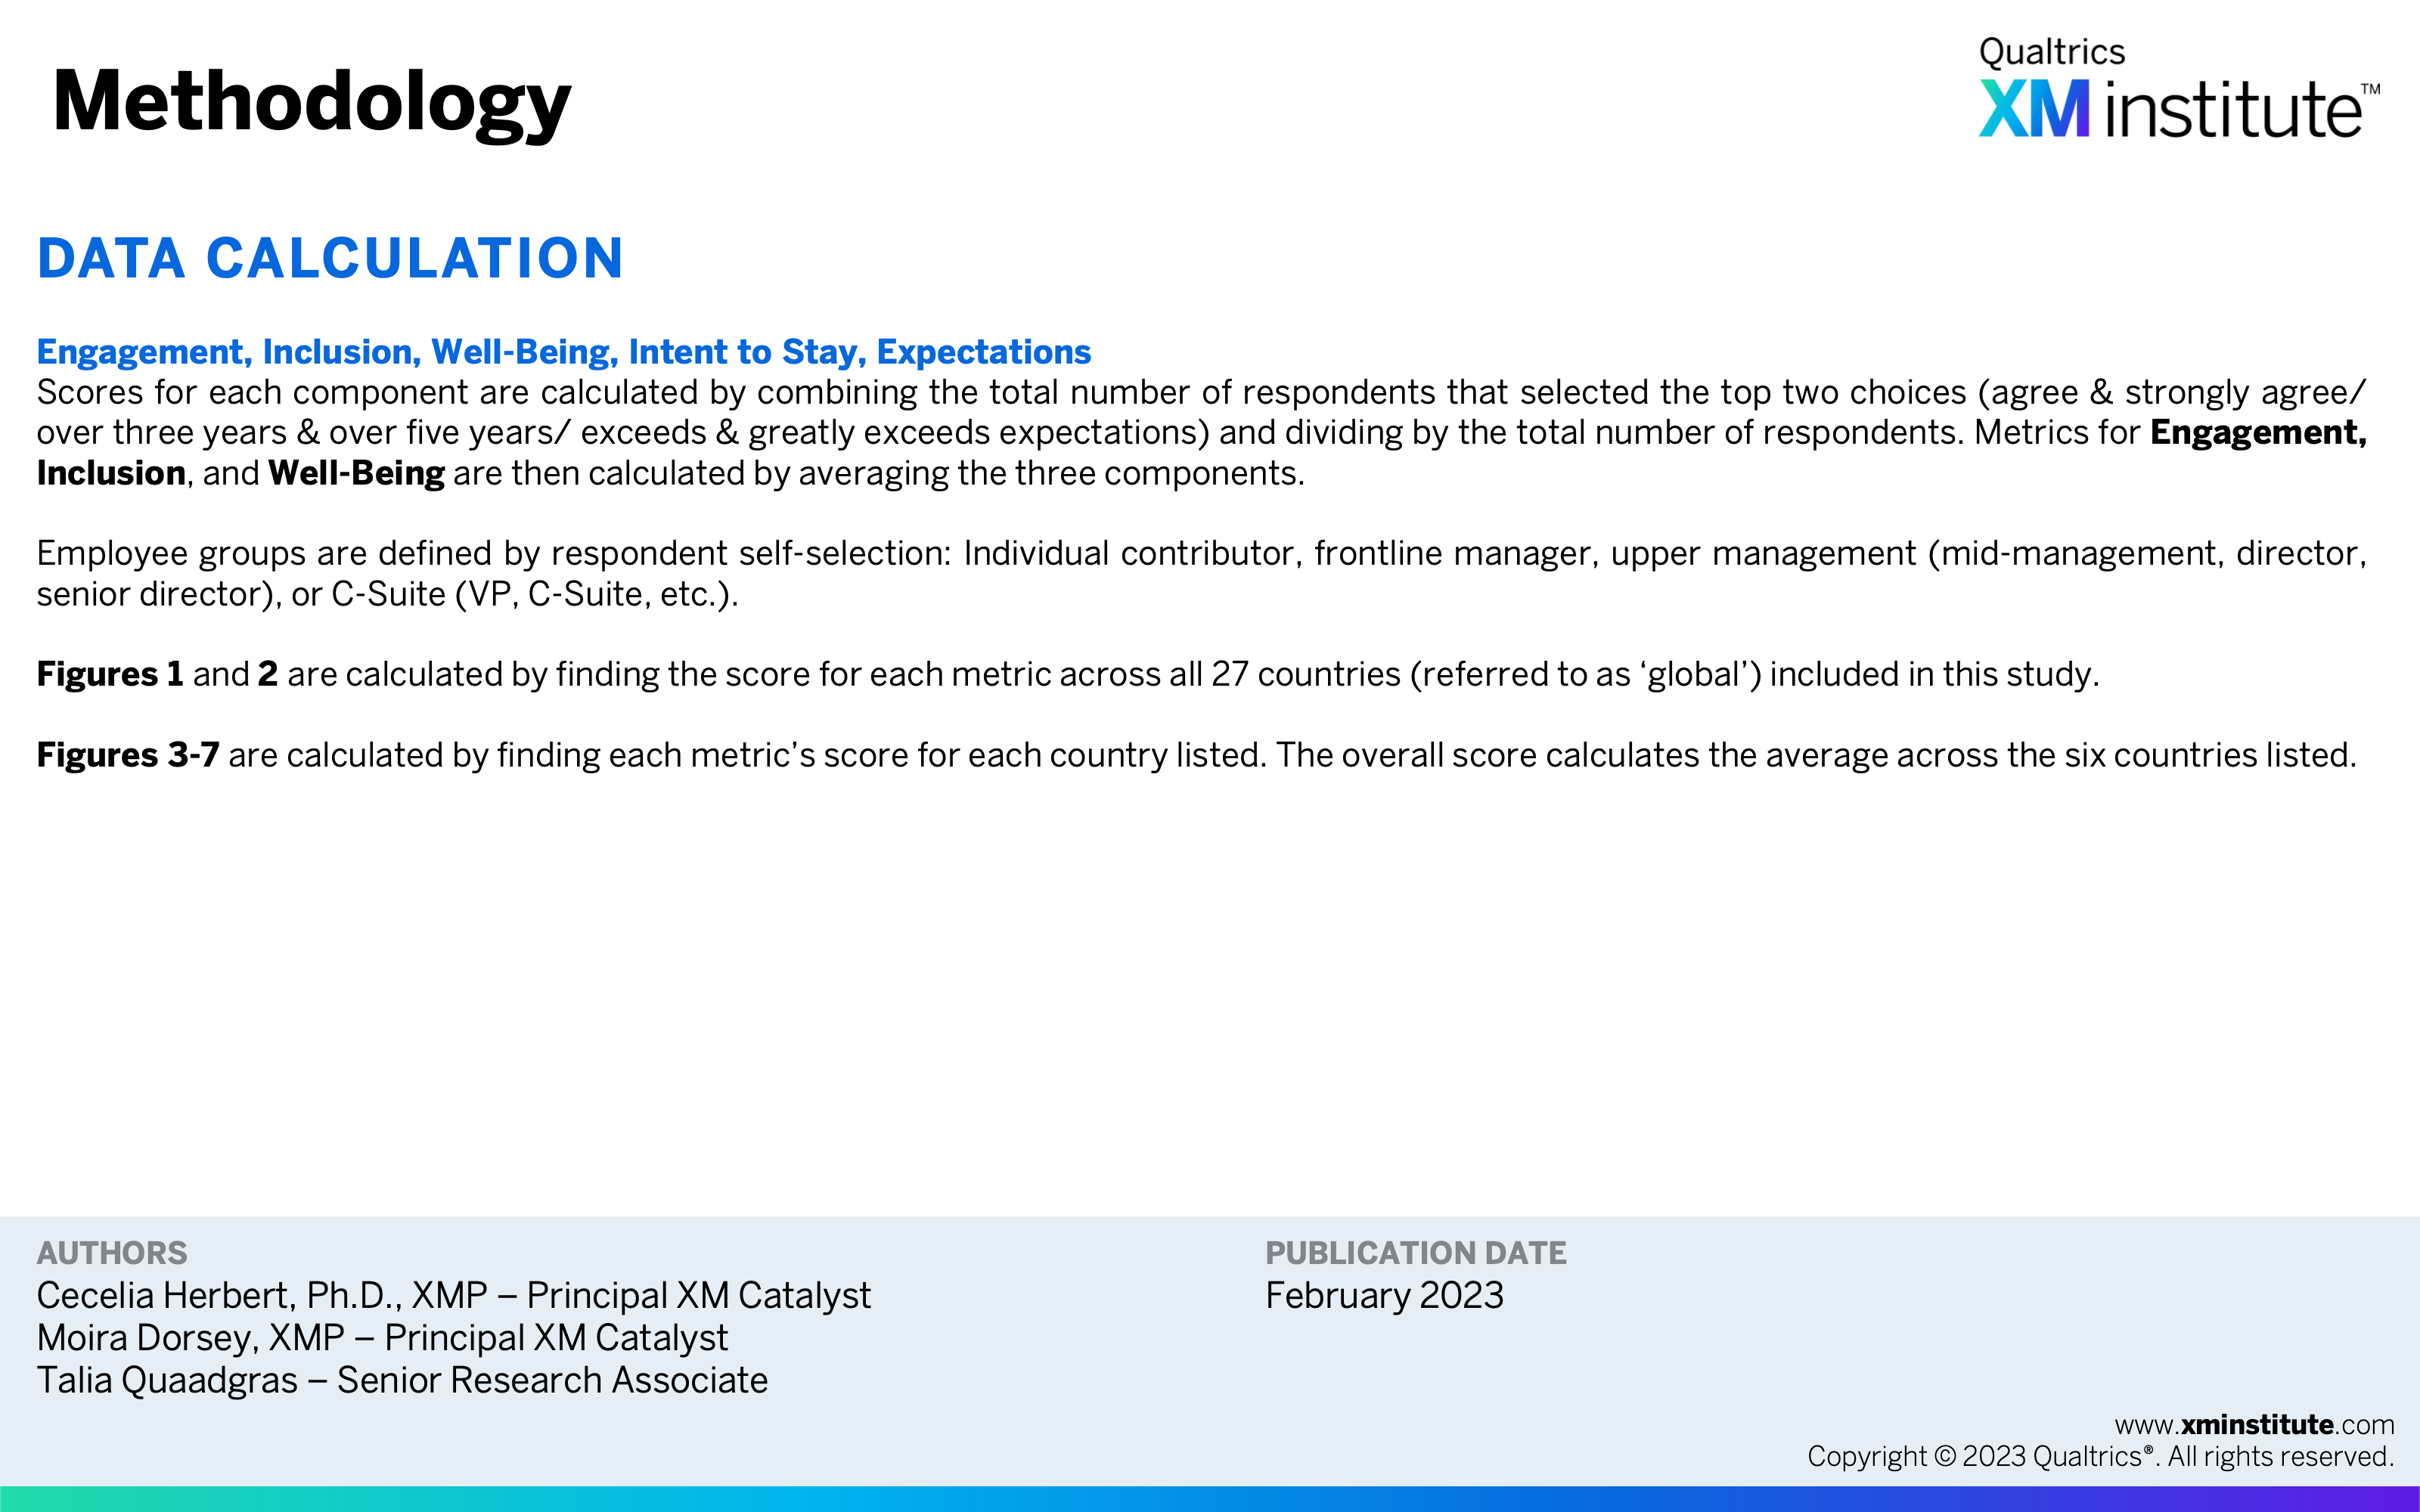
- Methodology (see Figure 24)