Key Findings
As part of the Qualtrics 2025 Employee Experience Trends Study, employees from 23 countries/regions rated their current experience at work across several components. From their responses, we analyzed the five employee experience (EX) indicators (Engagement, Inclusion, Well-Being, Intent to Stay and Experience v Expectations) and how they have changed between 2021 and 2024. We also conducted a regression analysis to identify the top drivers of Engagement in each country. In this report, we share the metrics from APJ.
- APJ scores higher than global norms on all KPIs except Inclusion. Employees in APJ provided Experience v Expectation and Intent to Stay scores 3 points above the global norm each, while Engagement and Well-Being ratings are 1 point higher than global.
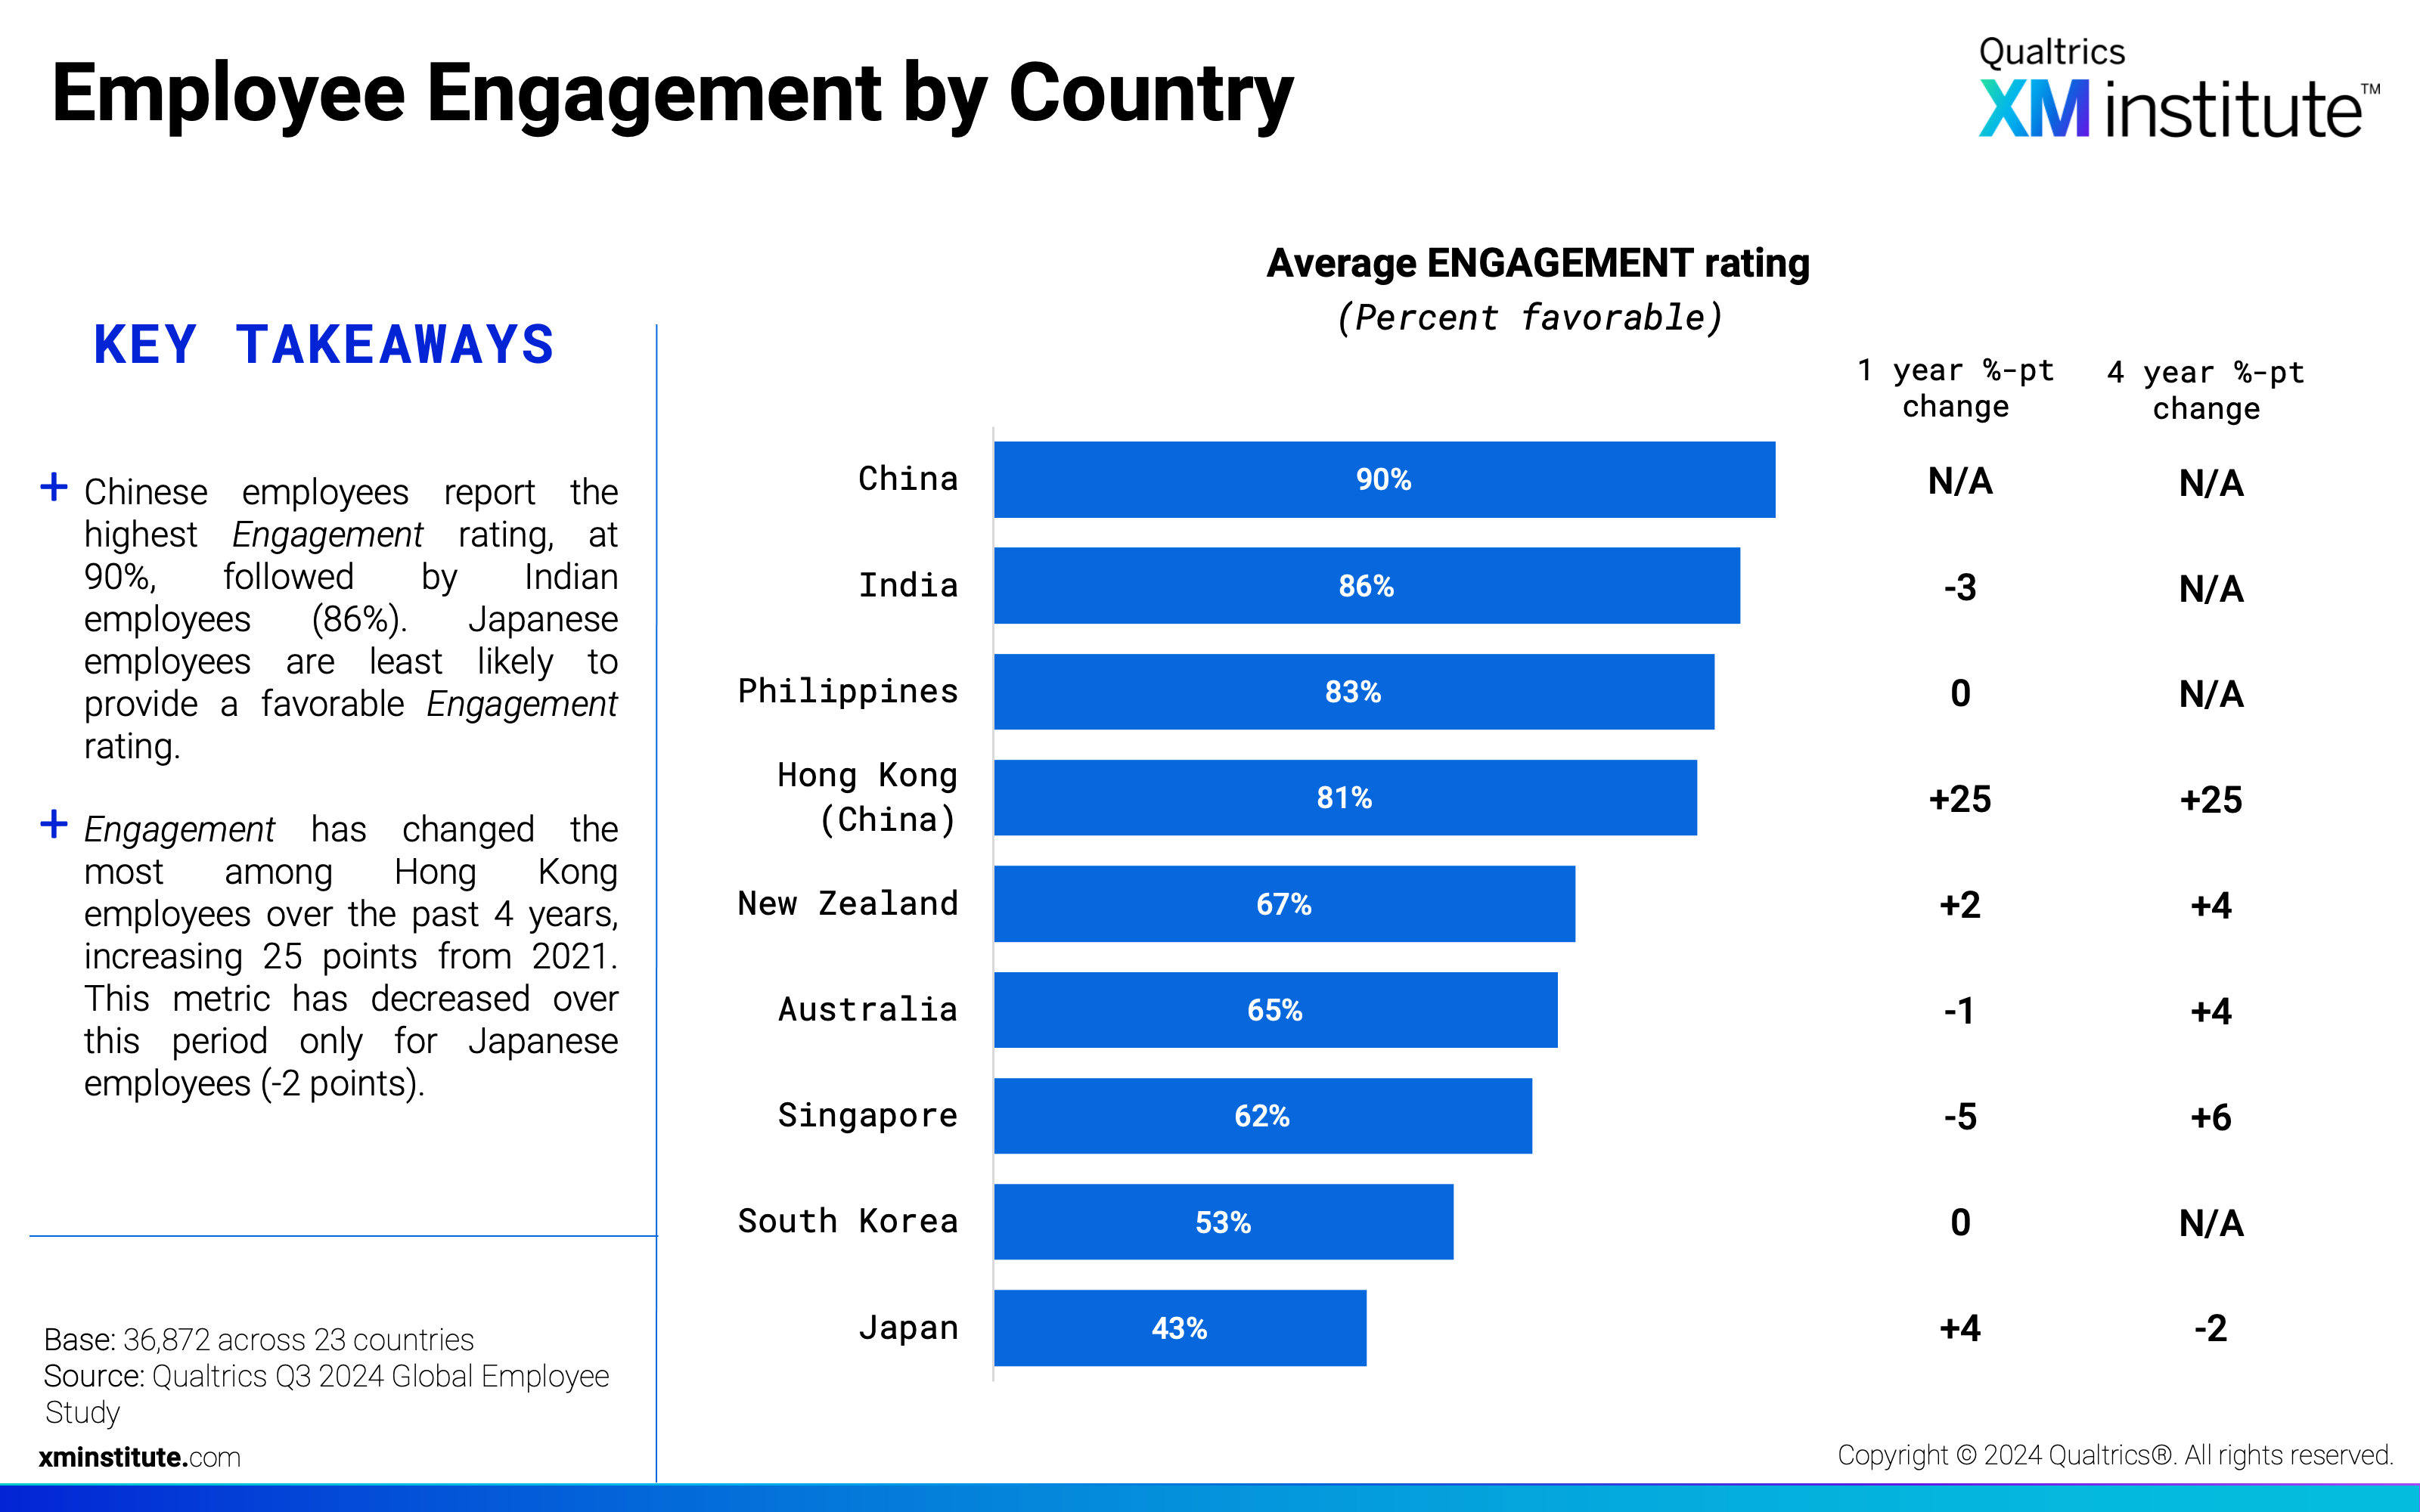
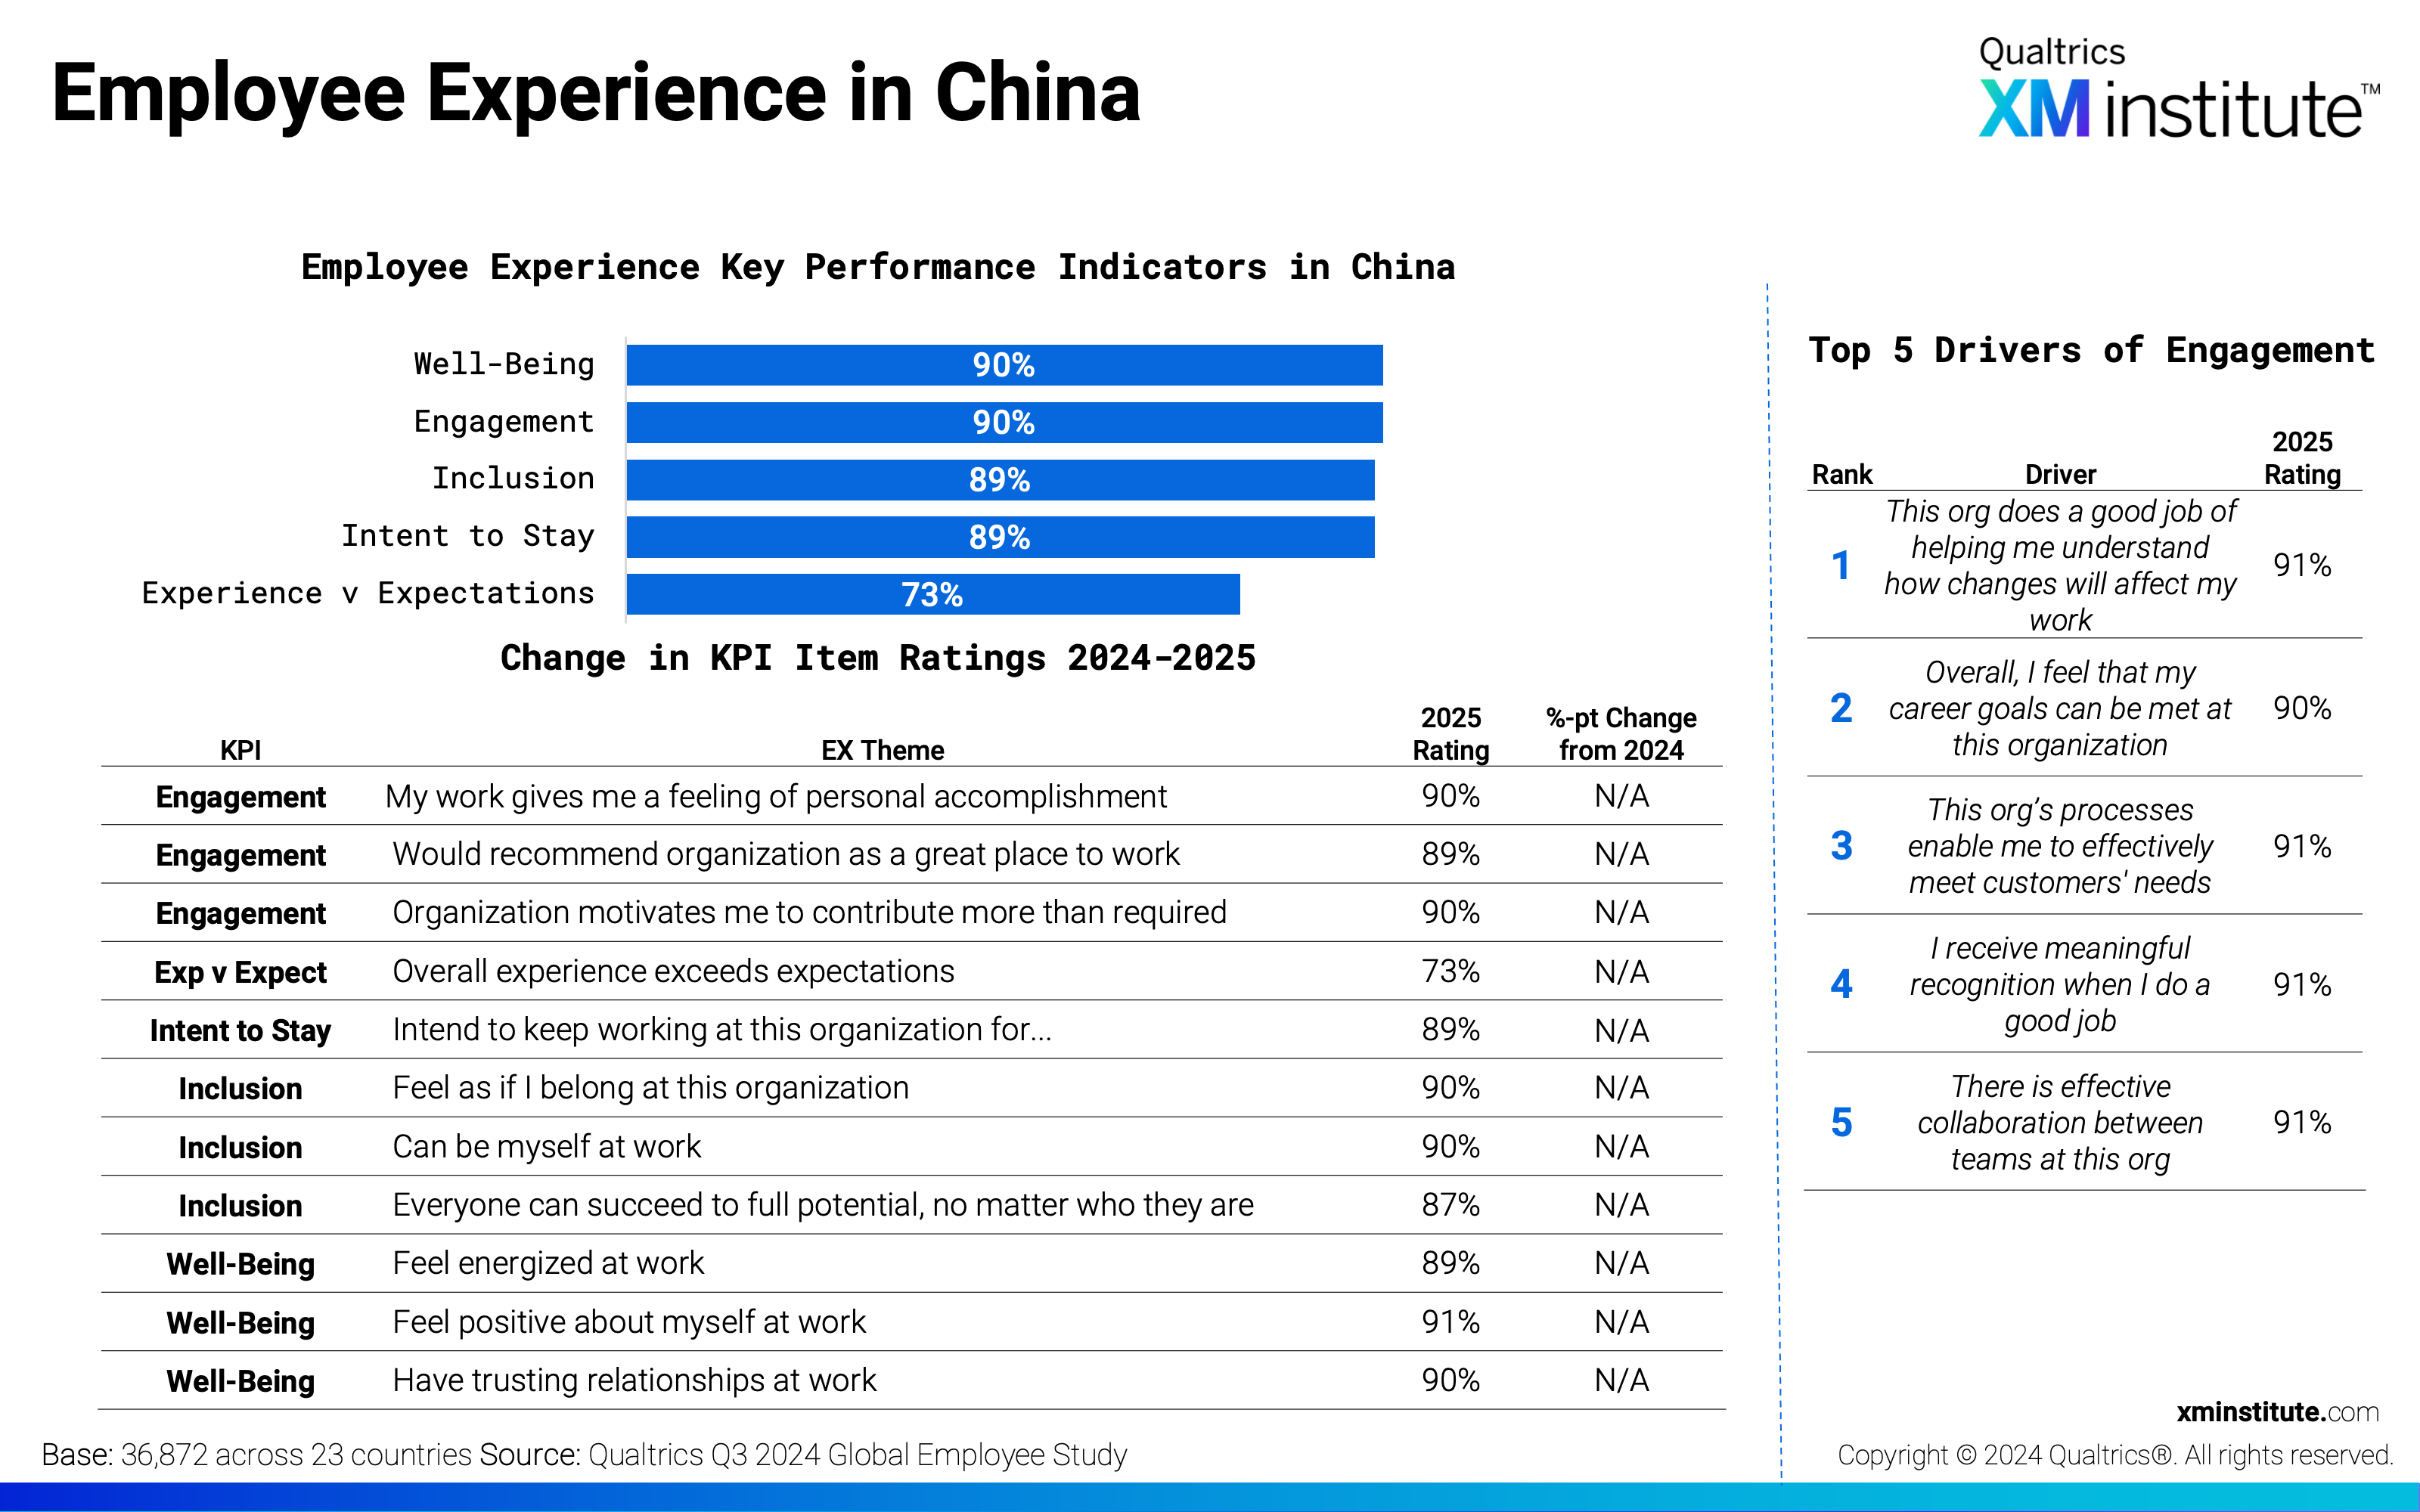
- China bucks the trend. Chinese employees provided substantially more favorable responses than other employees in APJ, with KPI scores dropping 5 points or more when China is excluded from our analysis. Excluding Chinese employees also reduces all APJ KPI scores to below that of the global norm.
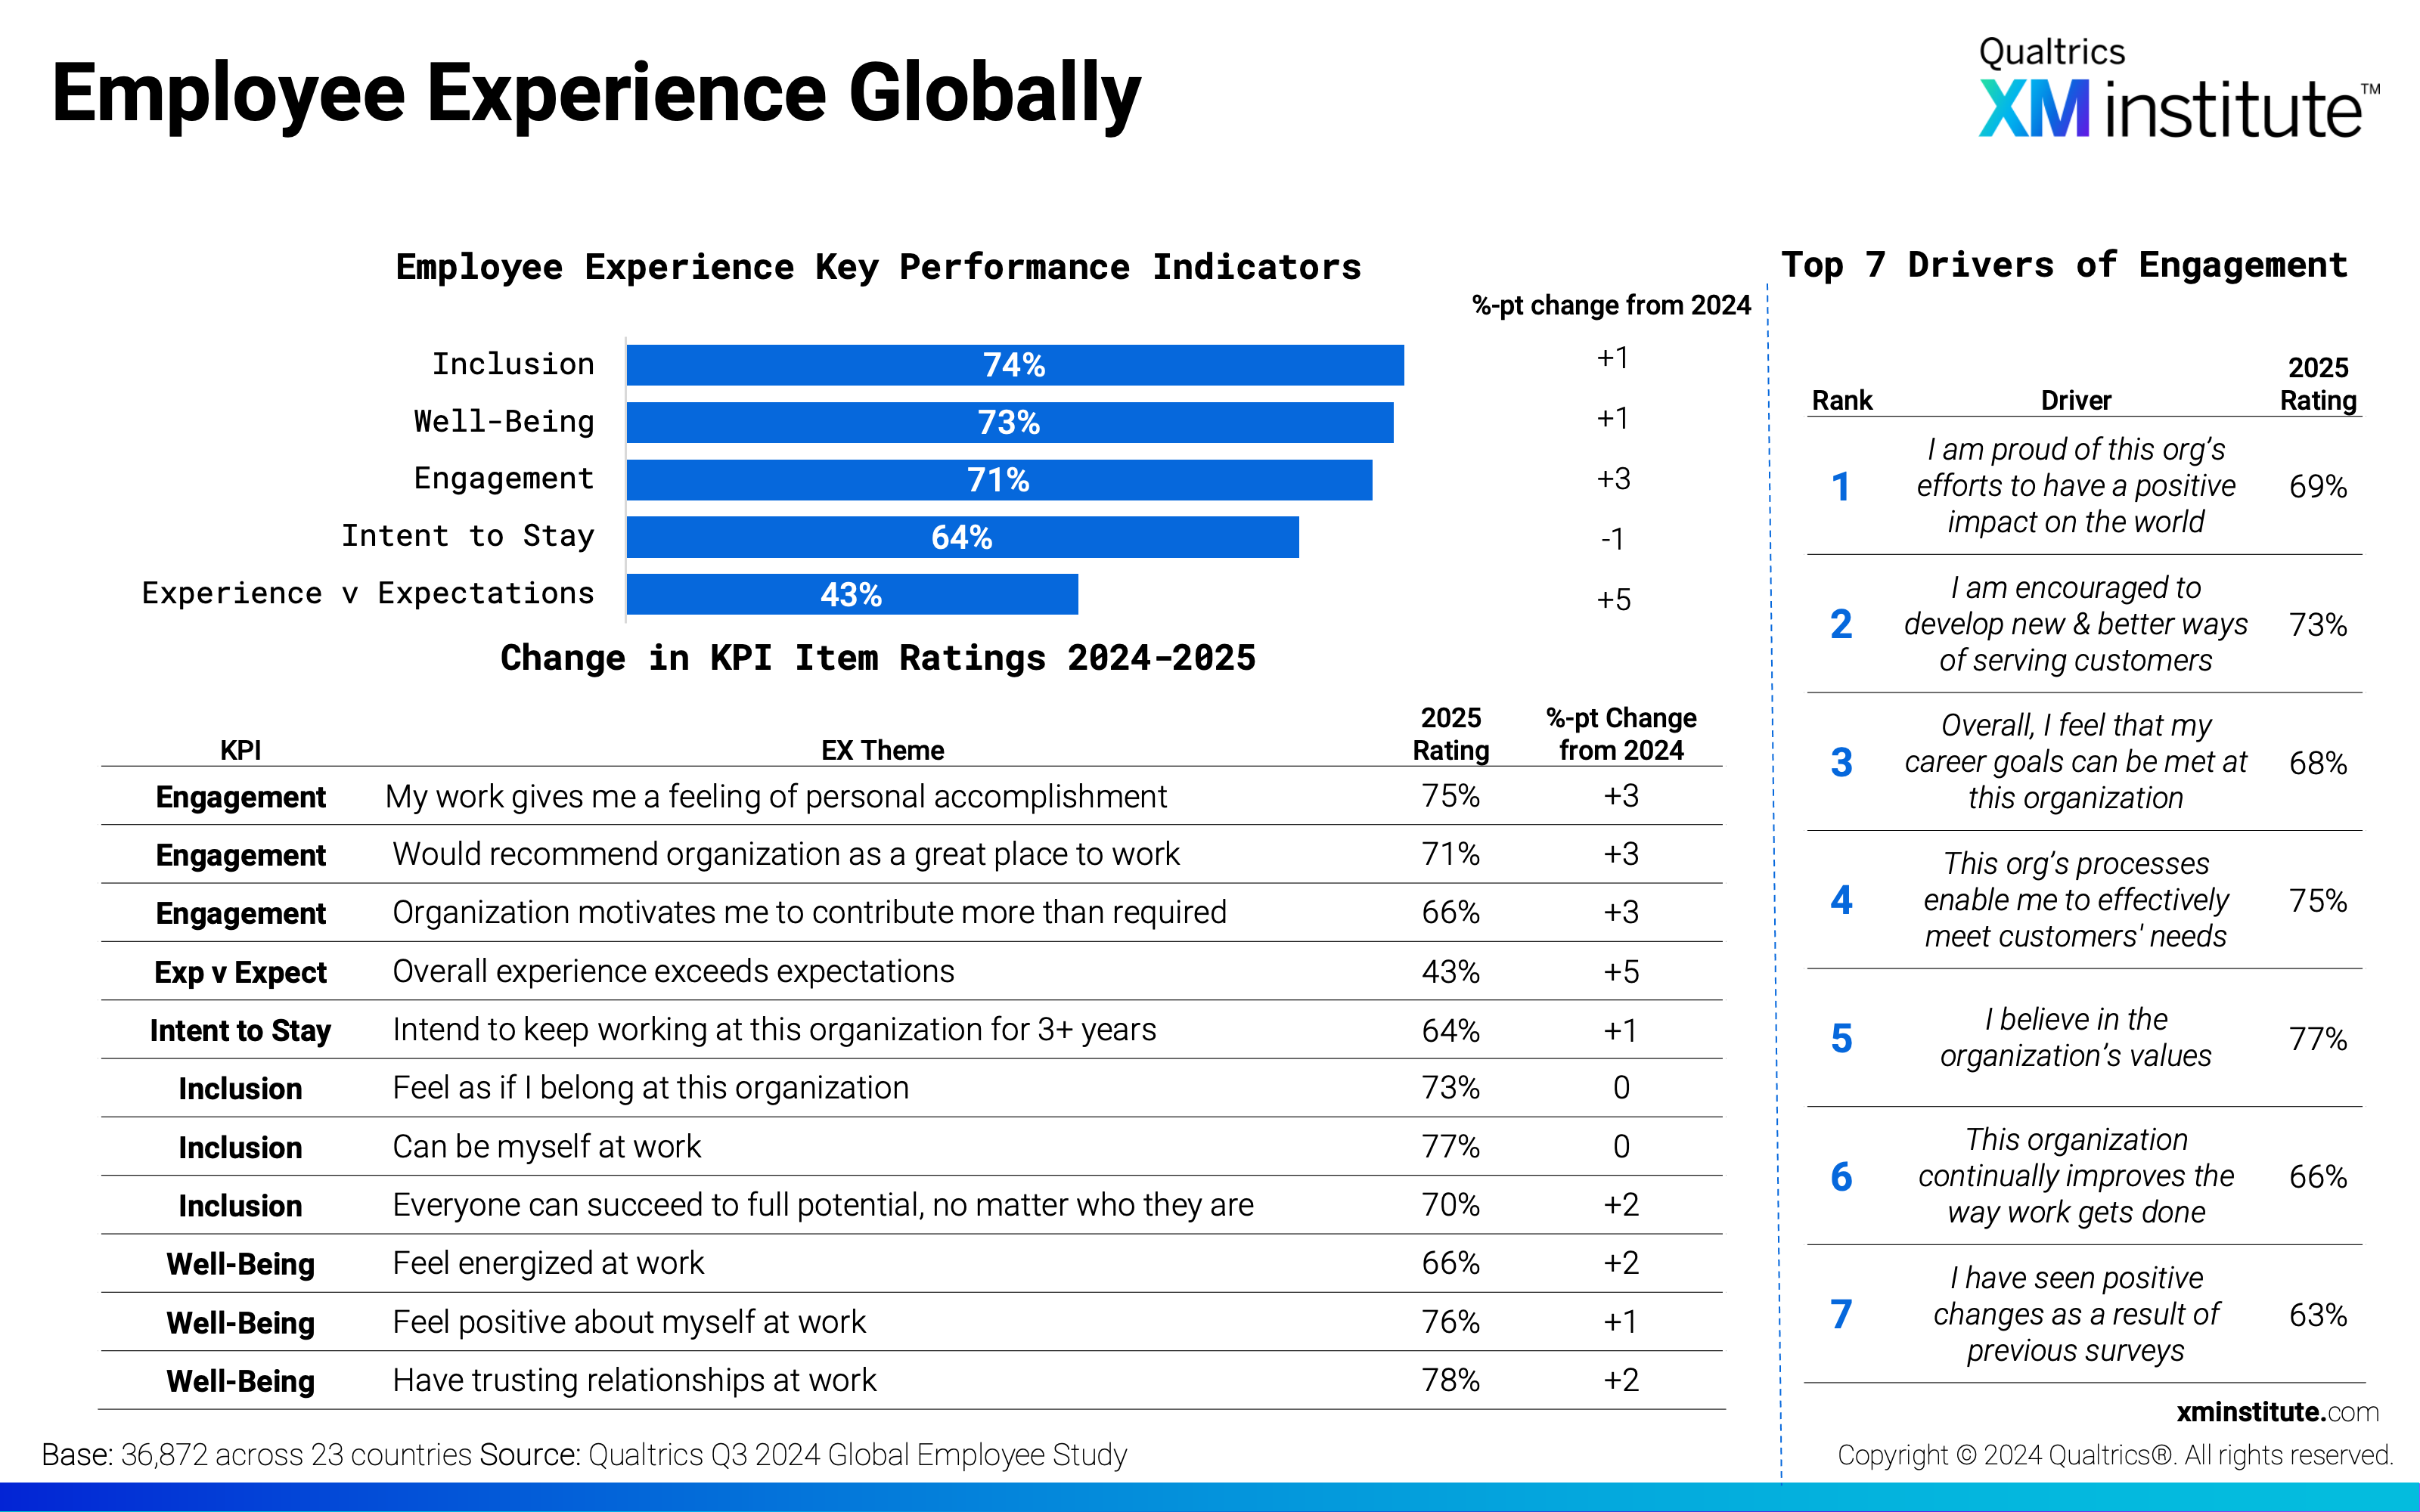
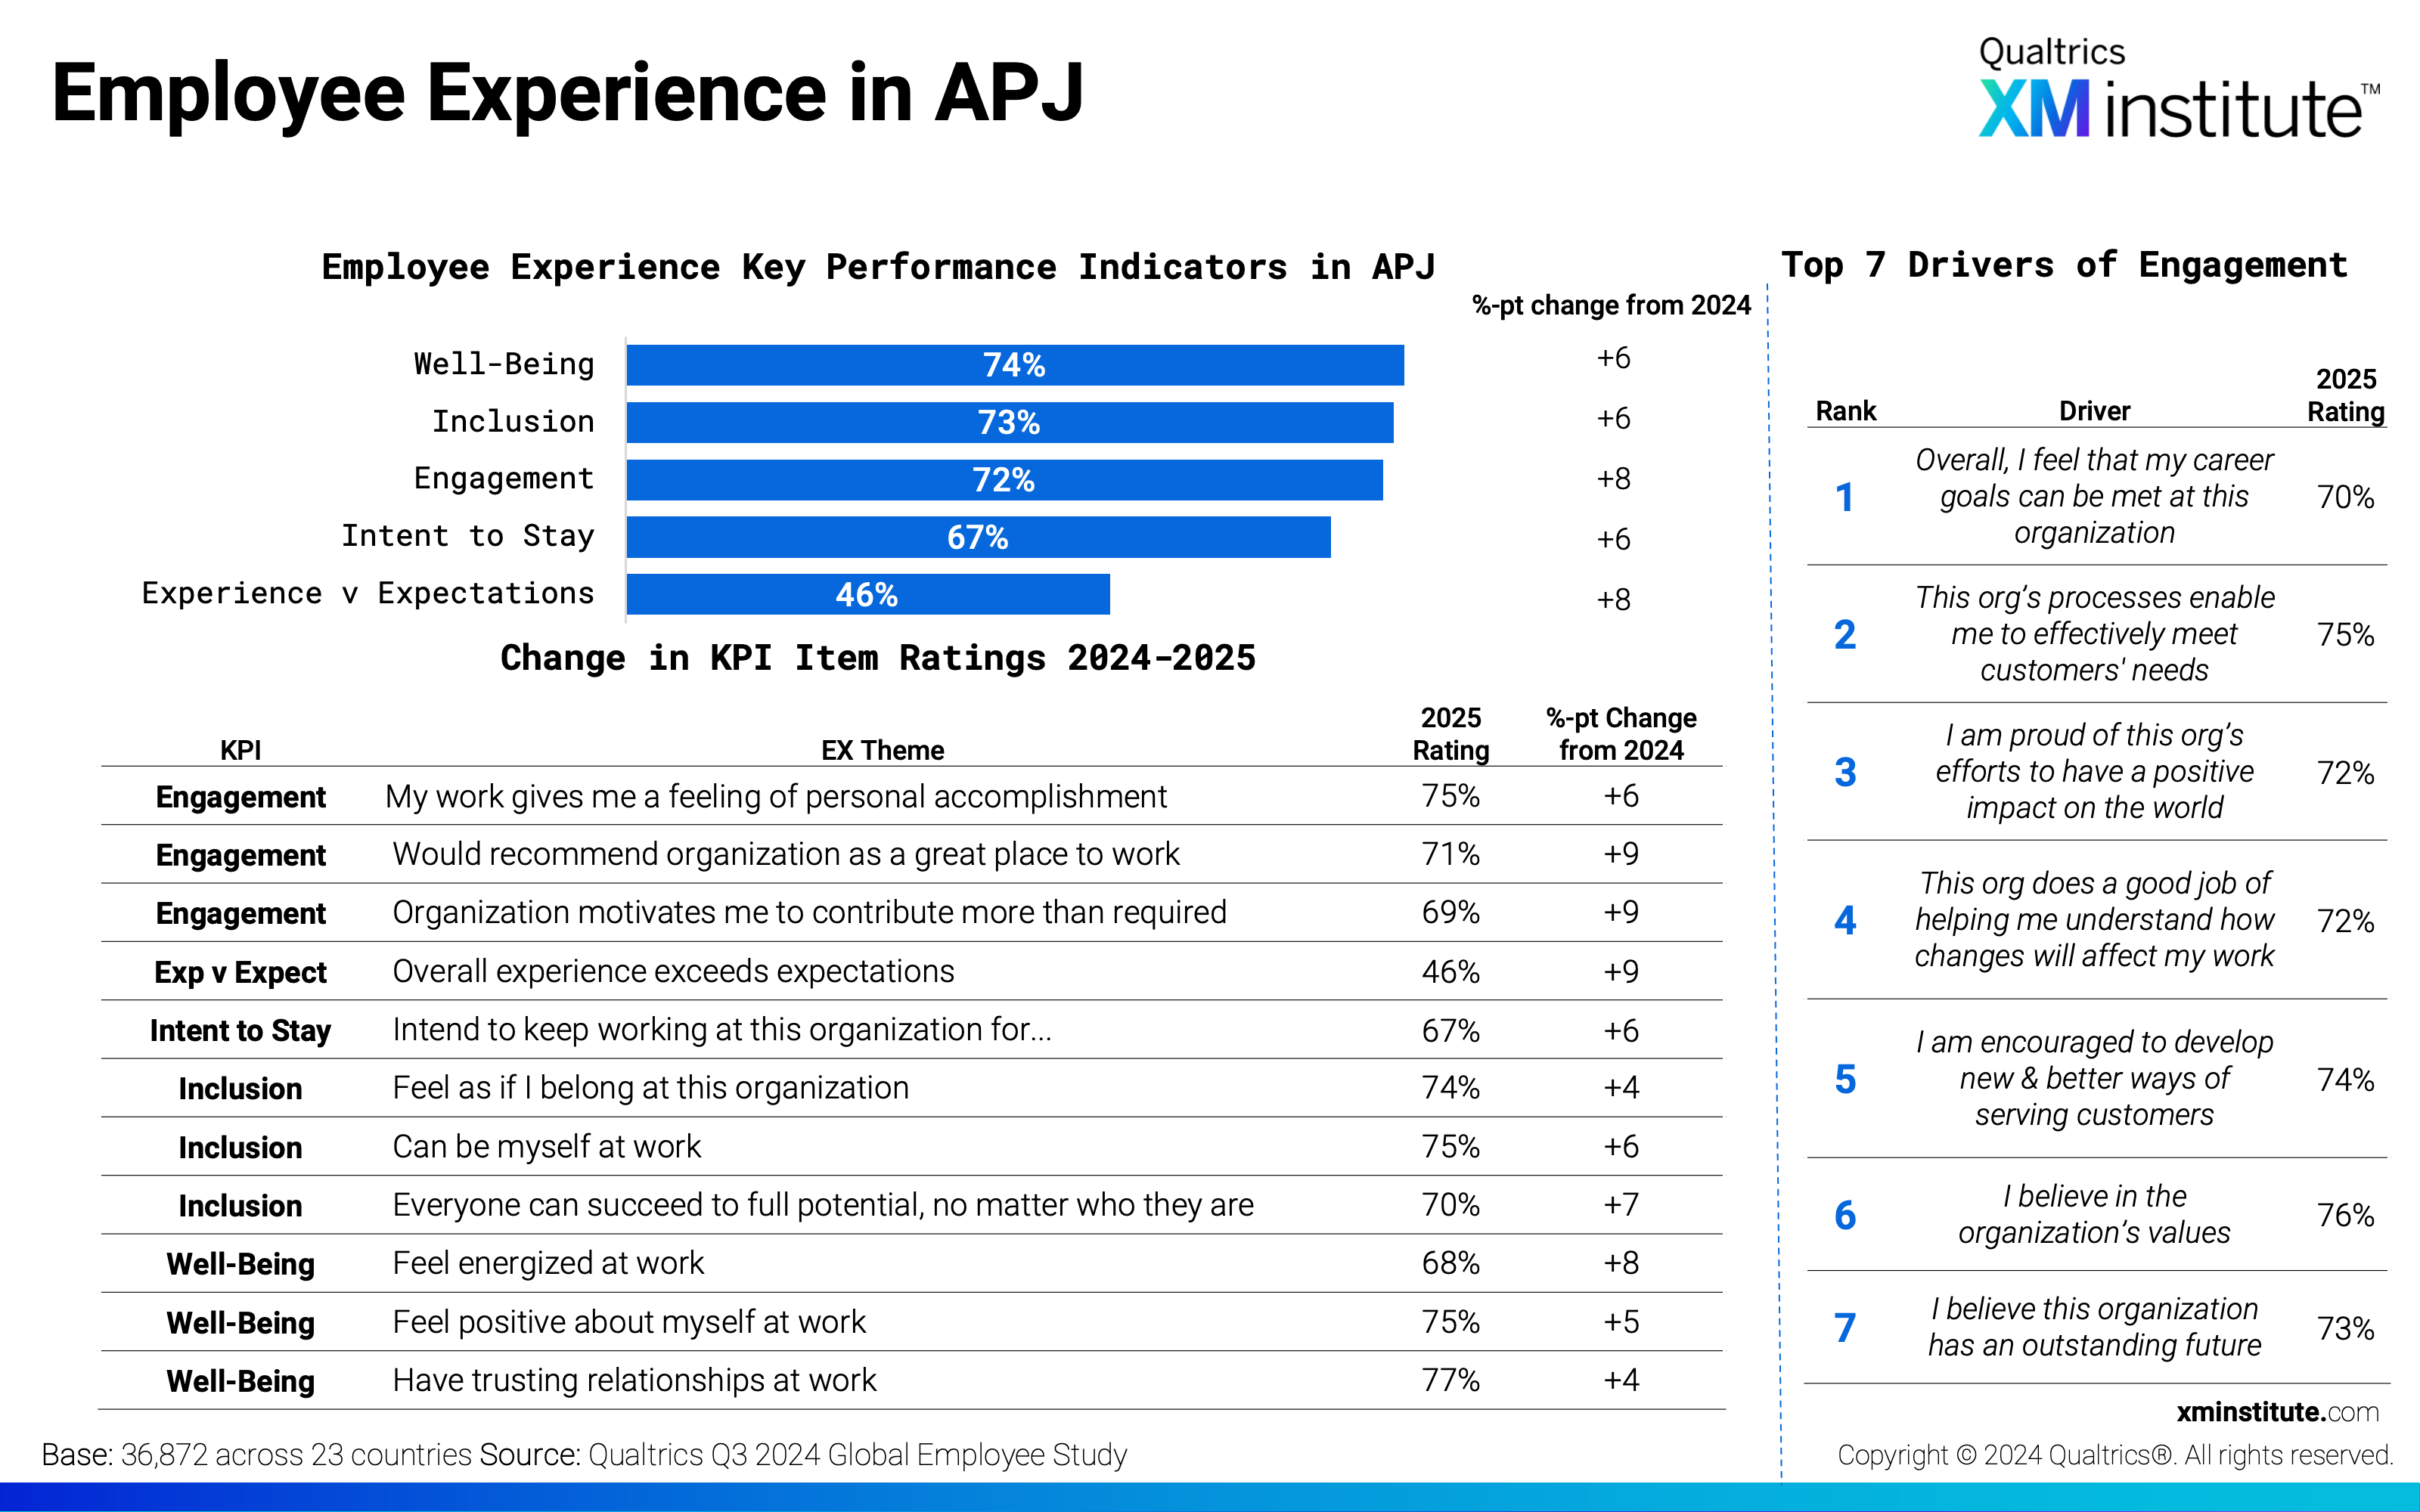
- Company pride is a top driver of engagement. I am proud of this organization’s efforts to have an impact on the world and I believe this company has an outstanding future are top drivers of engagement among employees in APJ. Customer focus is also a top driver; analysis shows that this organization’s processes enable me to effectively meet my customers’ needs is the second-strongest driver in APJ, and rates at 75% favorable.
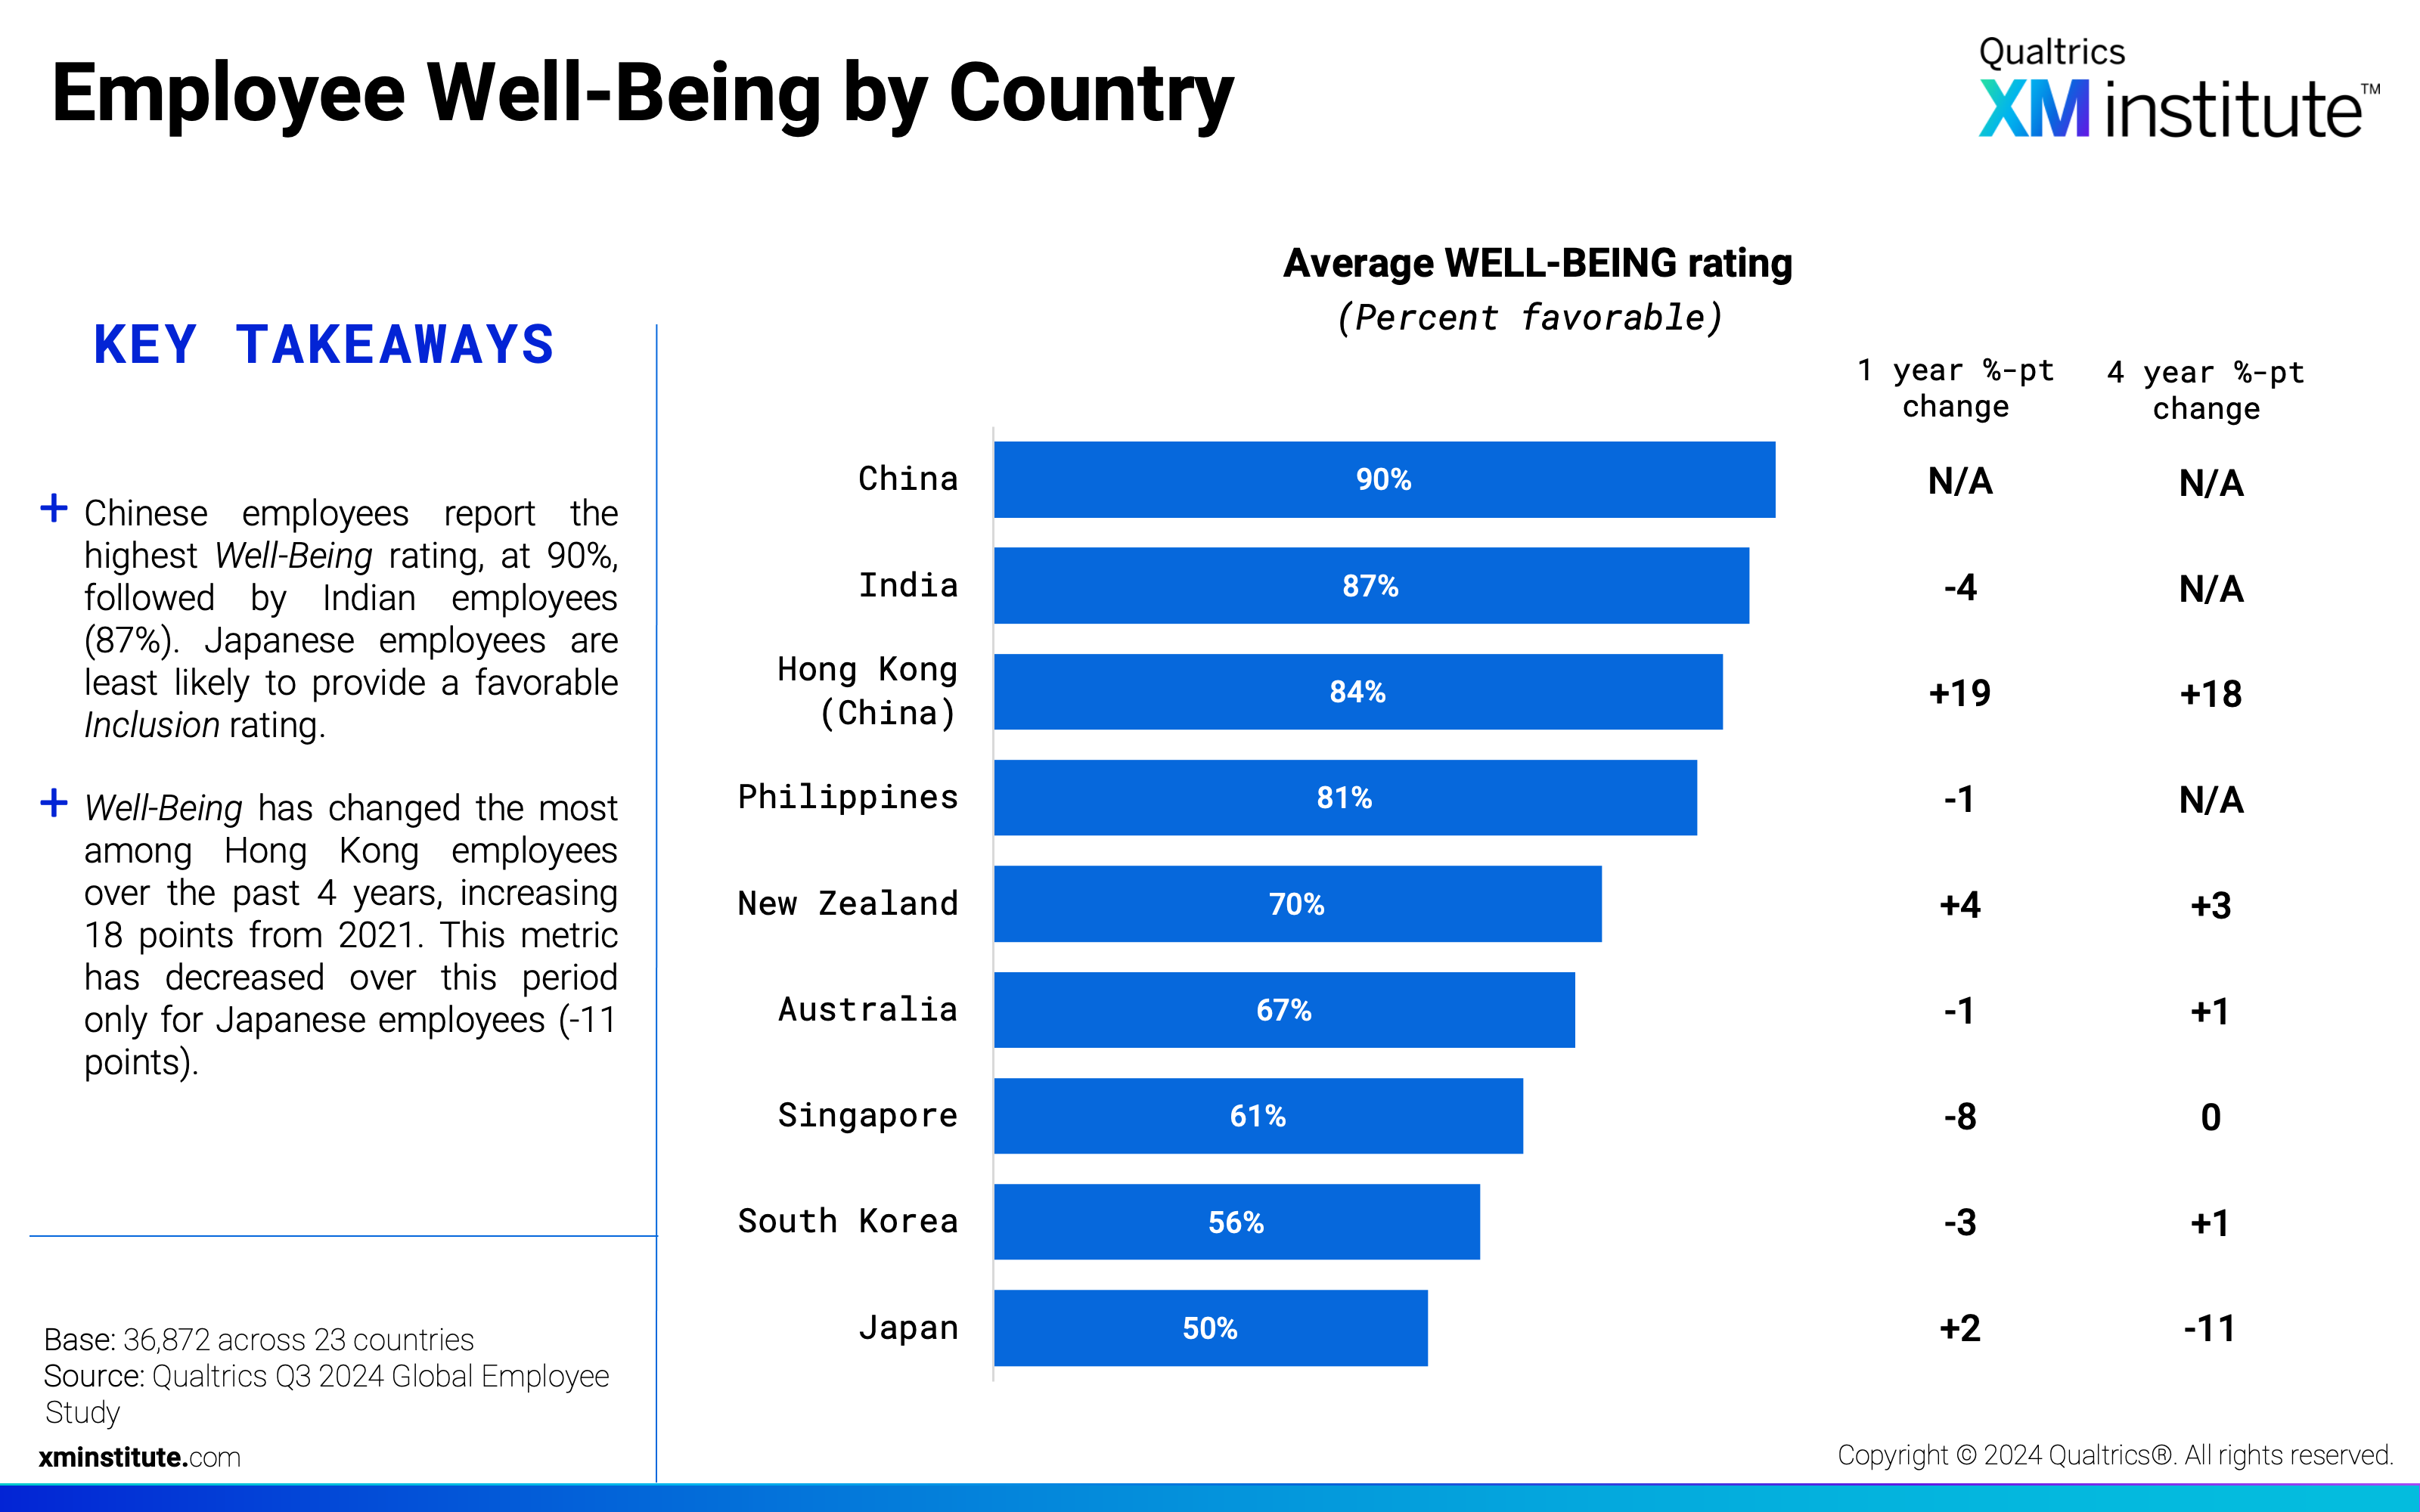
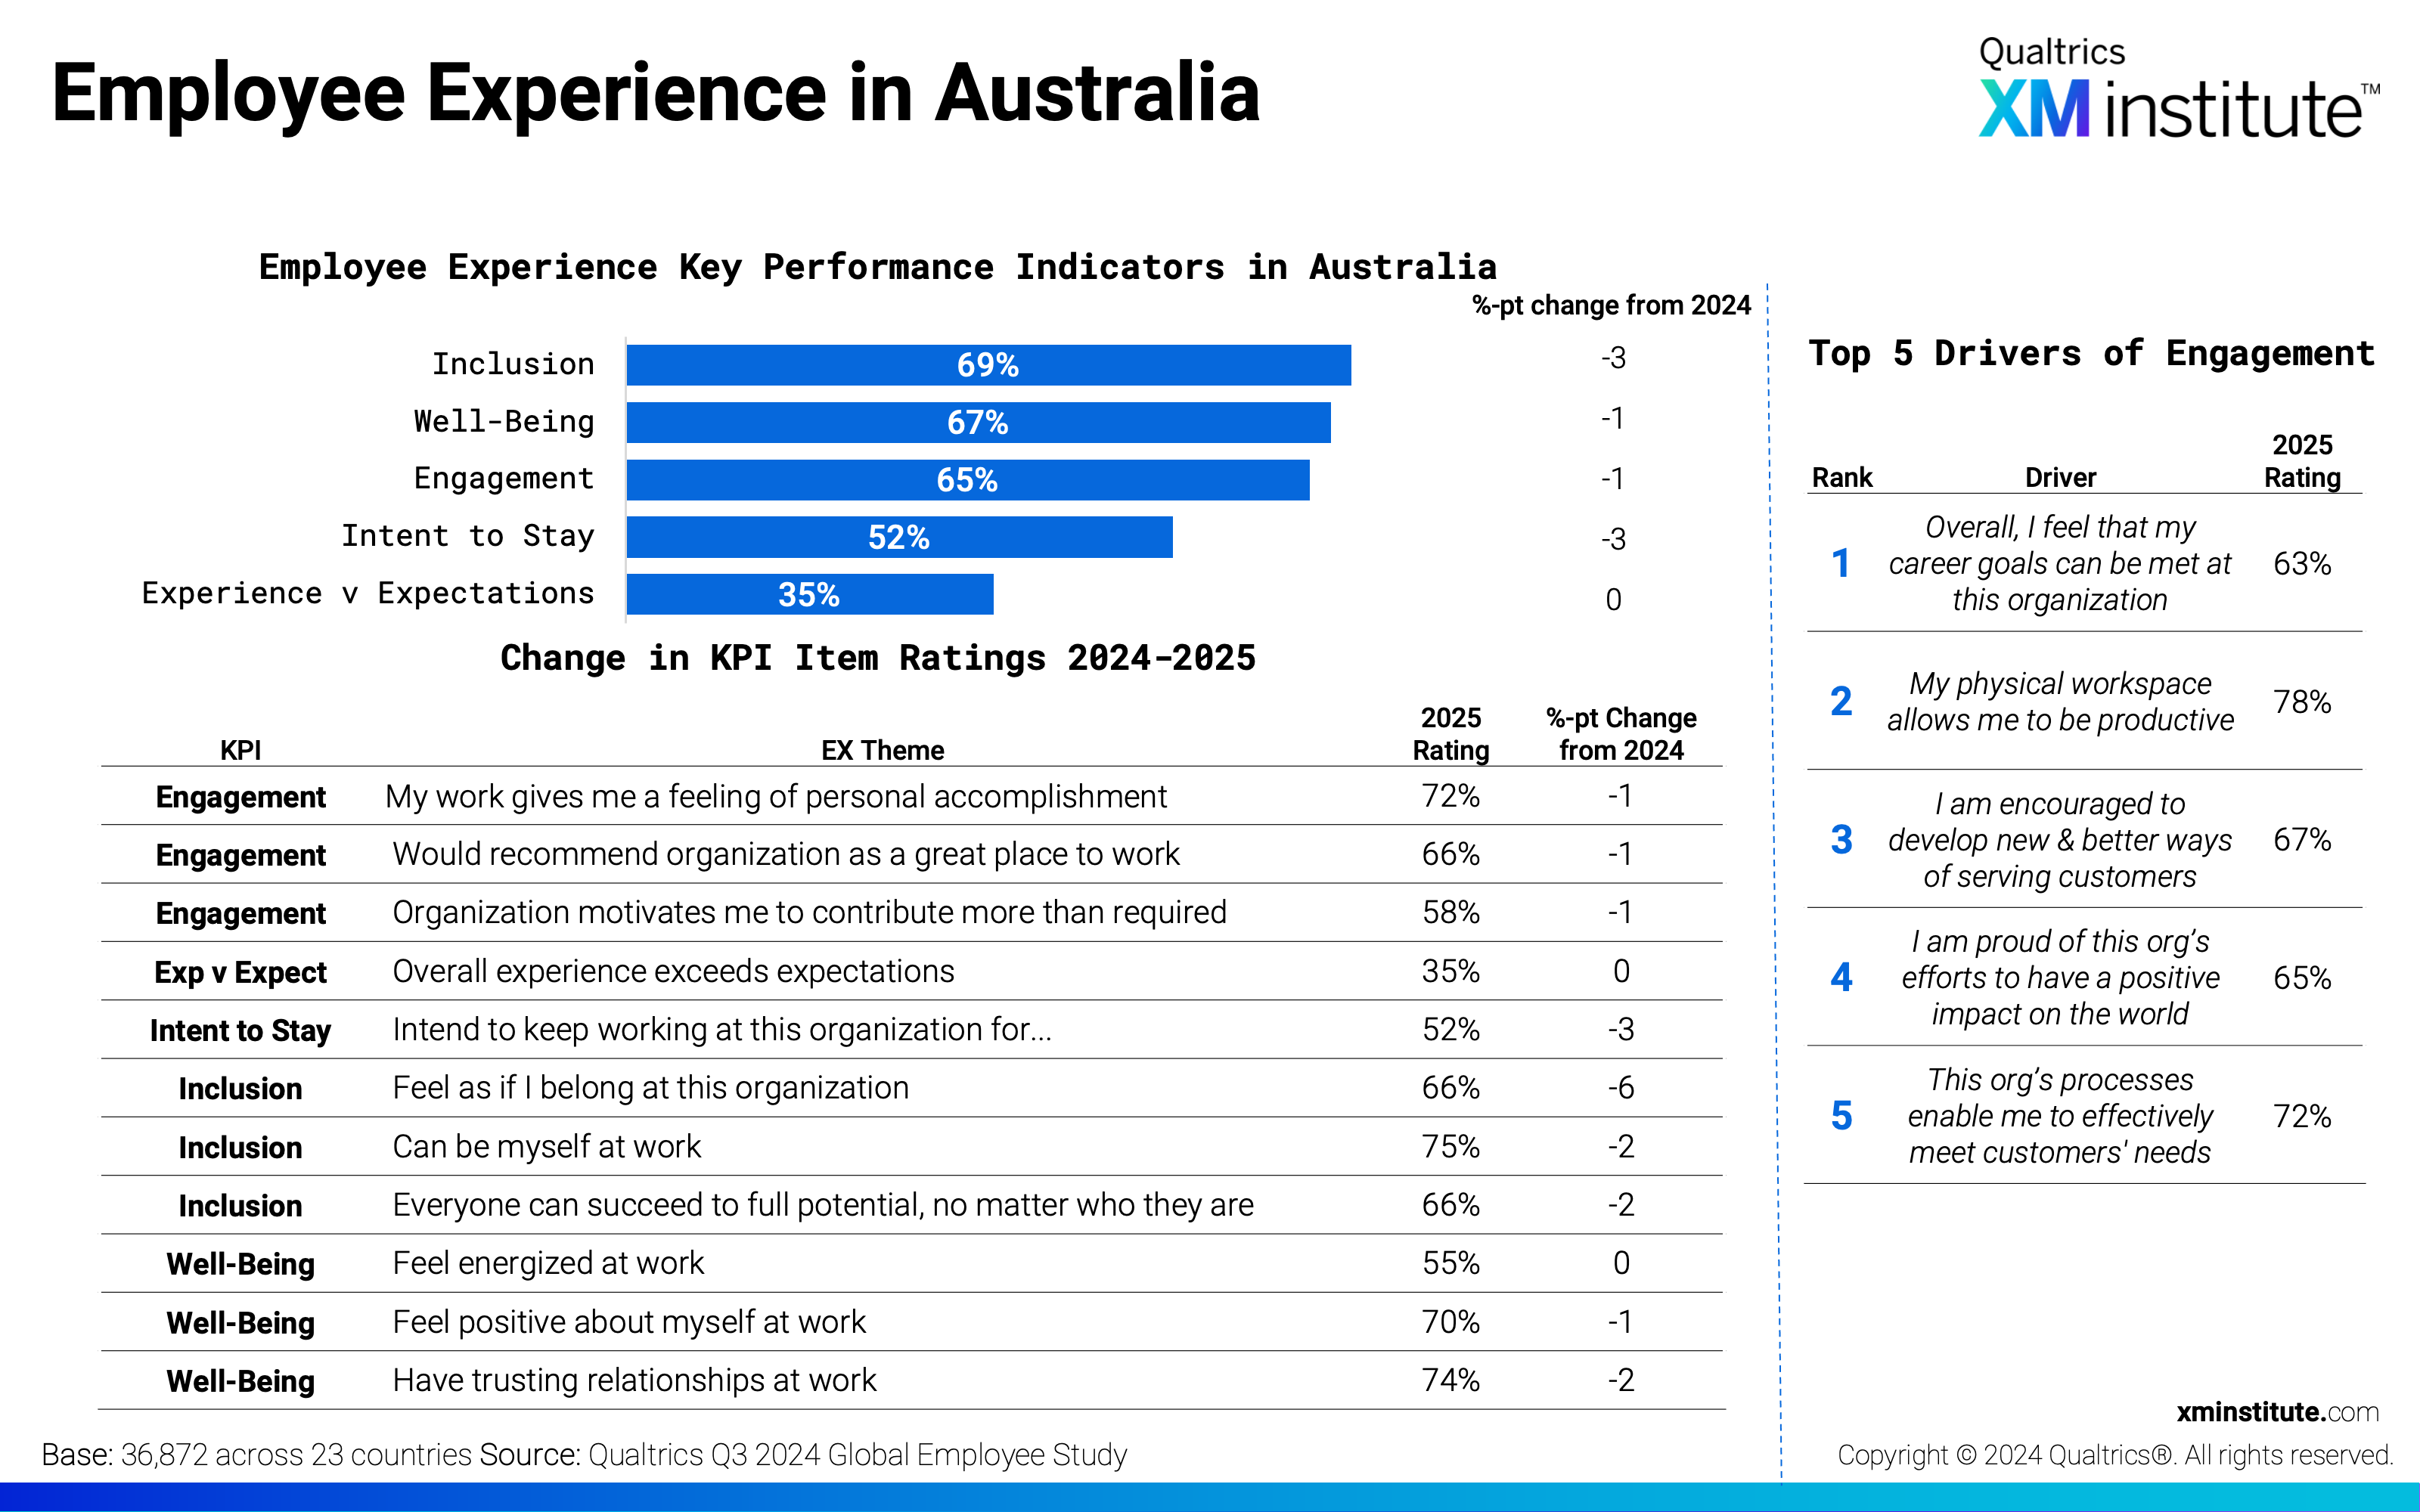
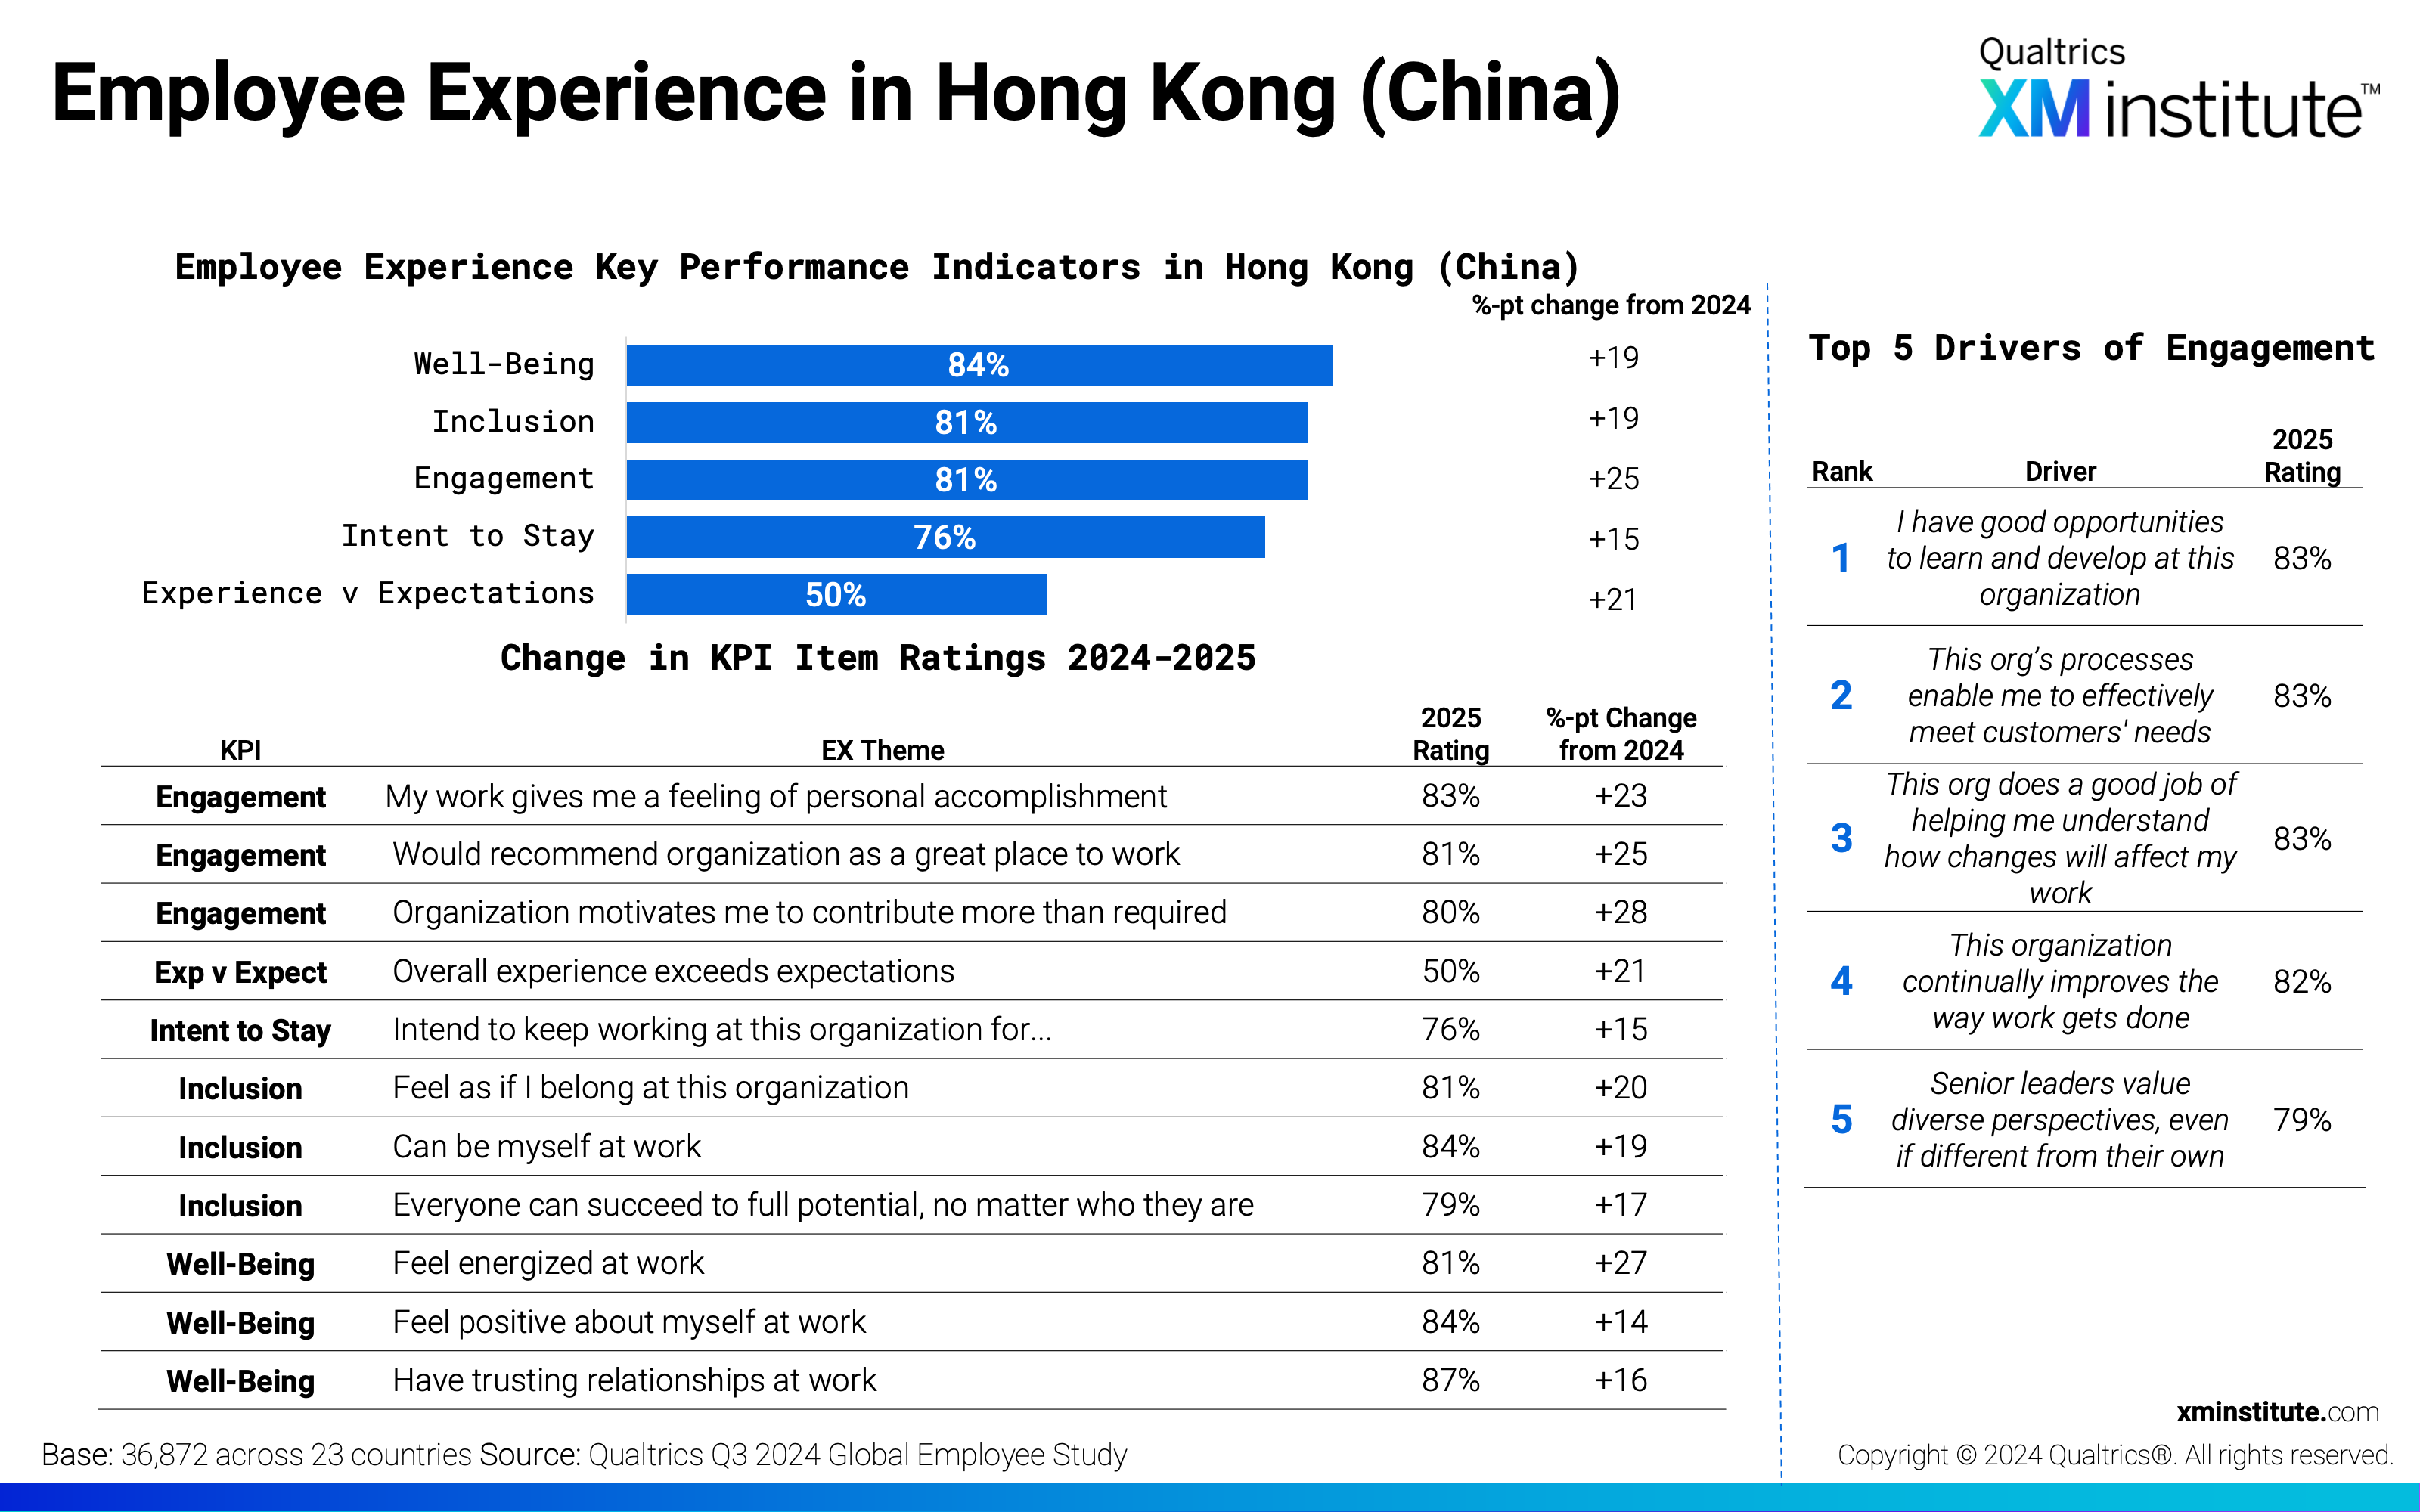
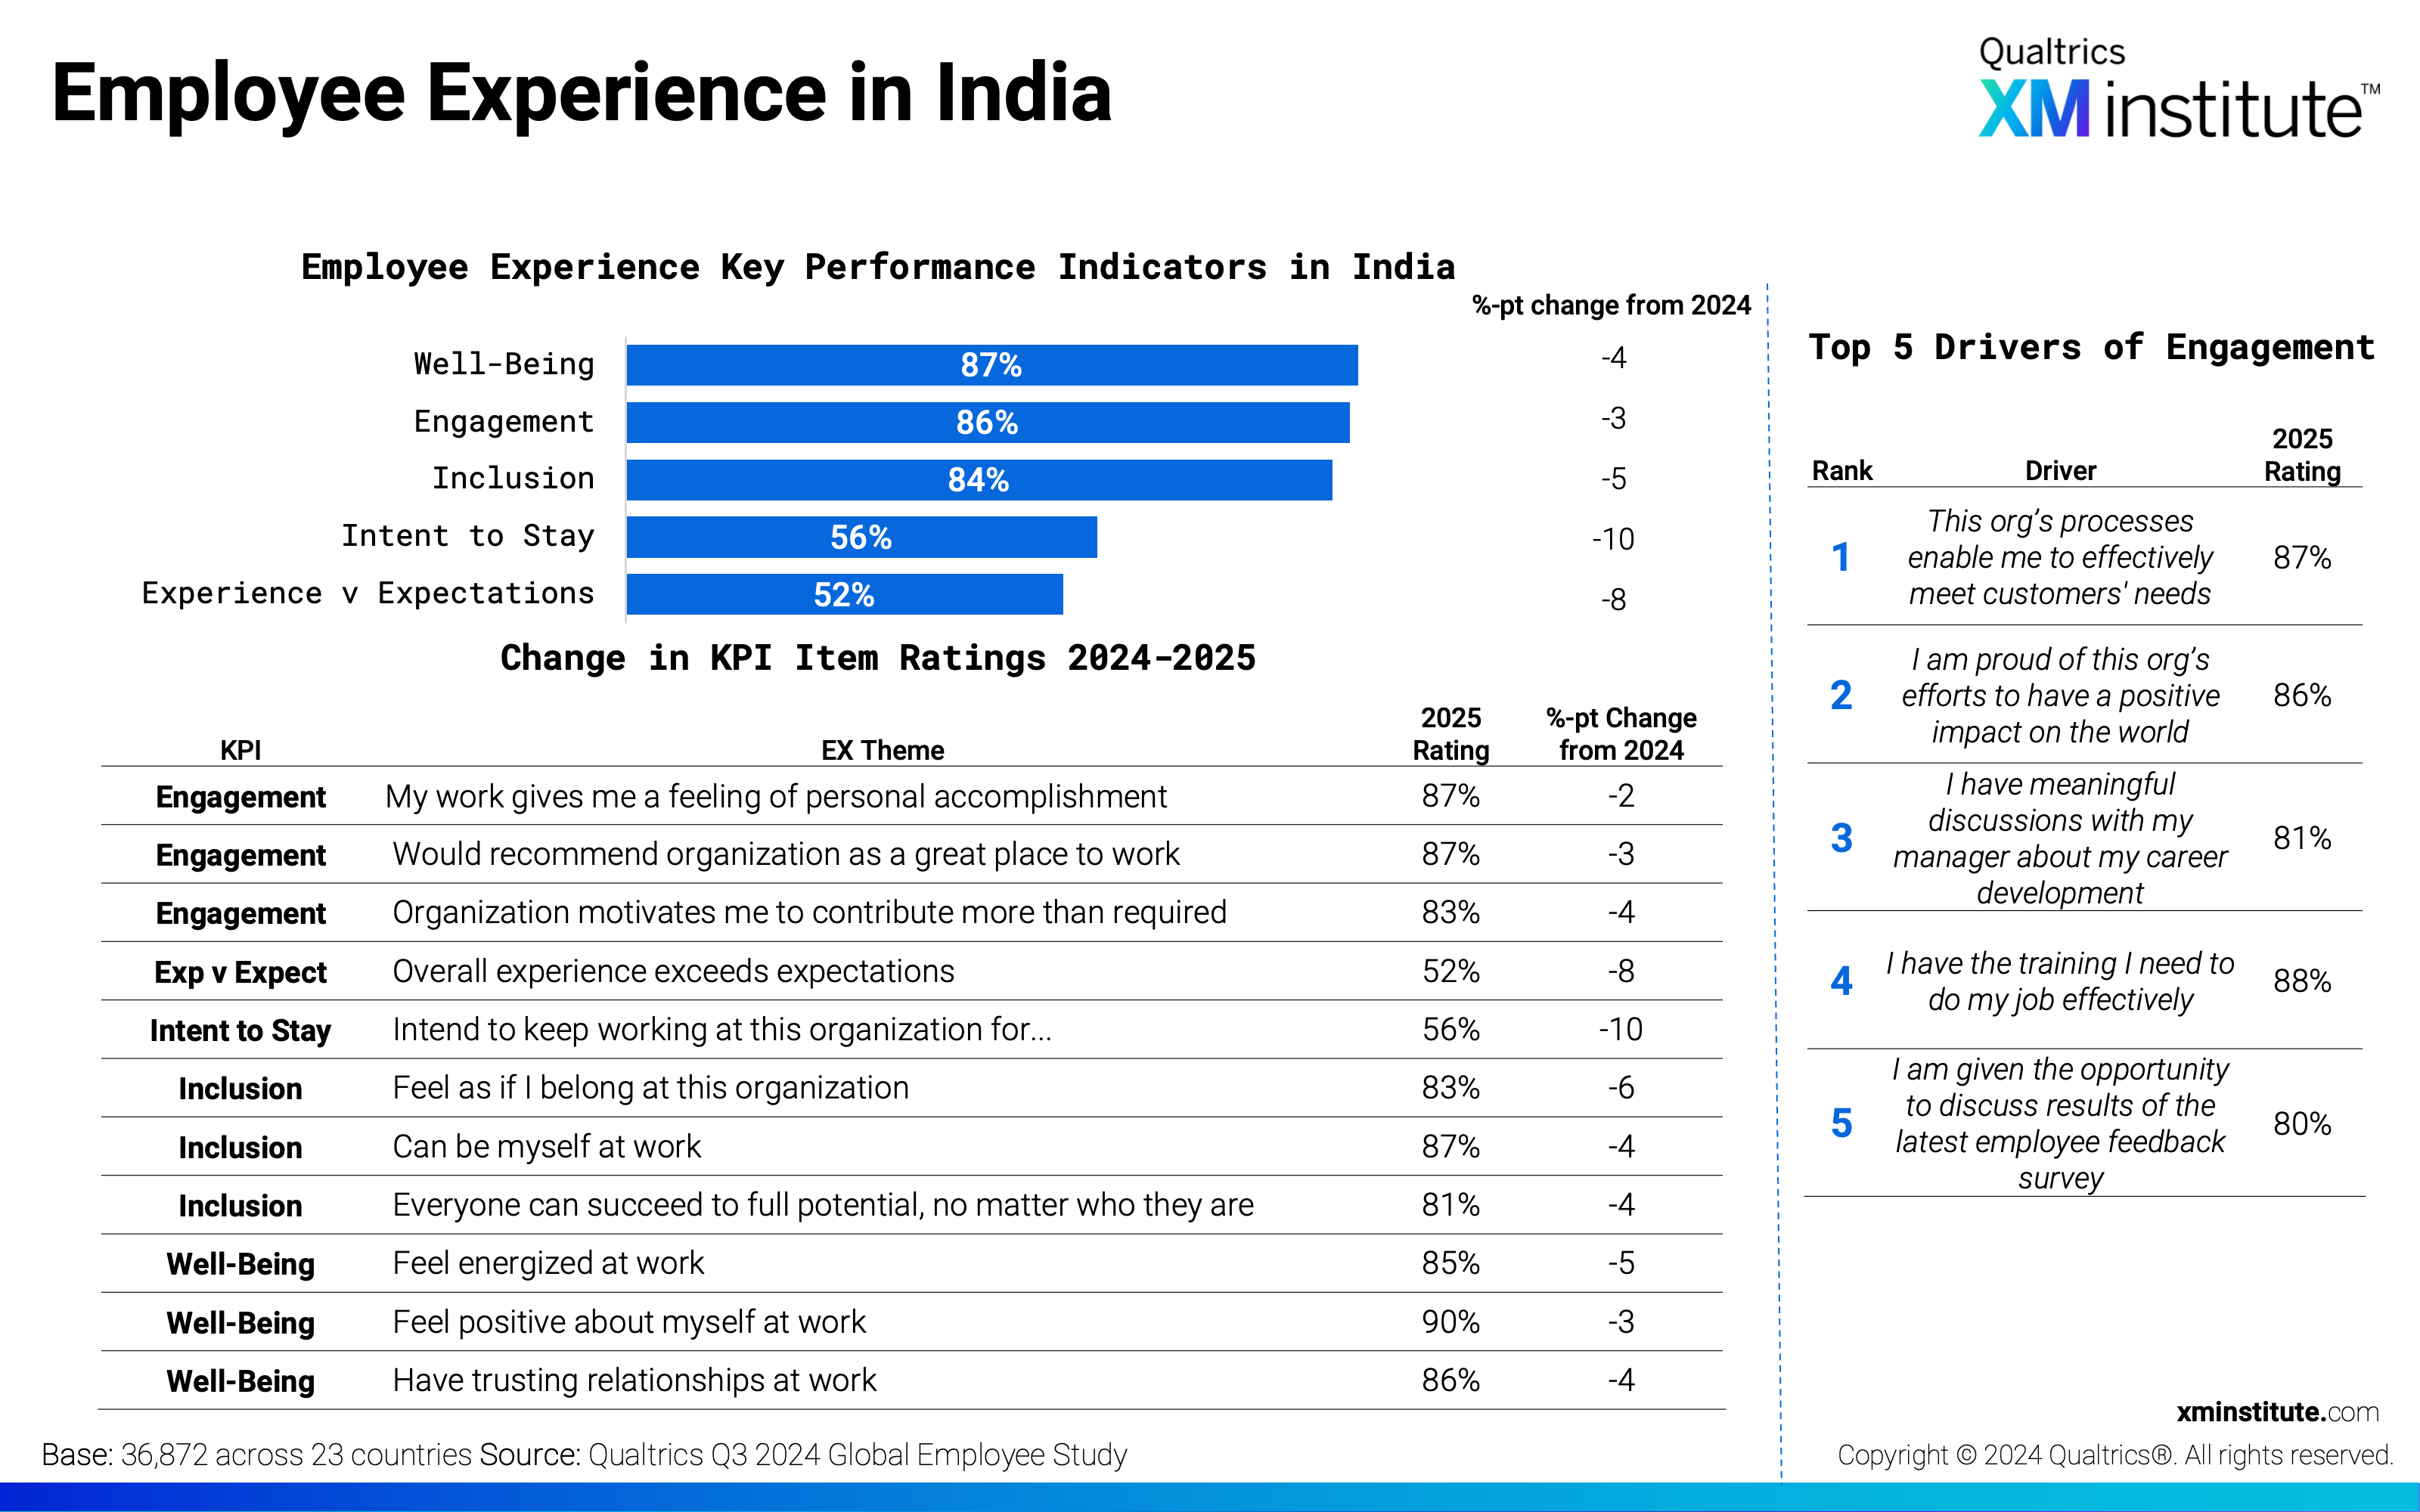
- Hong Kong (China) scores significantly higher than in 2024. Compared to the ratings employees provided in 2024, KPI scores among Hong Kong employees in 2025 have increased by a minimum of 19 points. All 2025 KPI scores in Australia, India, the Philippines, and Singapore have either dropped or remain unchanged from 2024.
Figures
Here are the figures in this Data Snapshot:
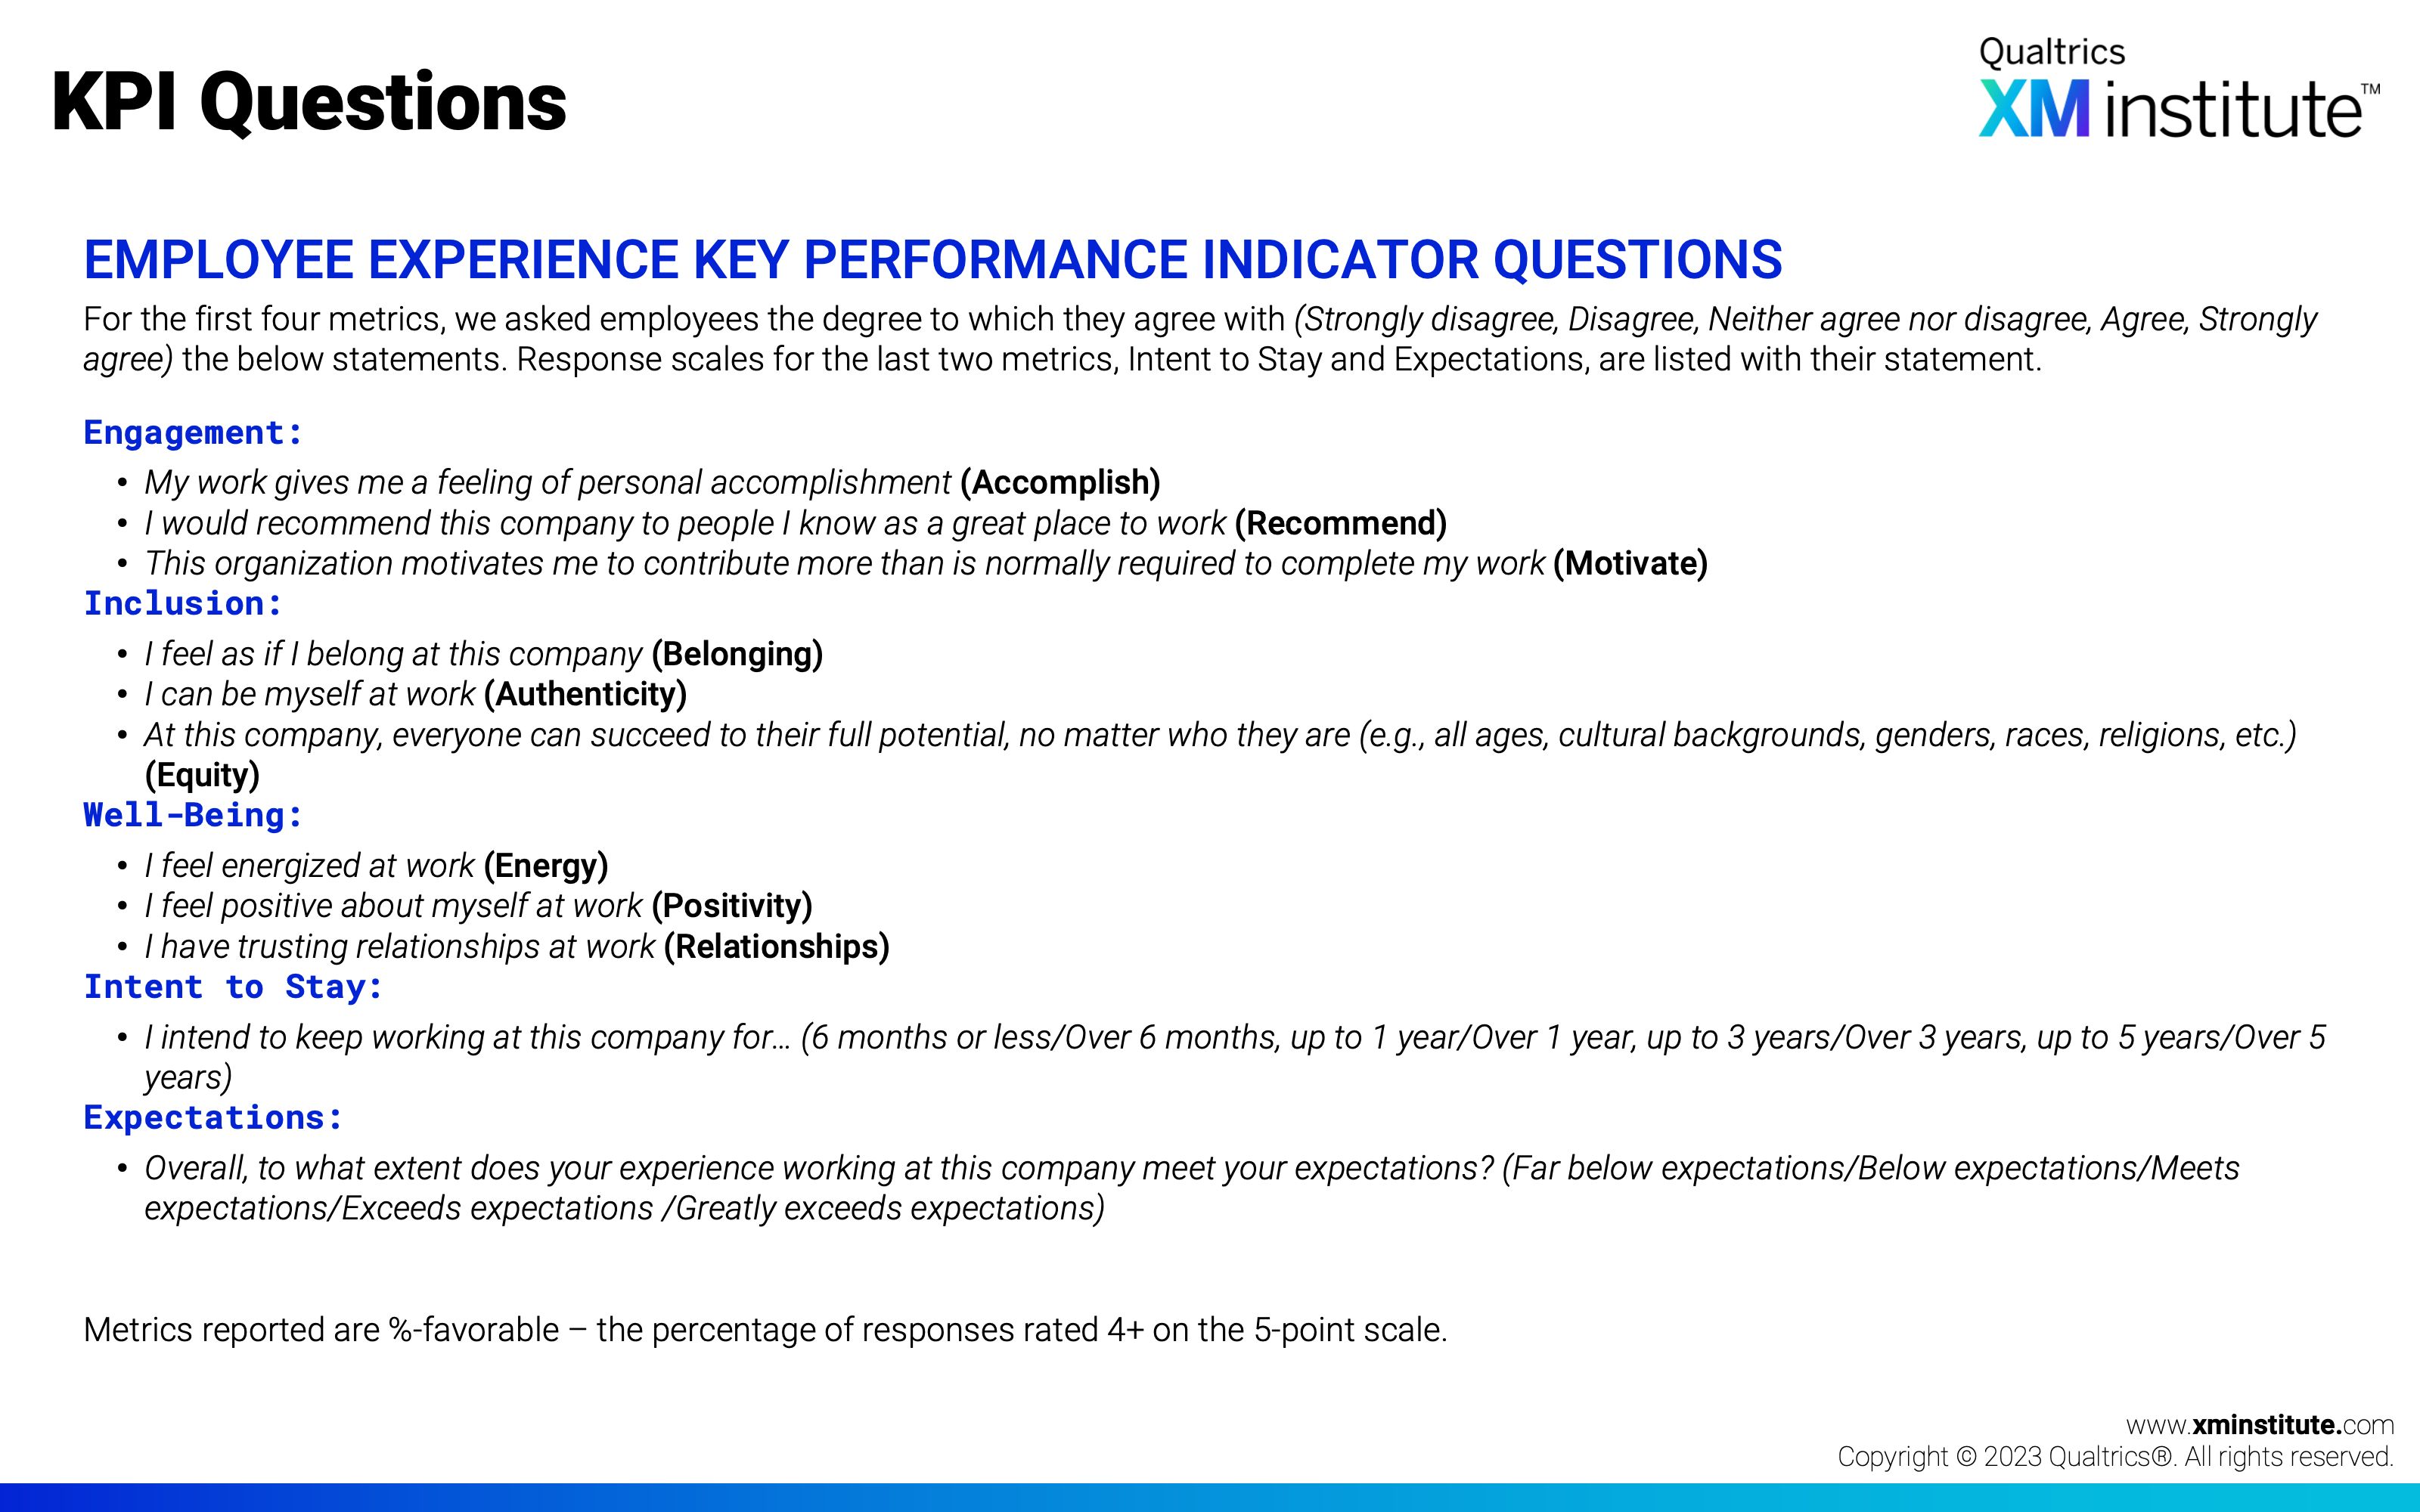
- KPI Questions (see Figure 1)
- Employee Experience Globally (see Figure 2)
- Employee Engagement by Country (see Figure 3)
- Employee Well-Being by Country (see Figure 4)
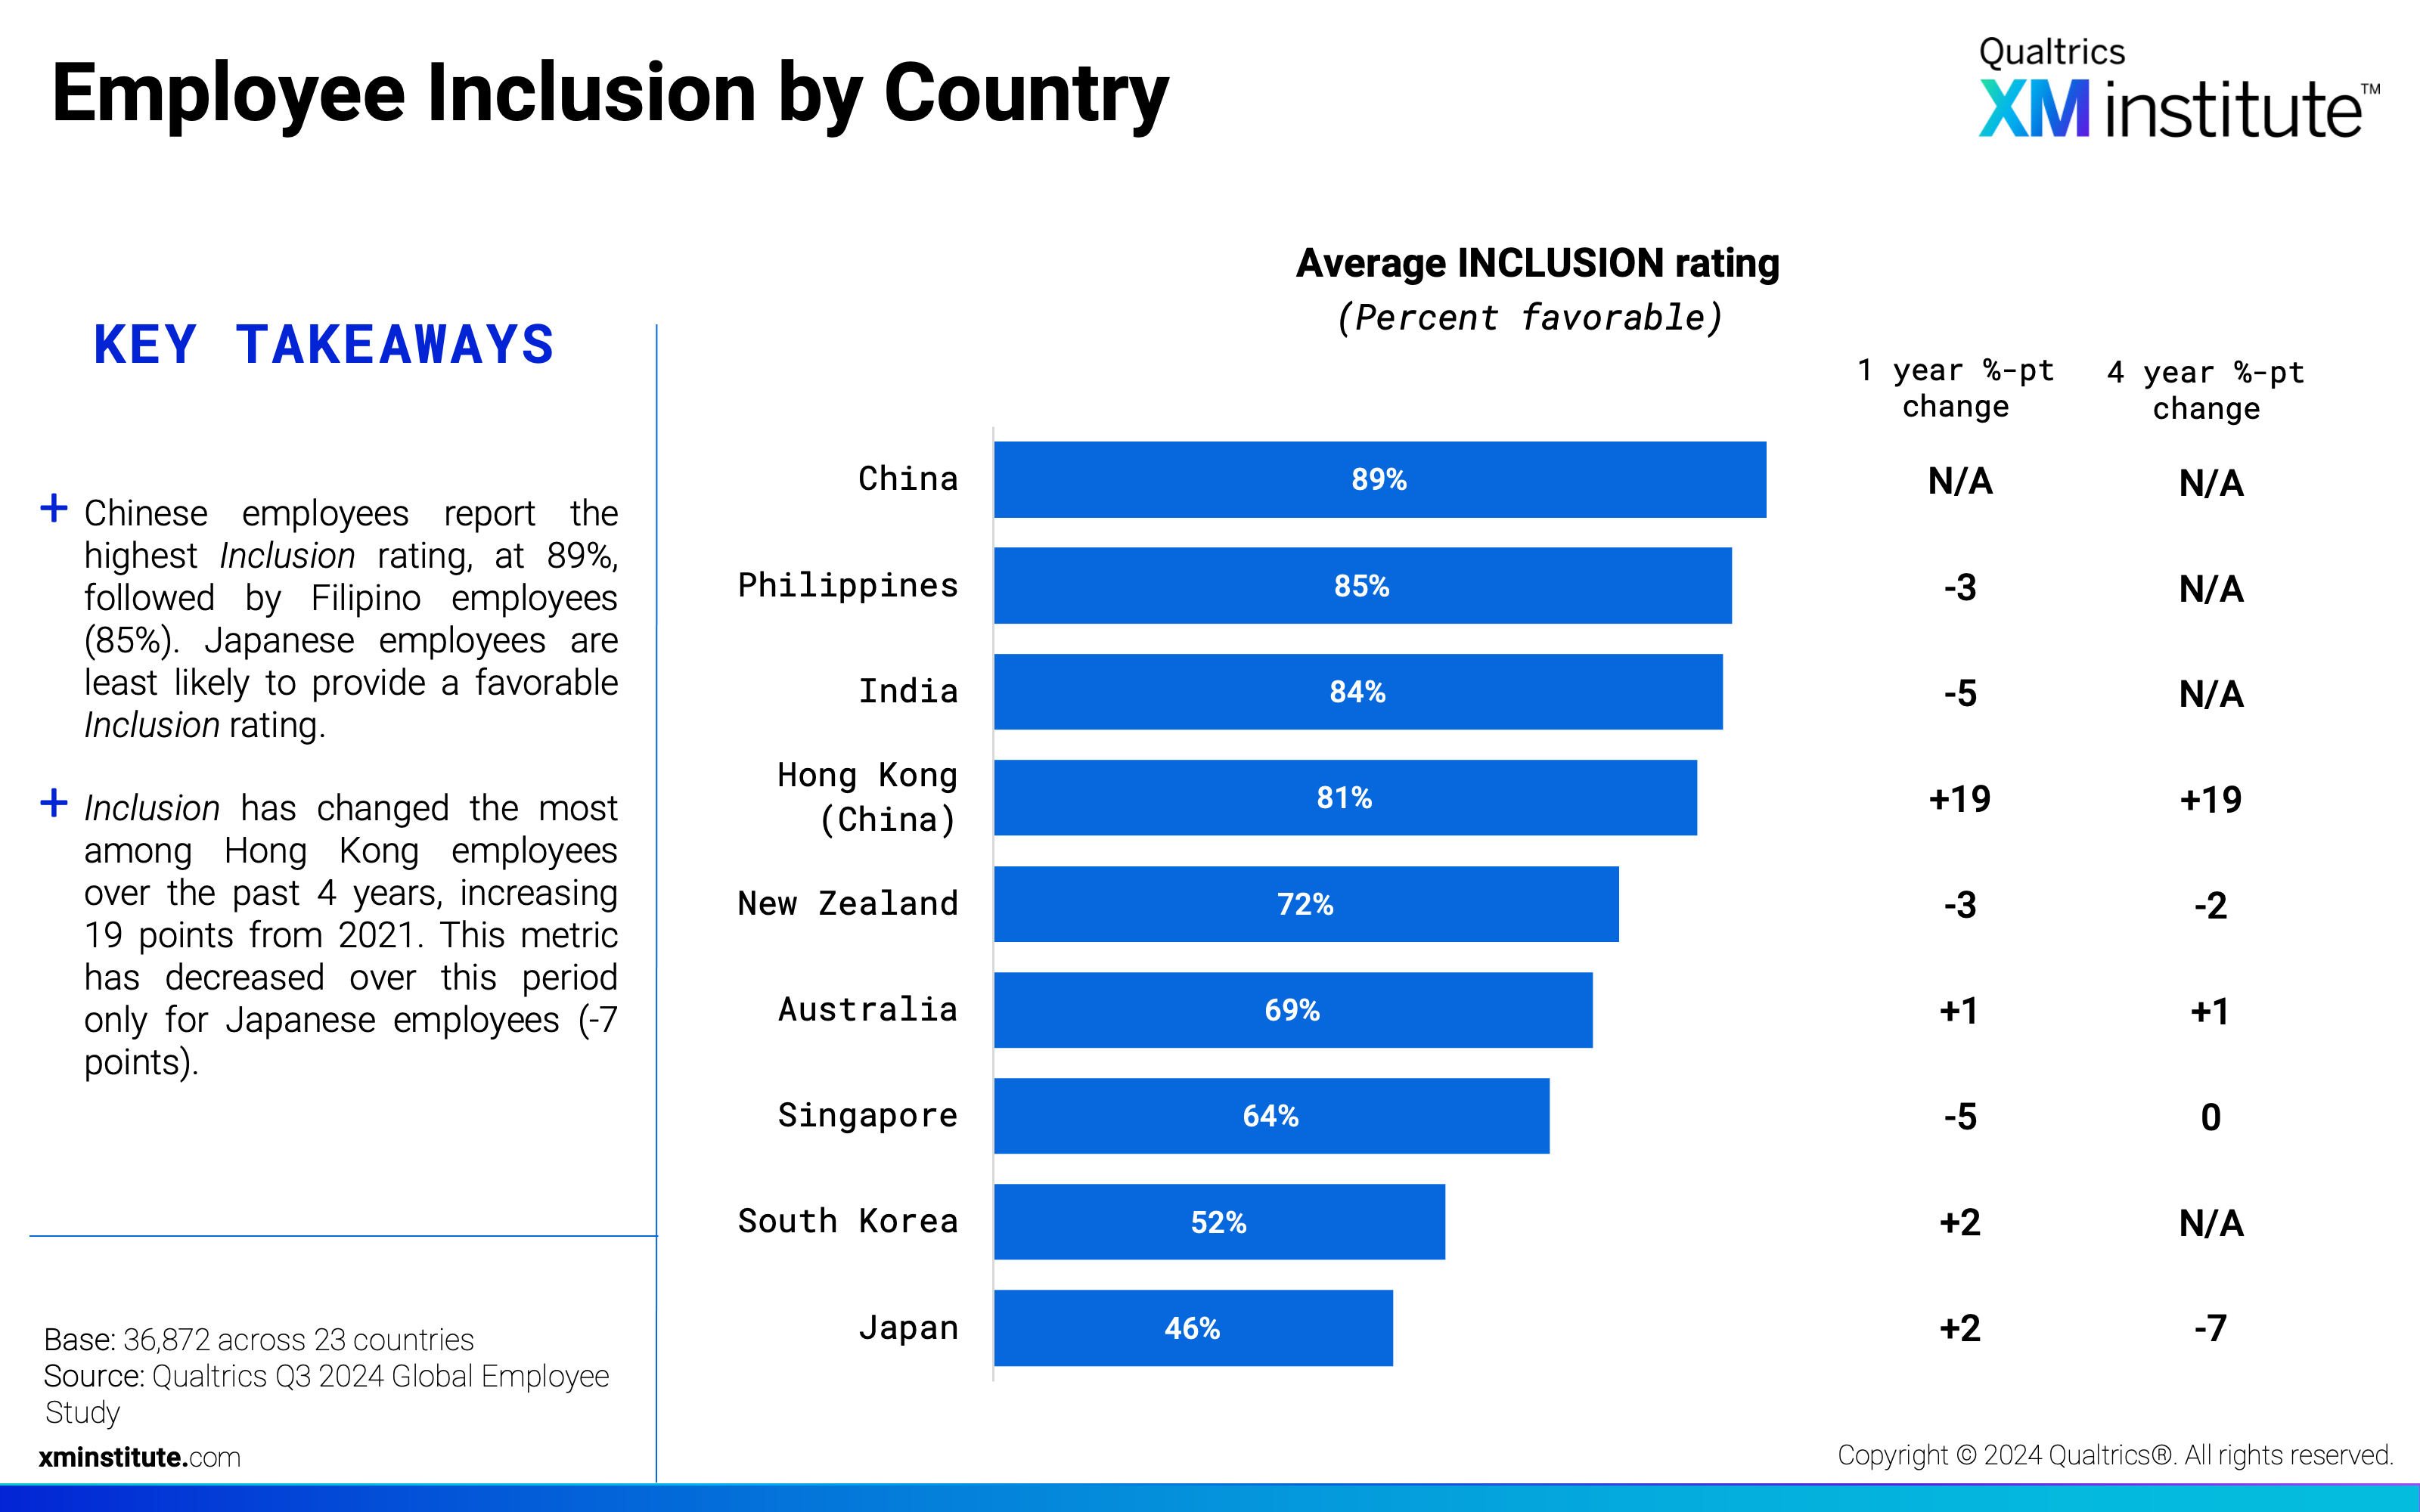
- Employee Inclusion by Country (see Figure 5)
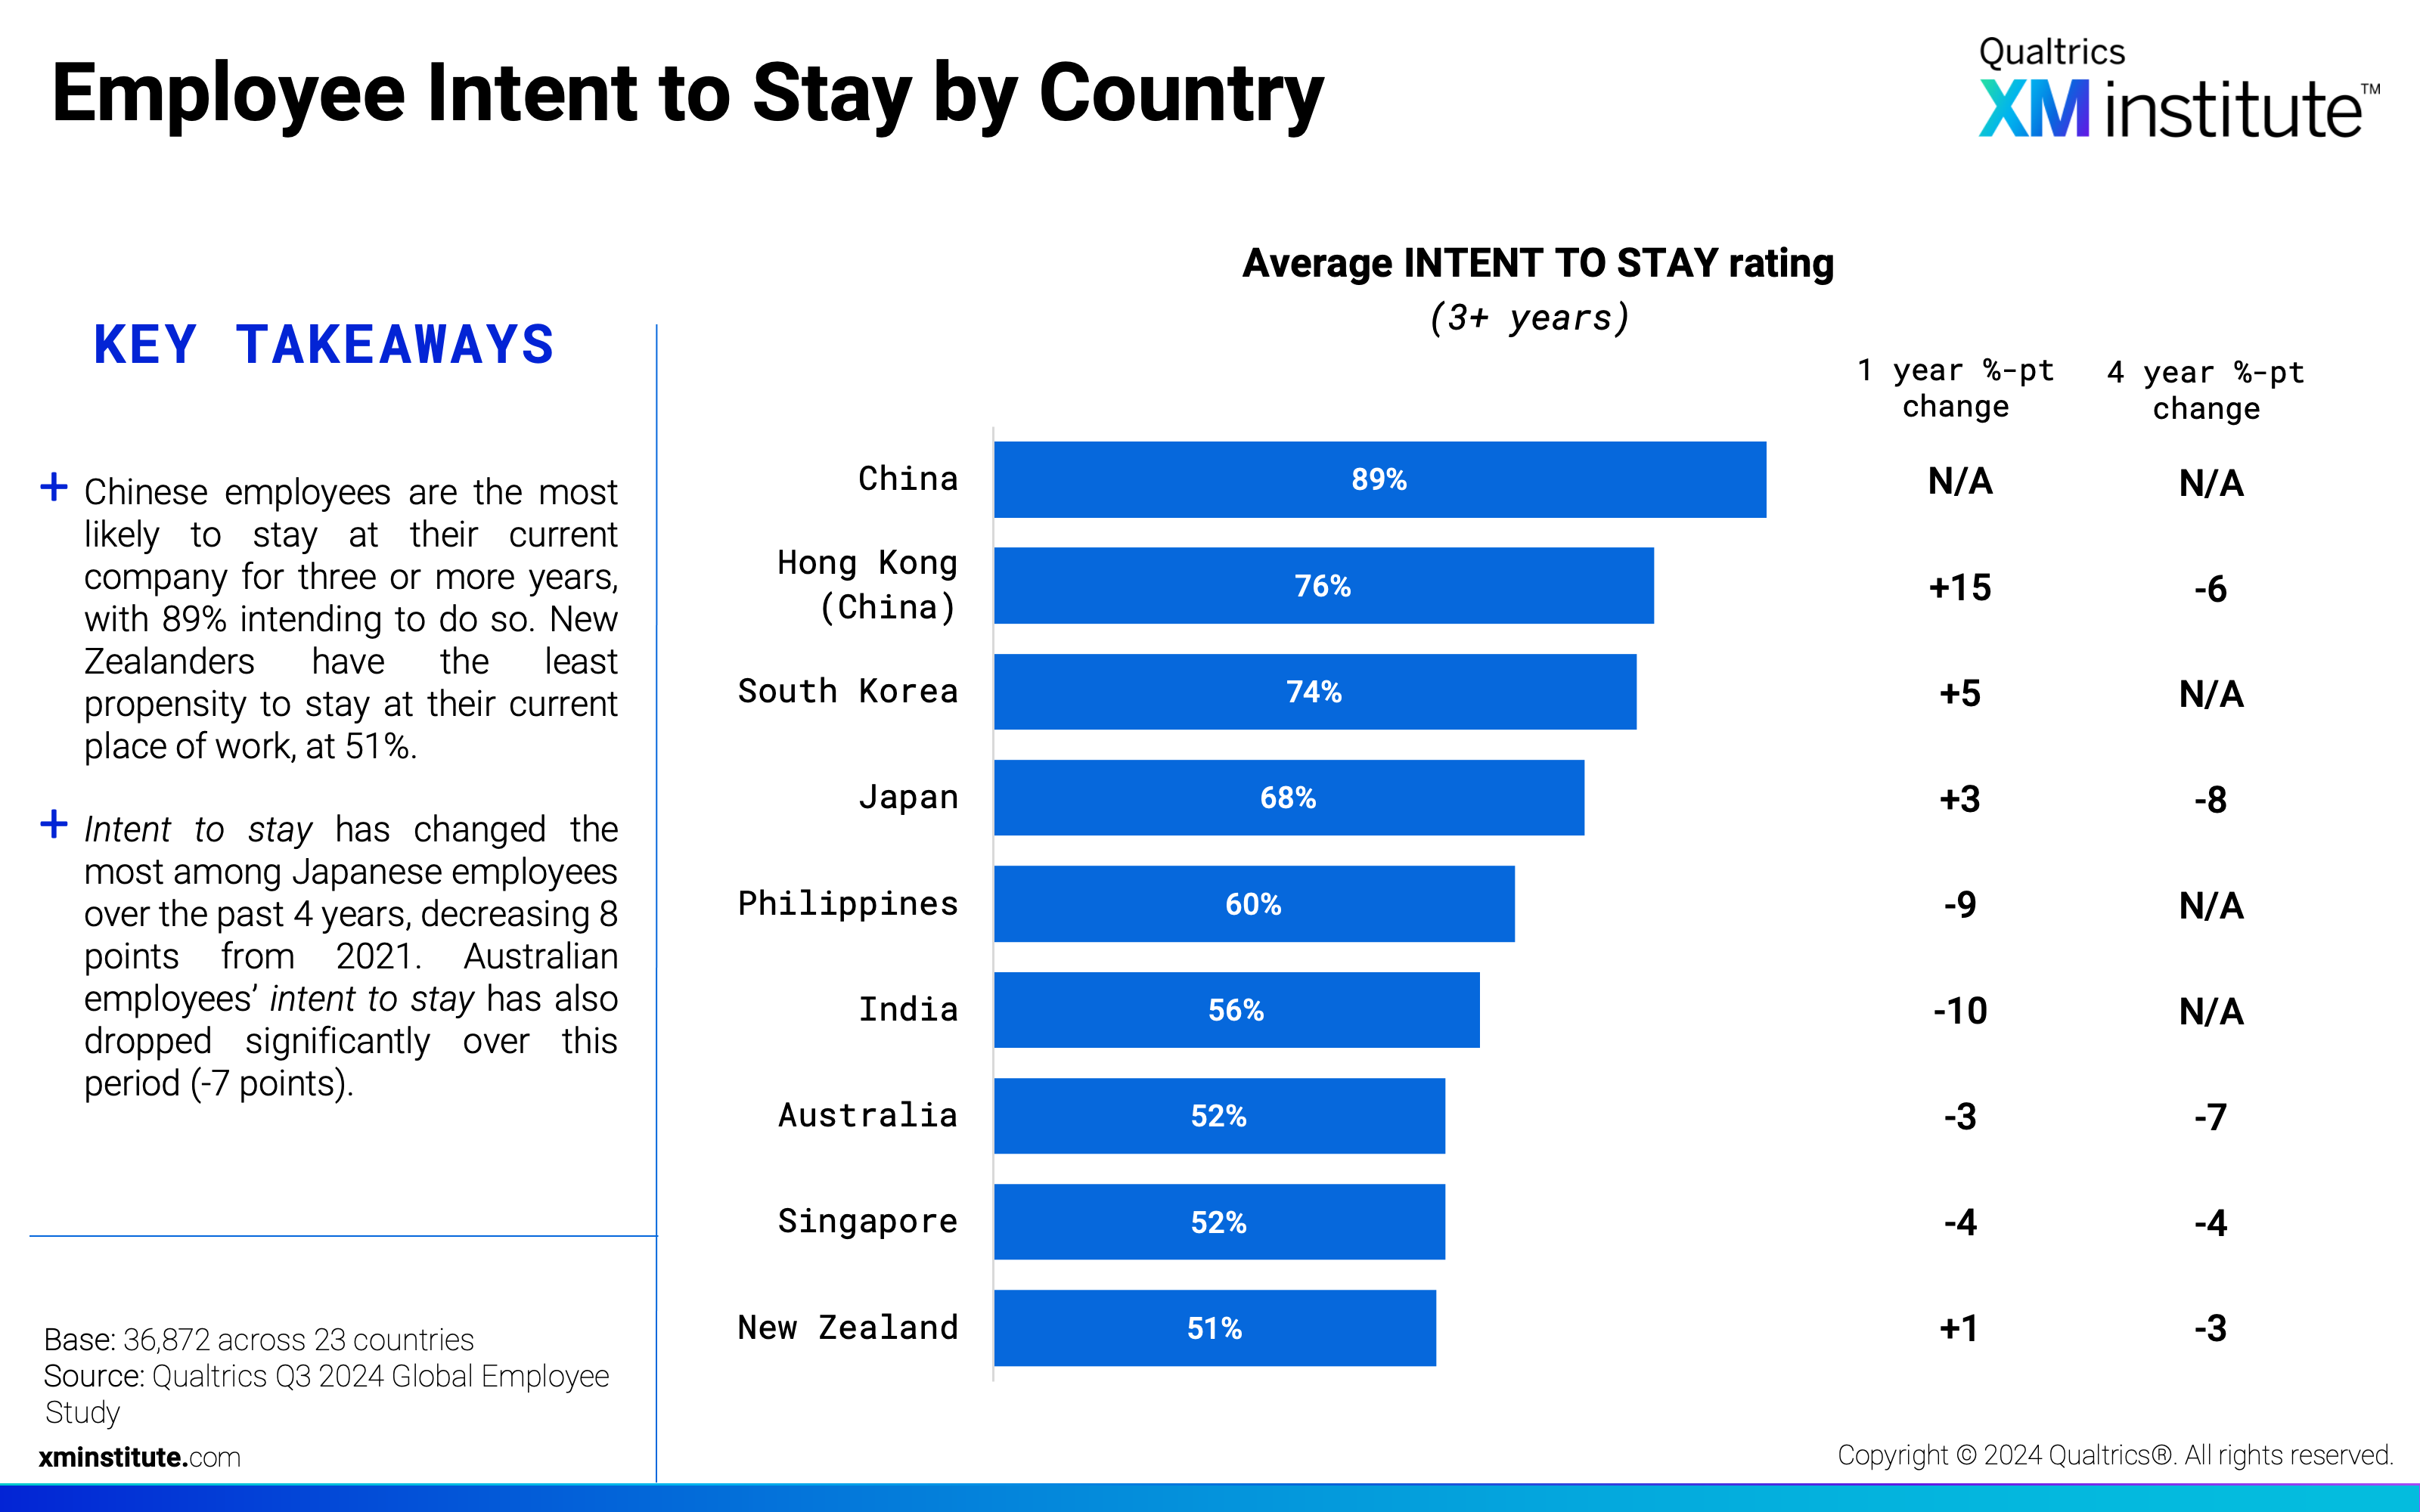
- Employee Intent to Stay by Country (see Figure 6)
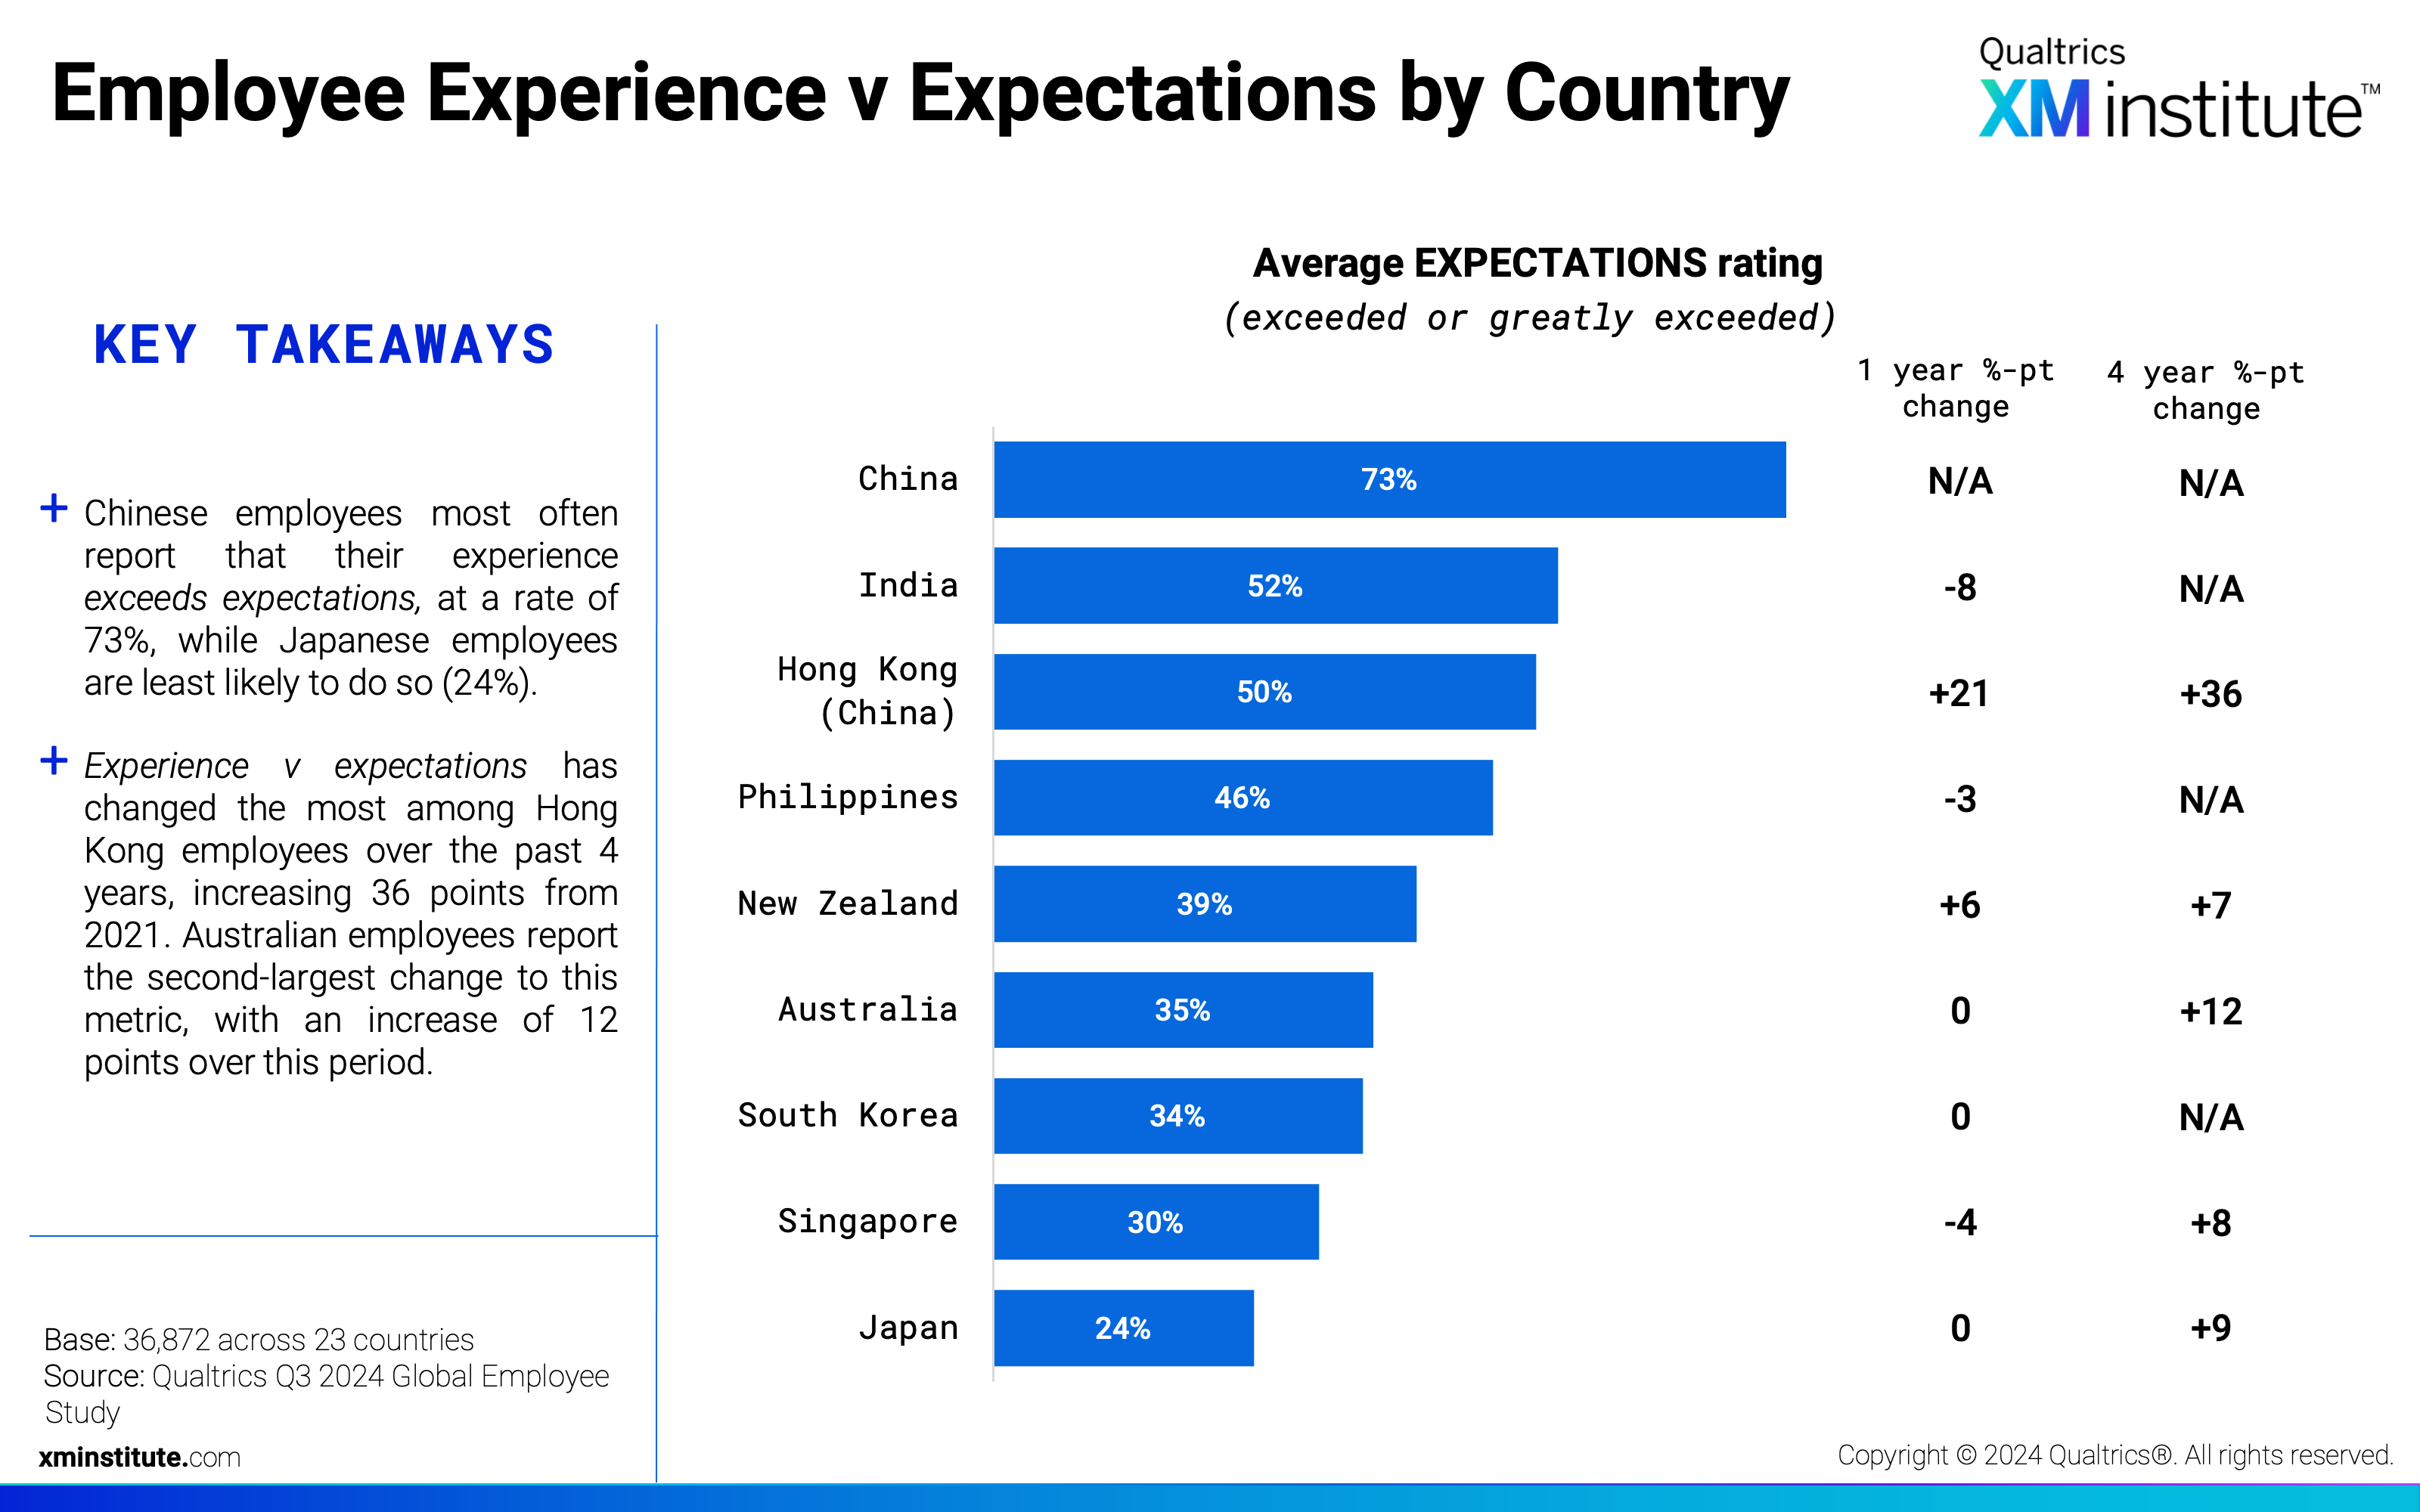
- Employee Experience v Expectations by Country (see Figure 7)
- Employee Experience in APJ (see Figure 8)
- Employee Experience in Australia (see Figure 9)
- Employee Experience in China (see Figure 10)
- Employee Experience in Hong Kong (China) (see Figure 11)
- Employee Experience in India (see Figure 12)
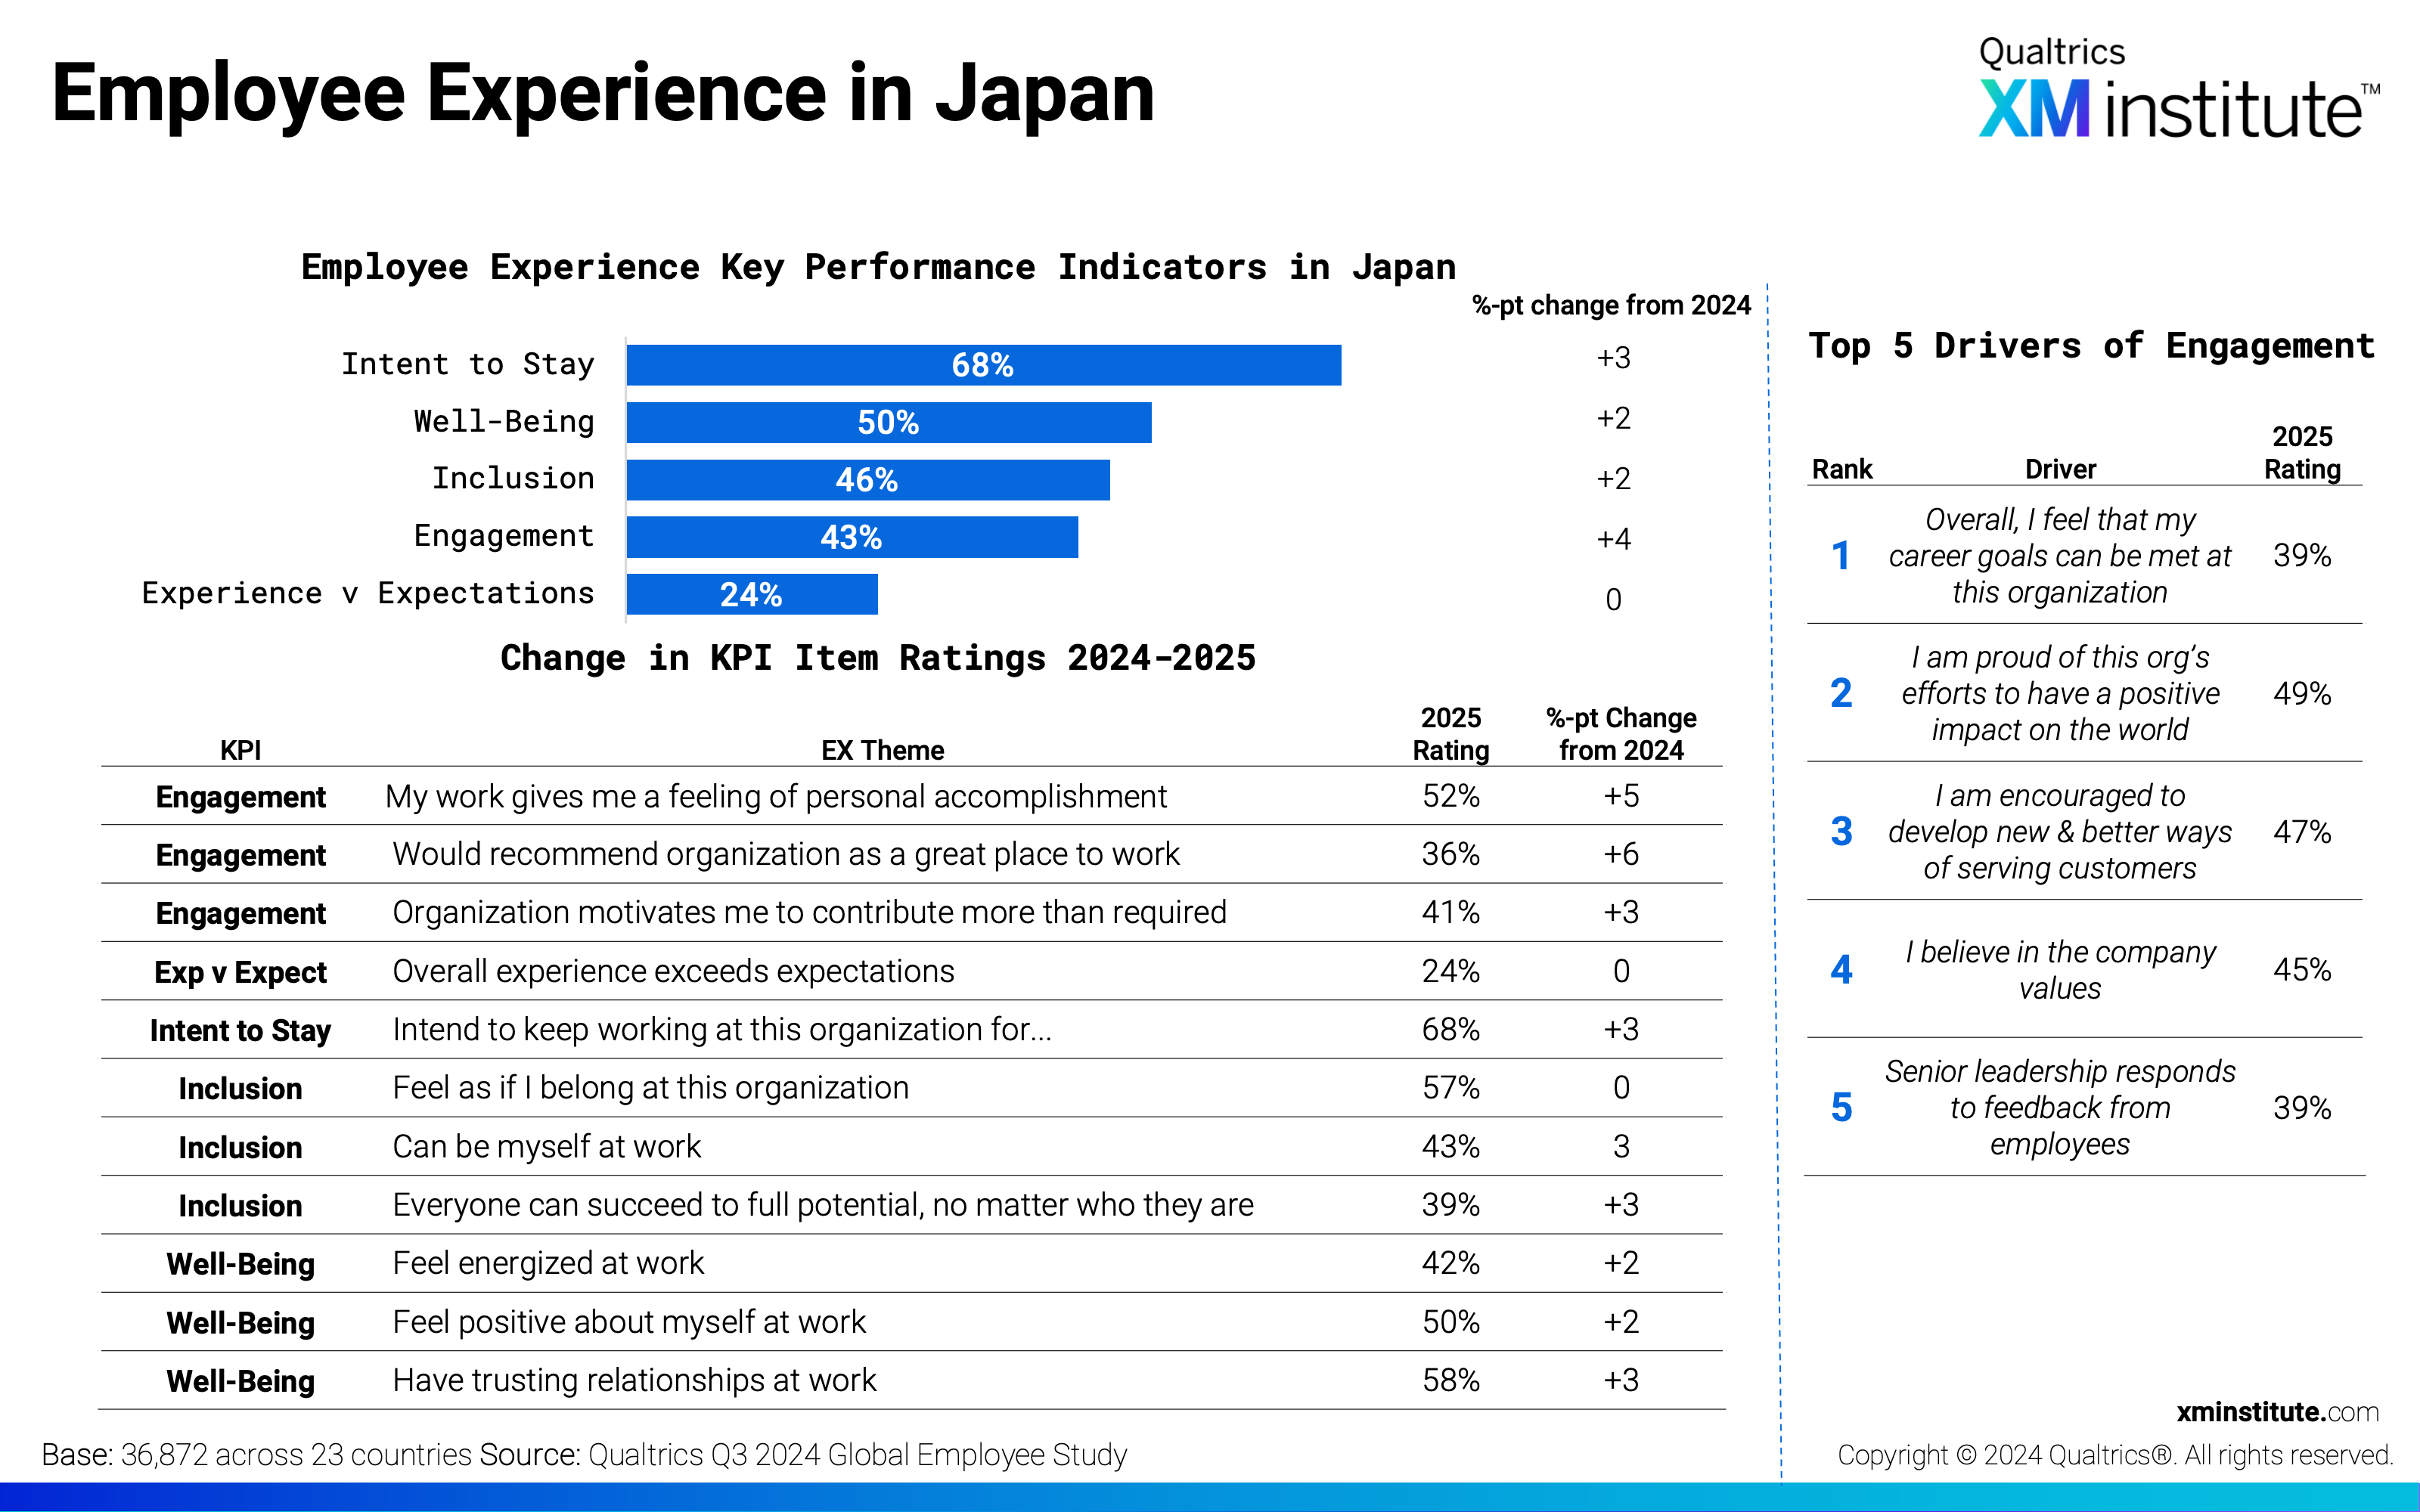
- Employee Experience in Japan (see Figure 13)
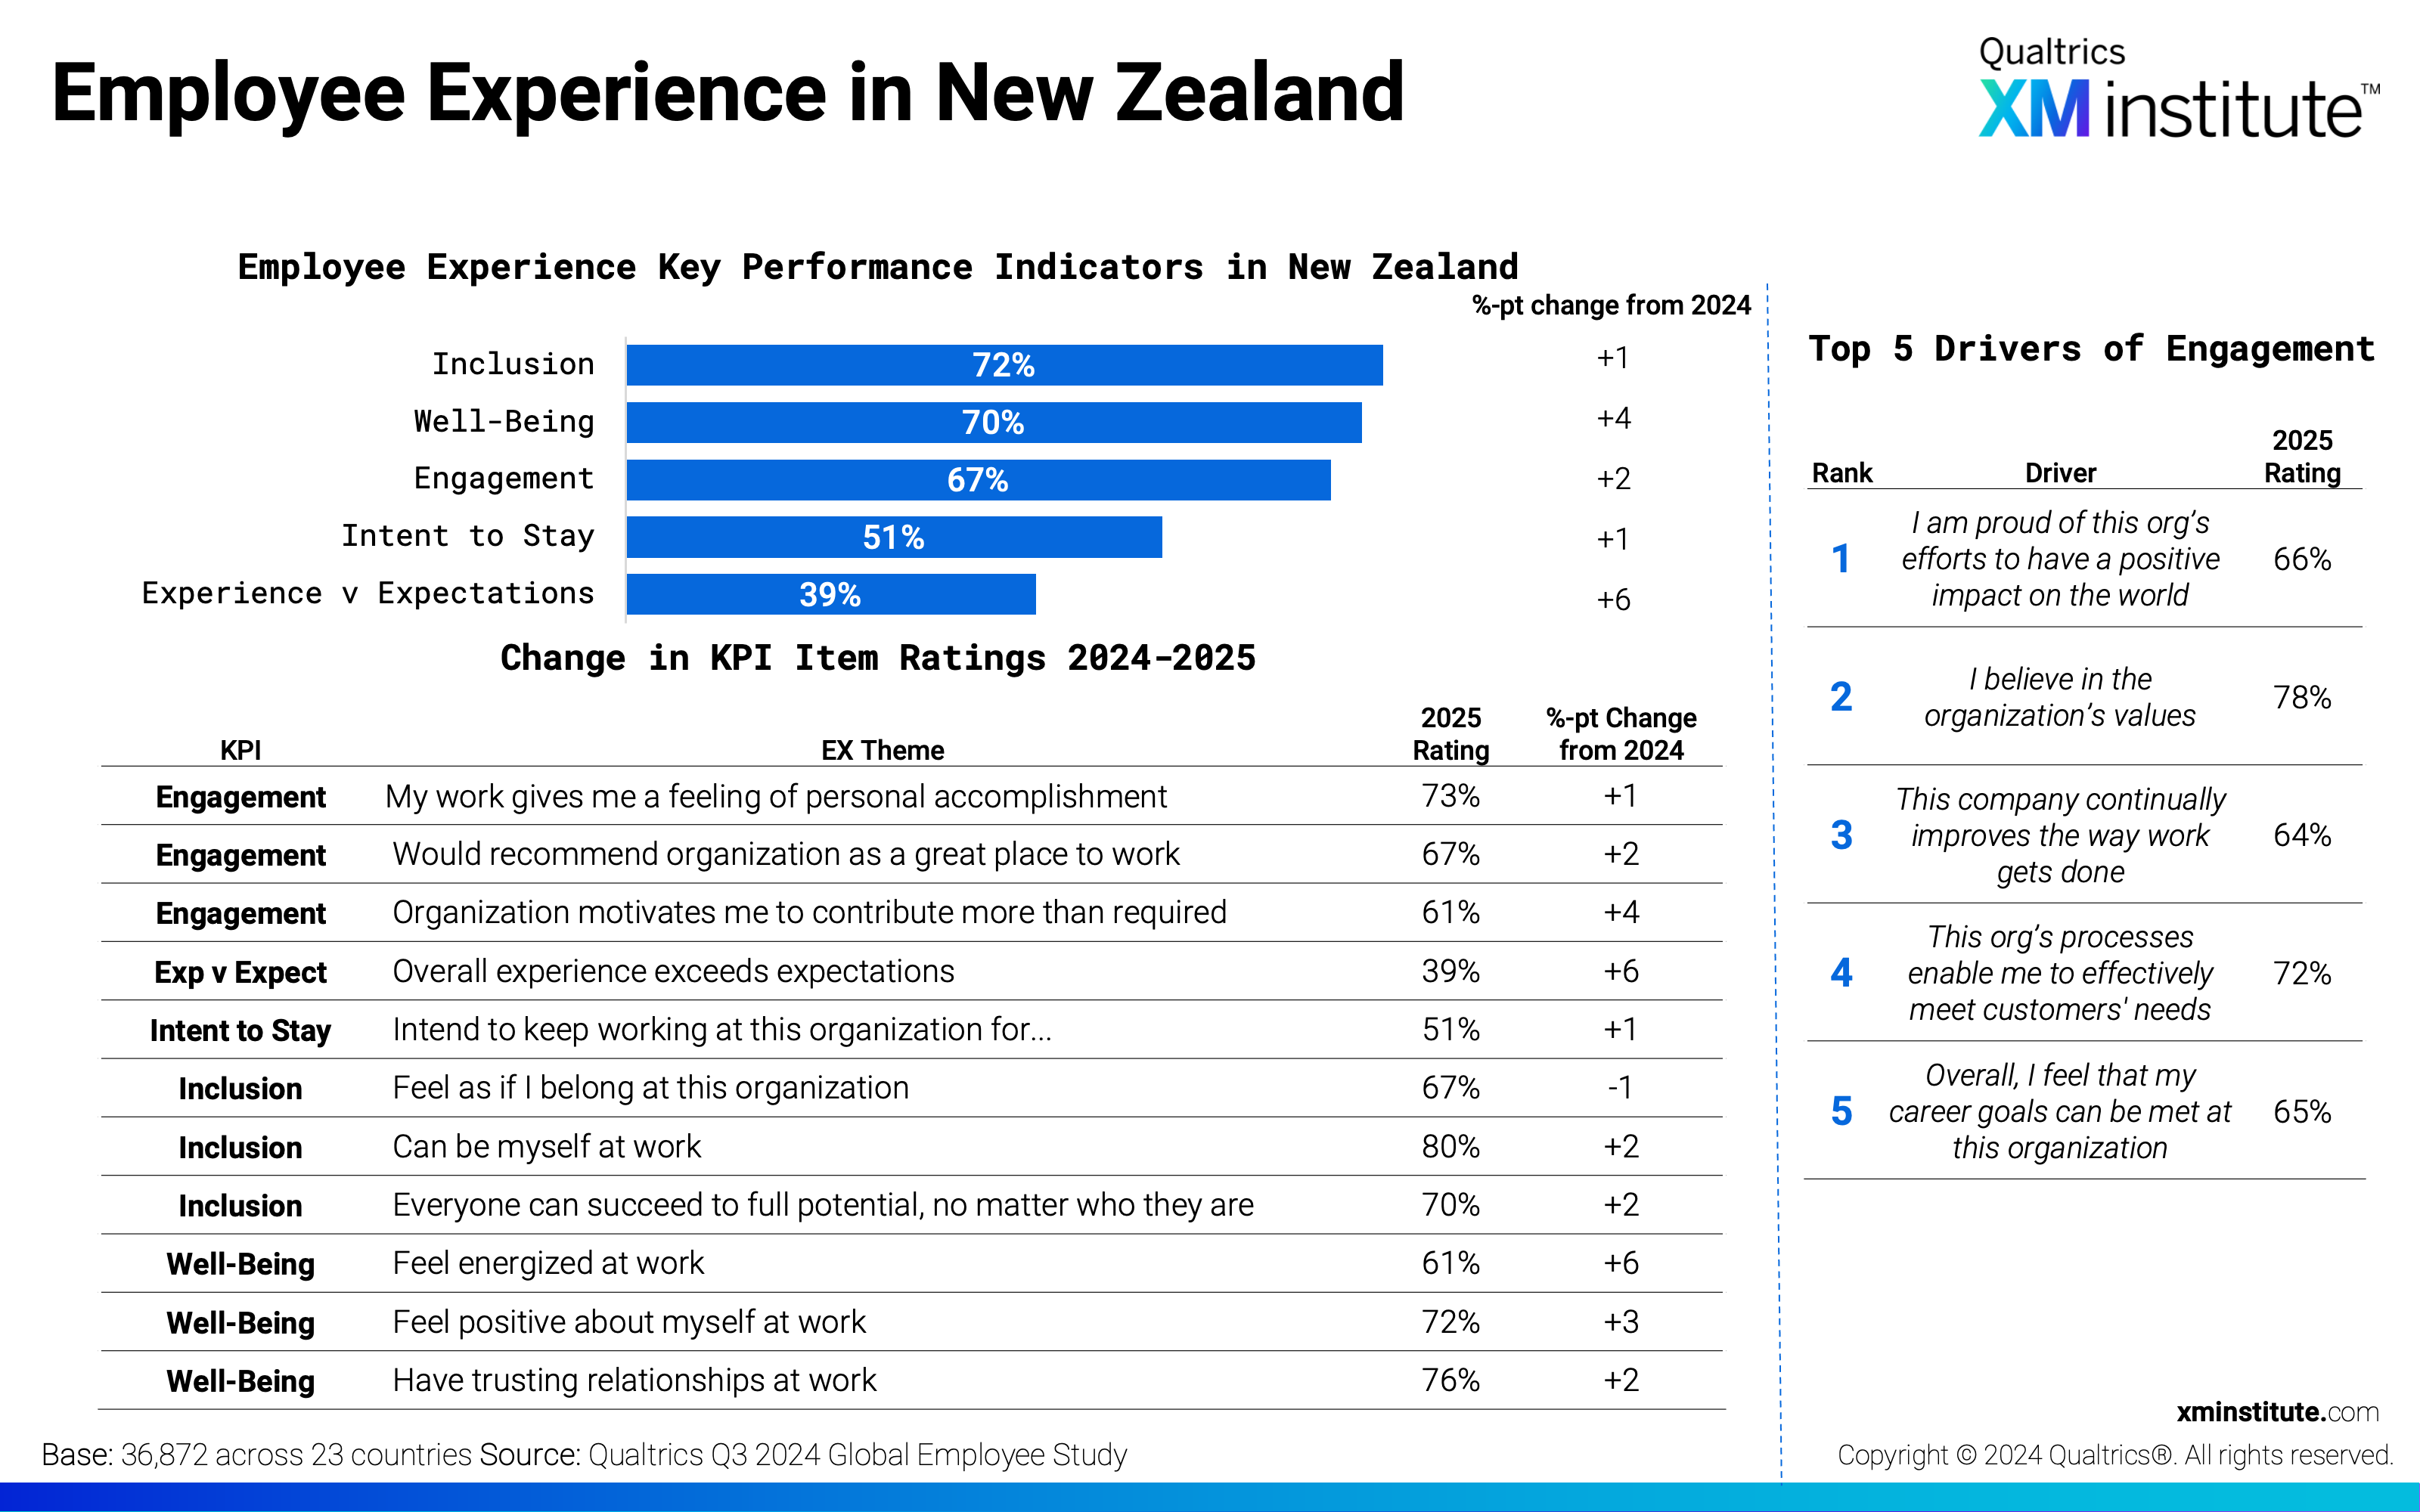
- Employee Experience in the New Zealand (see Figure 14)
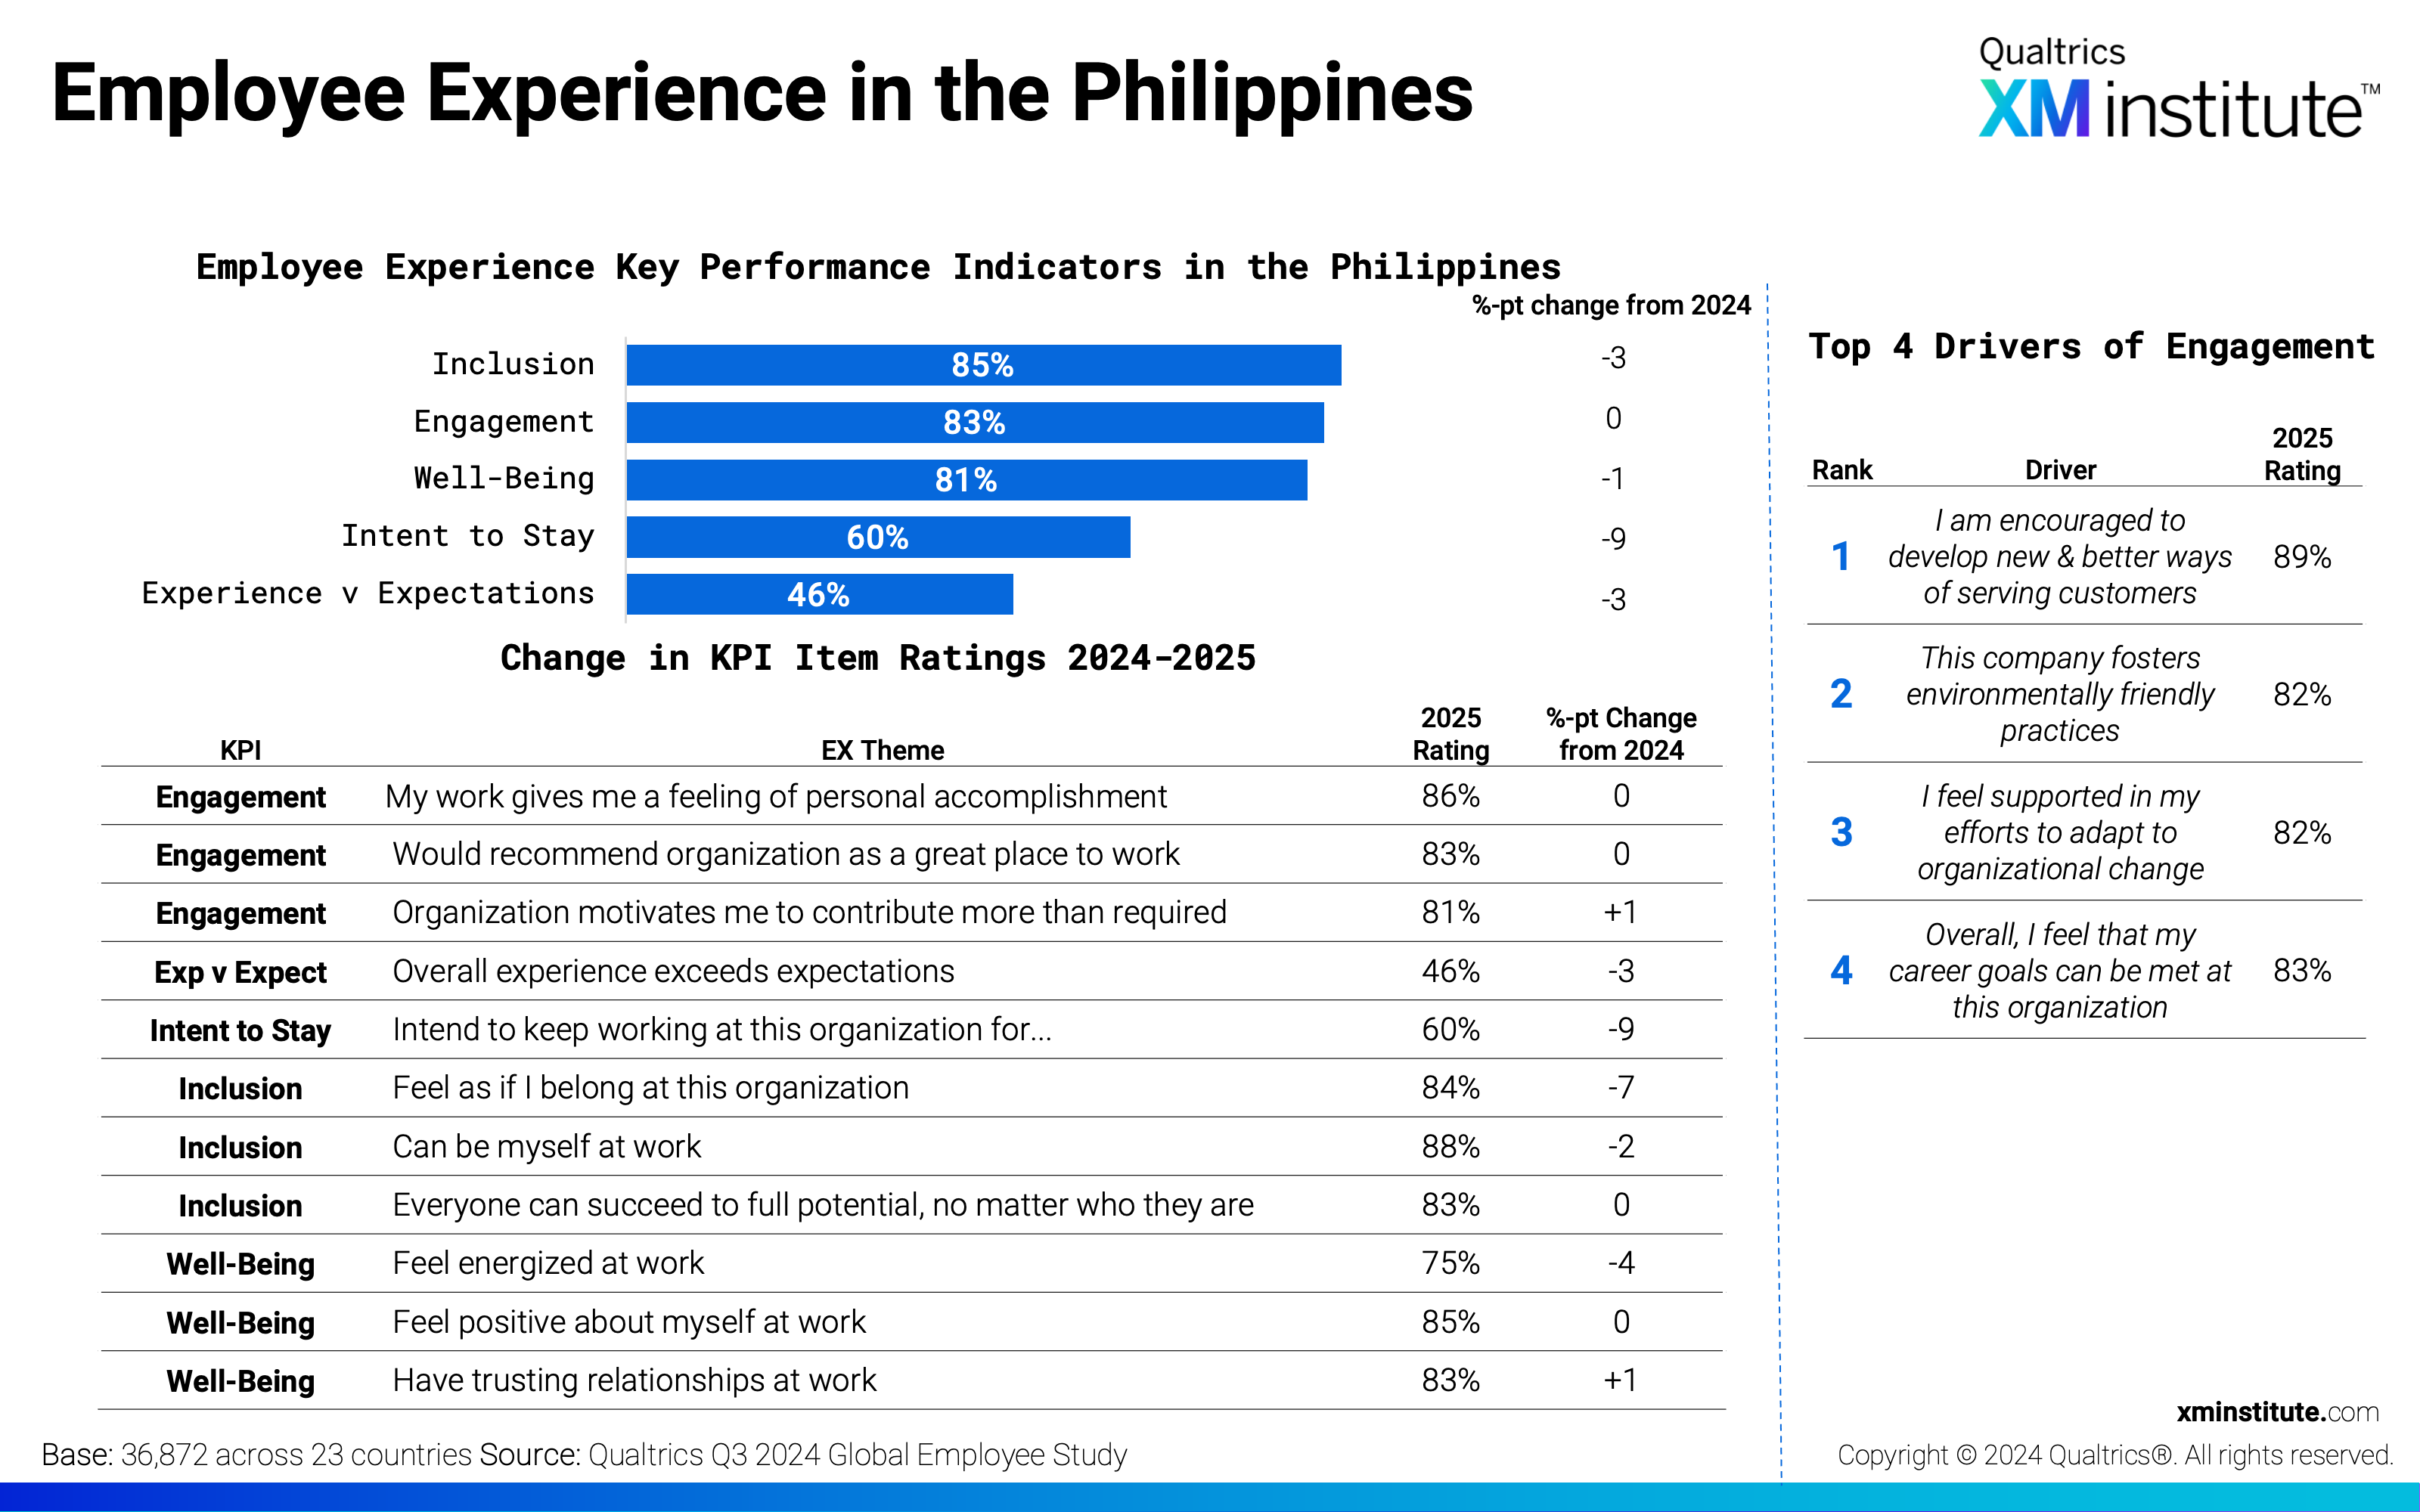
- Employee Experience in the Philippines (see Figure 15)
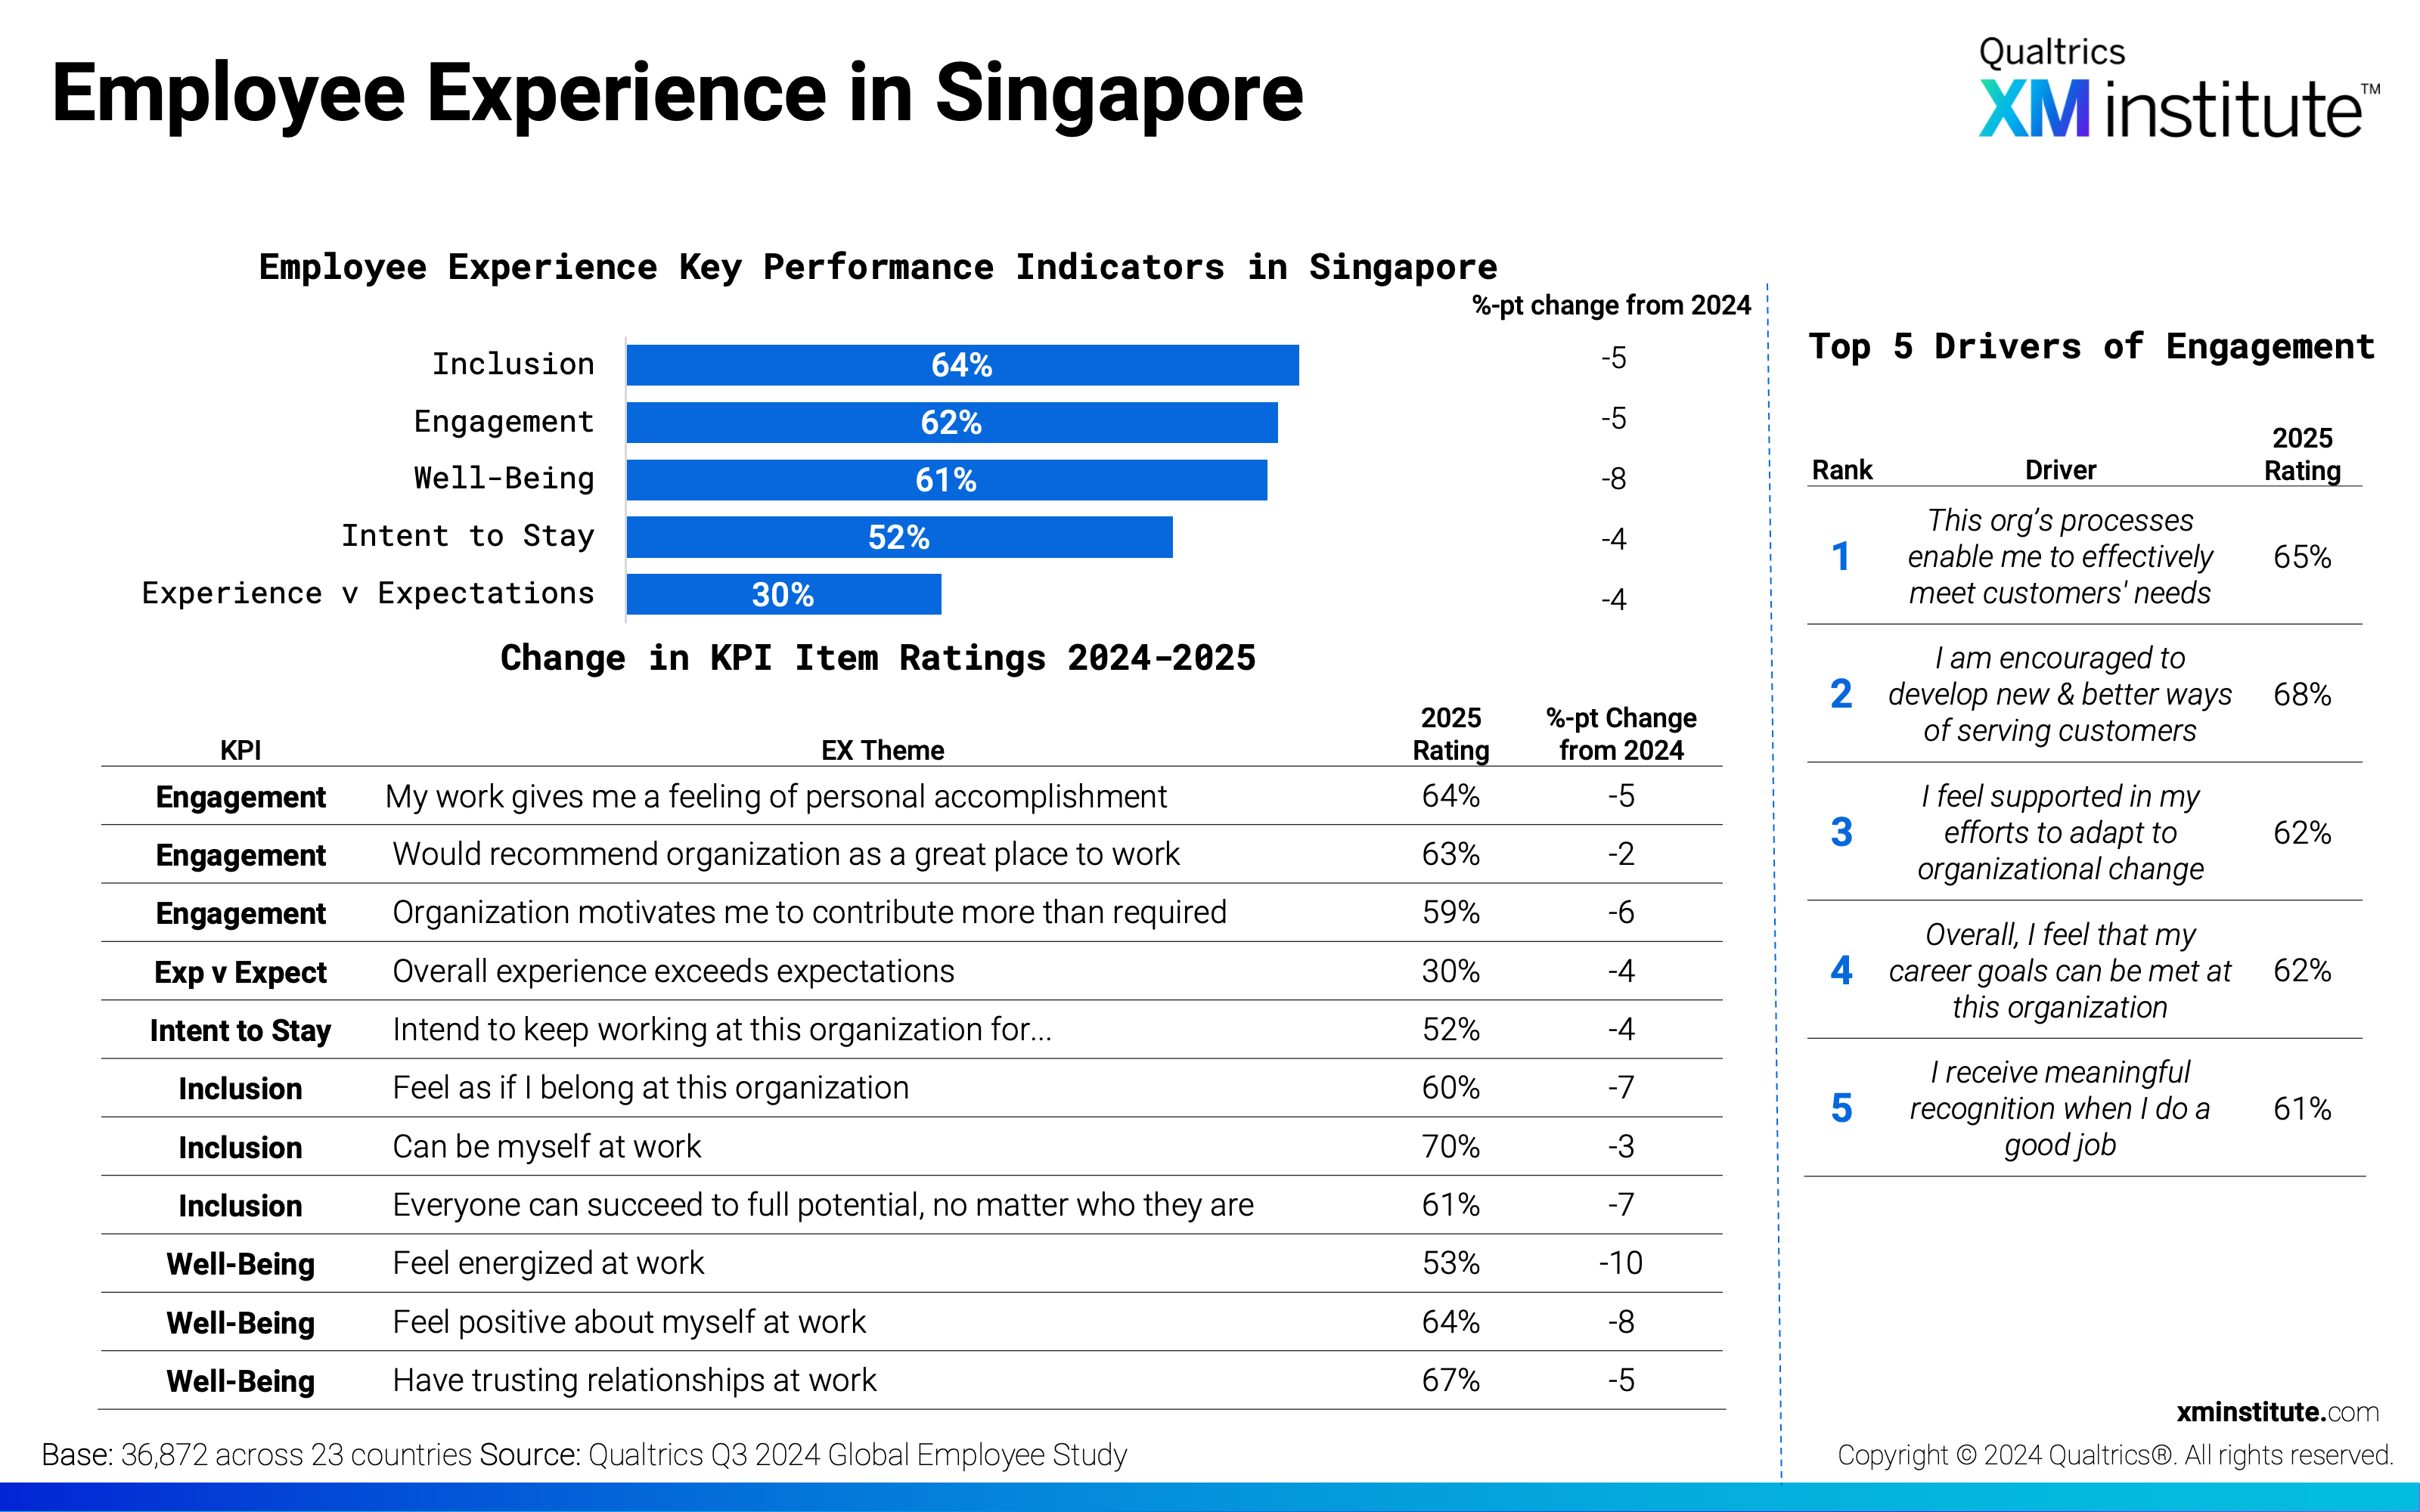
- Employee Experience in Singapore (see Figure 16)
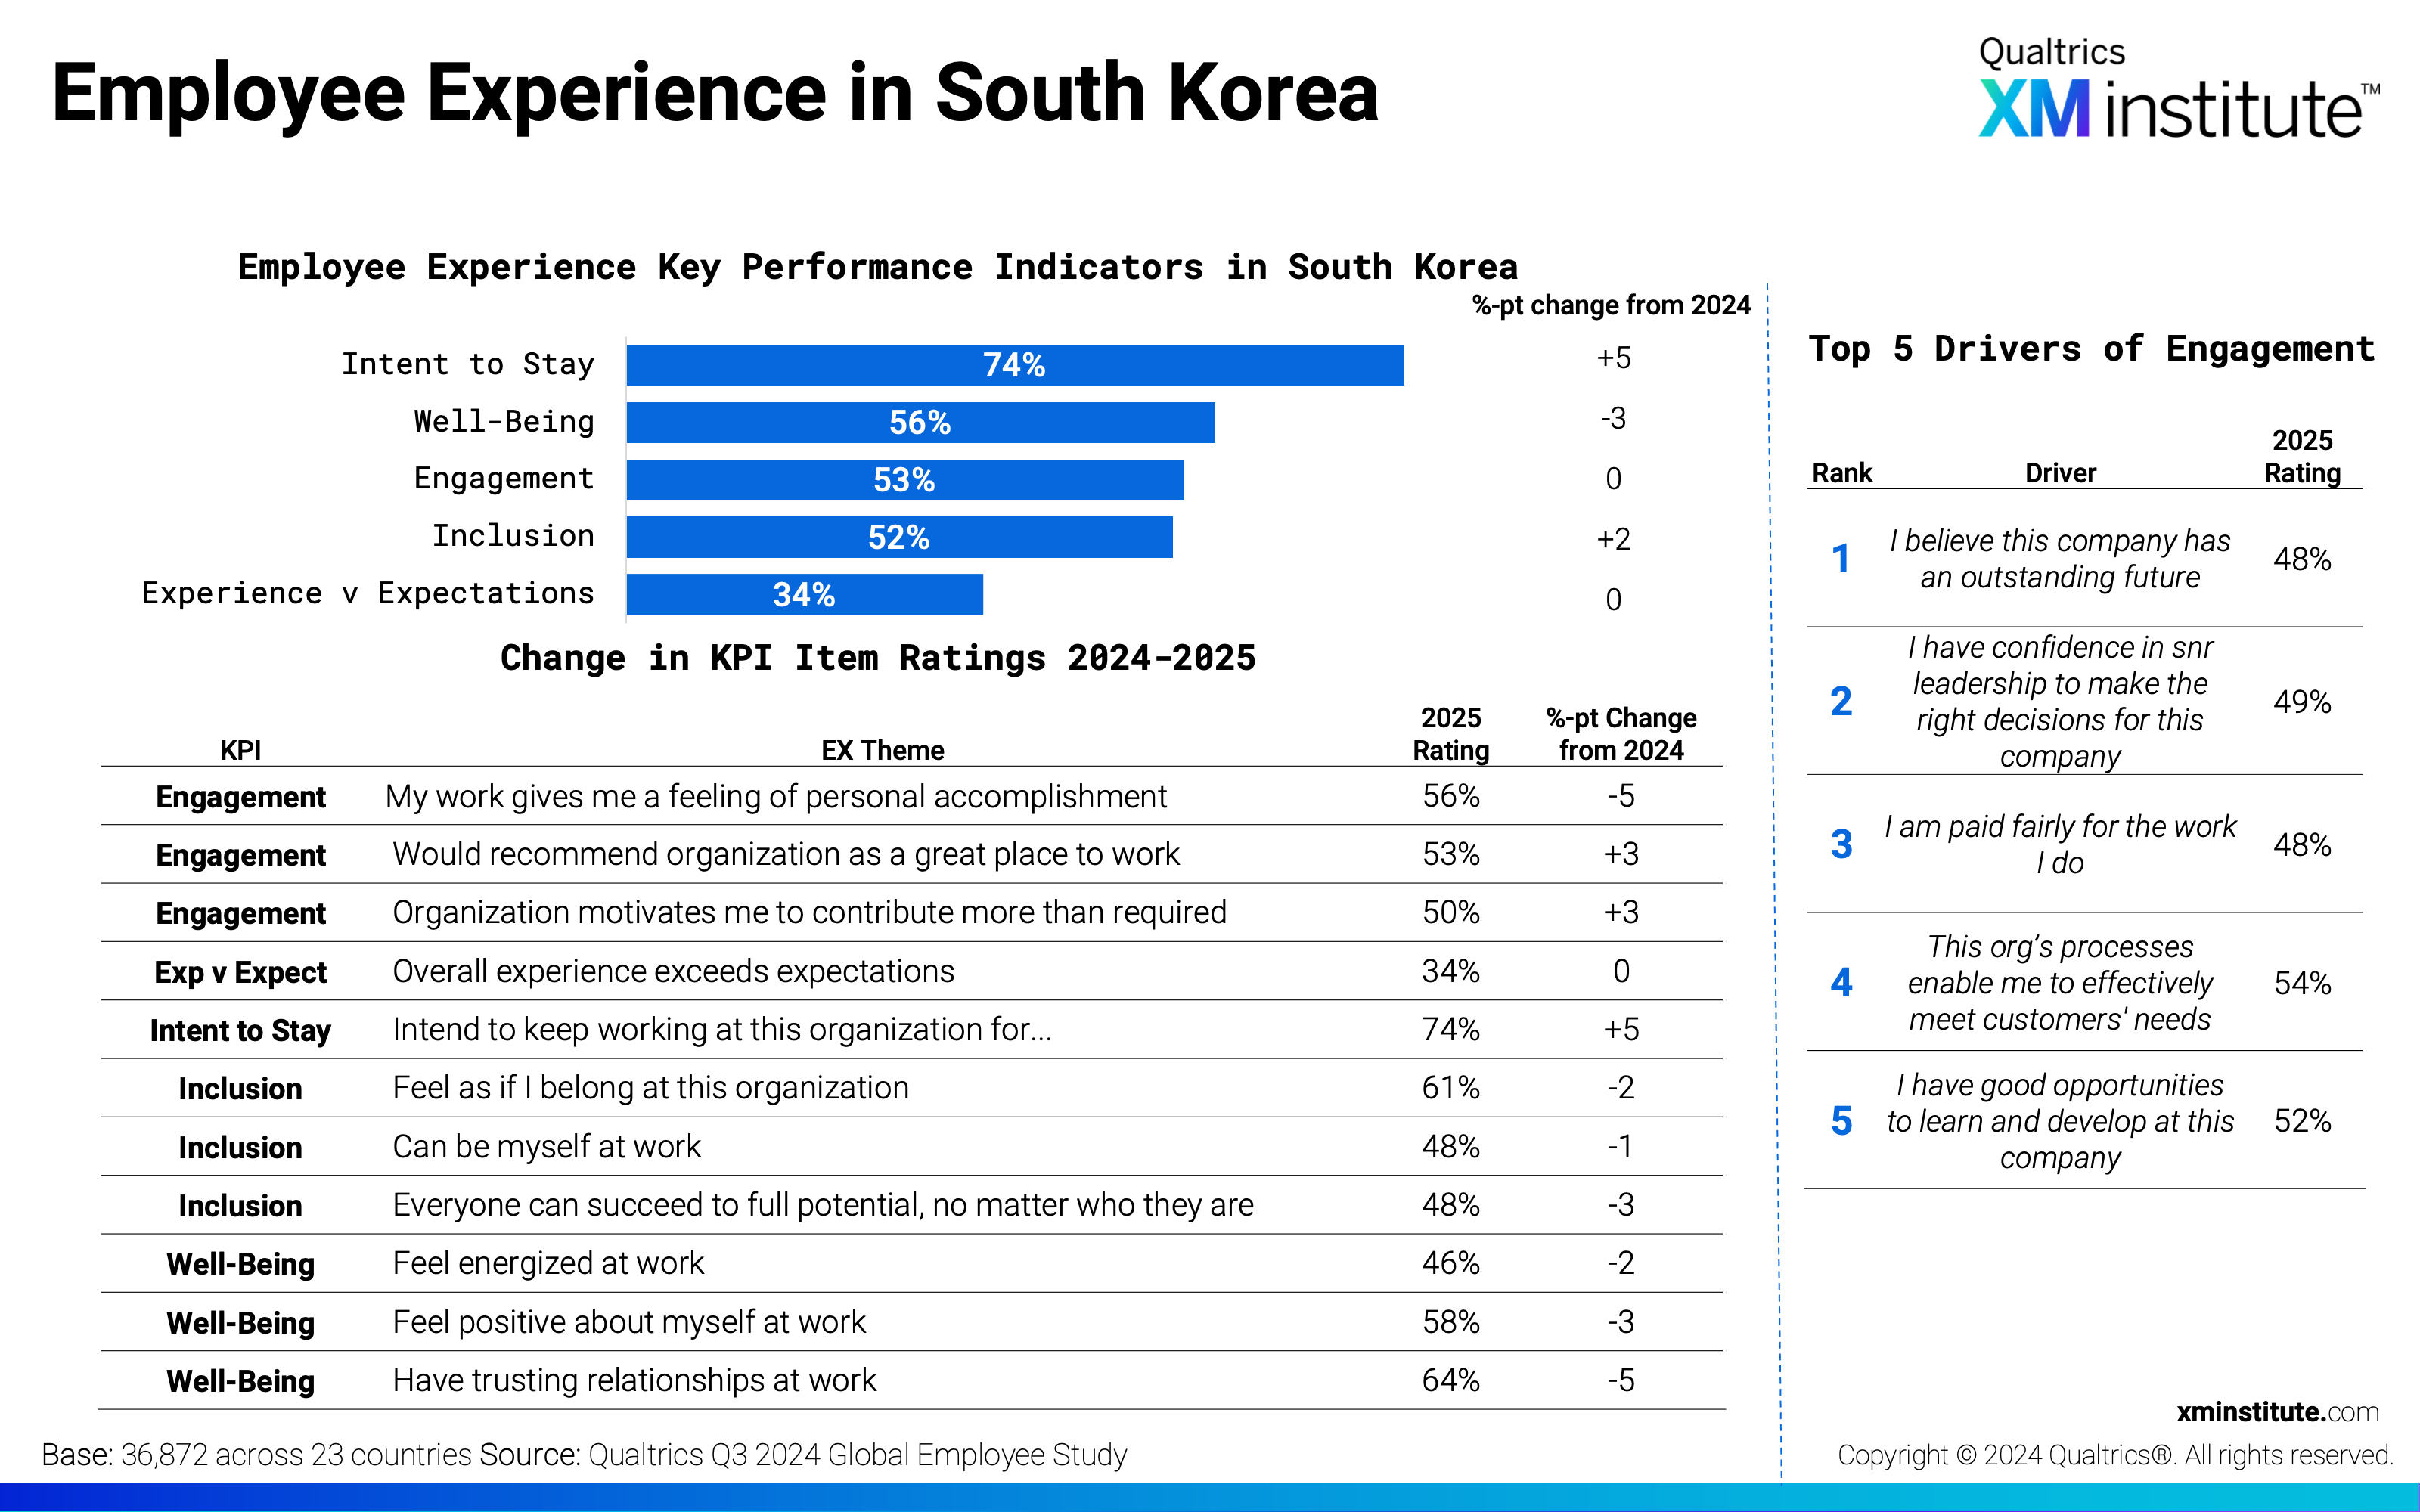
- Employee Experience in South Korea (see Figure 17)
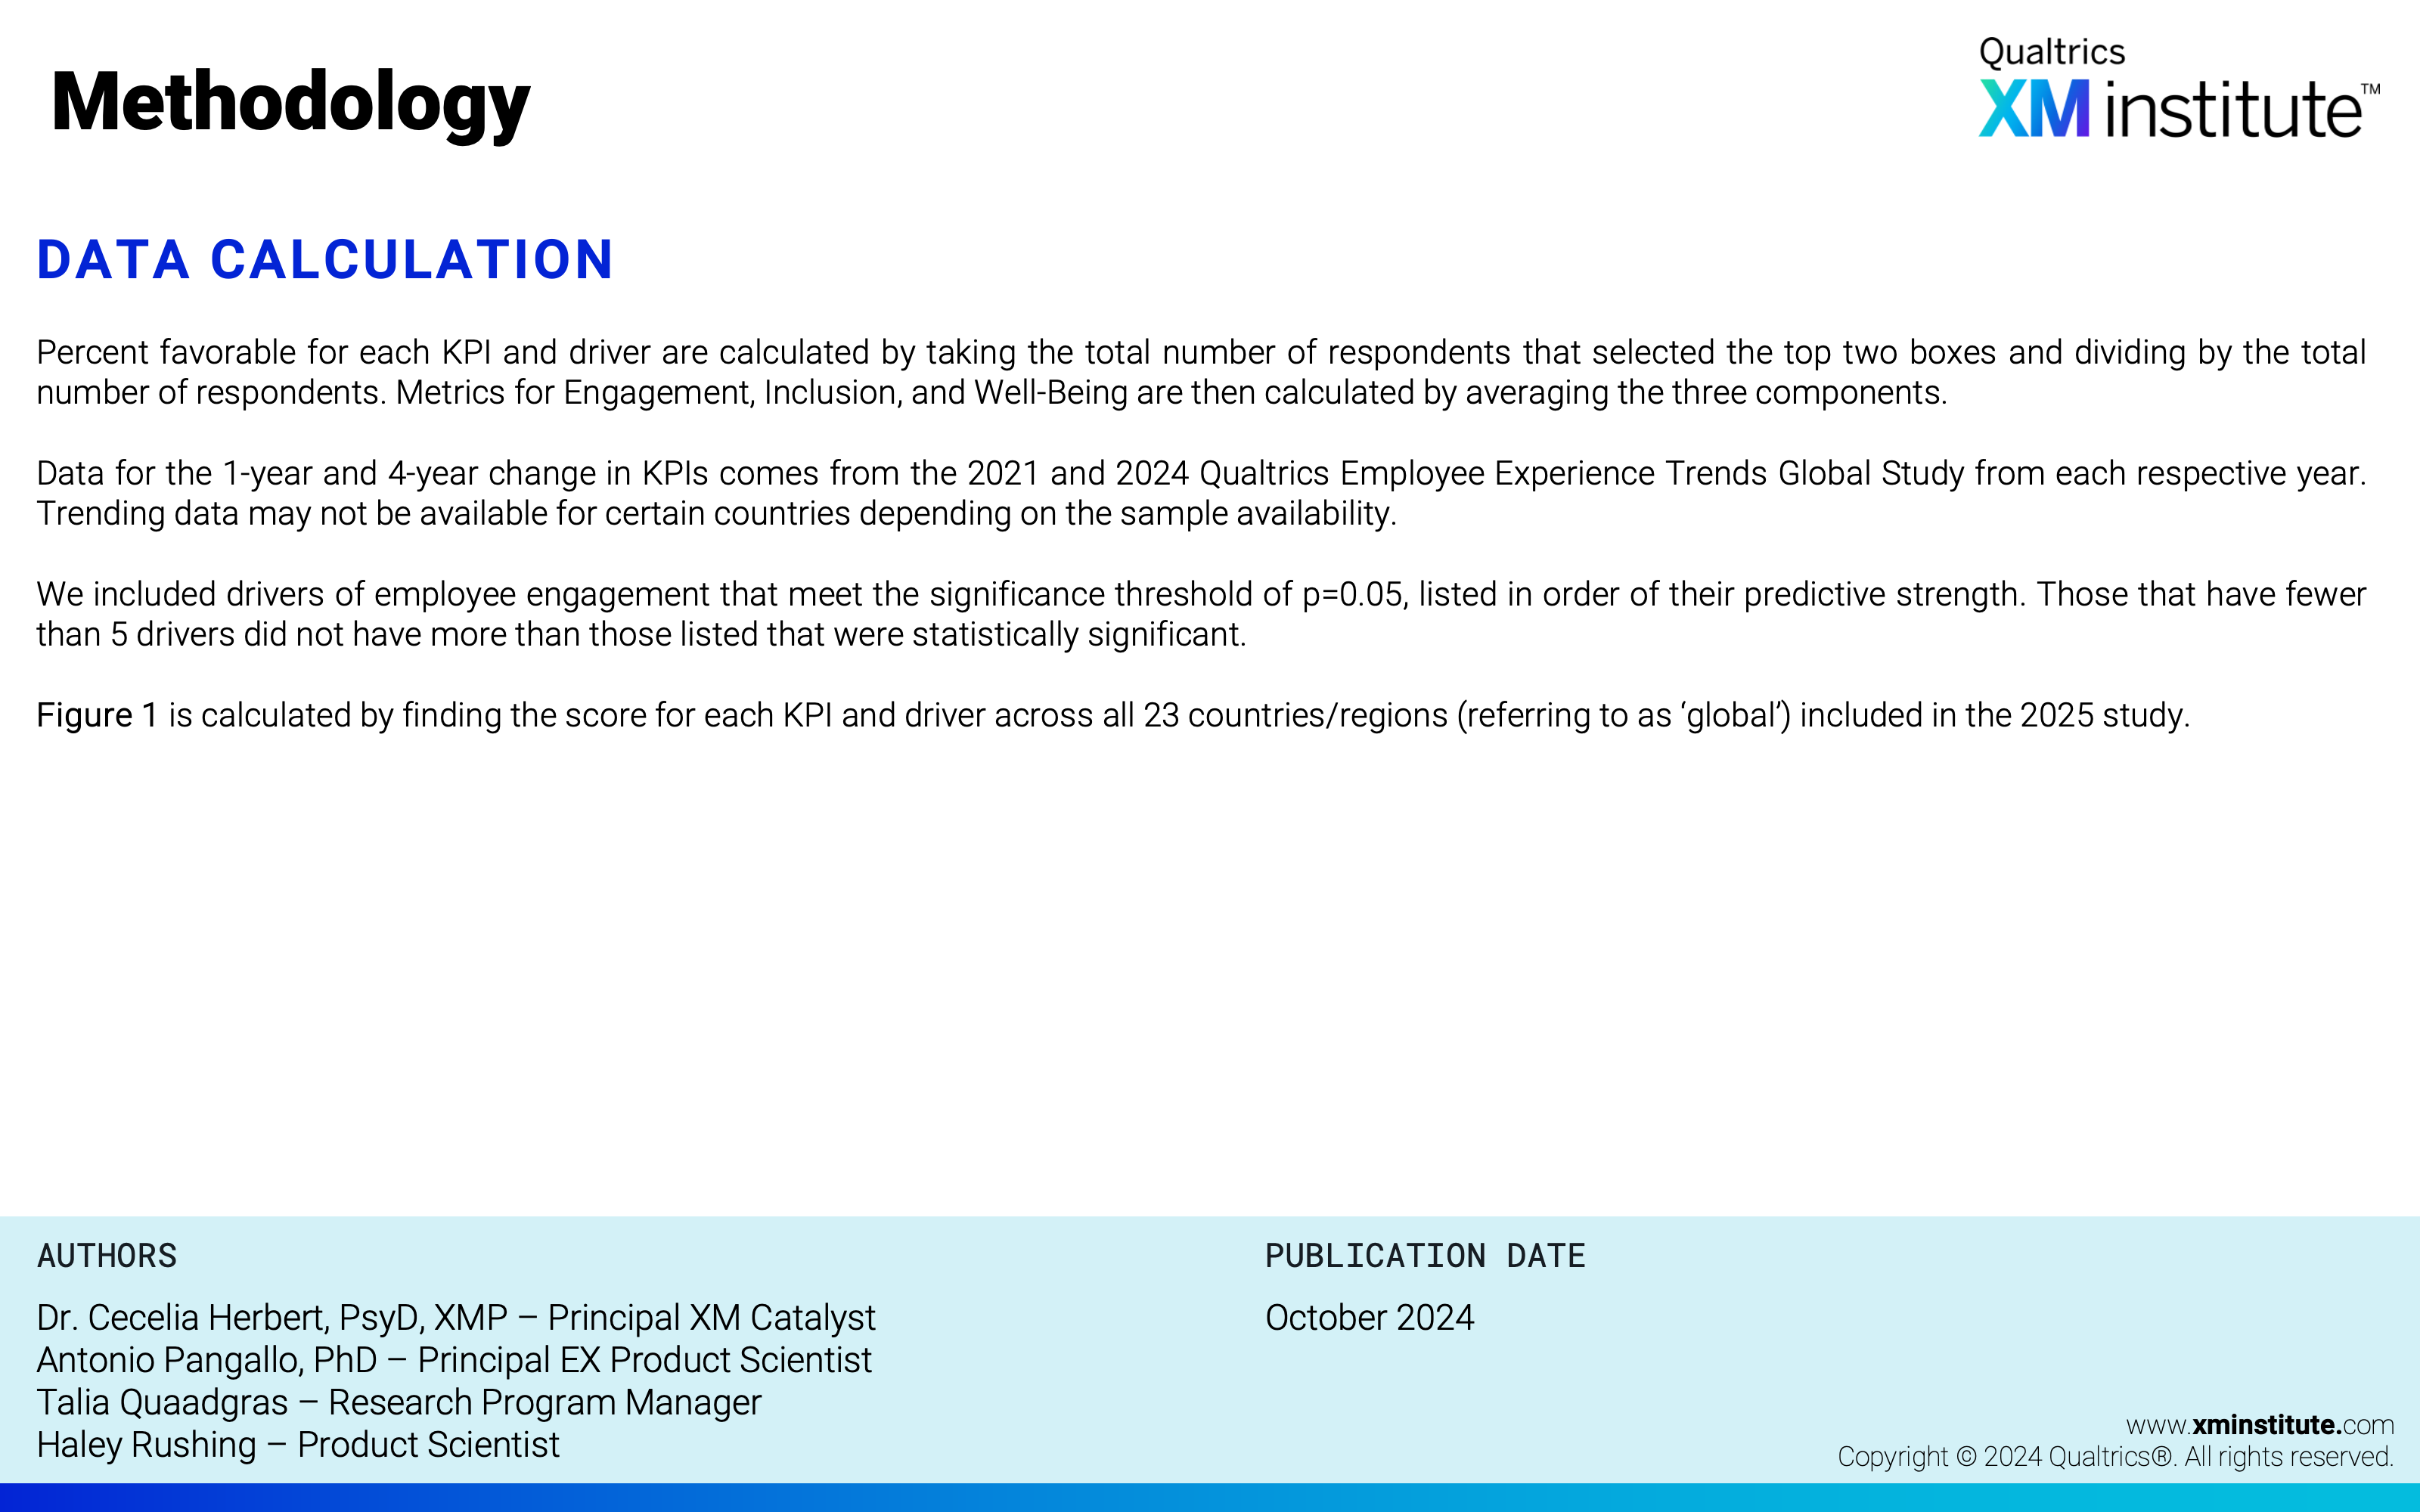
- Methodology (see Figure 18)