Key Findings
As part of Qualtrics’ global employee study, employees from 27 countries rated their current work experience across 14 components. From this study, we were able to analyze five key performance indicators (Engagement, Inclusion, Intent to Stay, Well-Being, and Experience vs Expectations) for employee experience across each country and work levels within each country. In this snapshot, we share the metrics from the Asia-Pacific region. We found that:
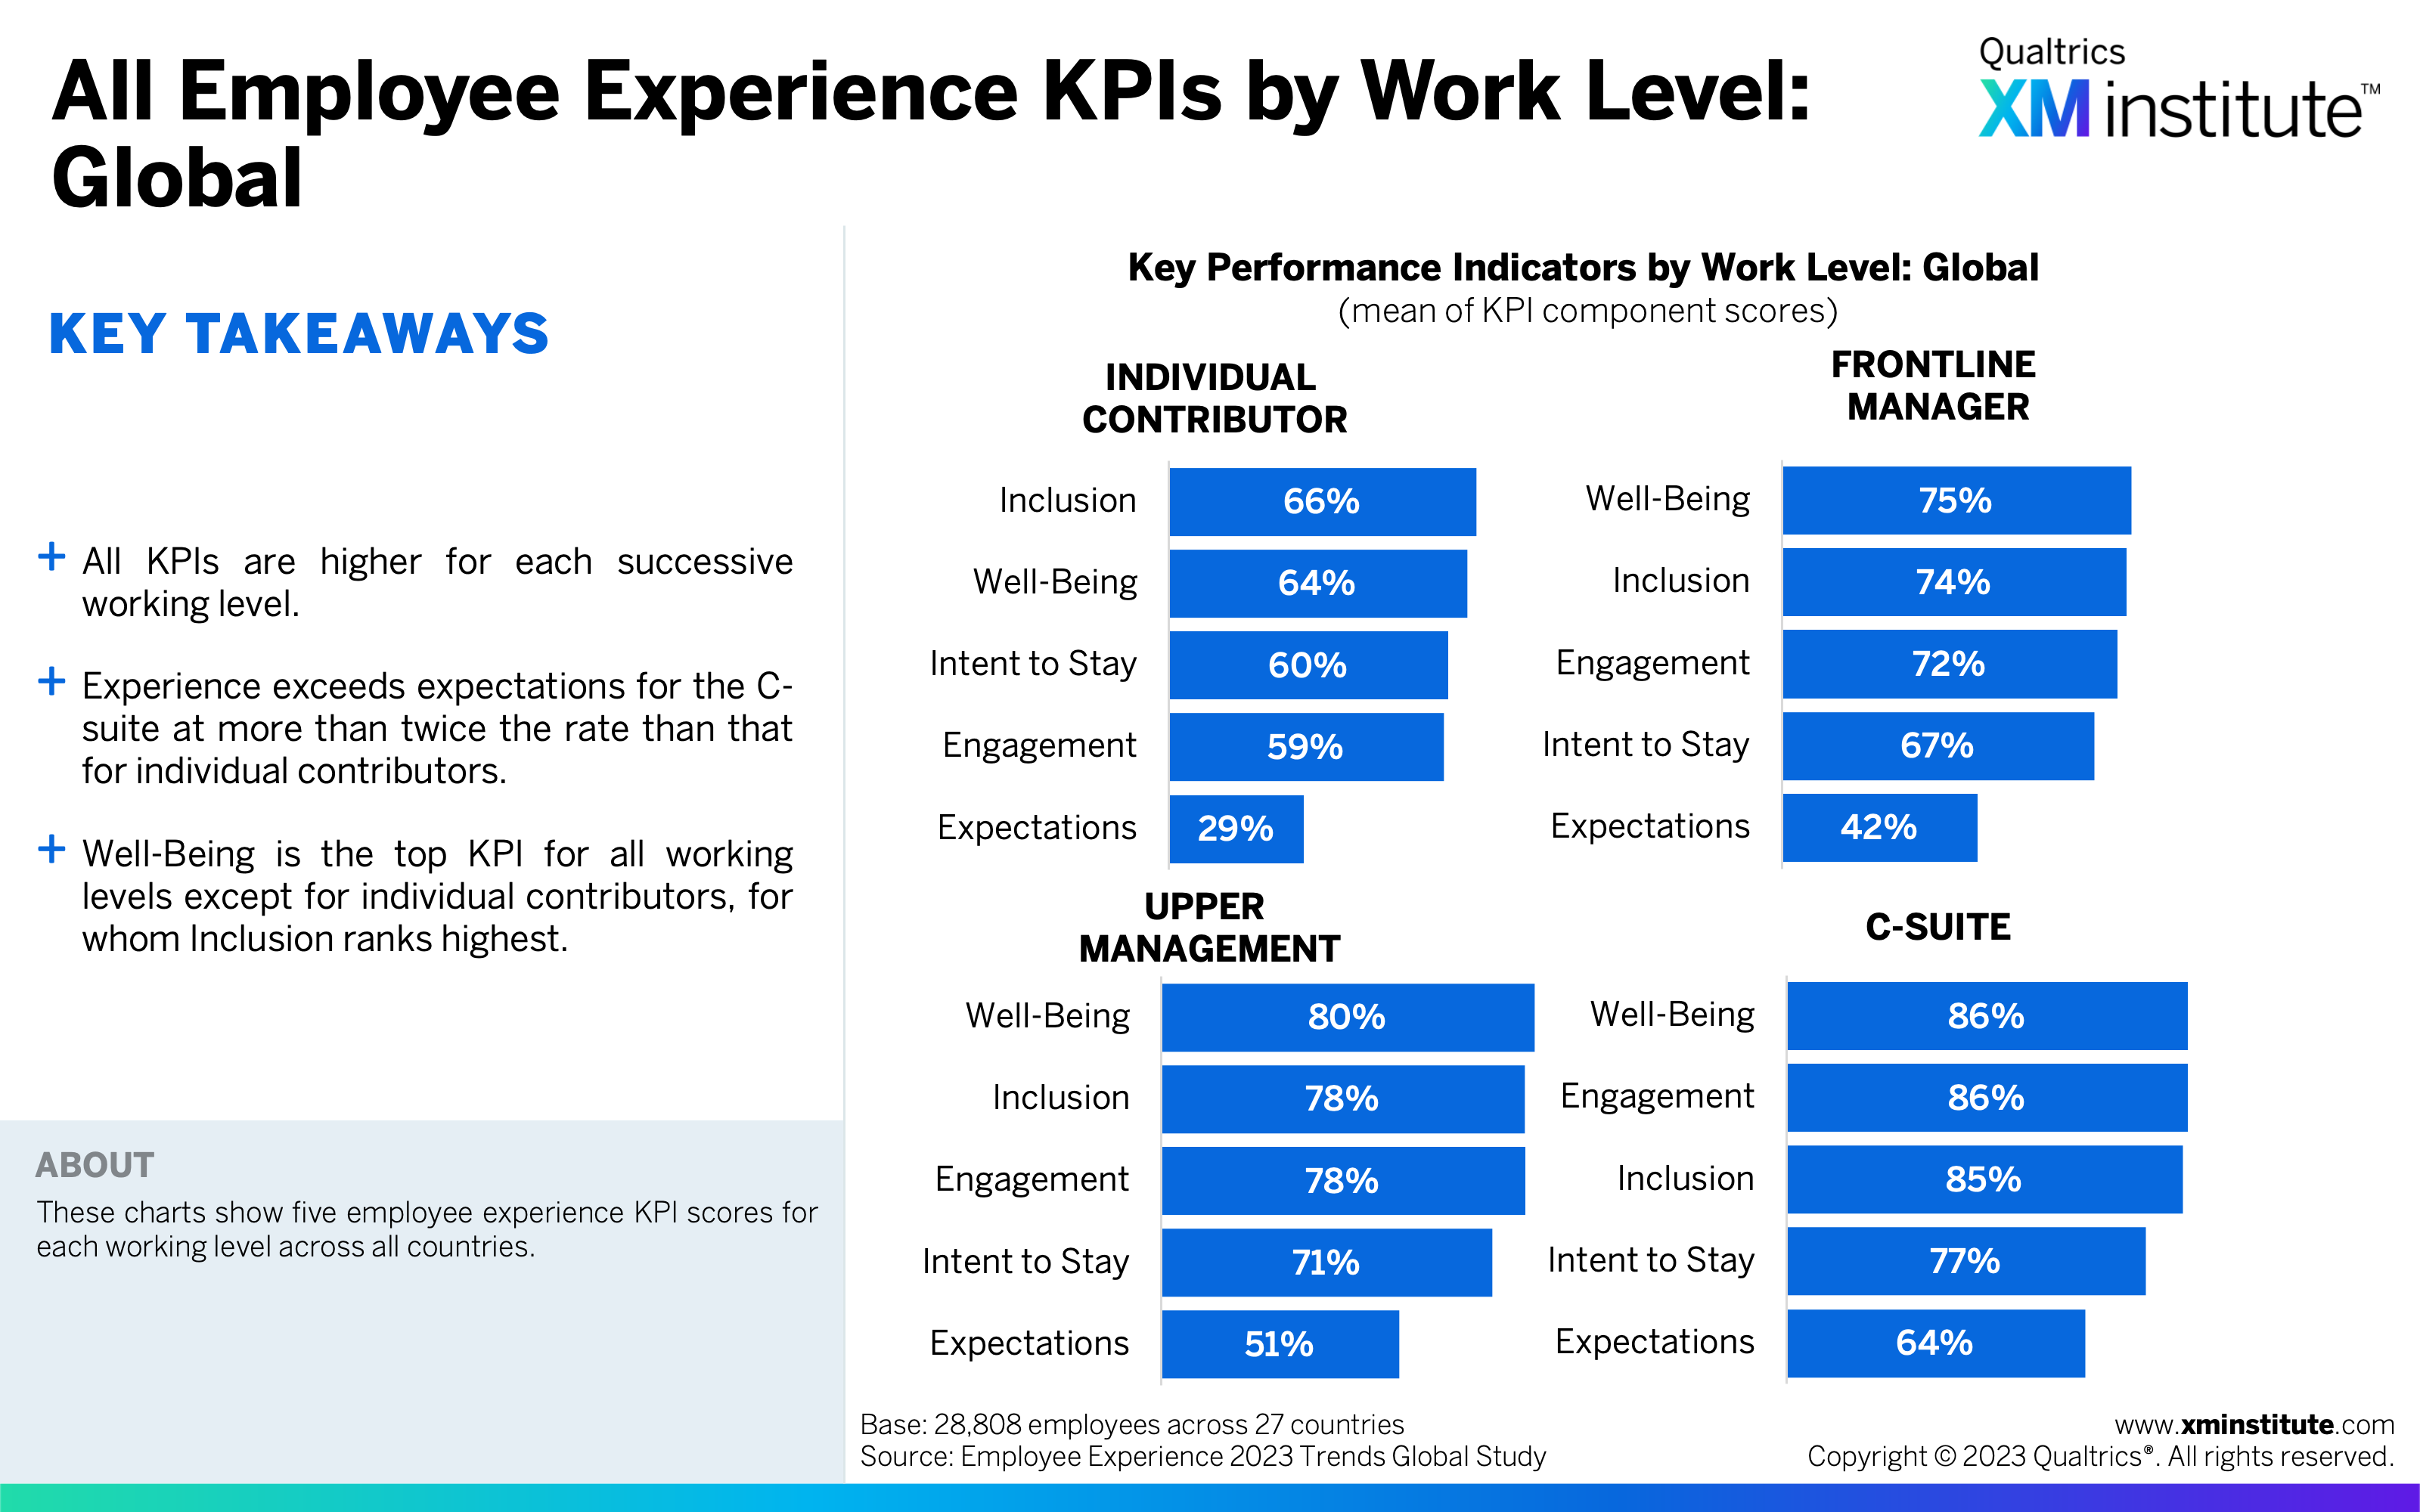
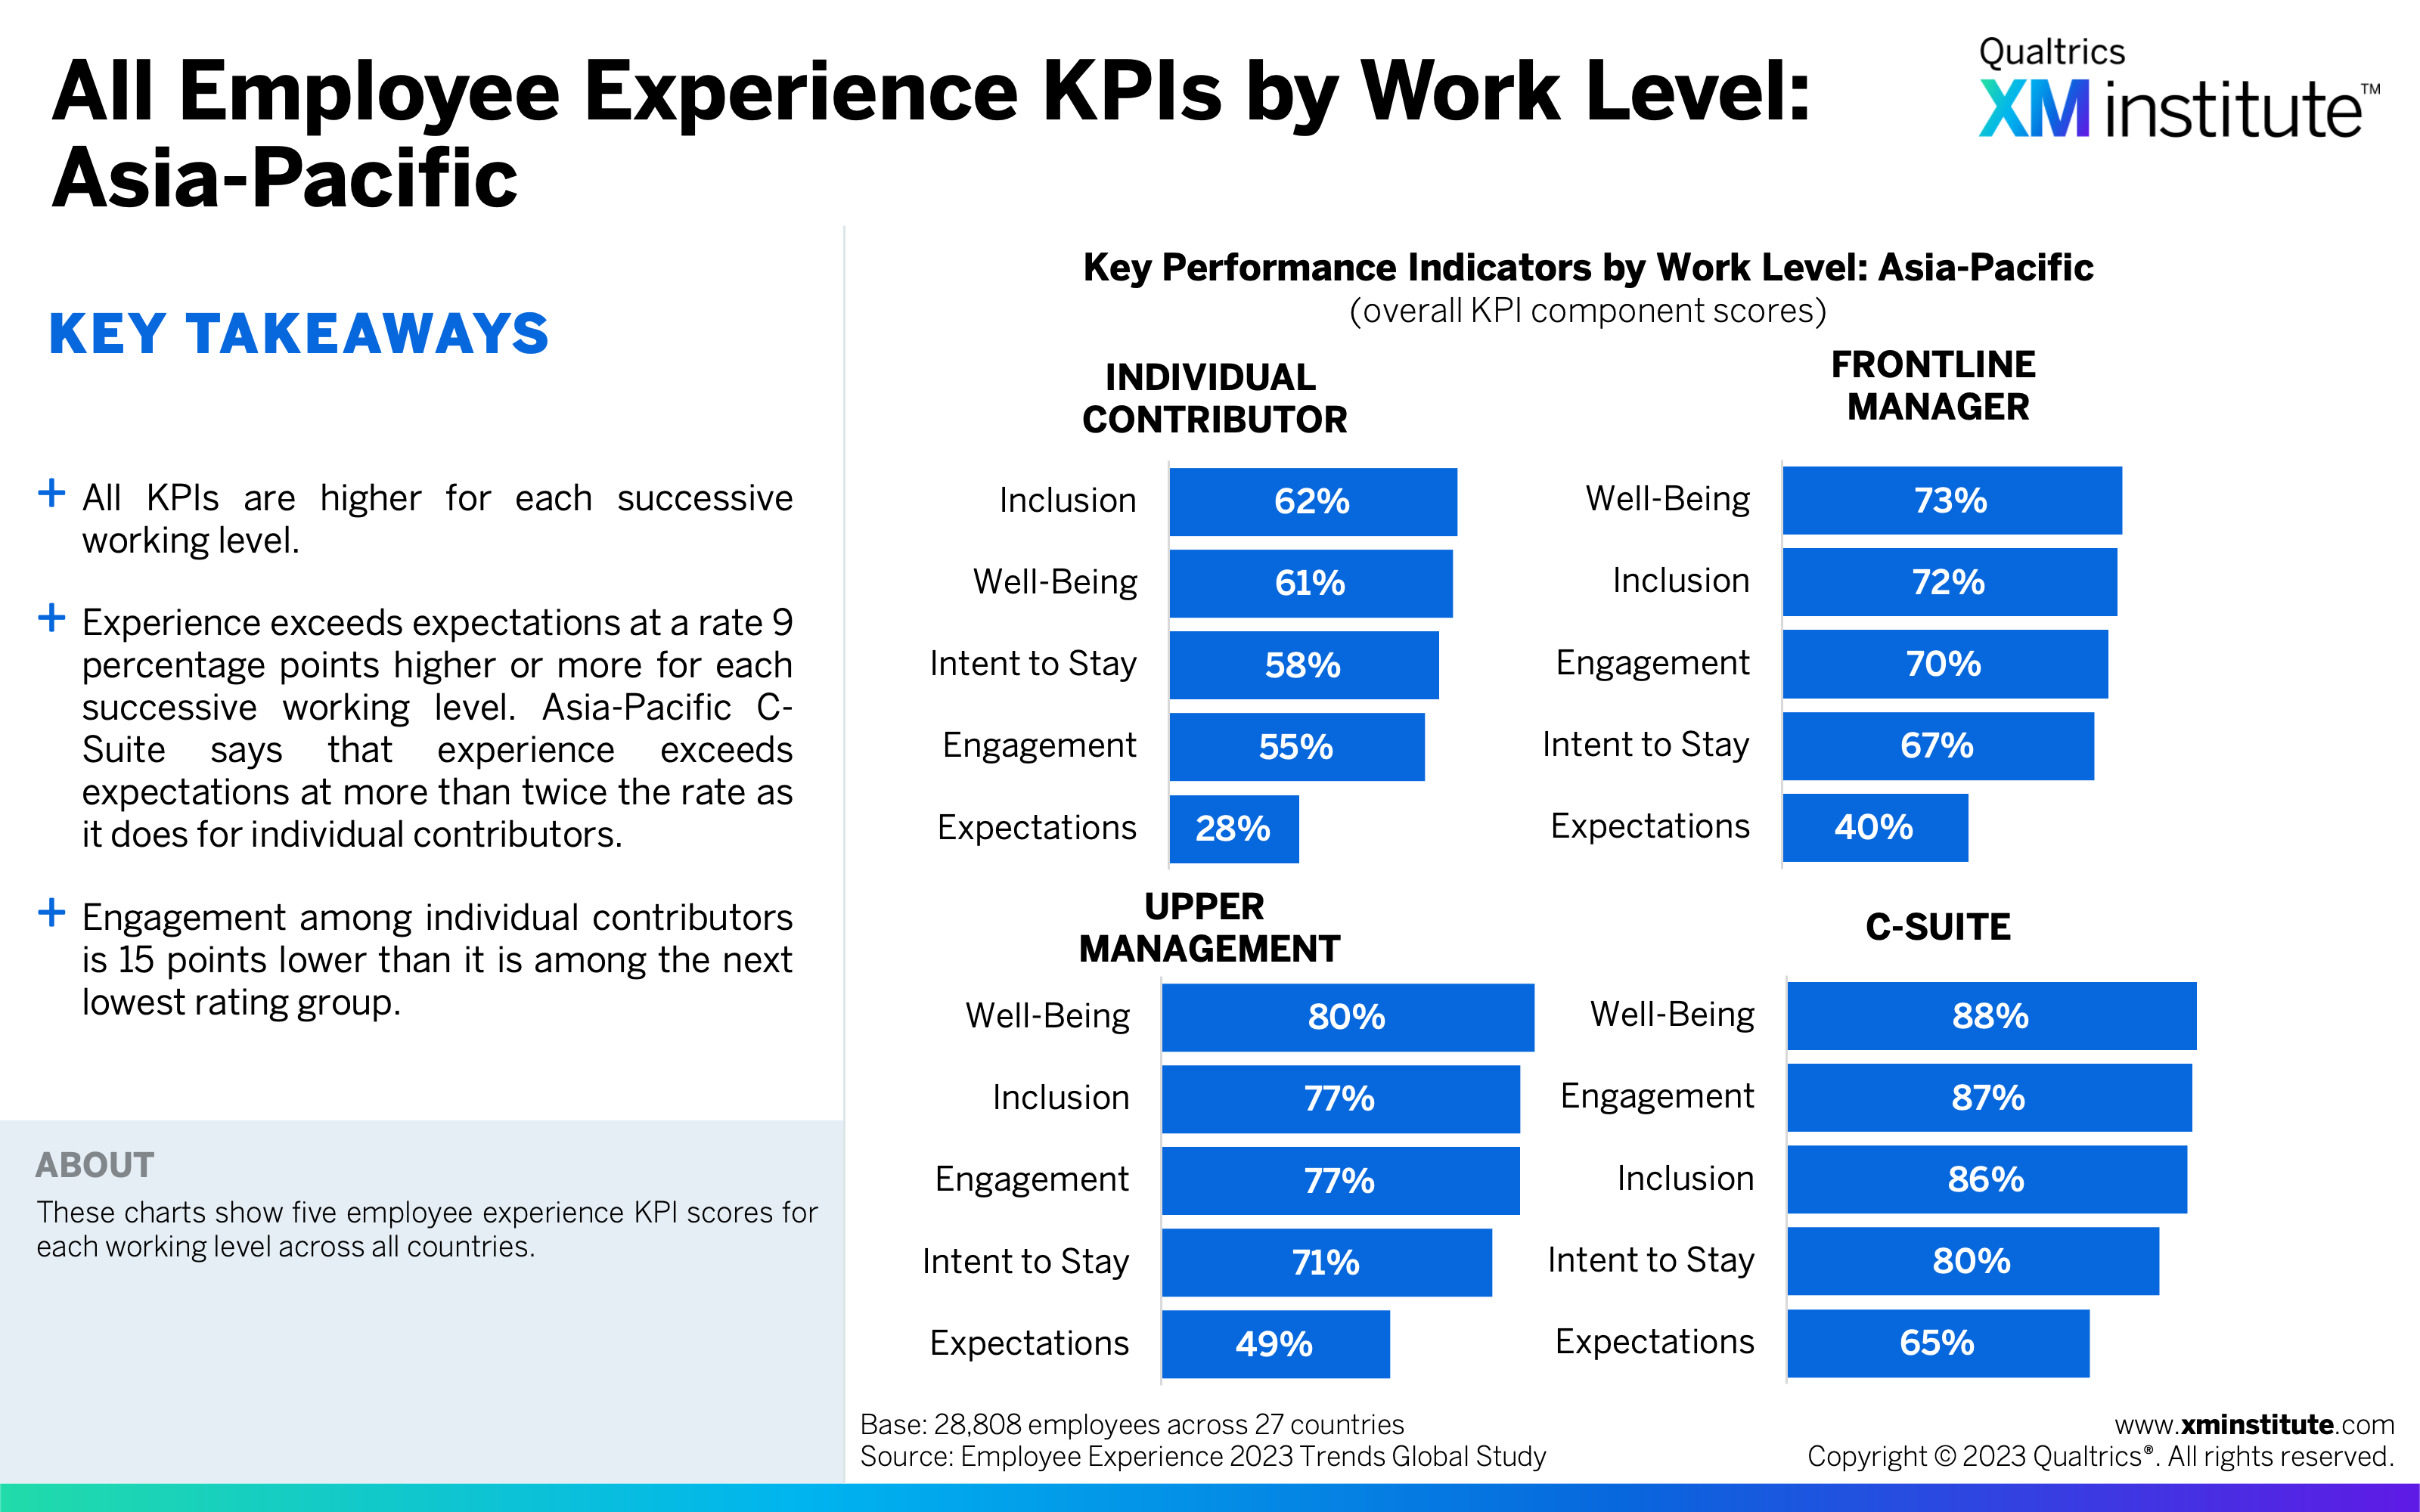
- There is an experience gap between work levels. Individual contributors provide lower Inclusion, Well-Being, and Engagement scores than all other working levels. Frontline managers provide lower KPI scores than higher-level employees. C-suite executives report that their experience exceeded their expectations at twice the rate of individual contributors and provide an Engagement score 1.6x that of individual contributors.
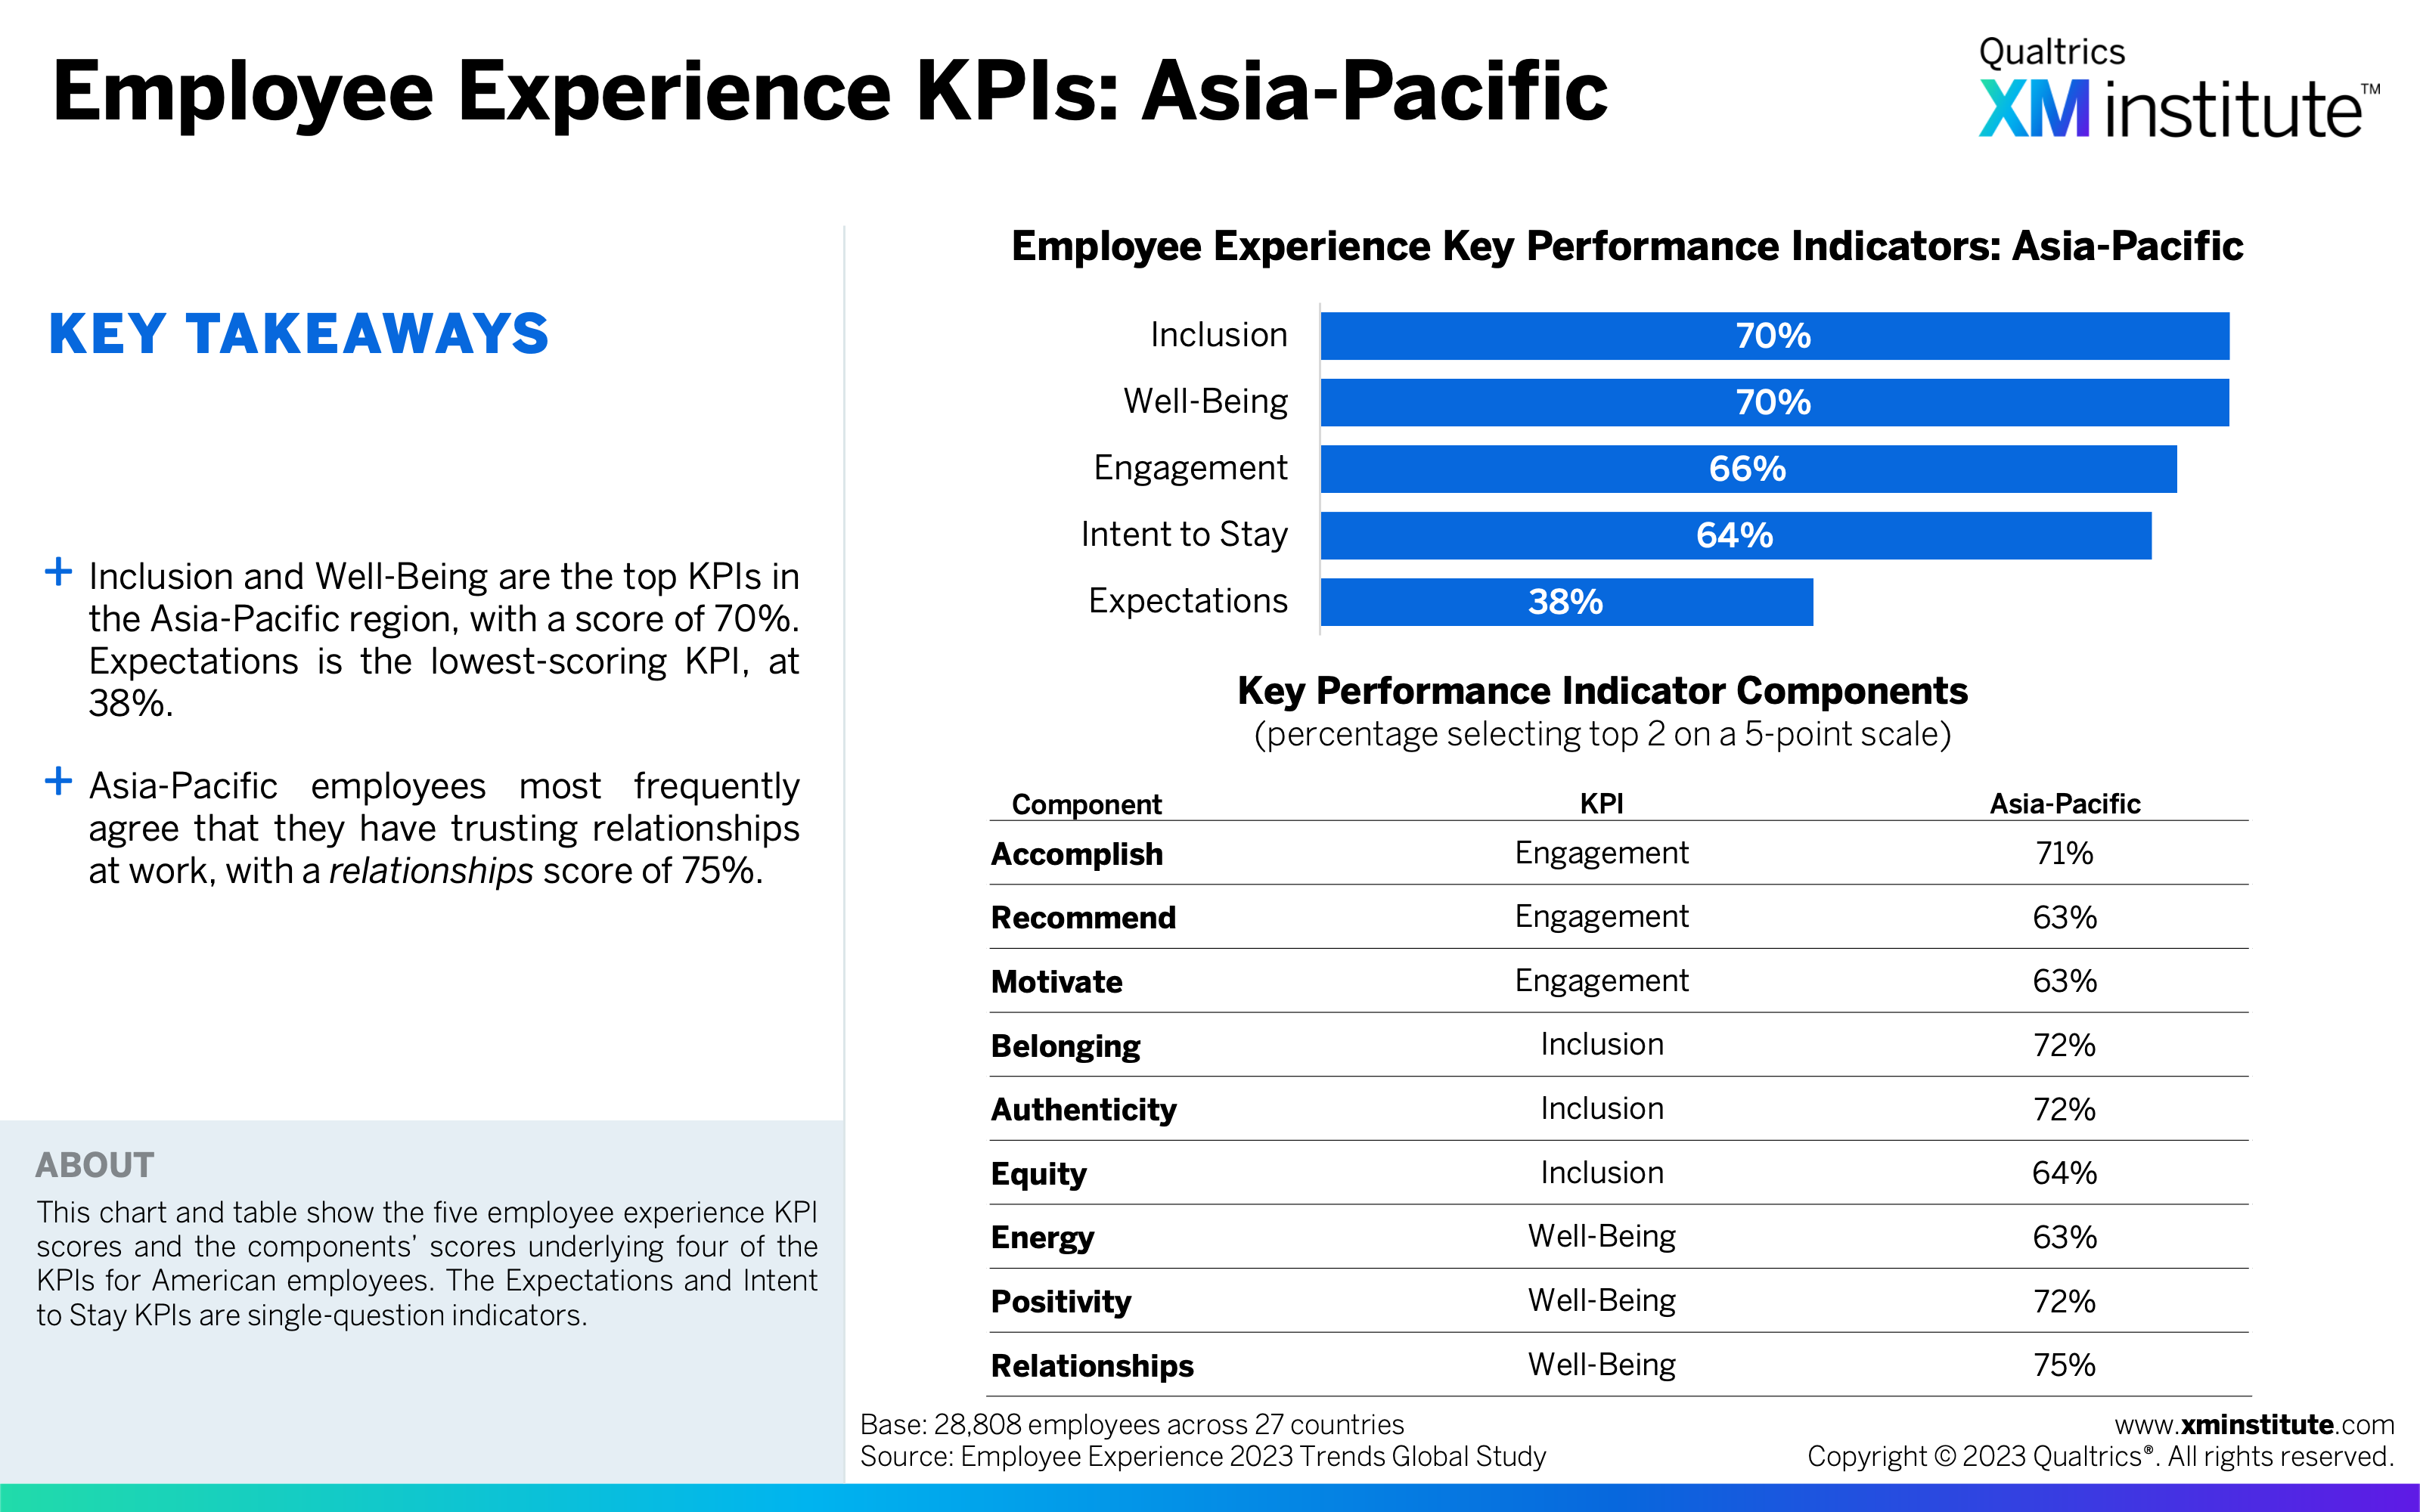
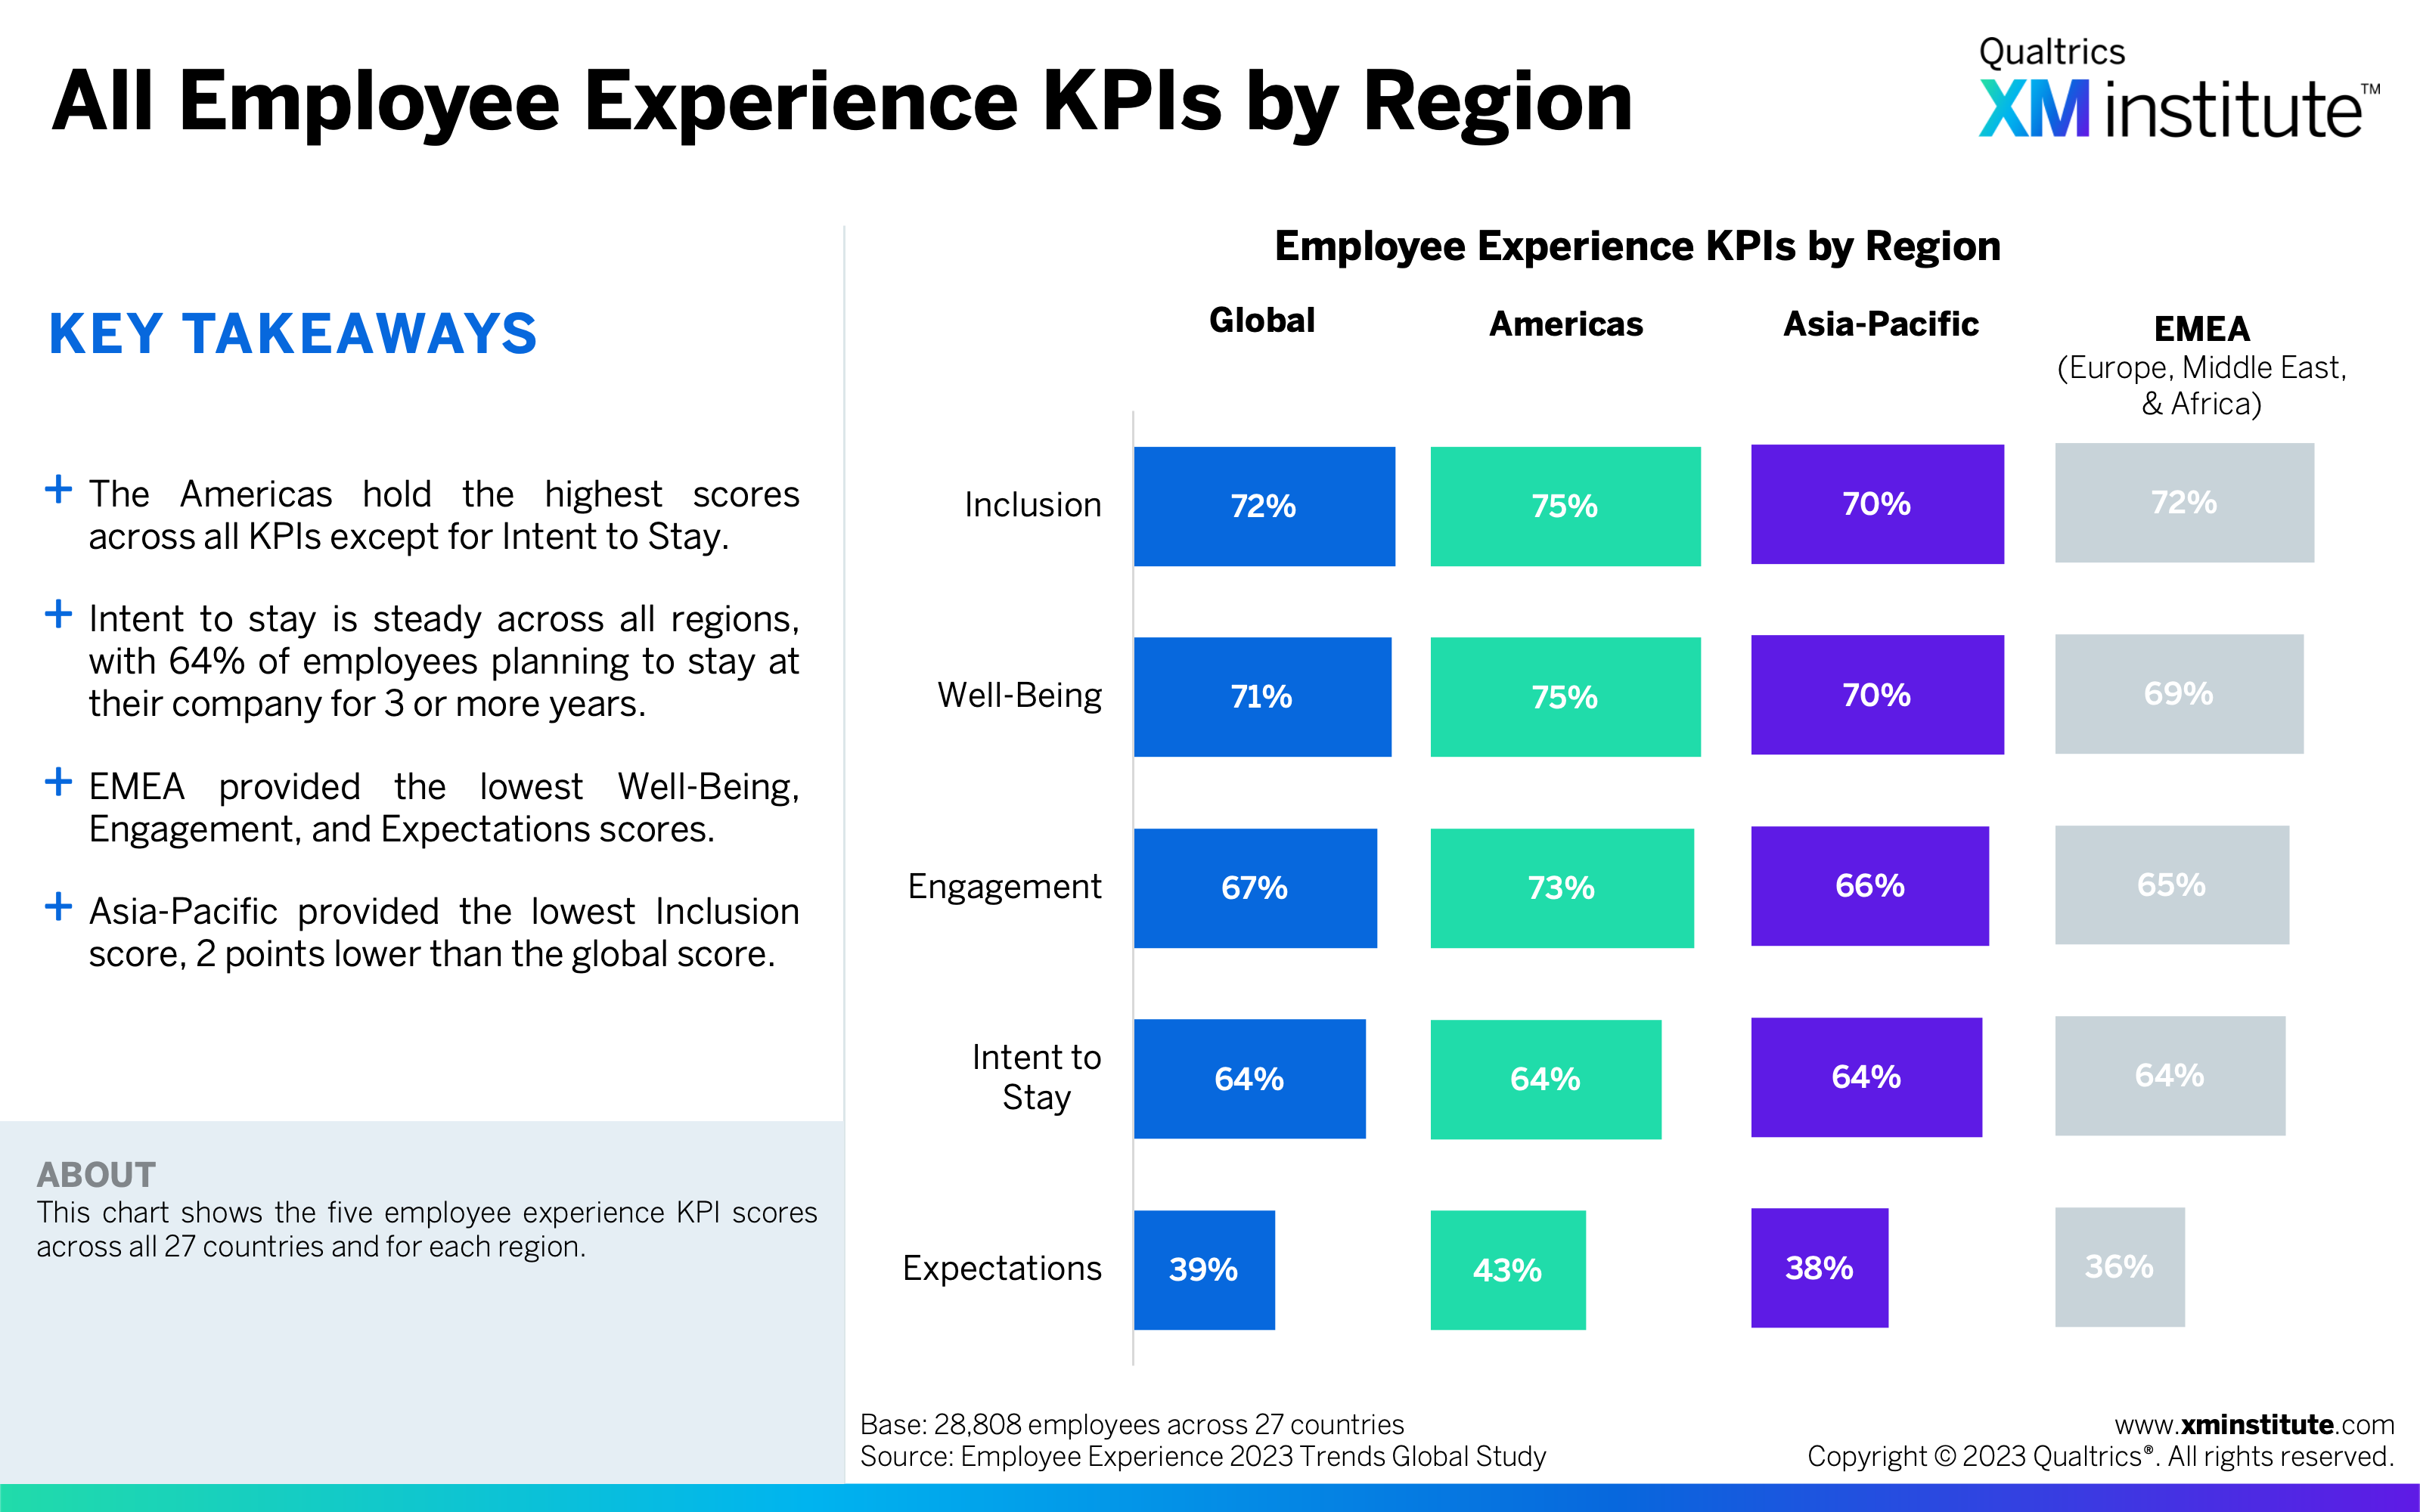
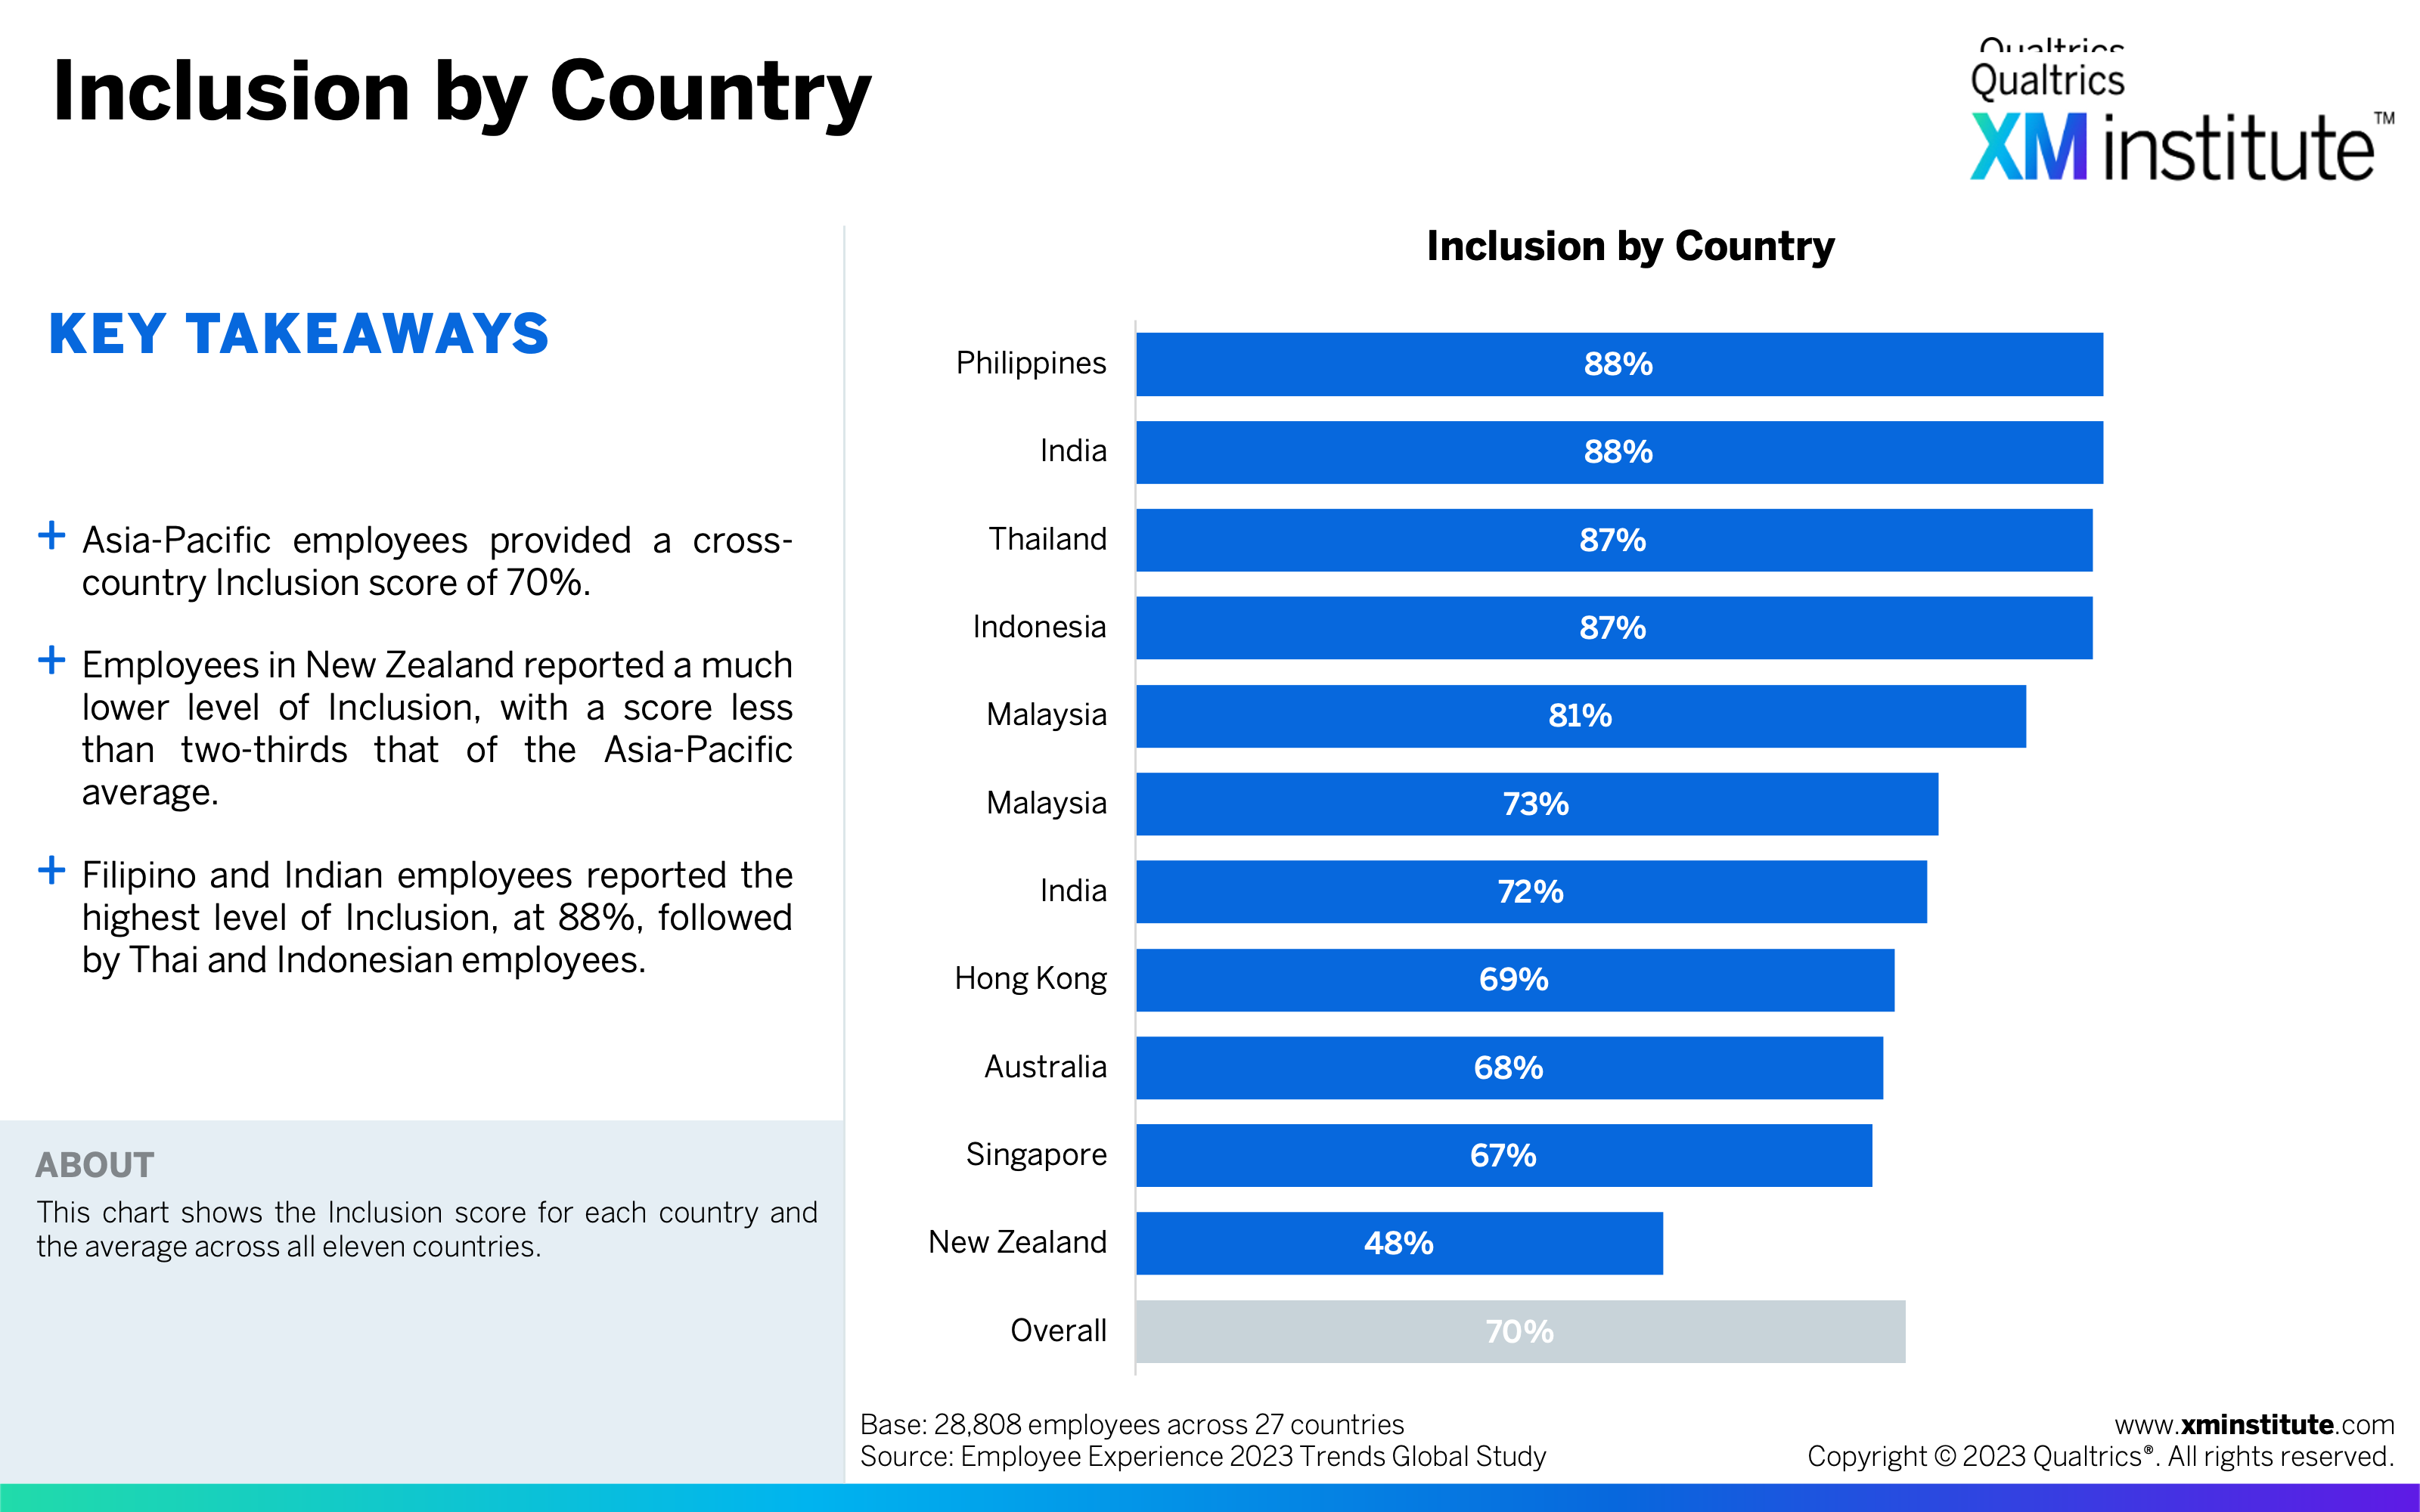
- Asia-Pacific has the lowest Inclusion score of all regions. Asia-Pacific countries provided an Inclusion score of 70%, two points lower than the global aggregate. This lower score was driven by fewer employees agreeing that they can be themself at work and that everyone can succeed to their full potential no matter who they are.
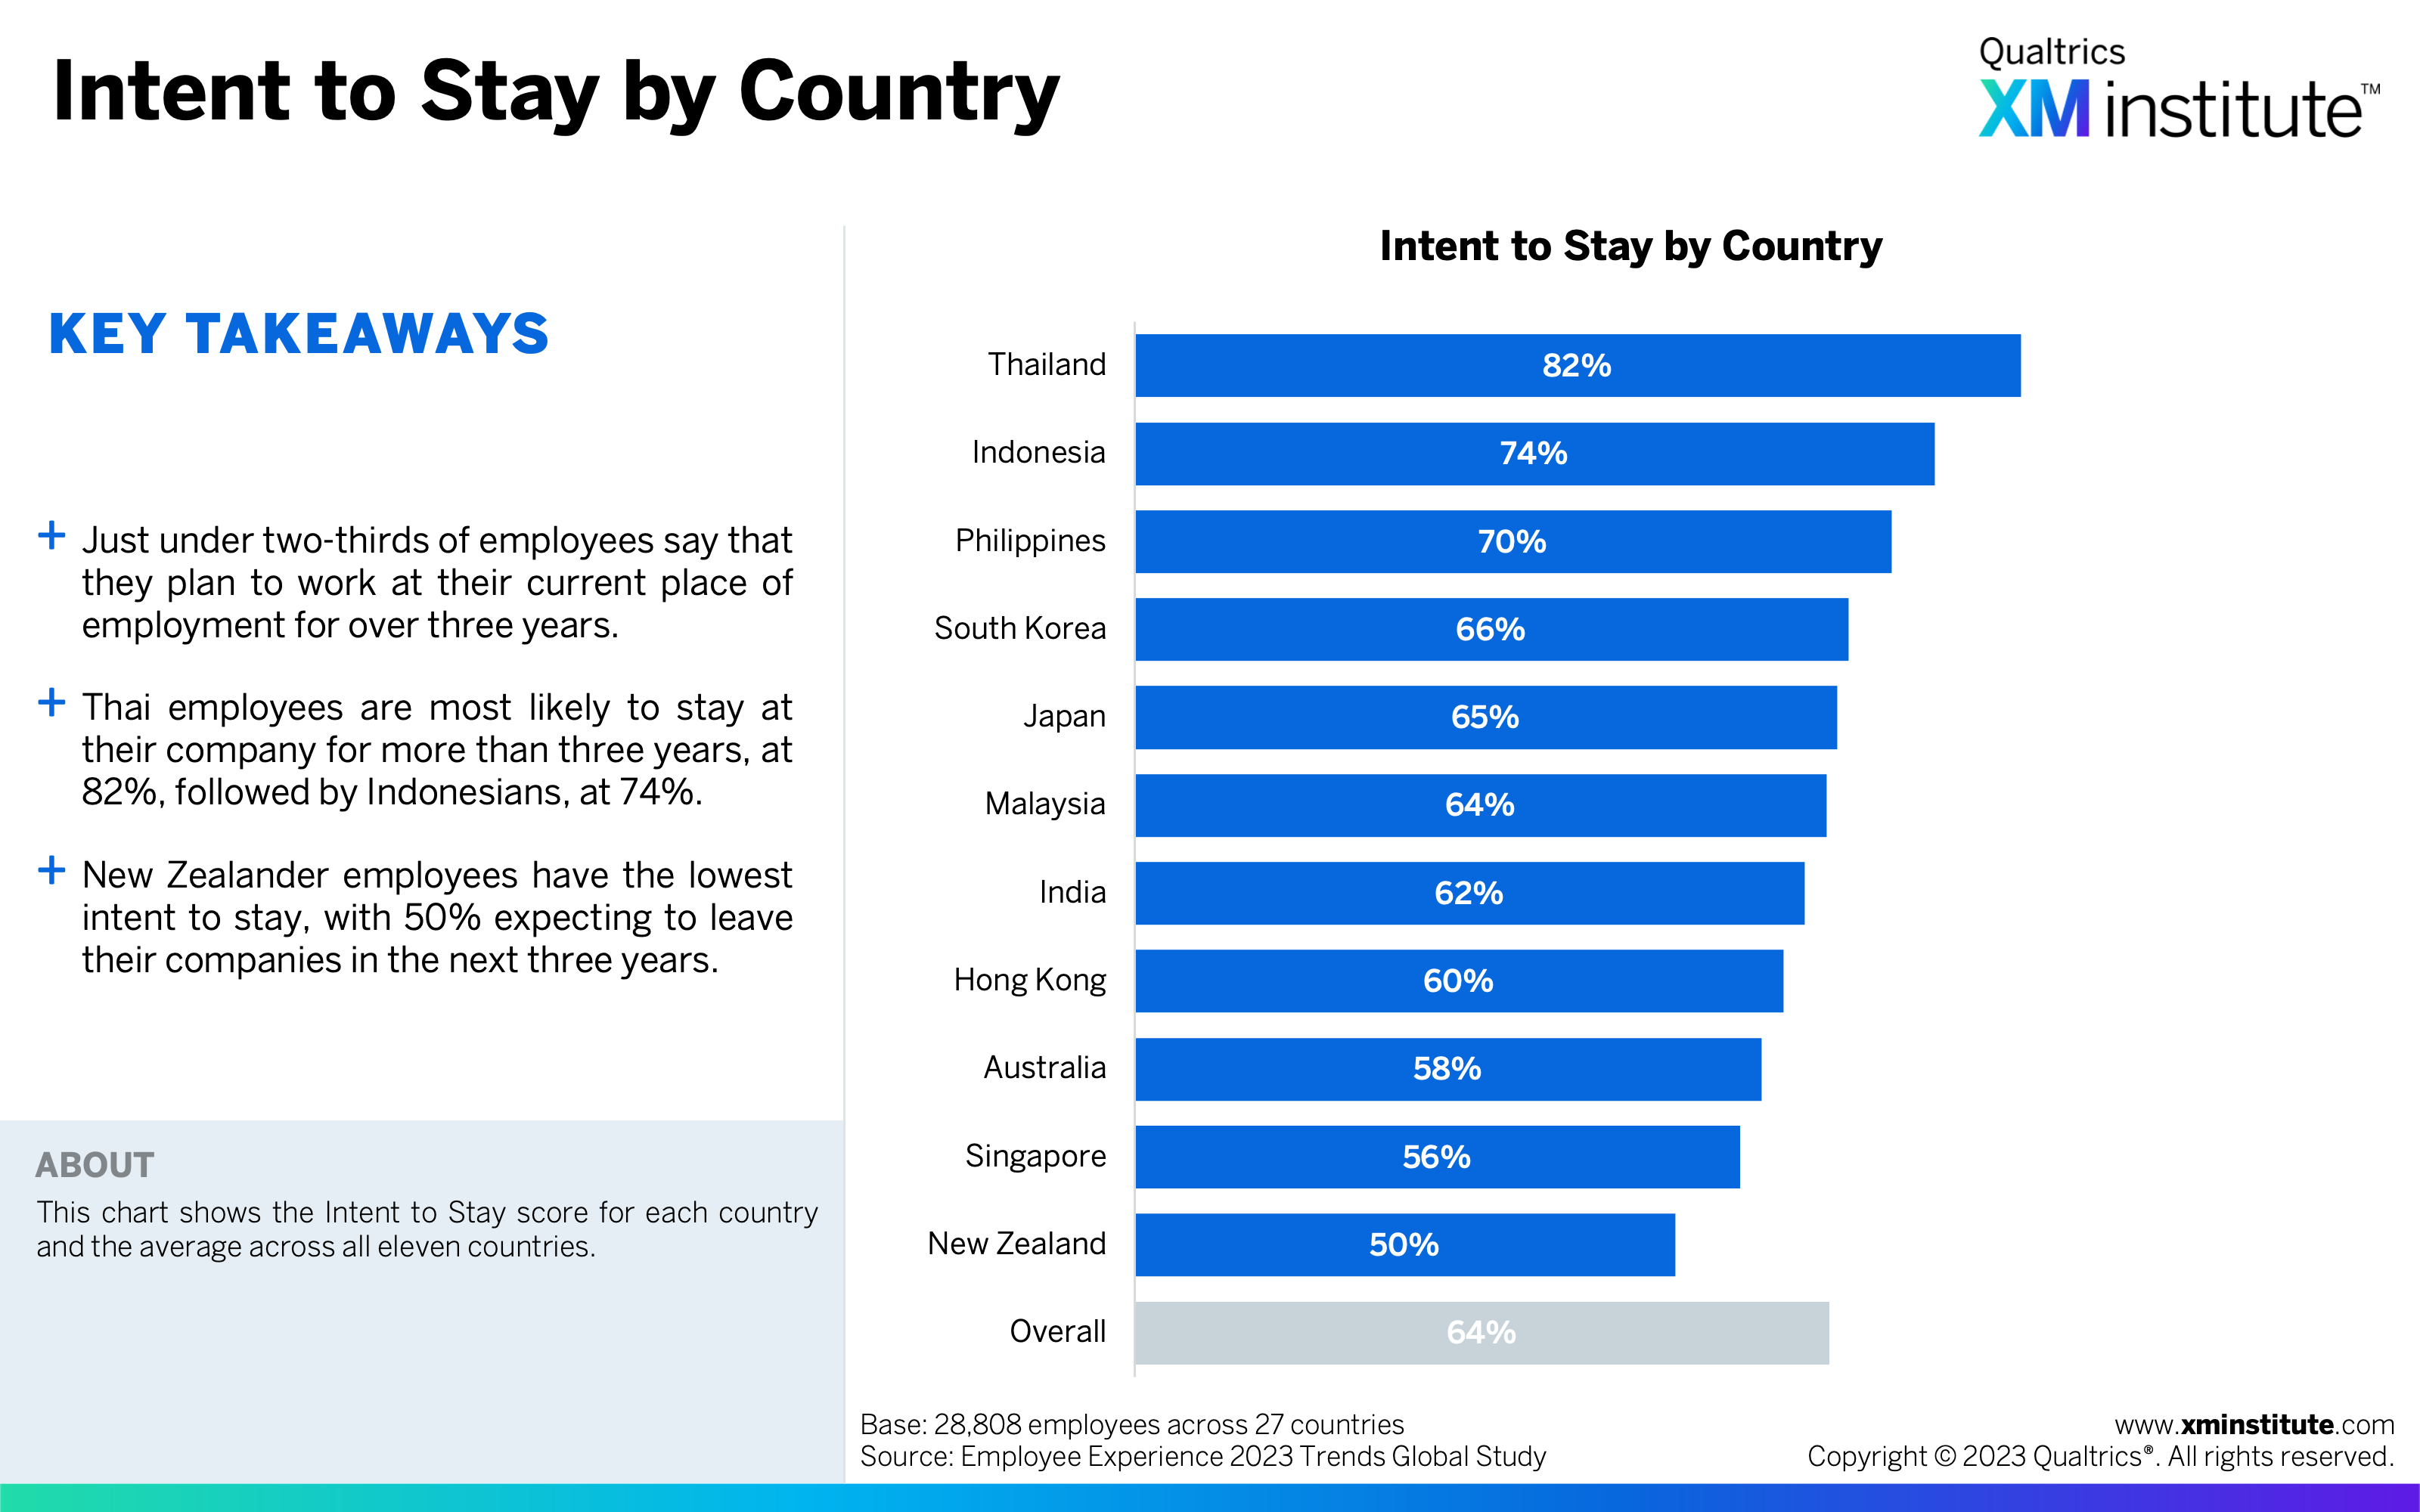
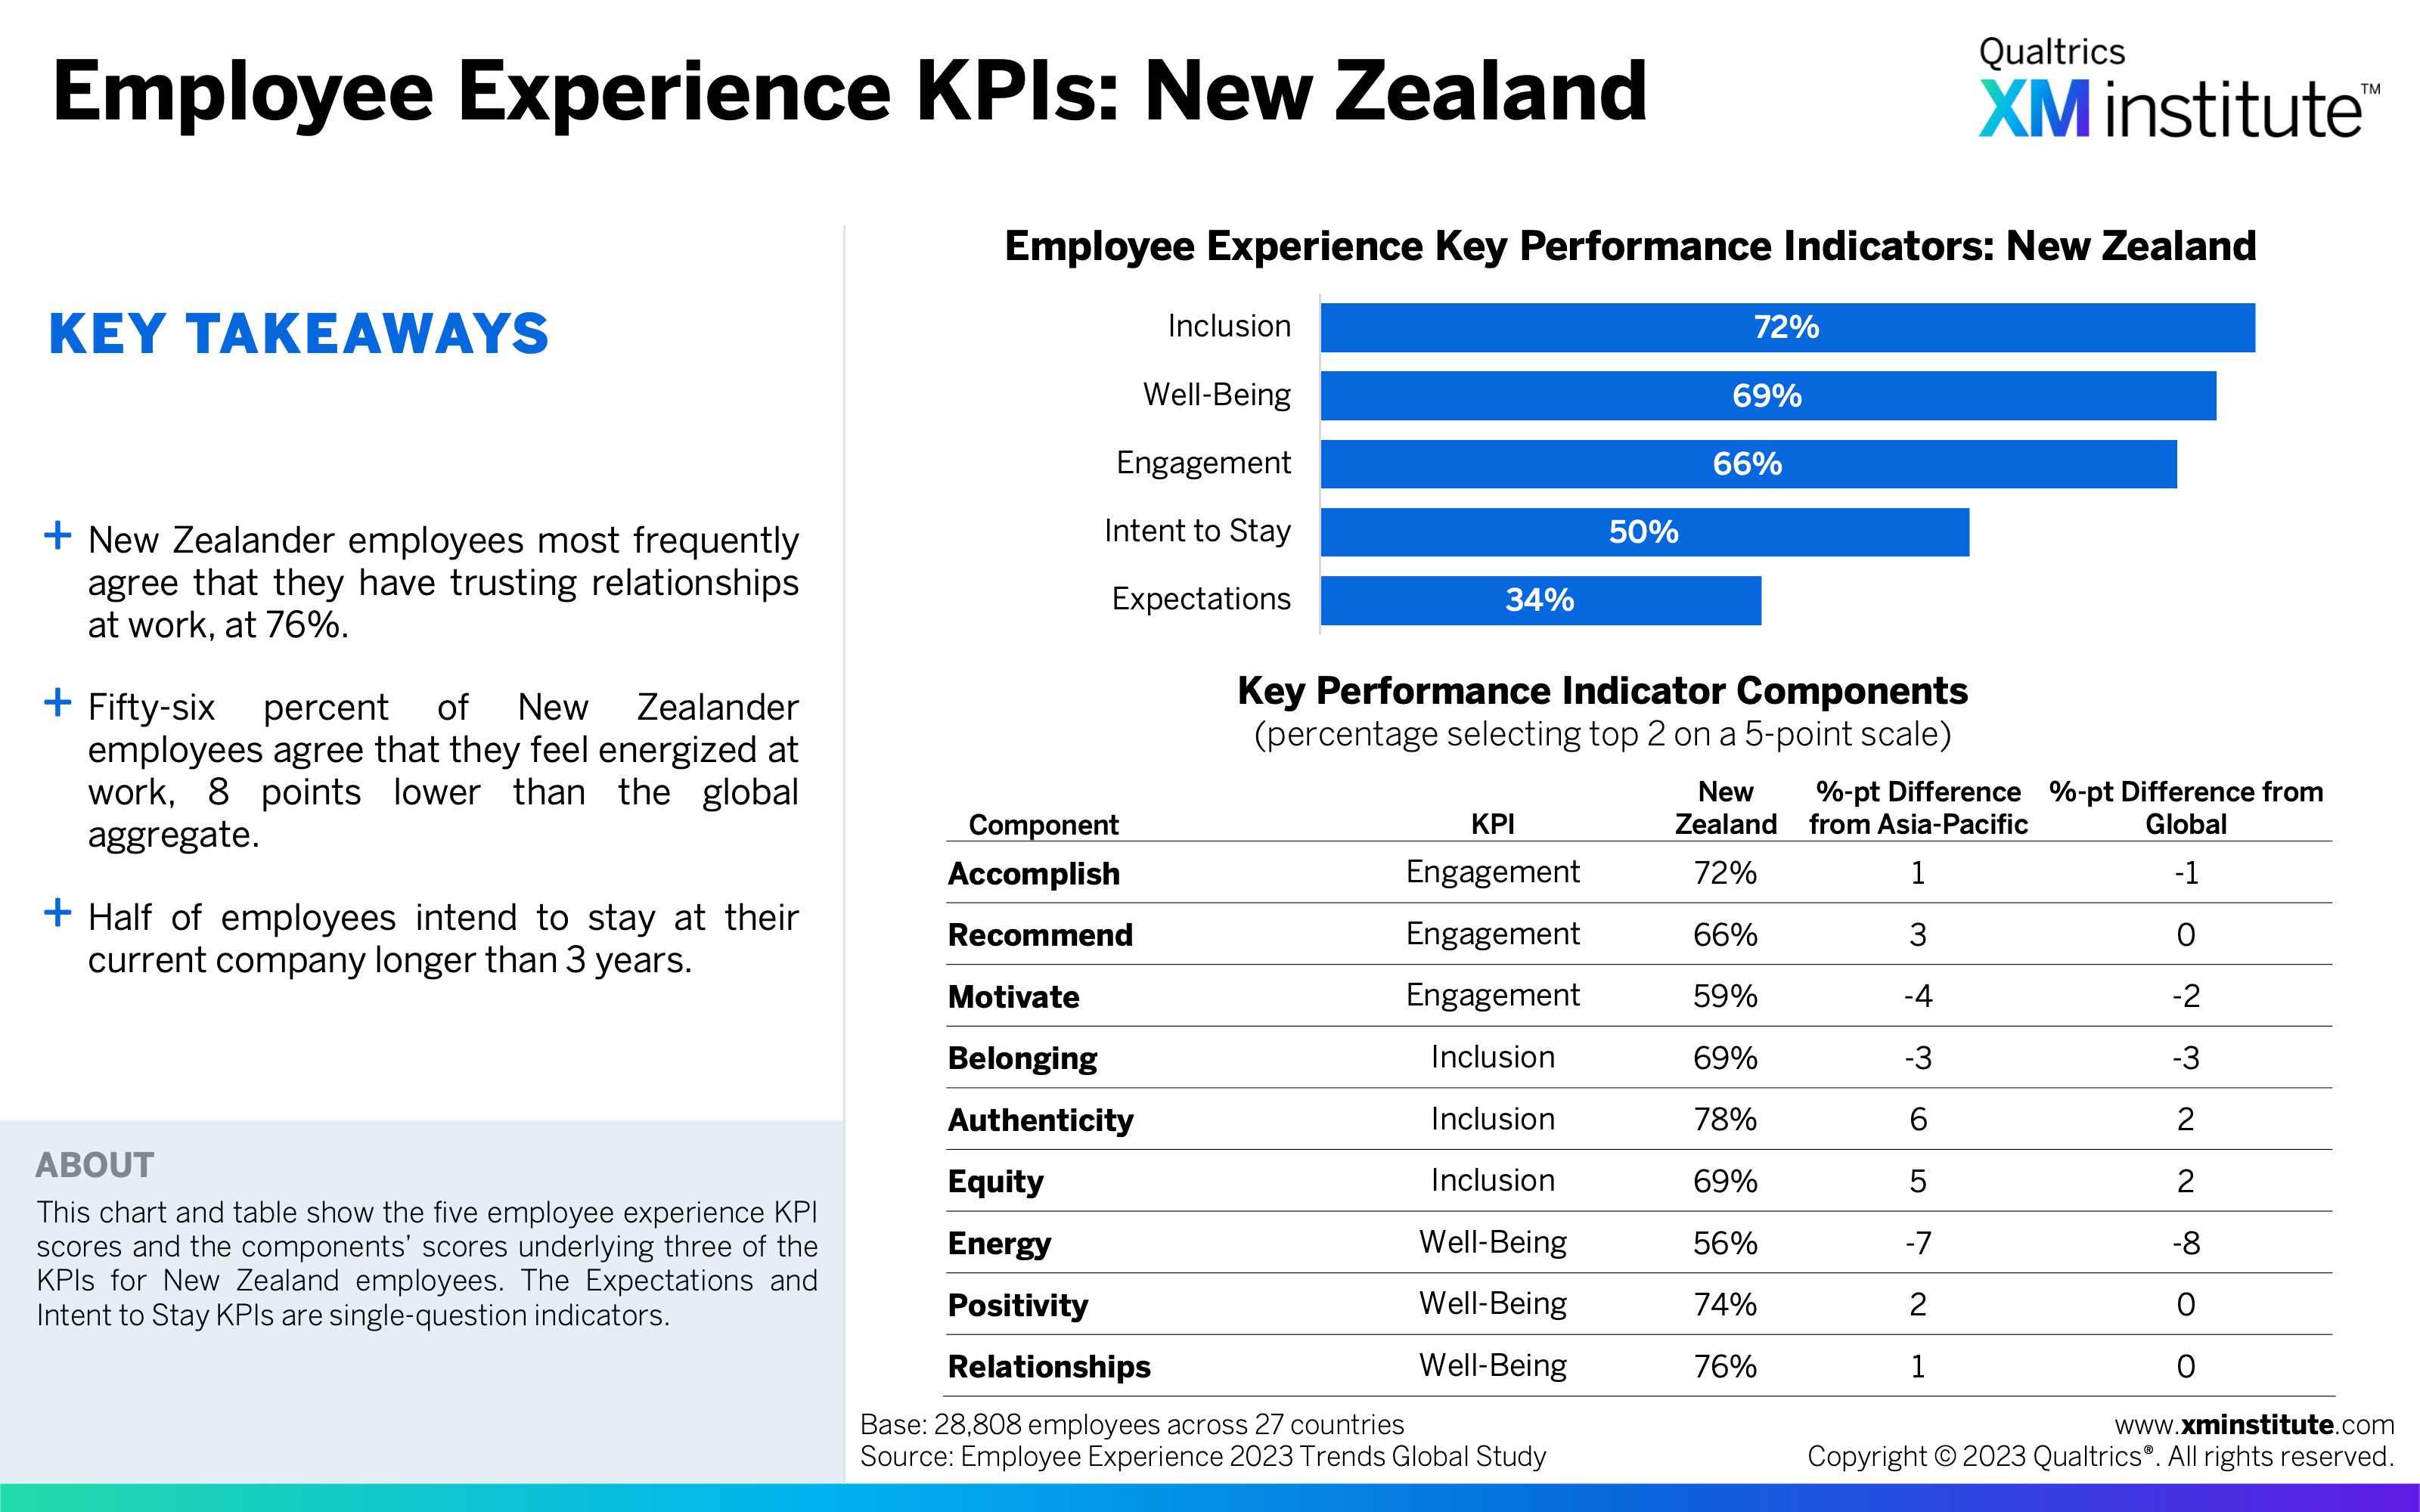
- One-third of the Asia-Pacific workforce intends to leave their company in the next three years. Intent to stay longer than three years is lowest among New Zealand employees, at 50%, and Singaporean employees, at 56%. Thai employees are most likely to stay at their company longer than 3 years, with 82% saying as much.
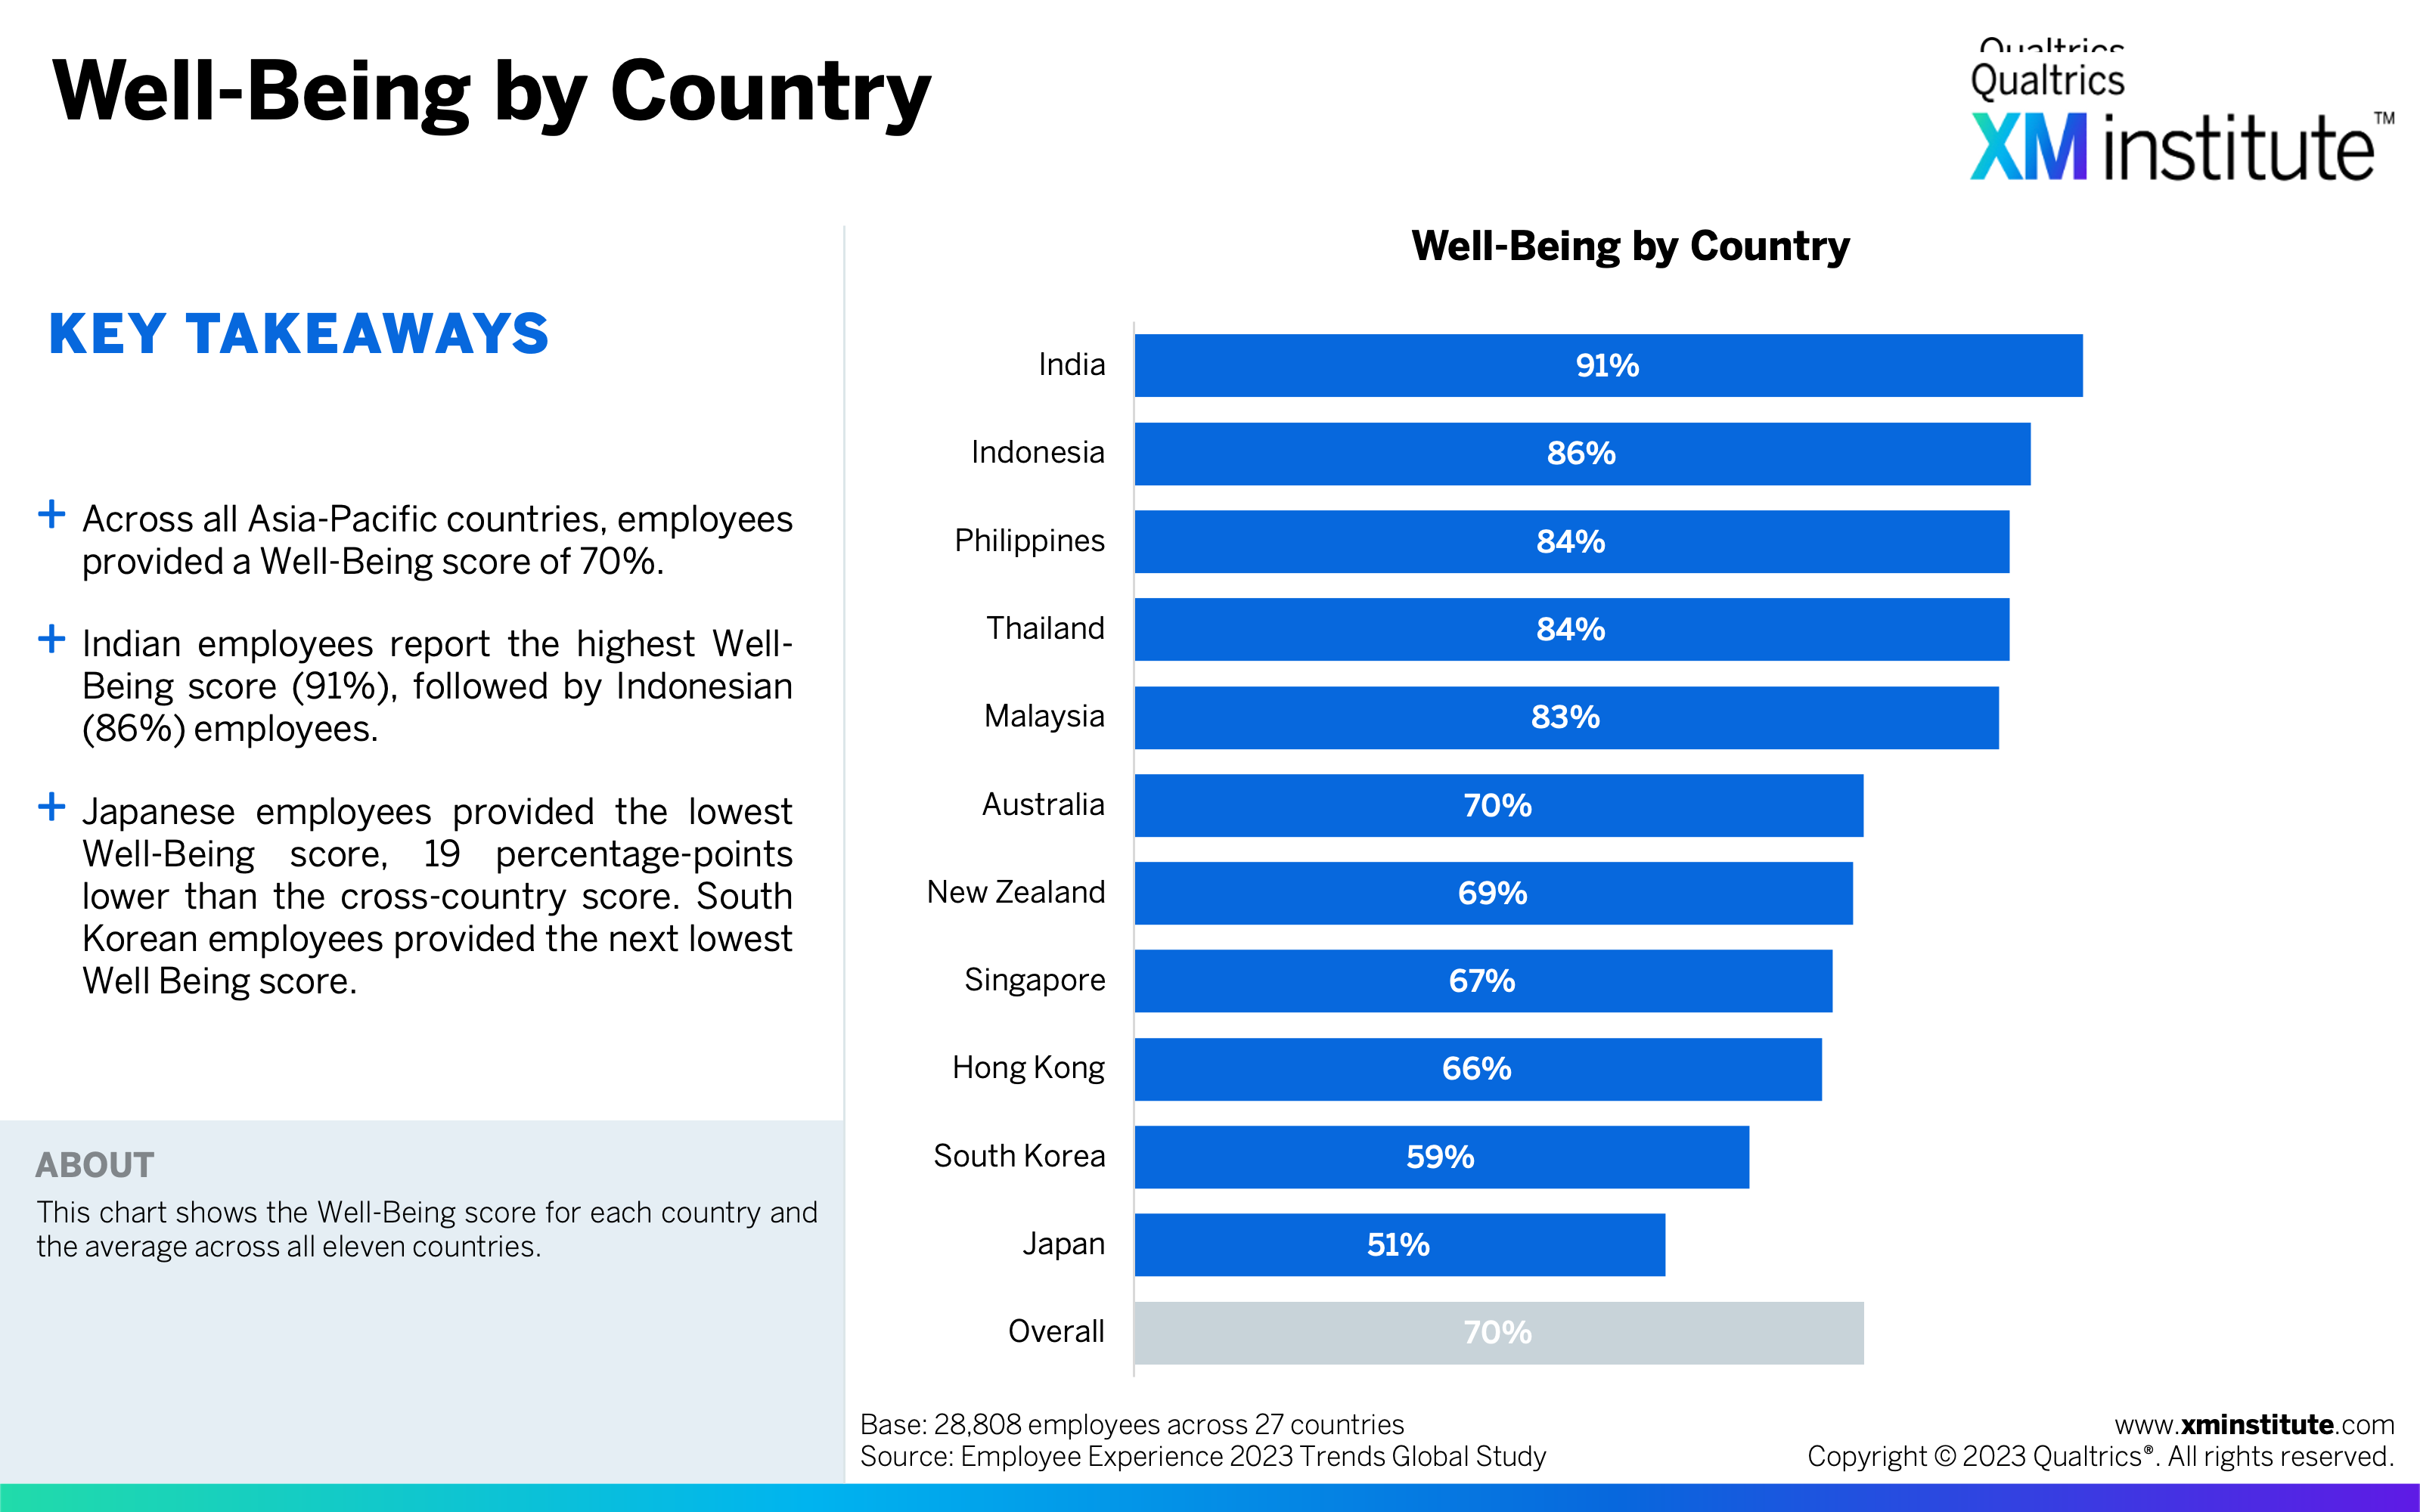
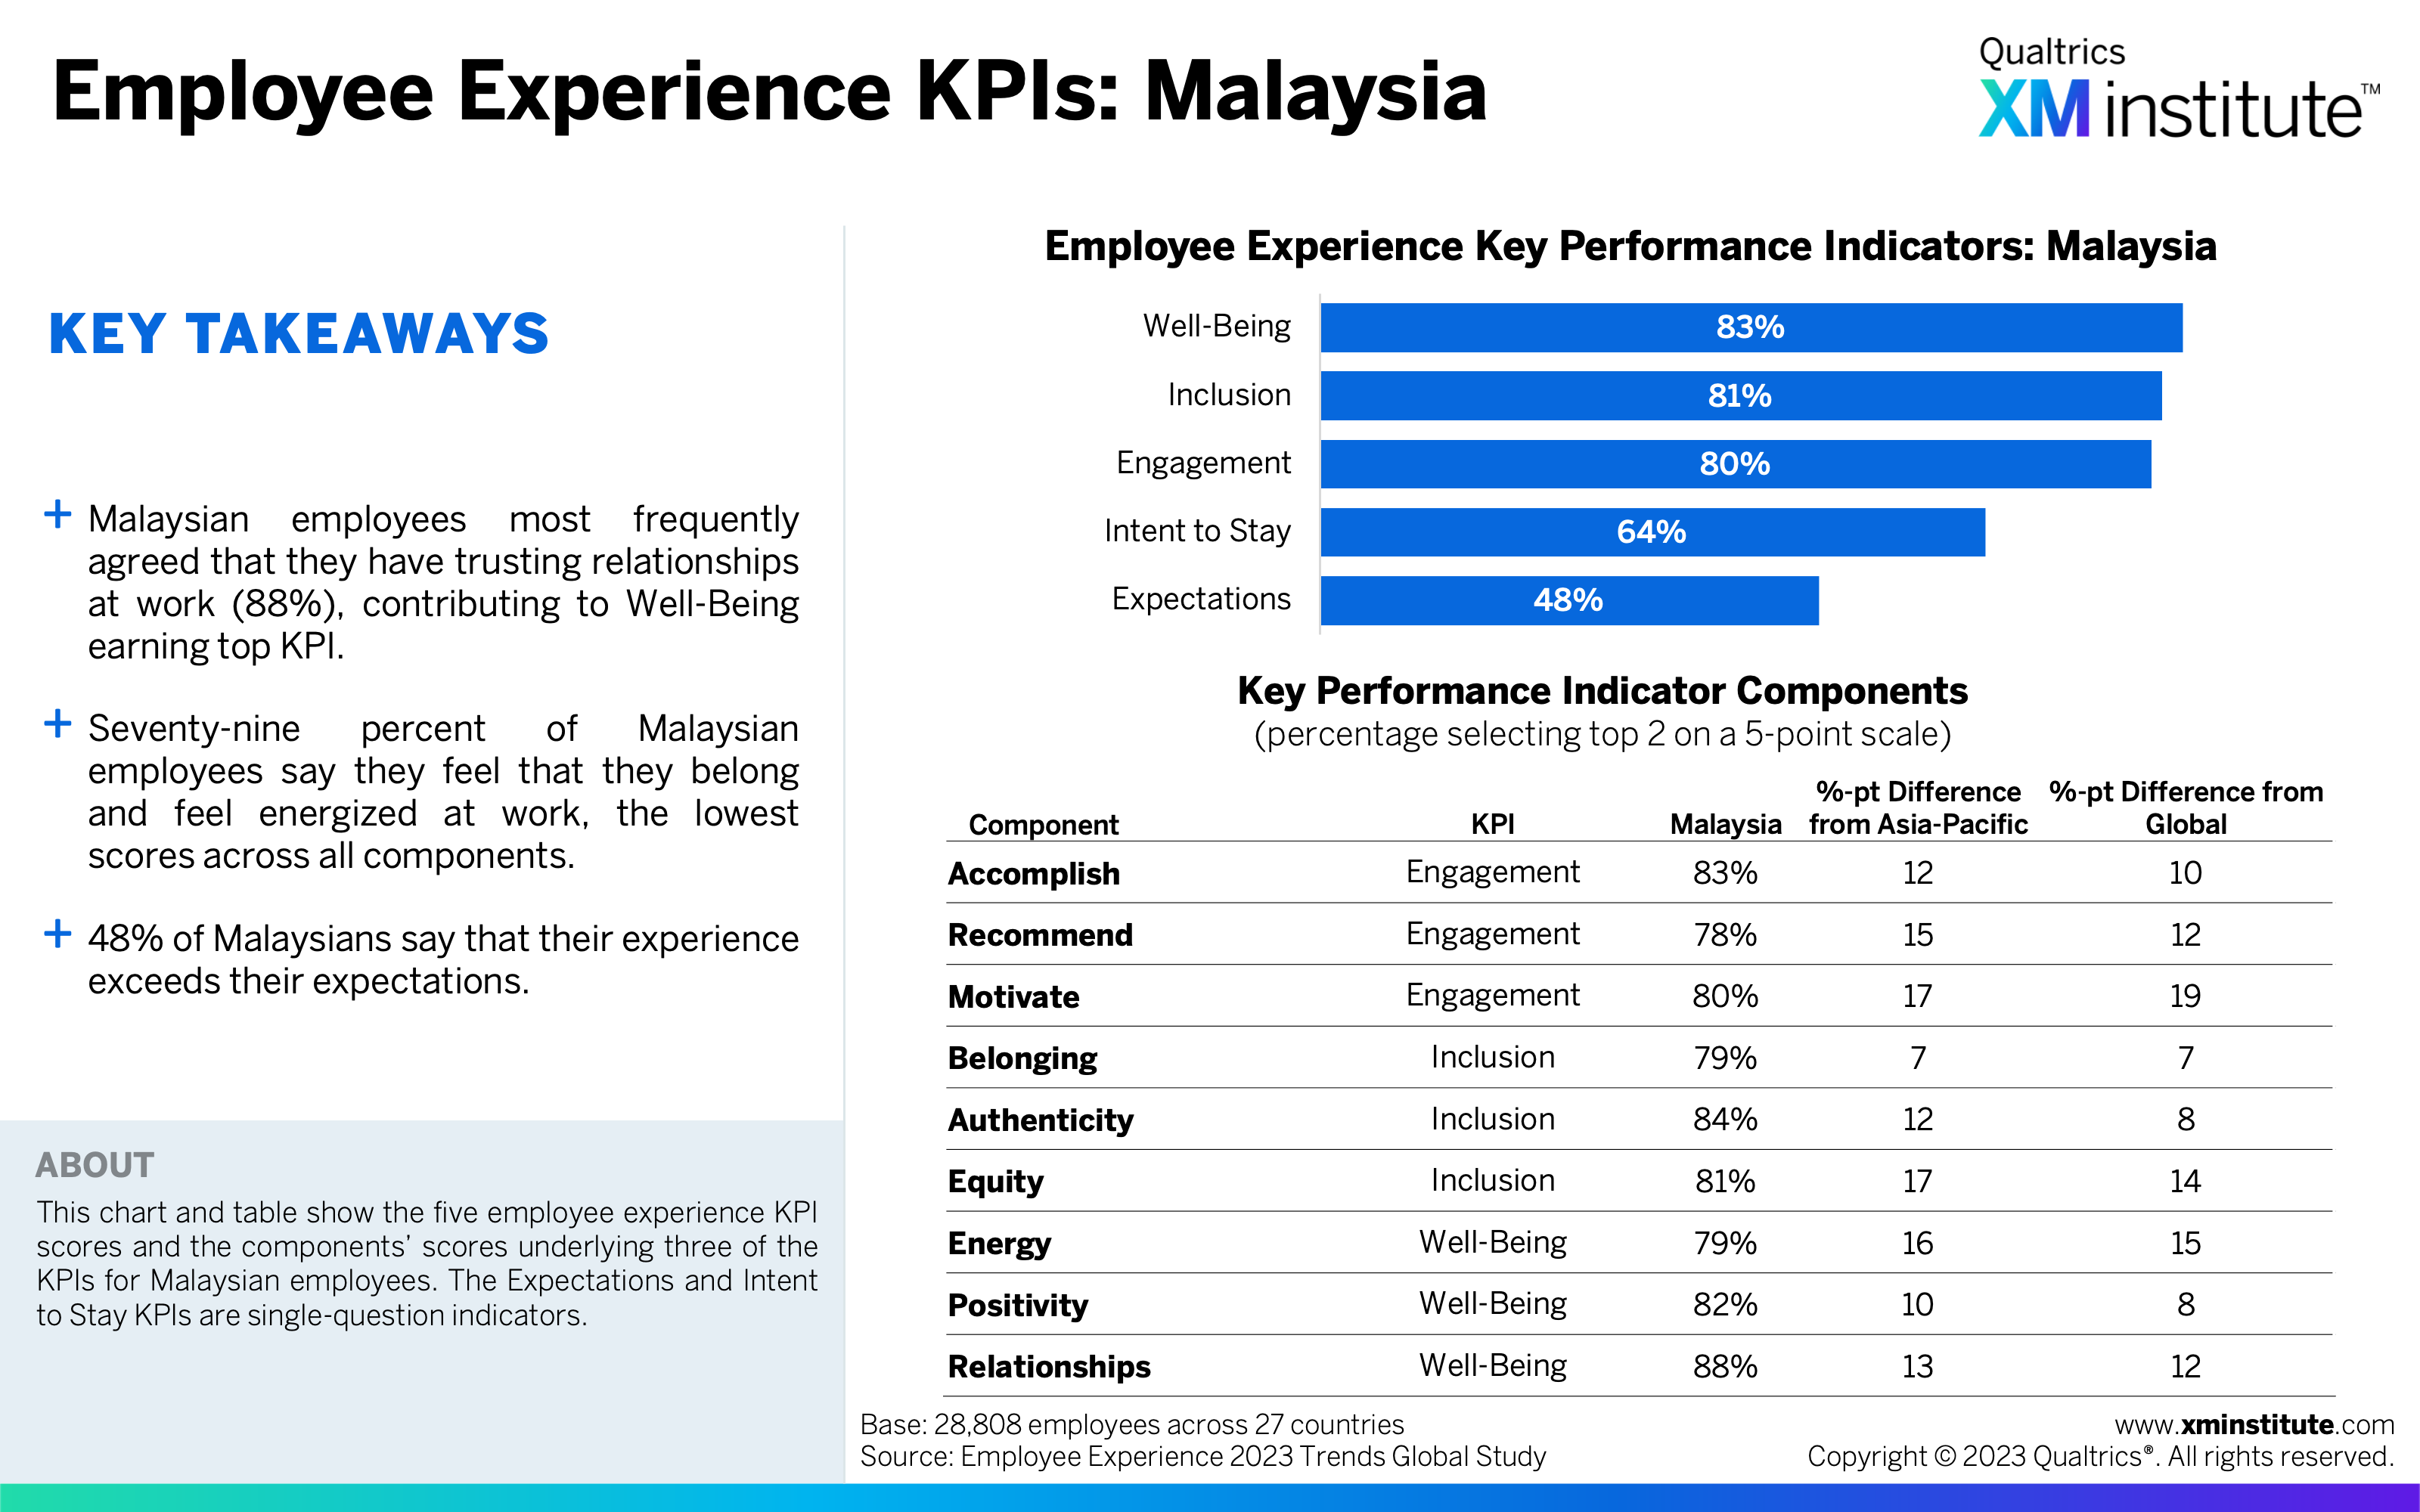
- Asia-Pacific employees have good working relationships. At 75%, employees in this region most frequently agree that they have trusting relationships at work. Indian and Malaysian employees are most likely to have such relationships, at 91% and 88% respectively.
Figures
Here are the figures in this data snapshot:
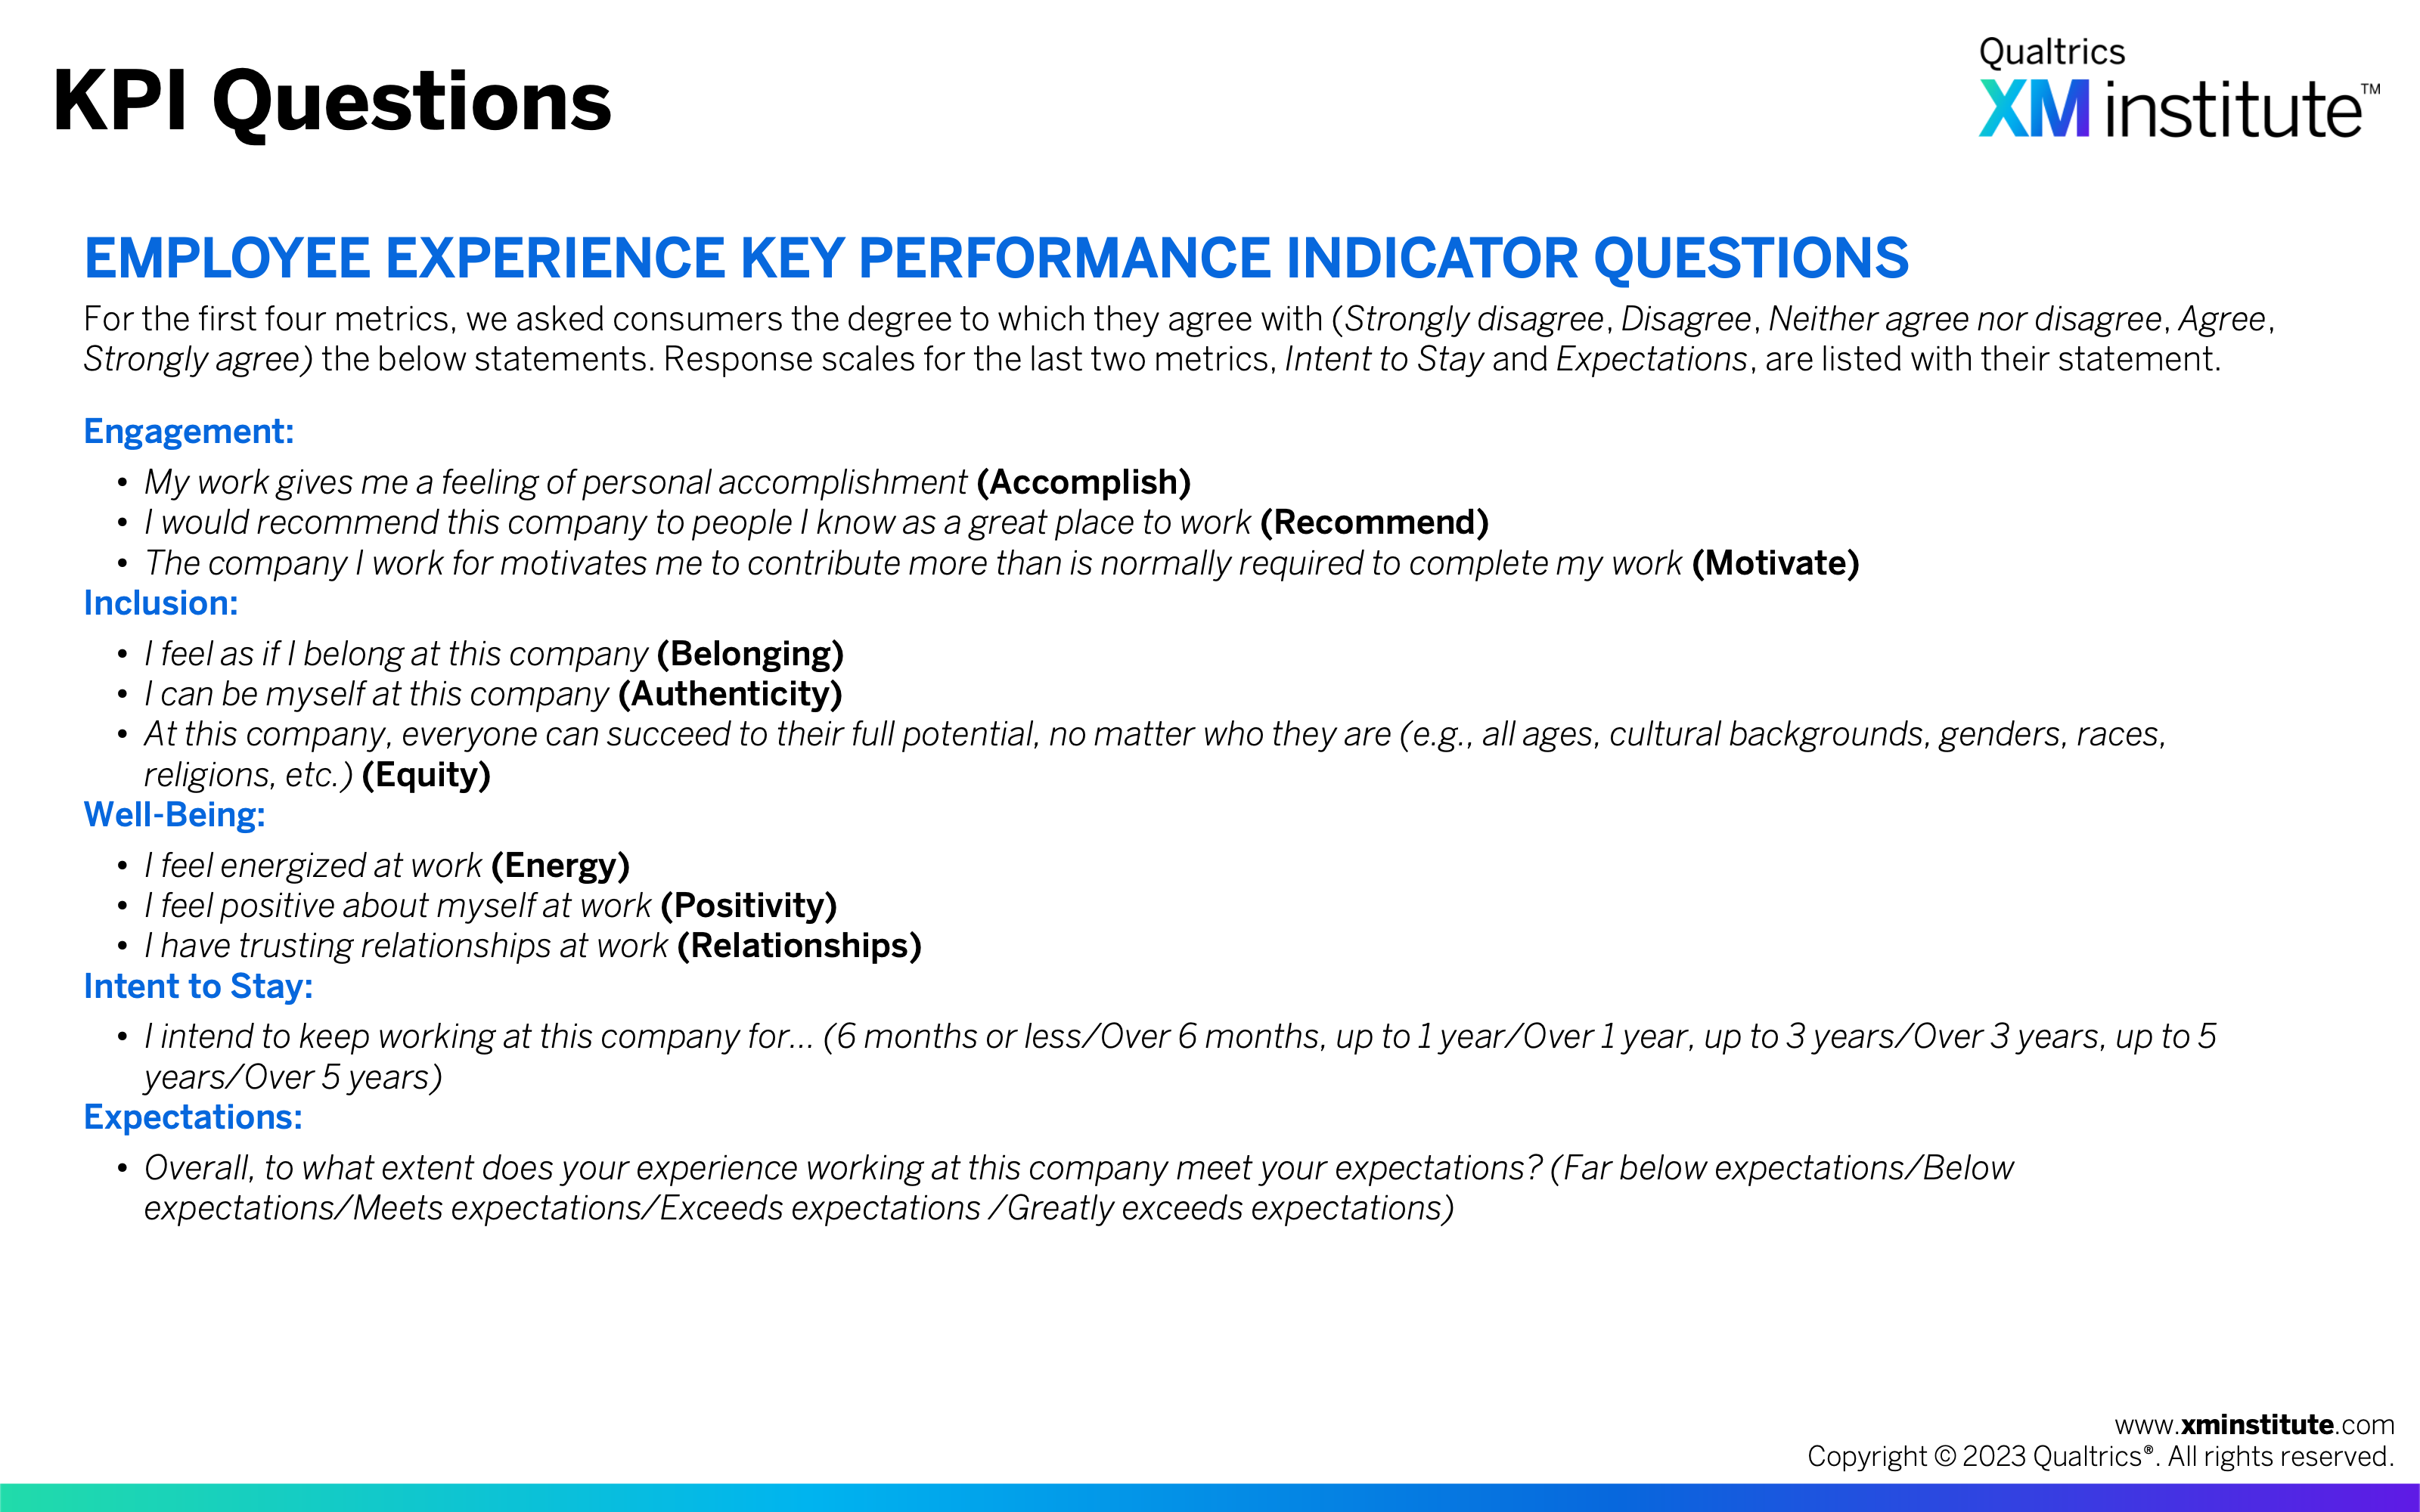
- KPI Questions (see Figure 1)
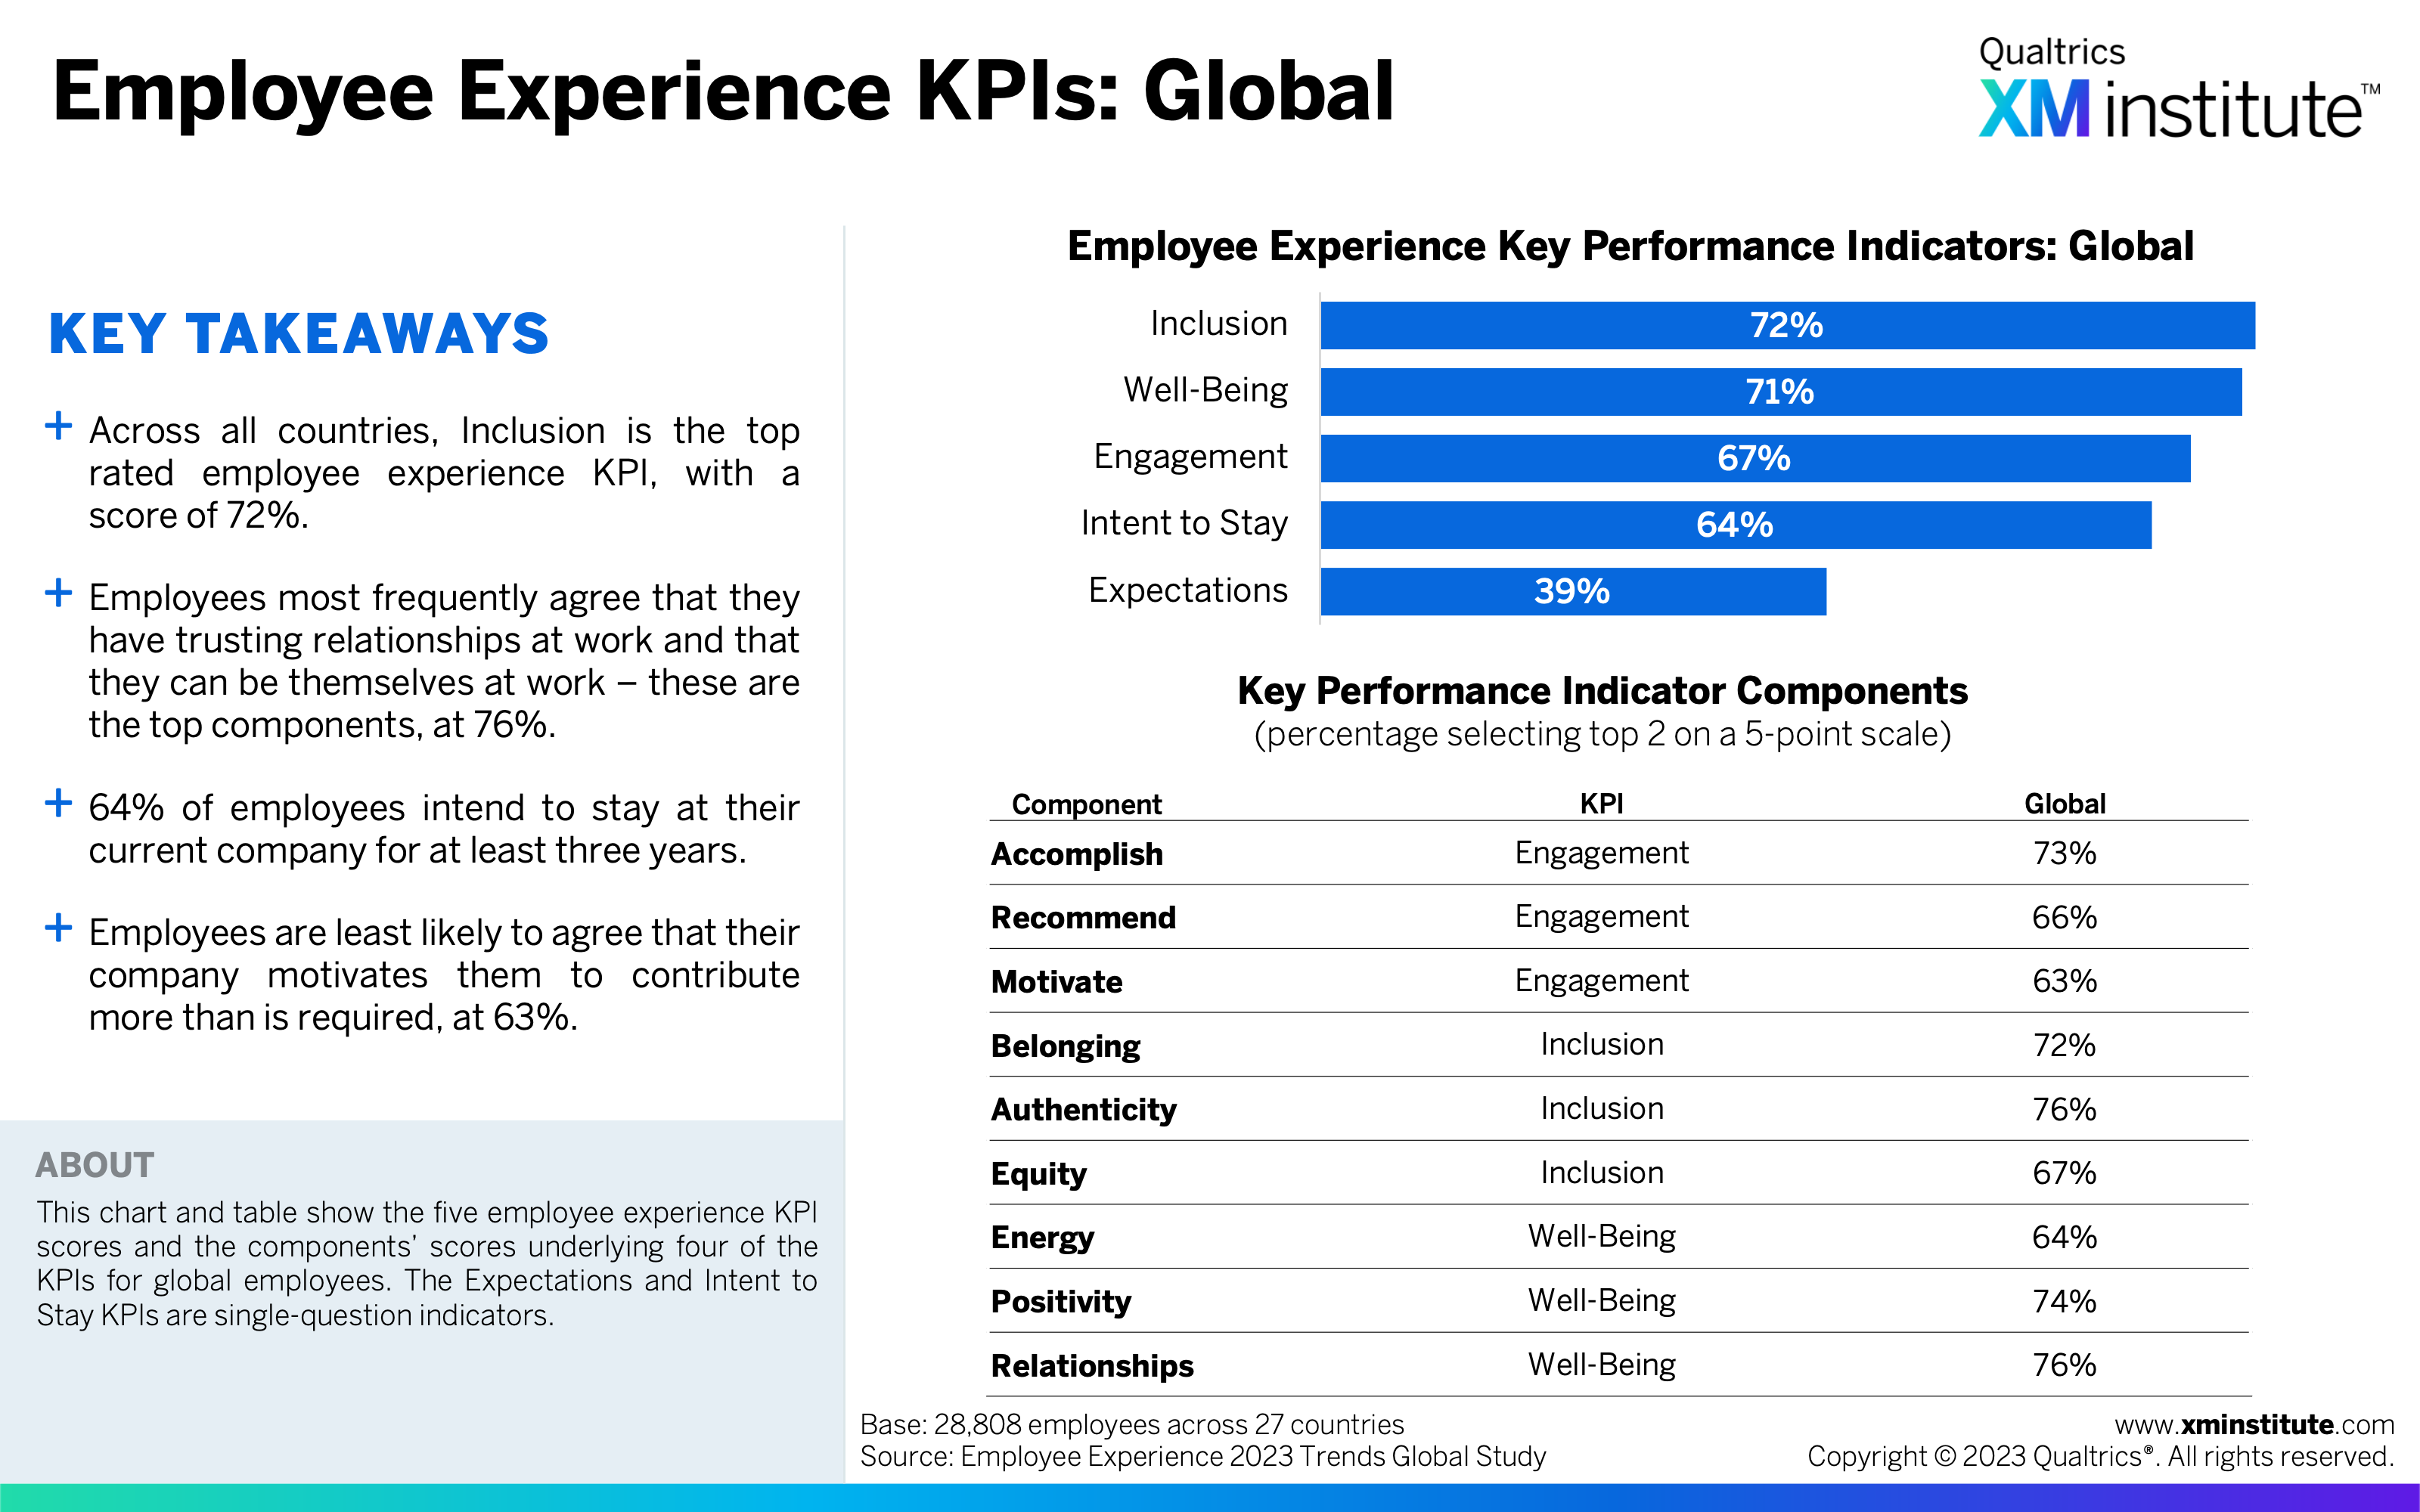
- Employee Experience KPIs: Global (see Figure 2)
- All Employee Experience KPIs by Work Level: Global (see Figure 3)
- Employee Experience KPIs: Asia-Pacific (see Figure 4)
- All Employee Experience KPIs by Work Level: Asia-Pacific (see Figure 5)
- All Employee Experience KPIs by Region (see Figure 6)
- Well-Being by Country (see Figure 7)
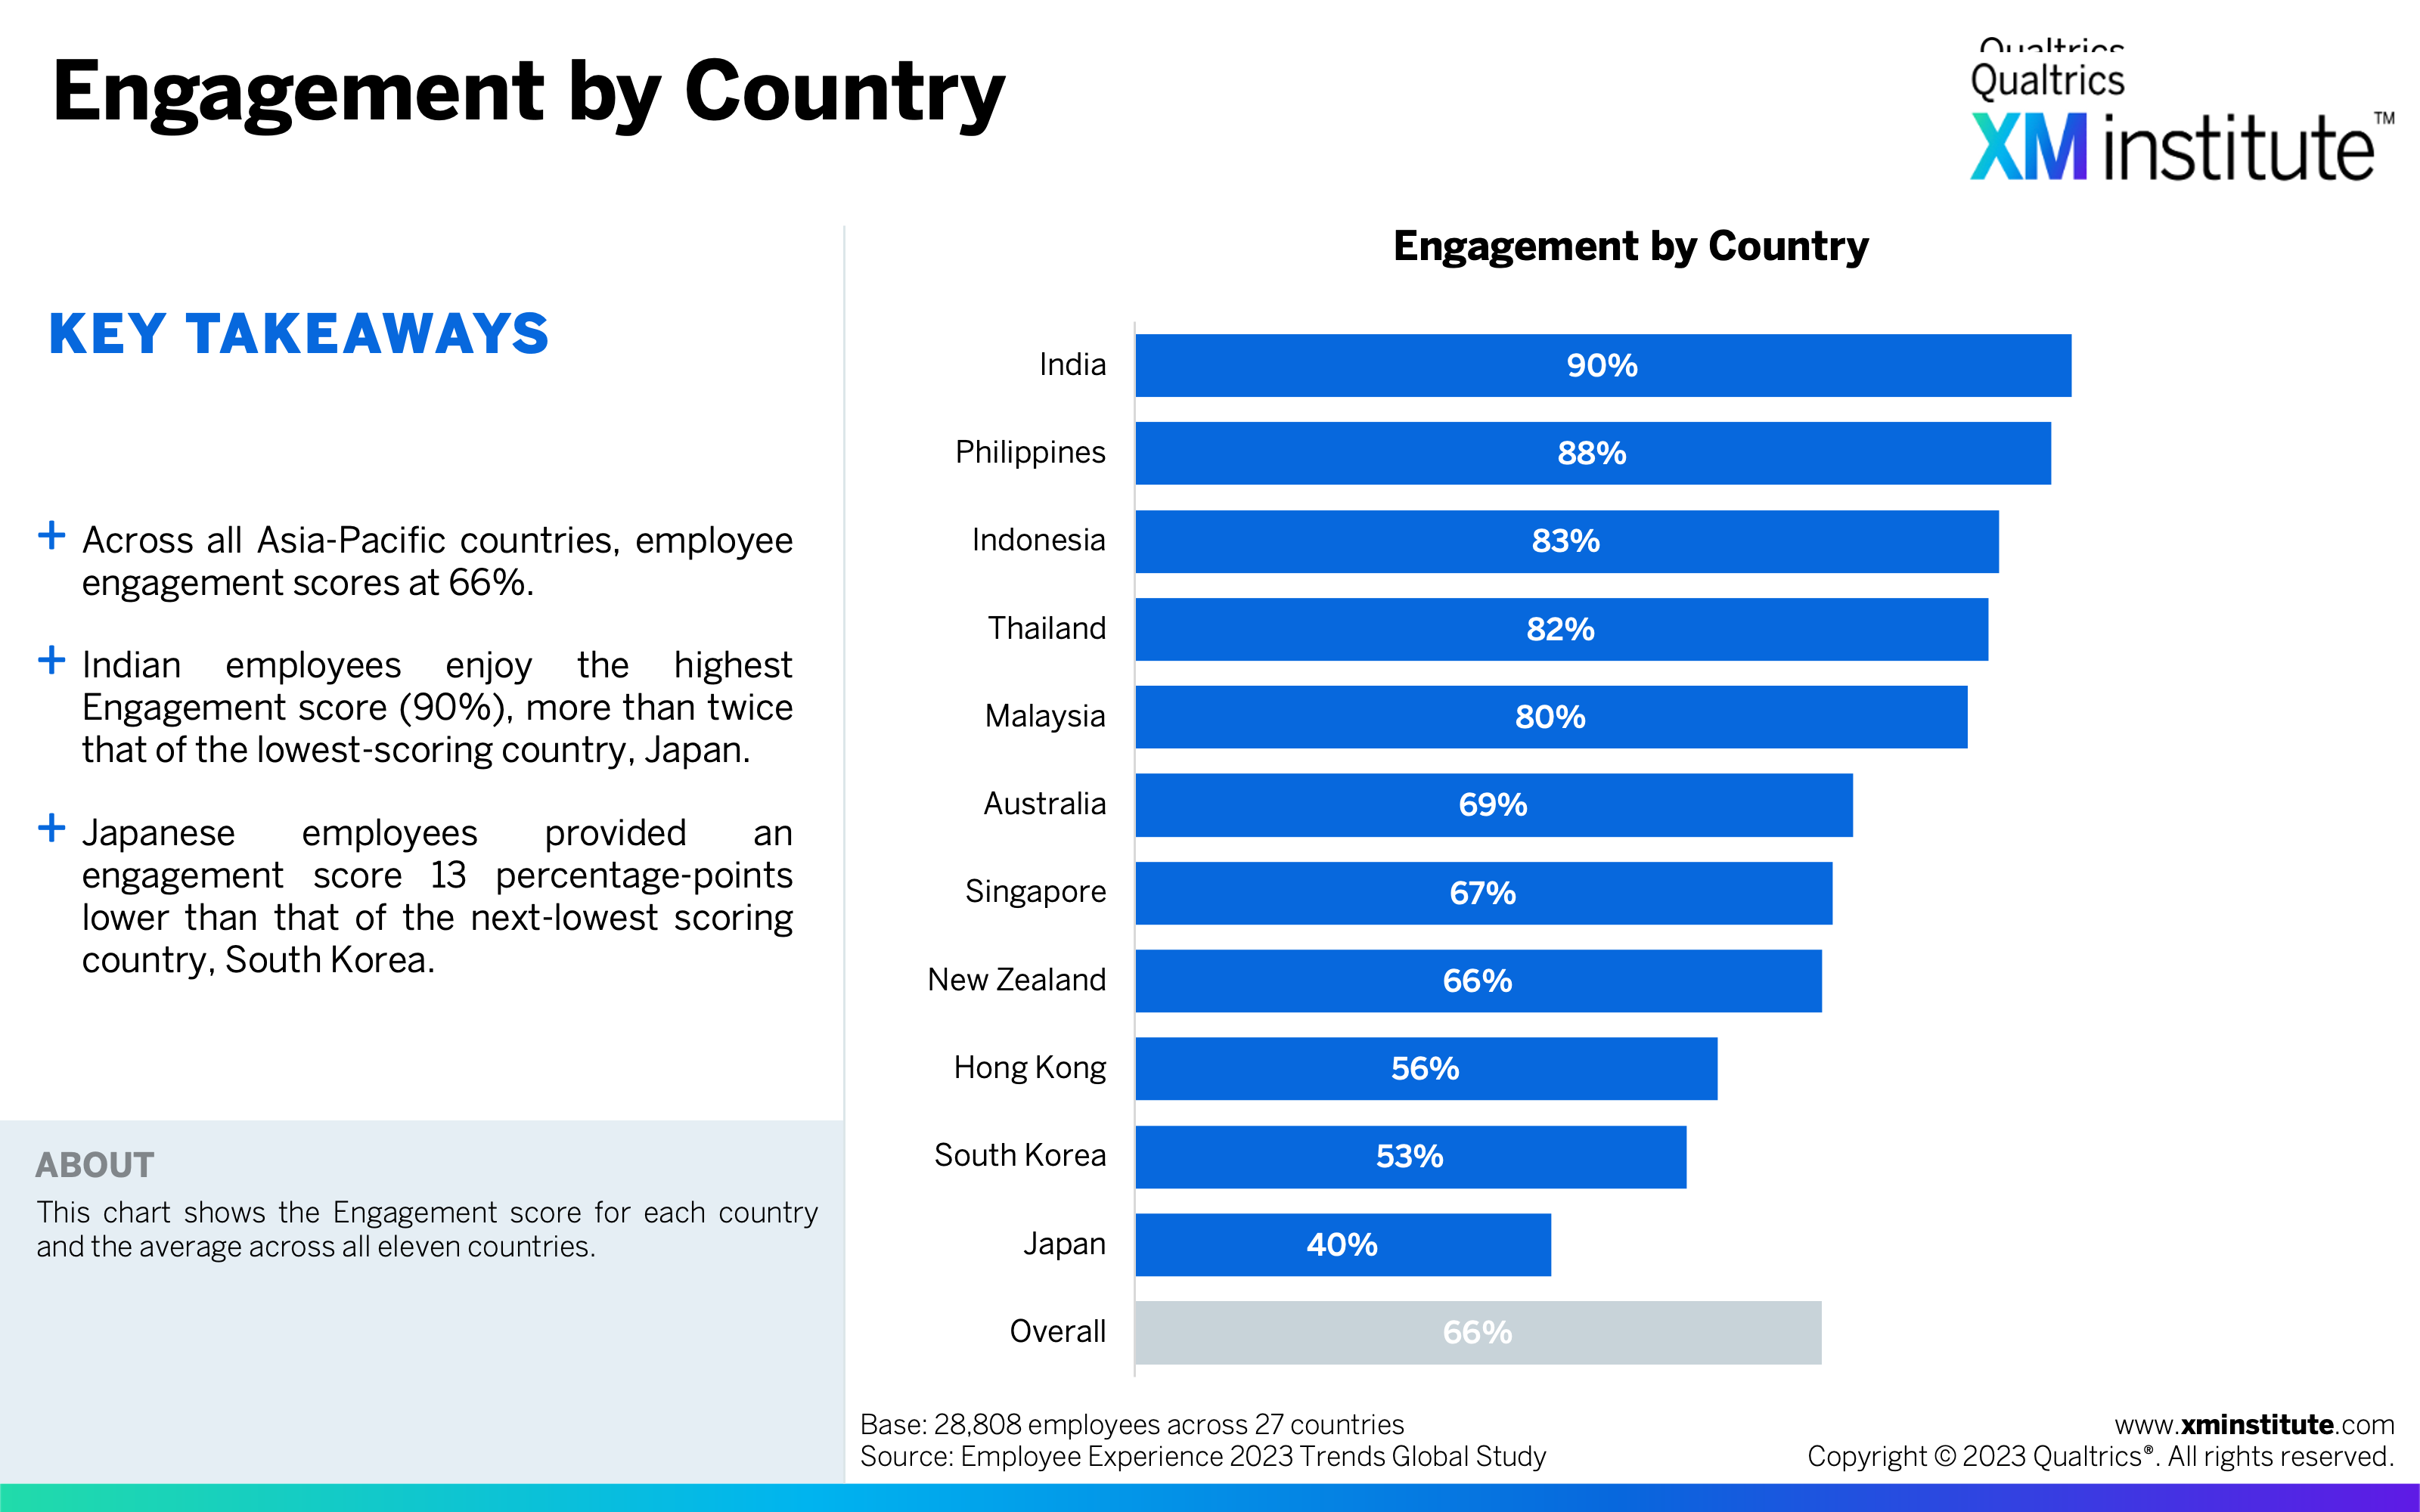
- Engagement by Country (see Figure 8)
- Intent to Stay by Country (see Figure 9)
- Inclusion by Country (see Figure 10)
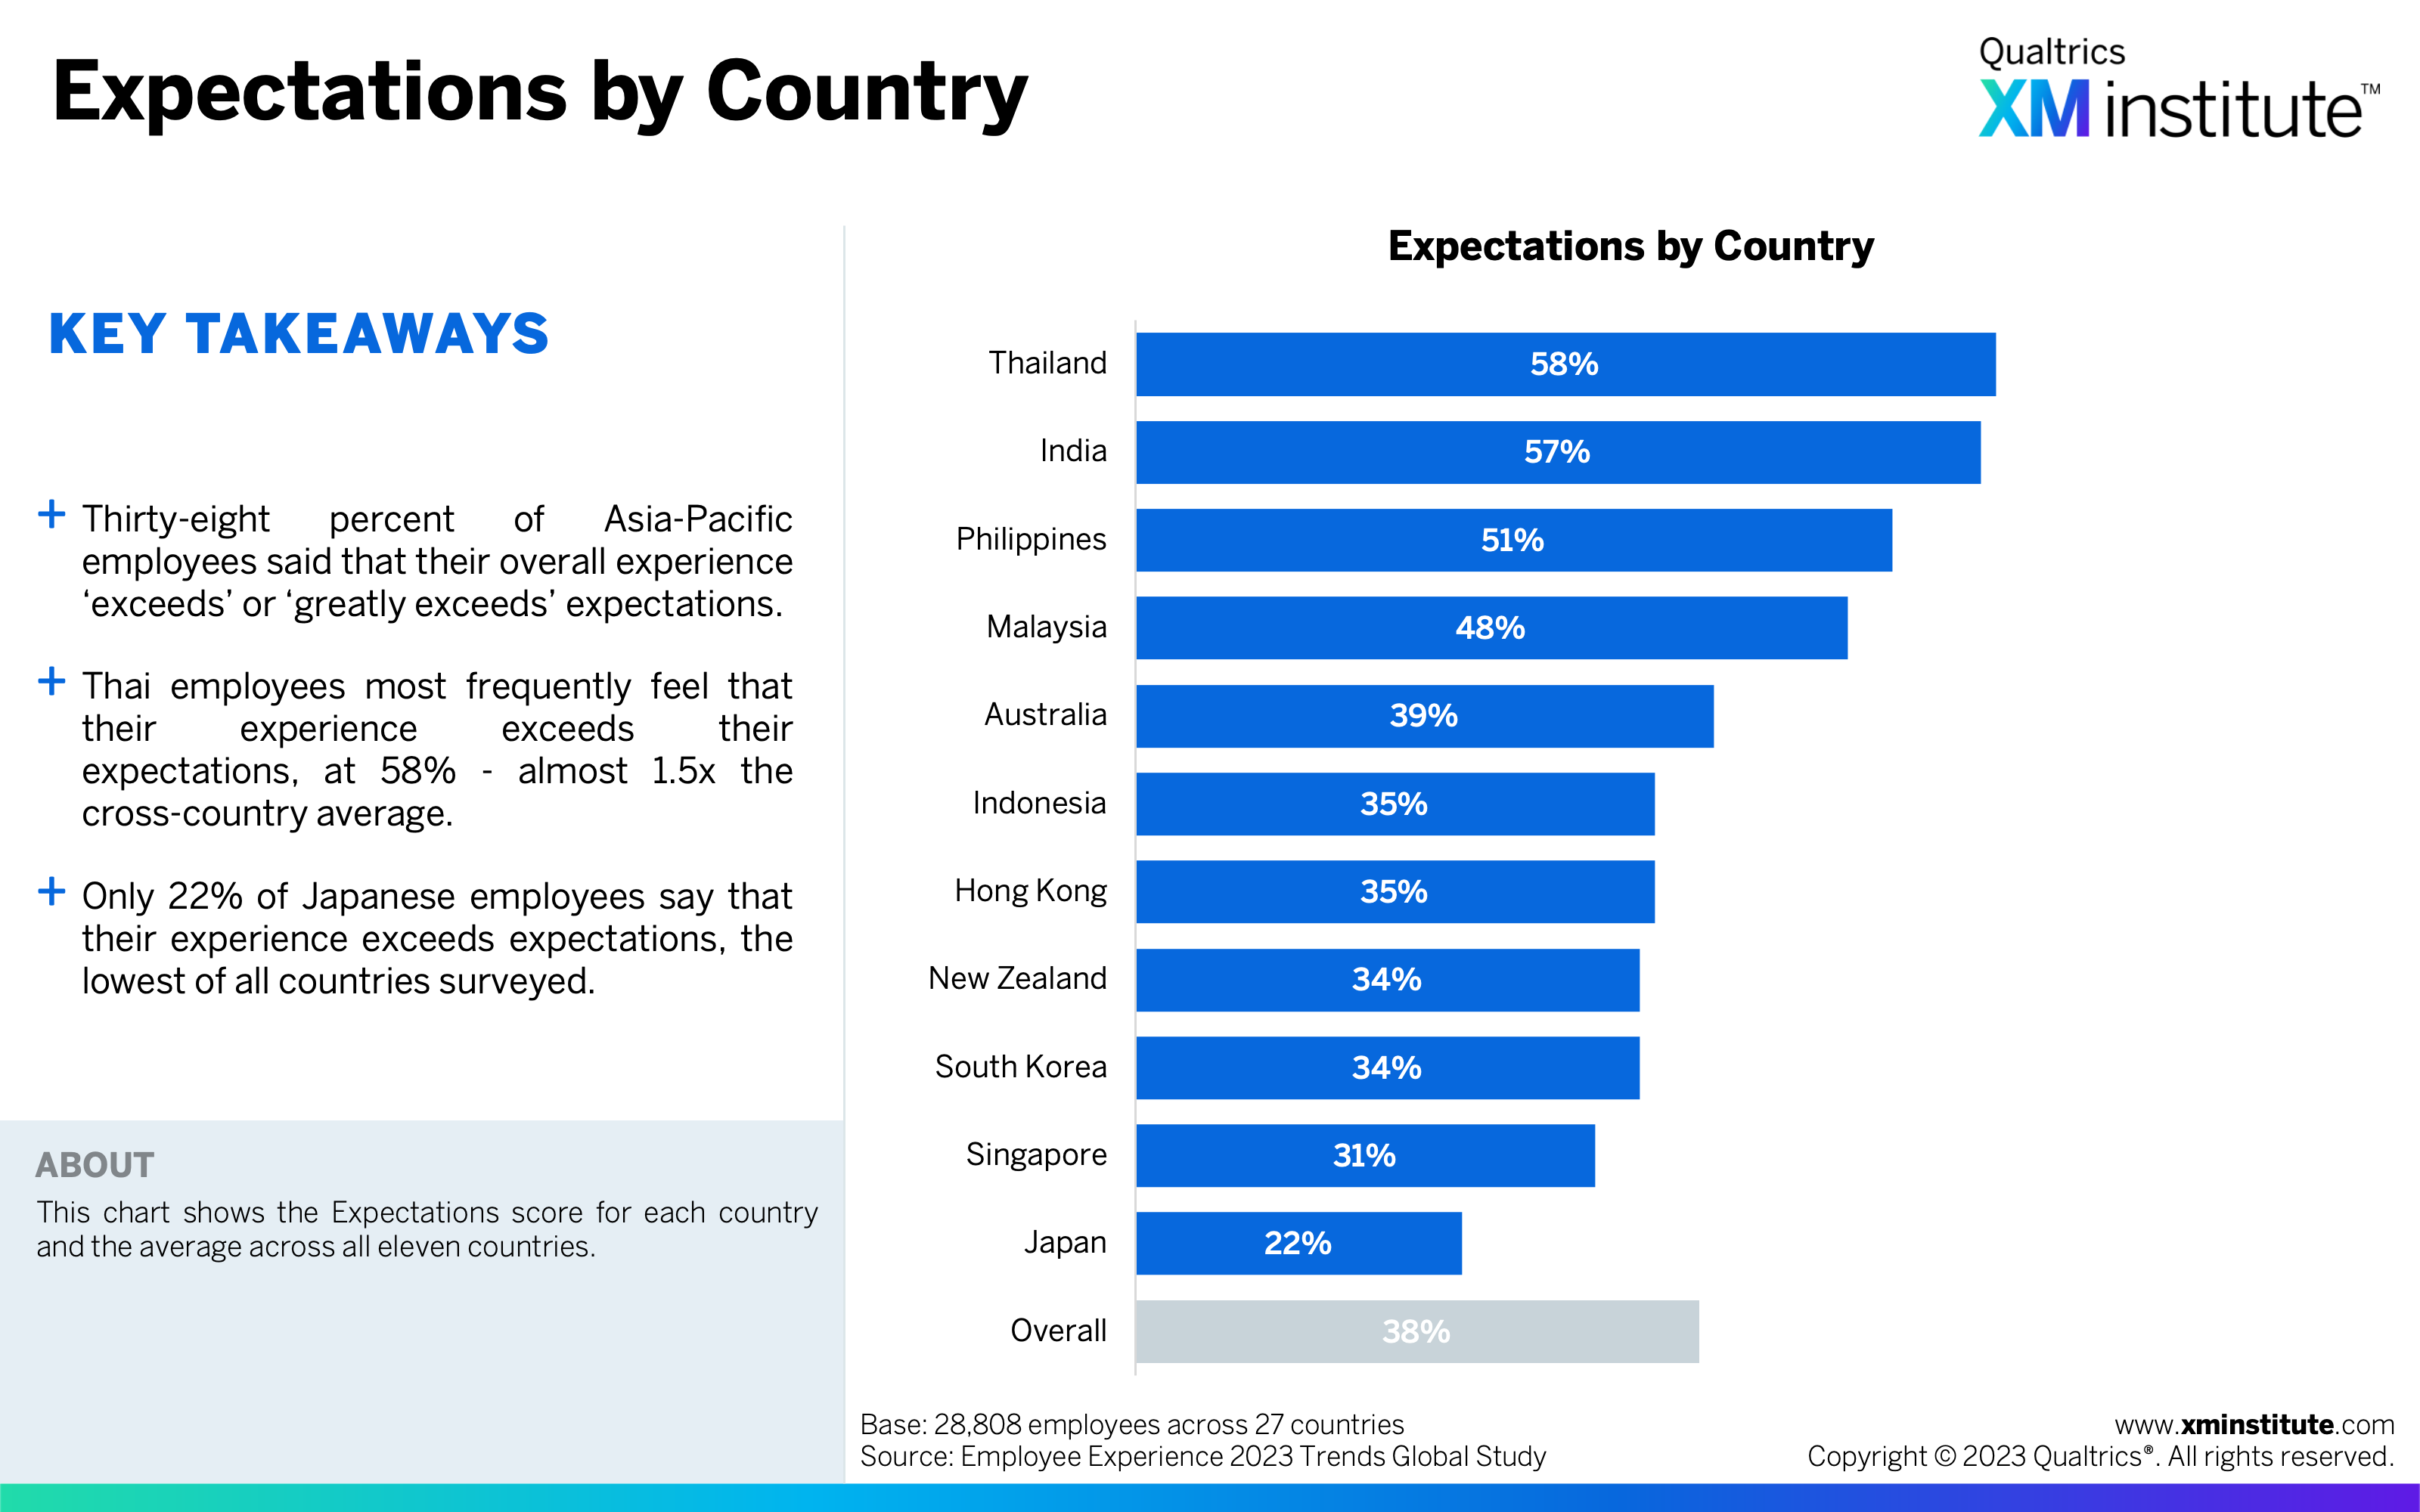
- Expectations by Country (see Figure 11)
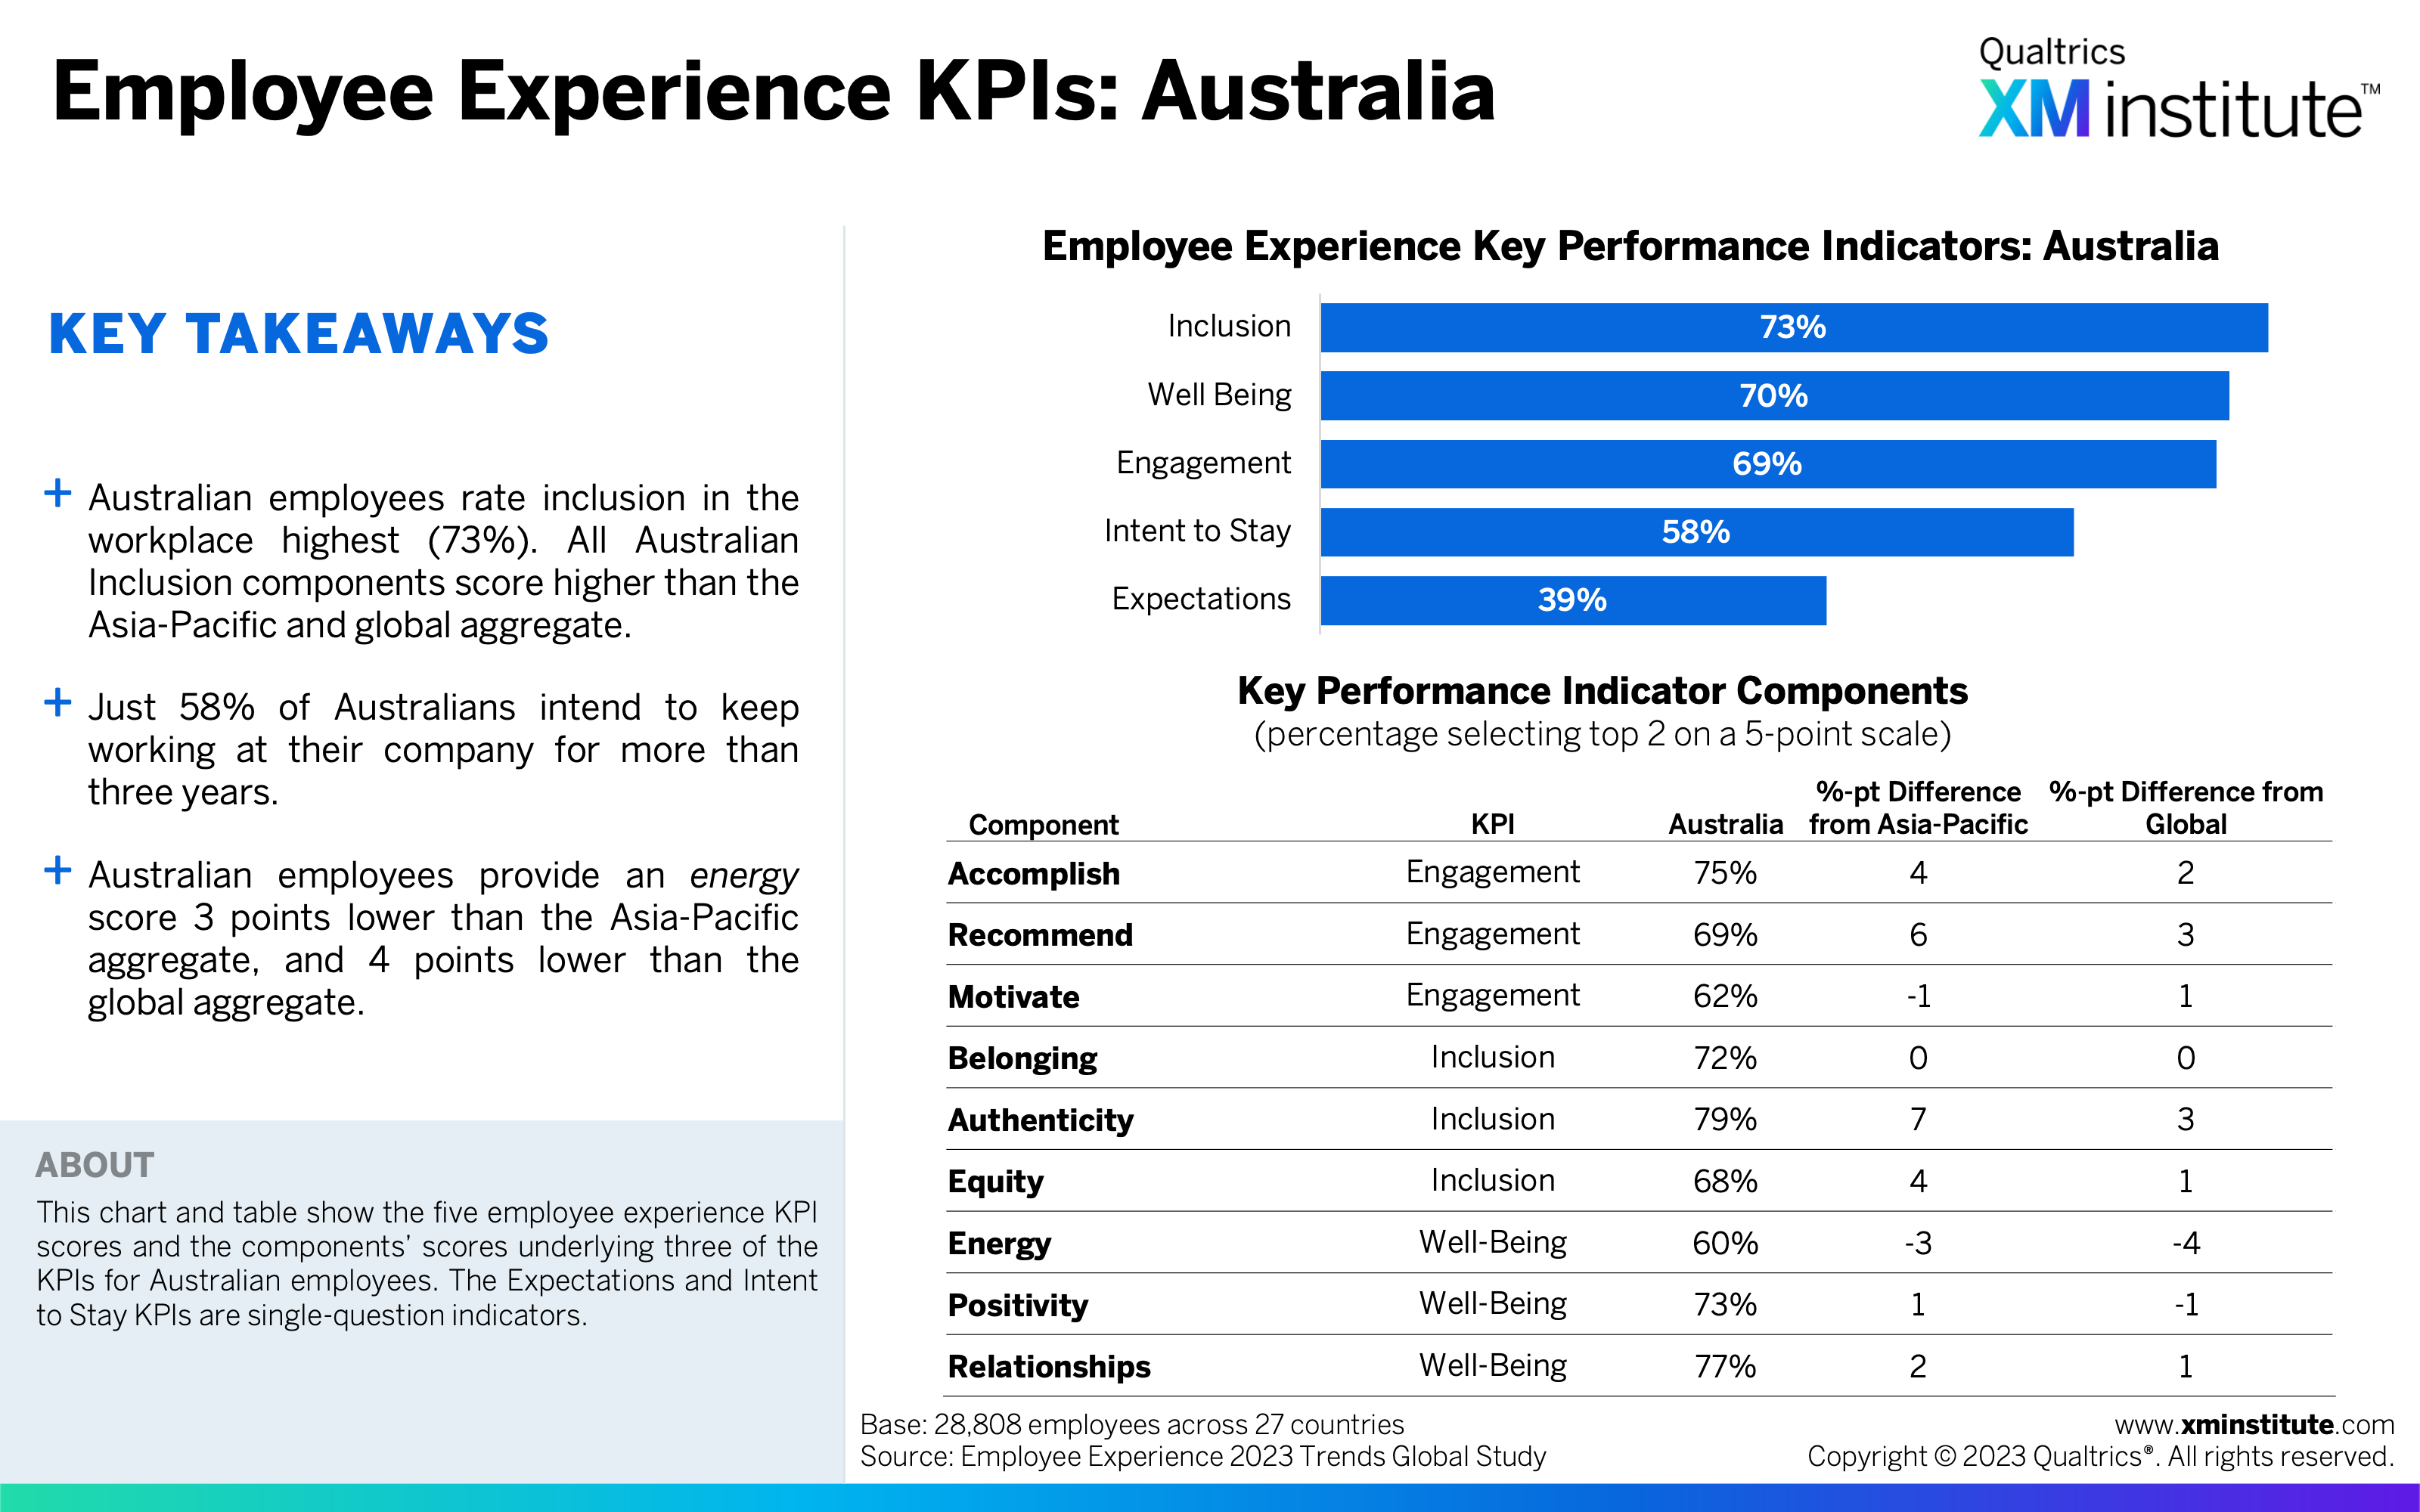
- Employee Experience KPIs: Australia (see Figure 12)
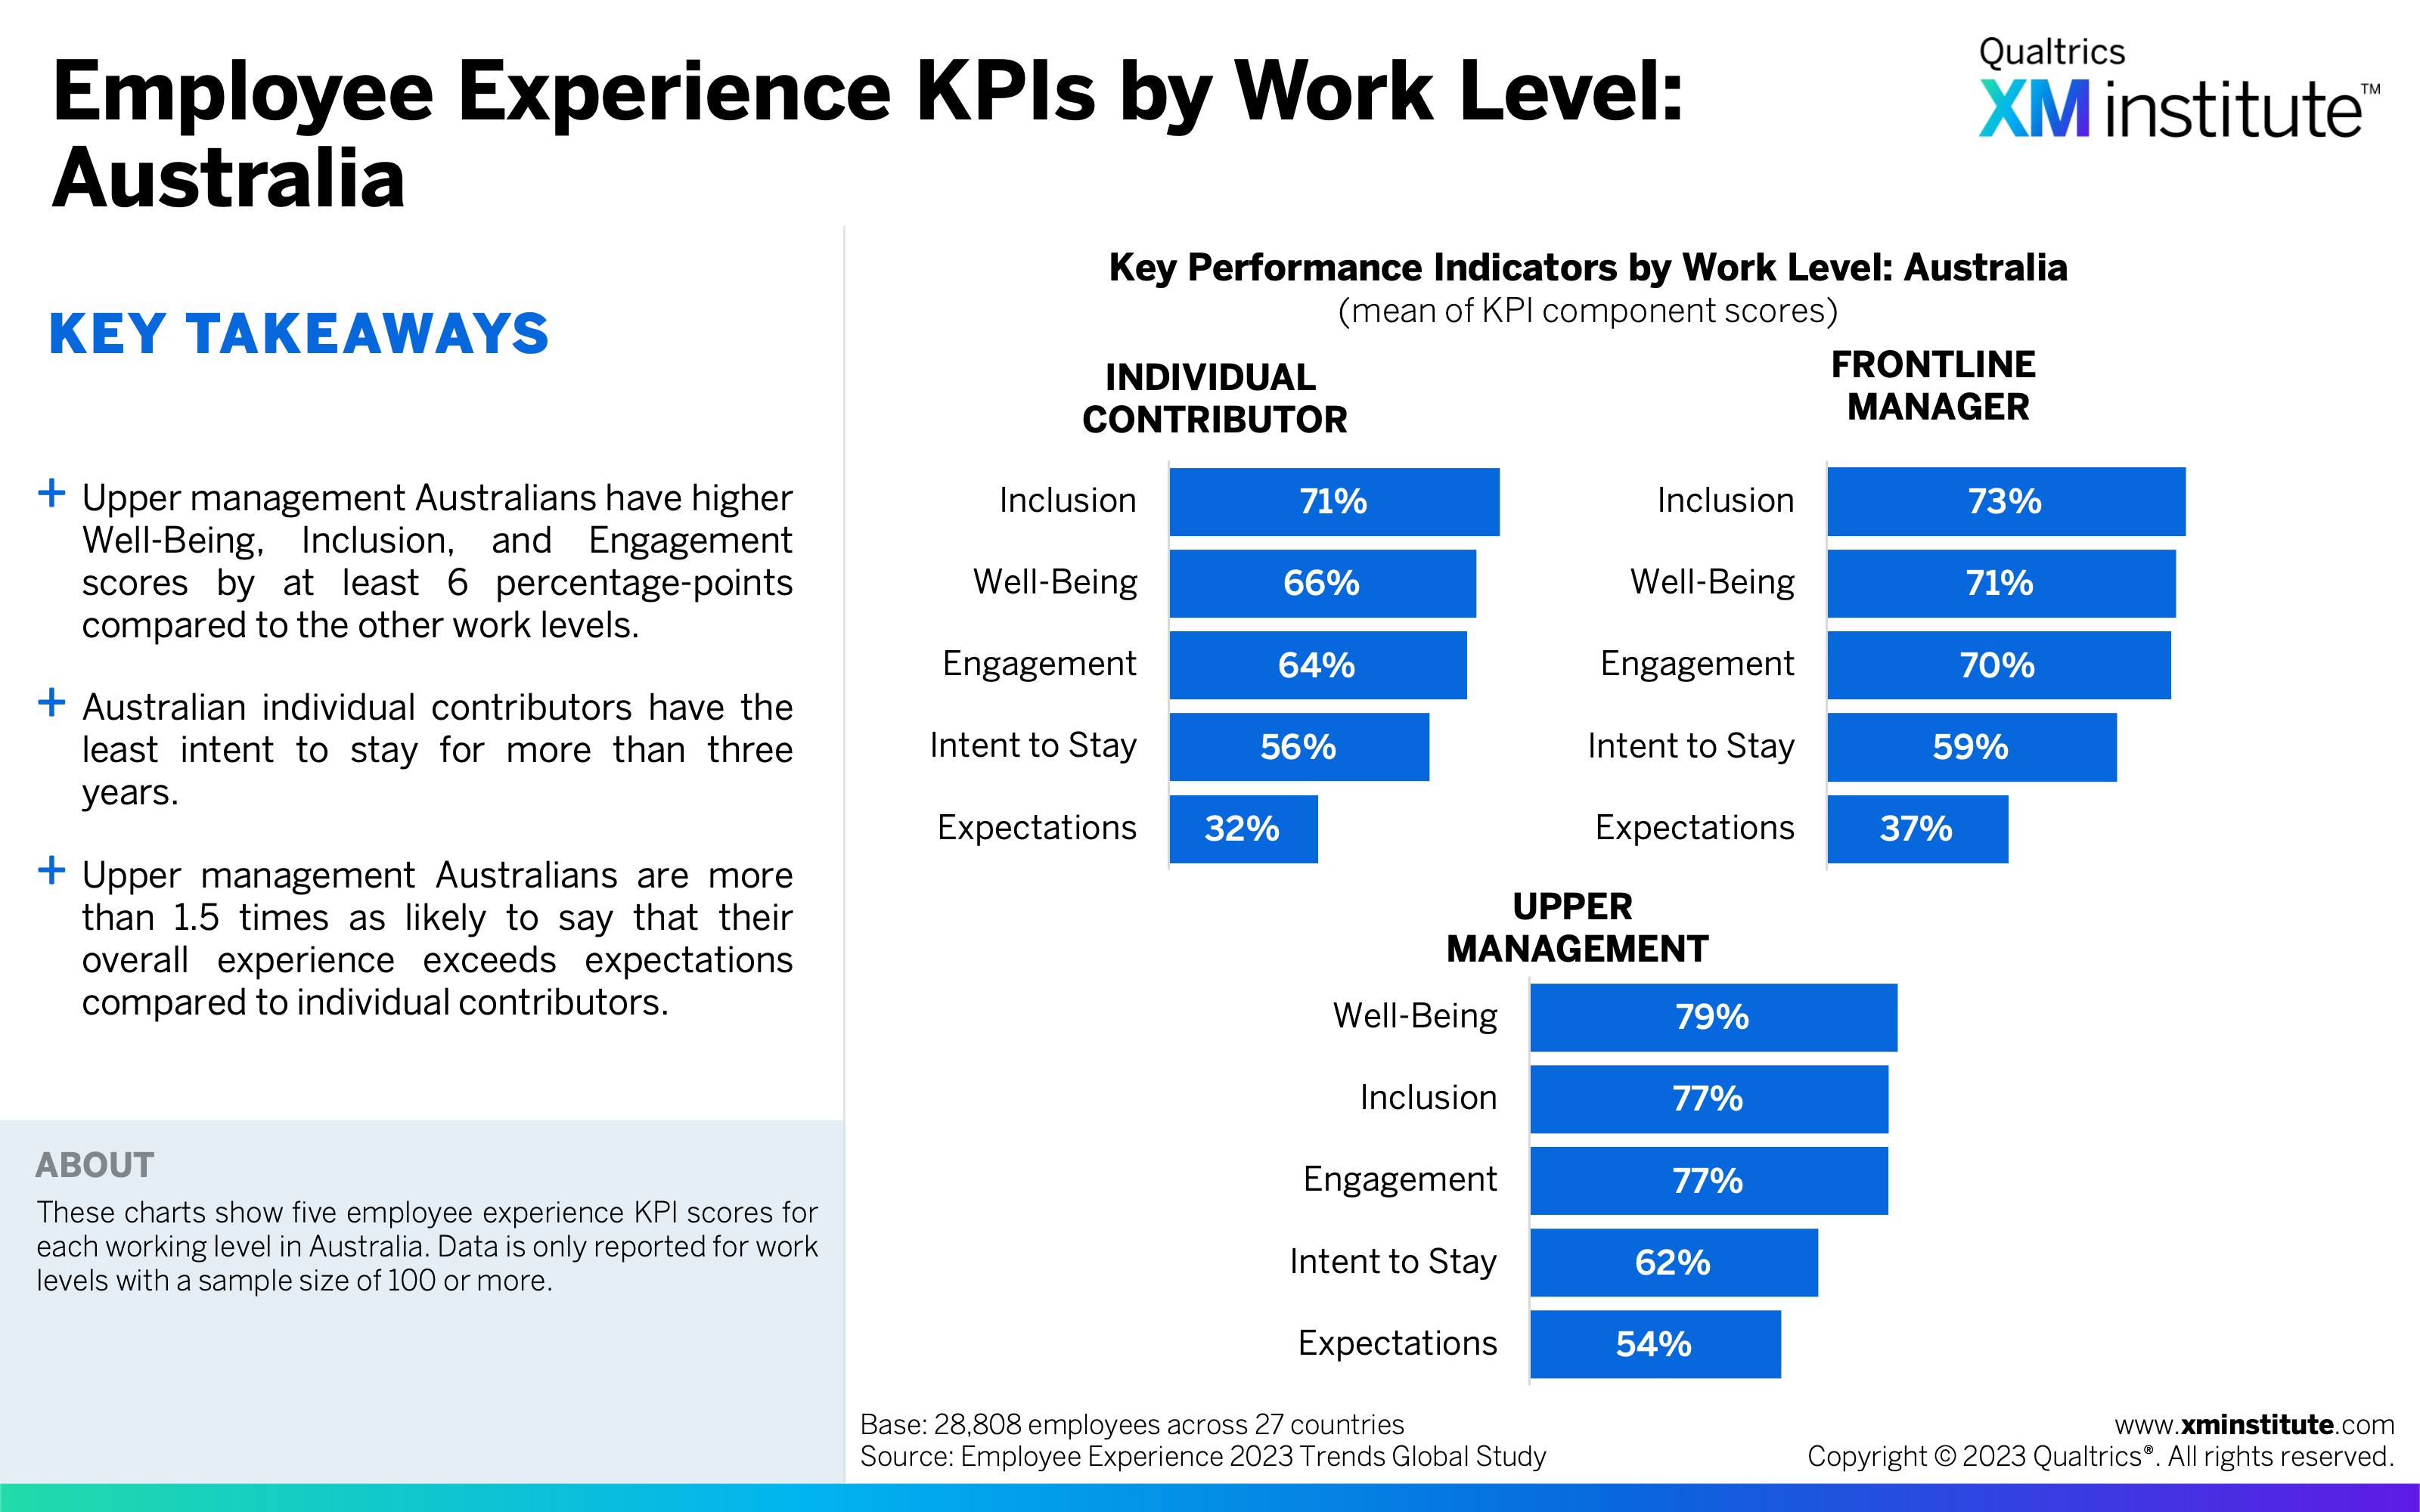
- Employee Experience KPIs by Work Level: Australia (see Figure 13)
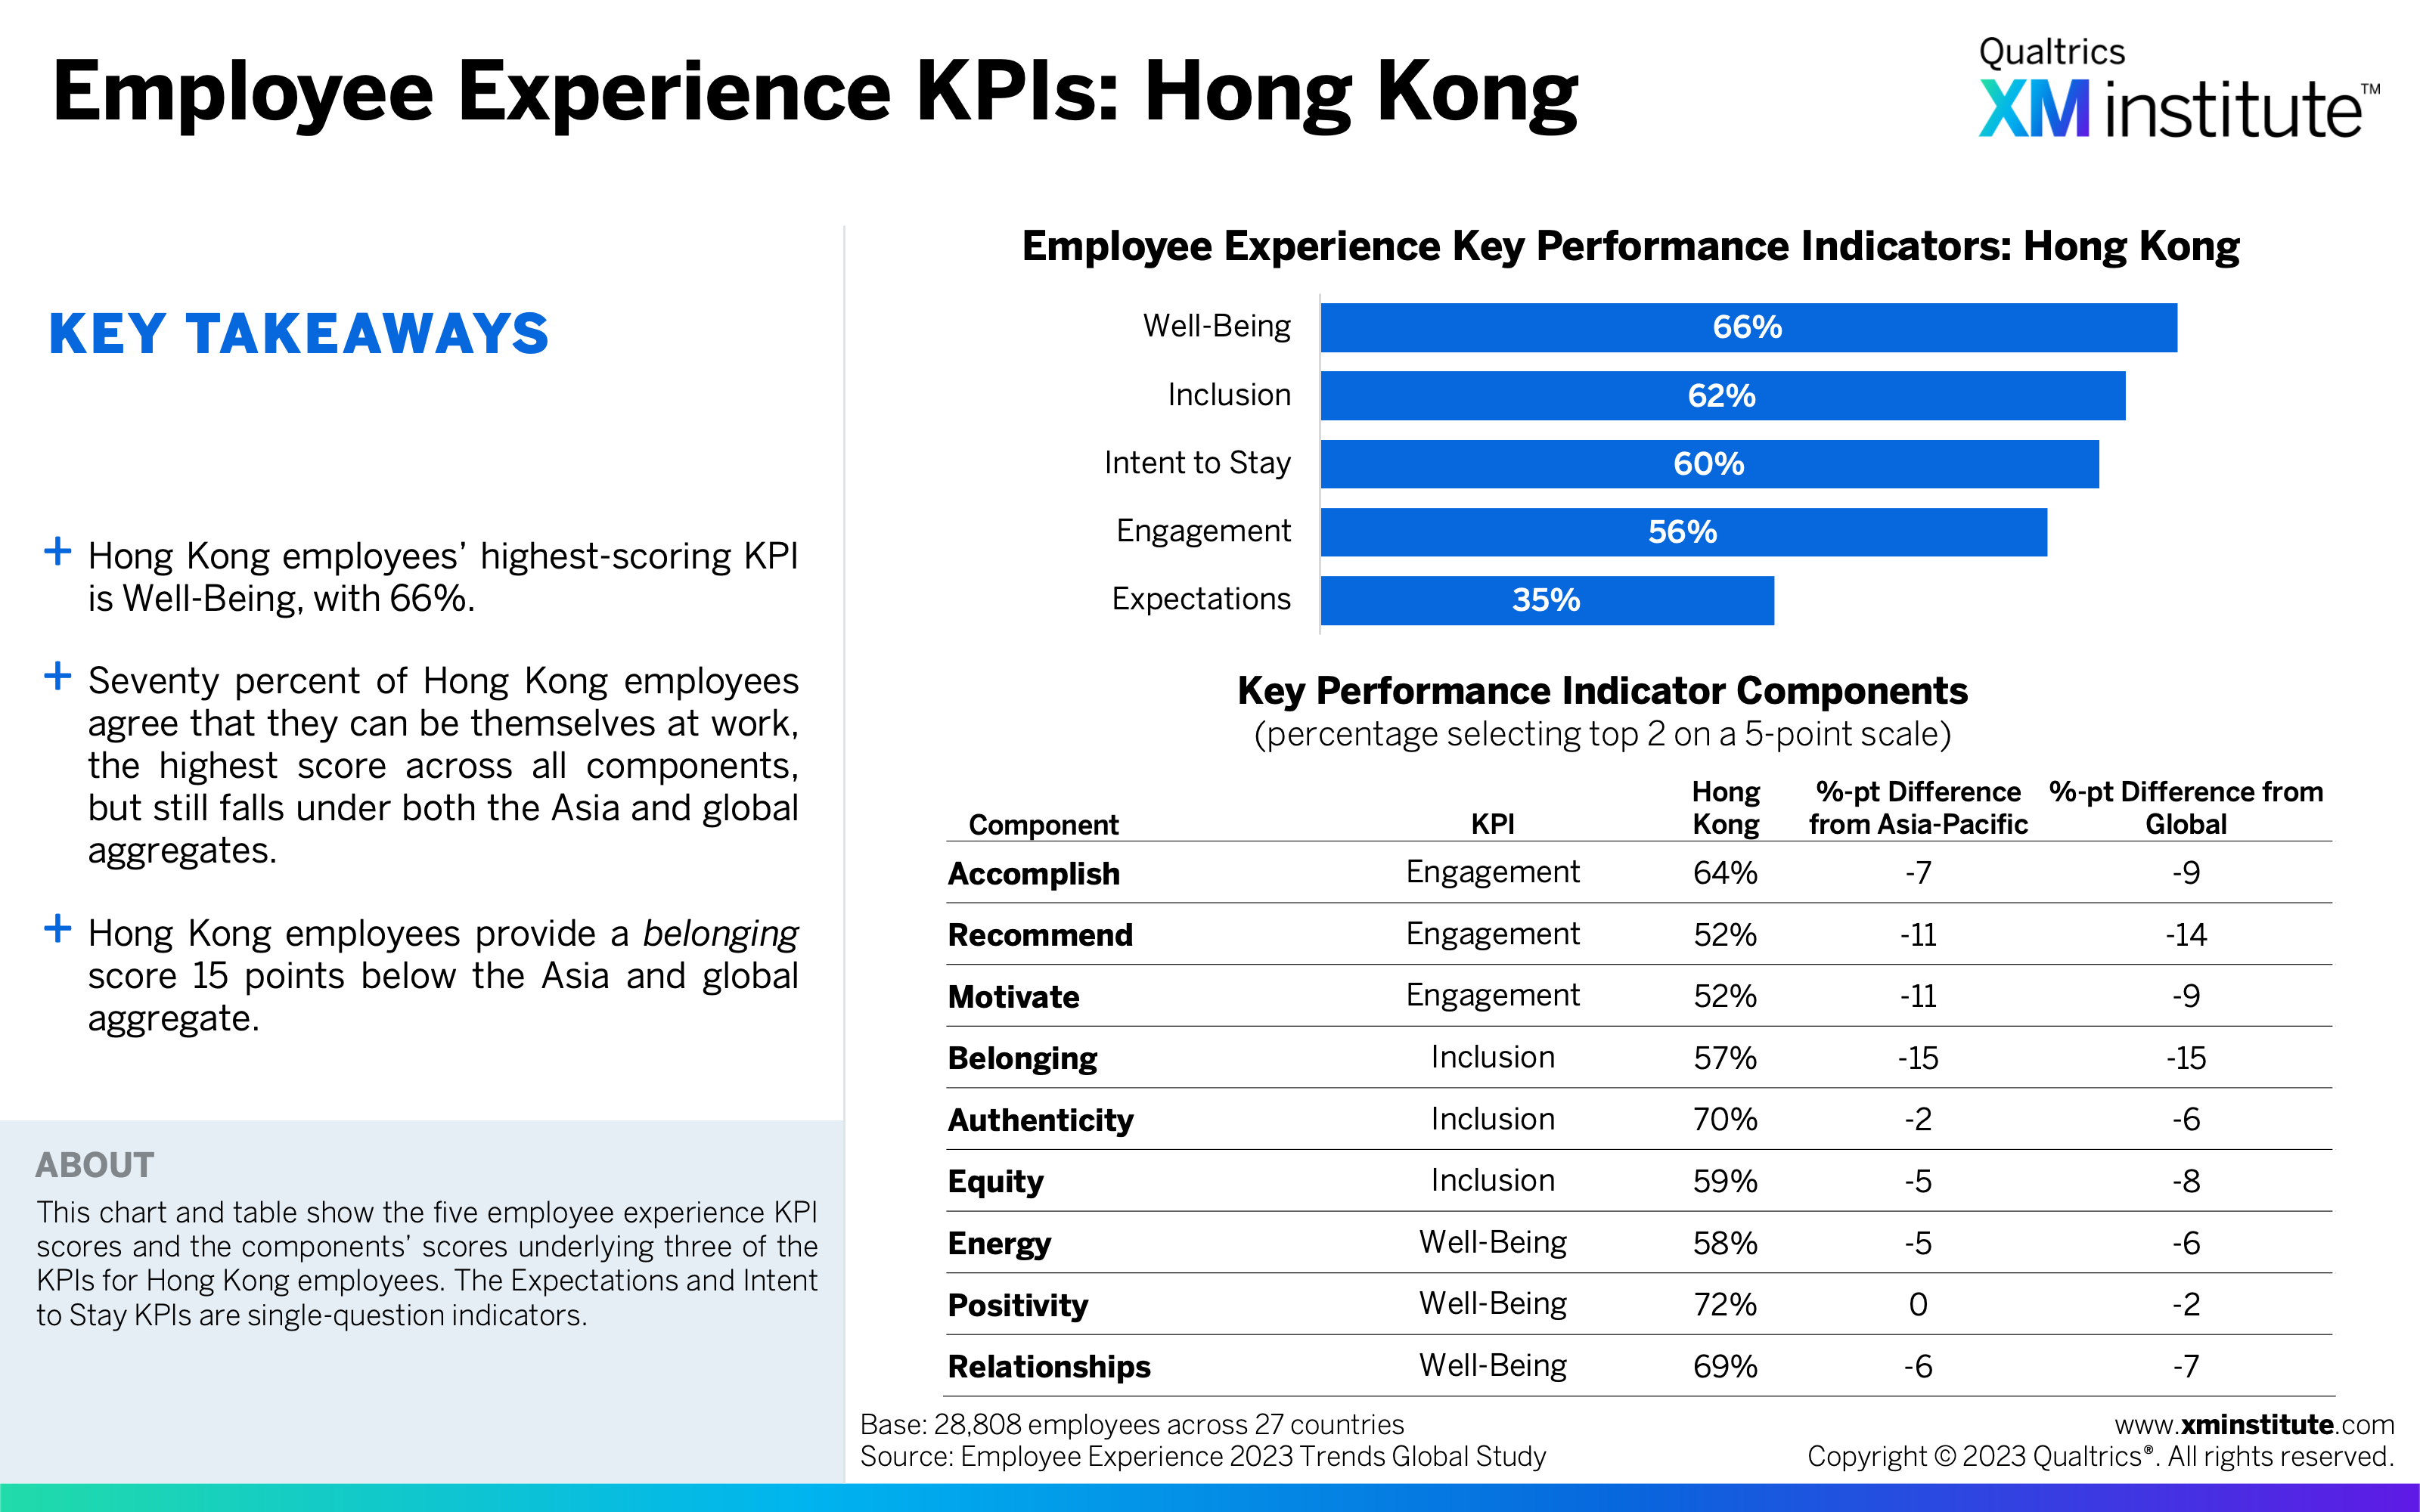
- Employee Experience KPIs: Hong Kong (see Figure 14)
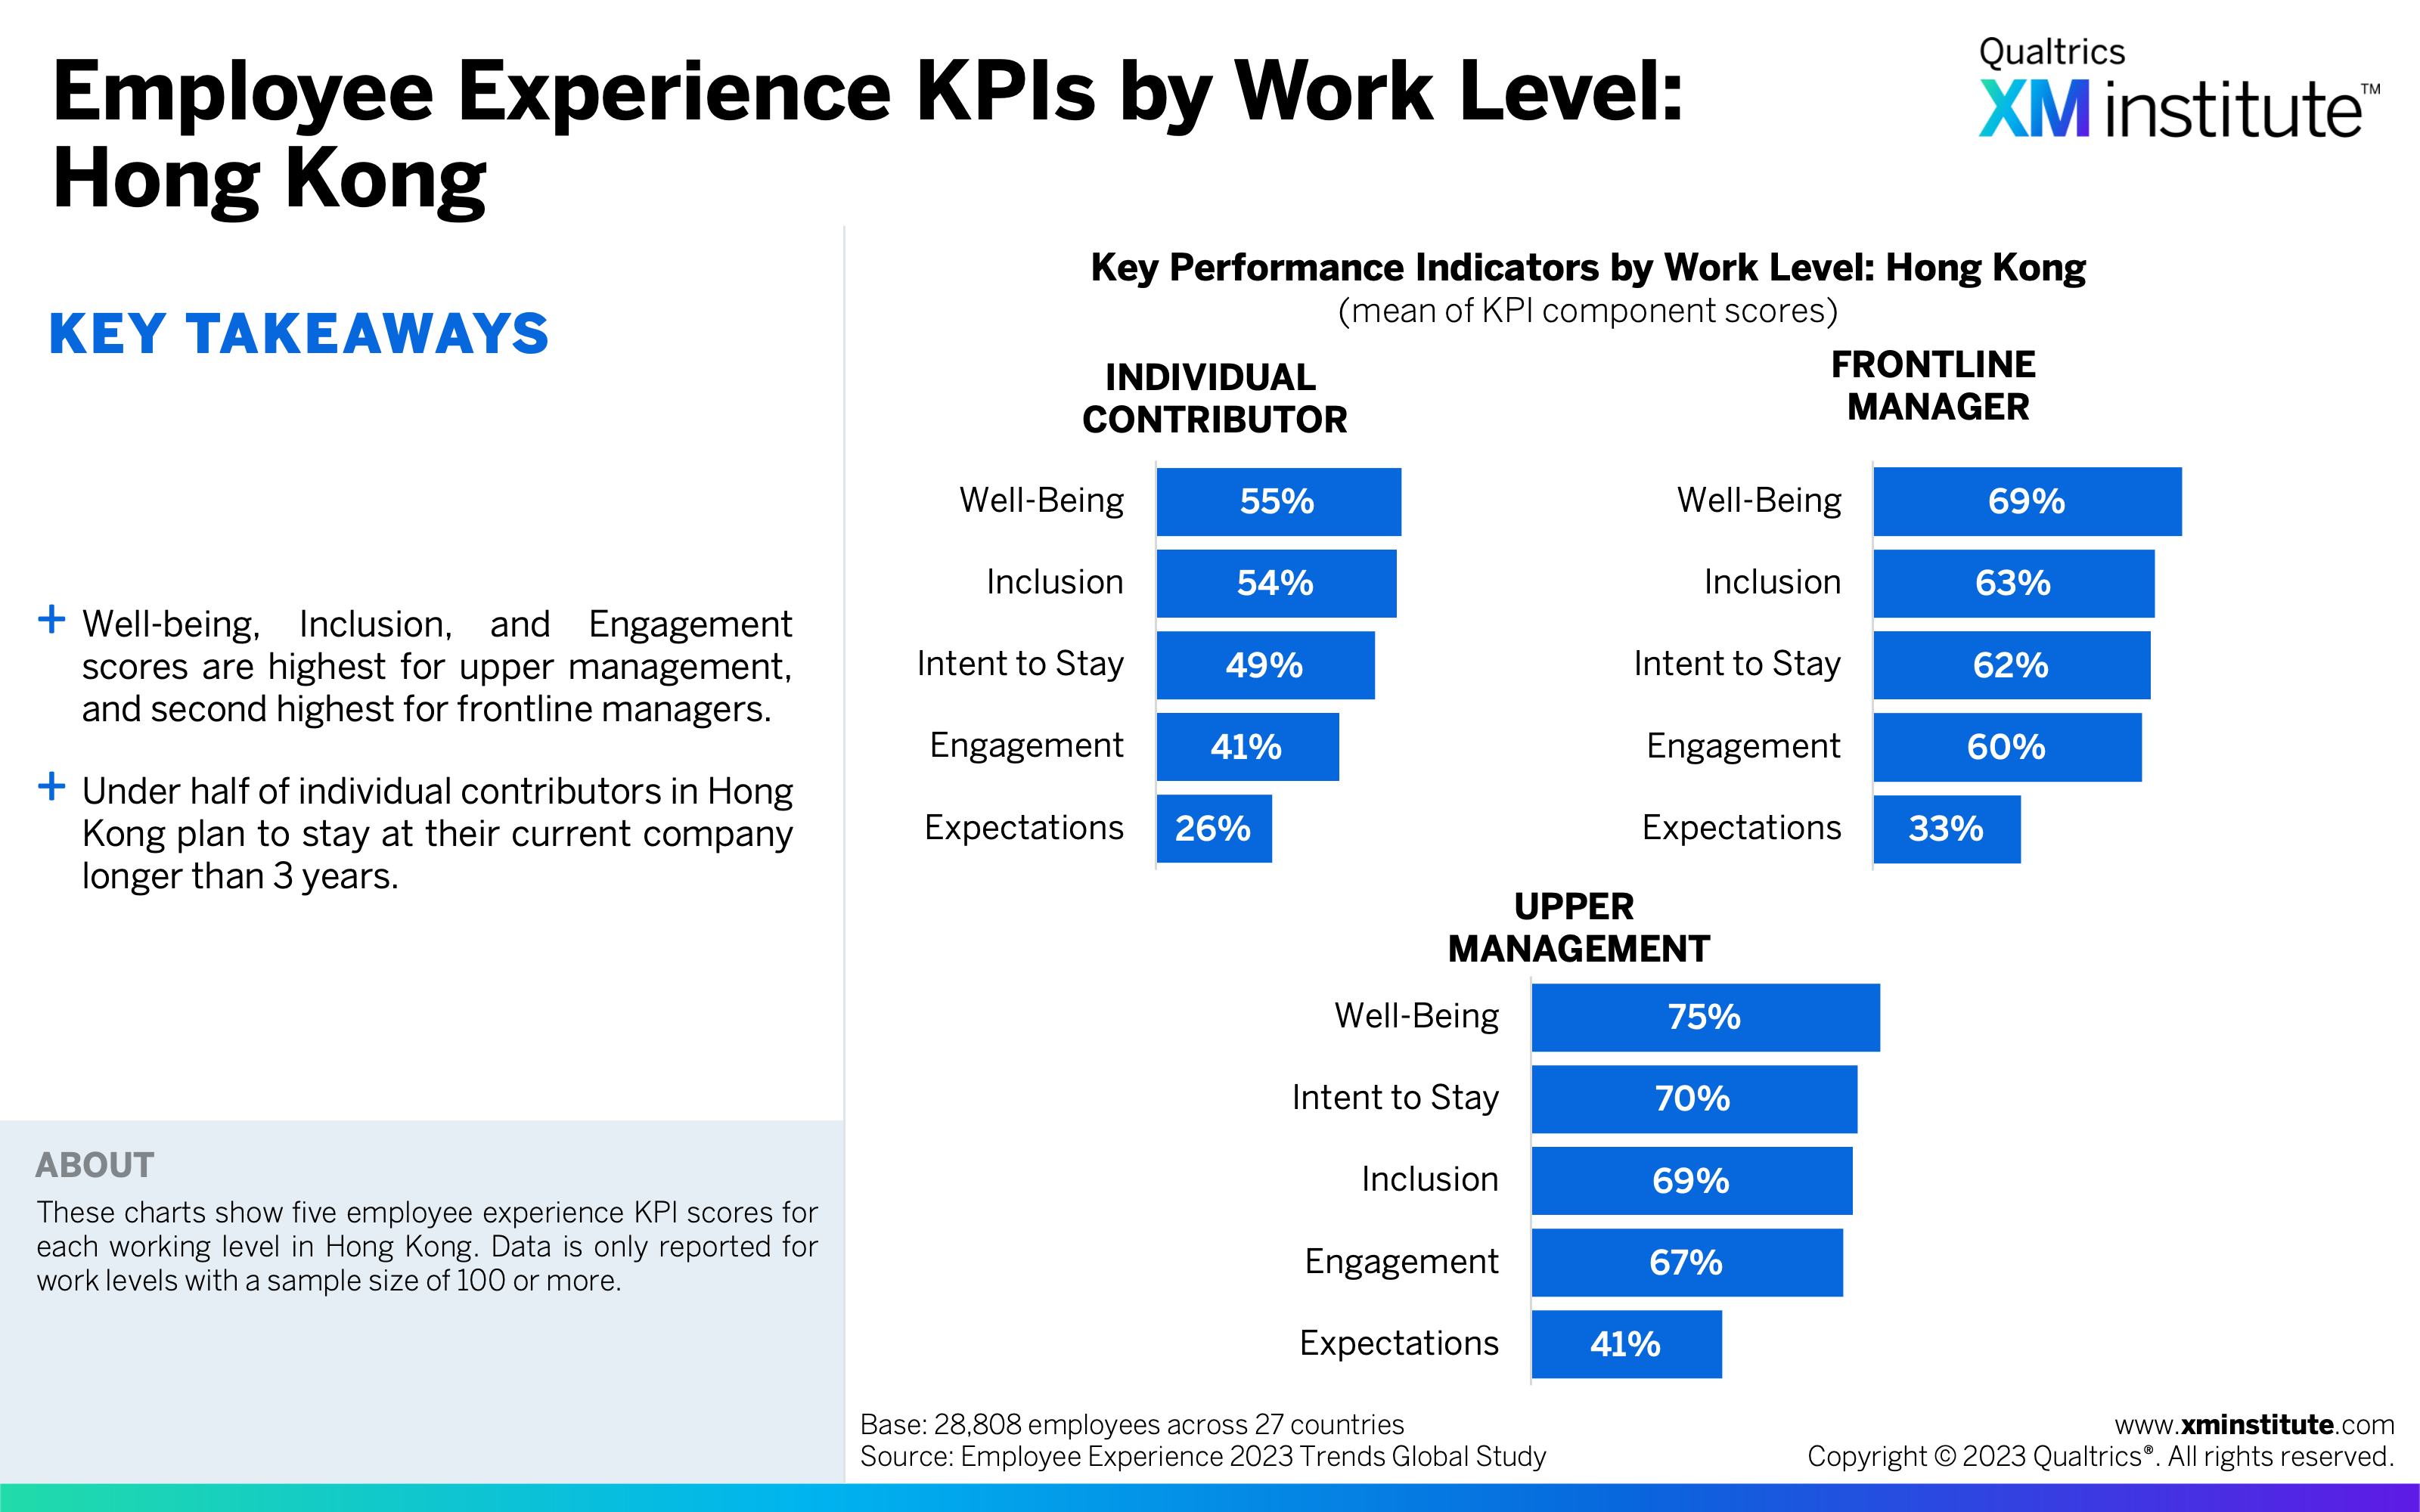
- Employee Experience KPIs by Work Level: Hong Kong (see Figure 15)
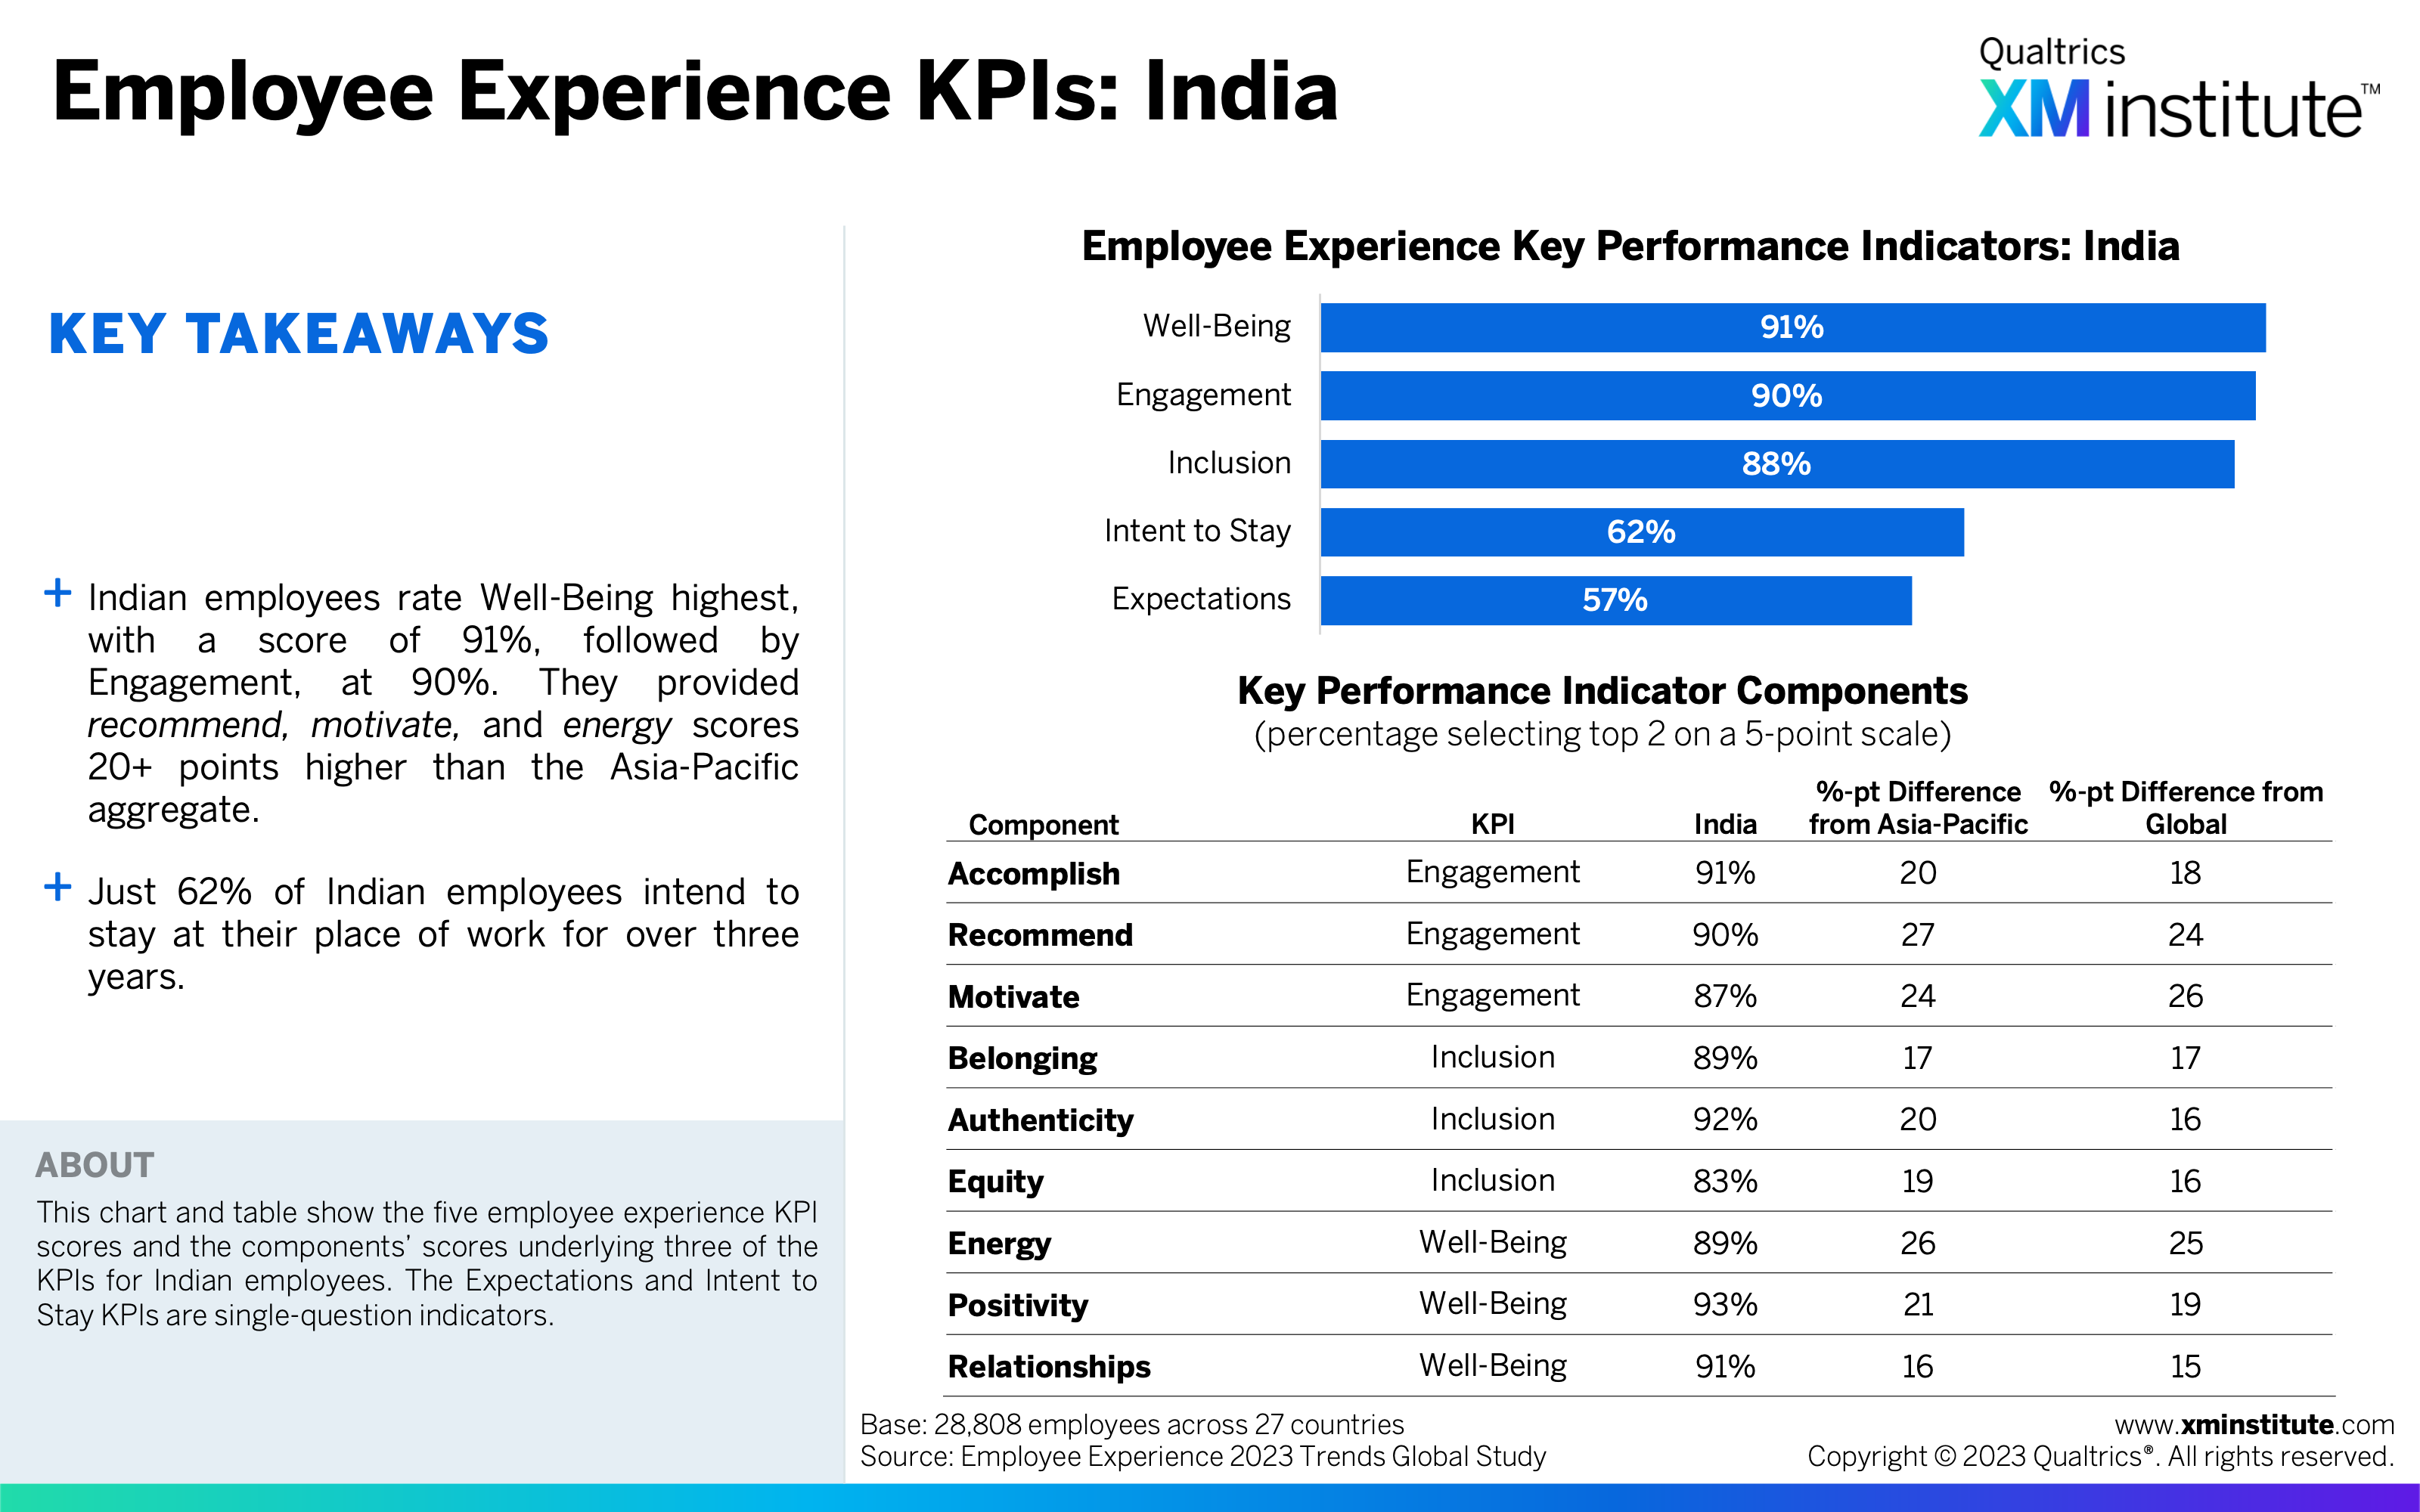
- Employee Experience KPIs: India (see Figure 16)
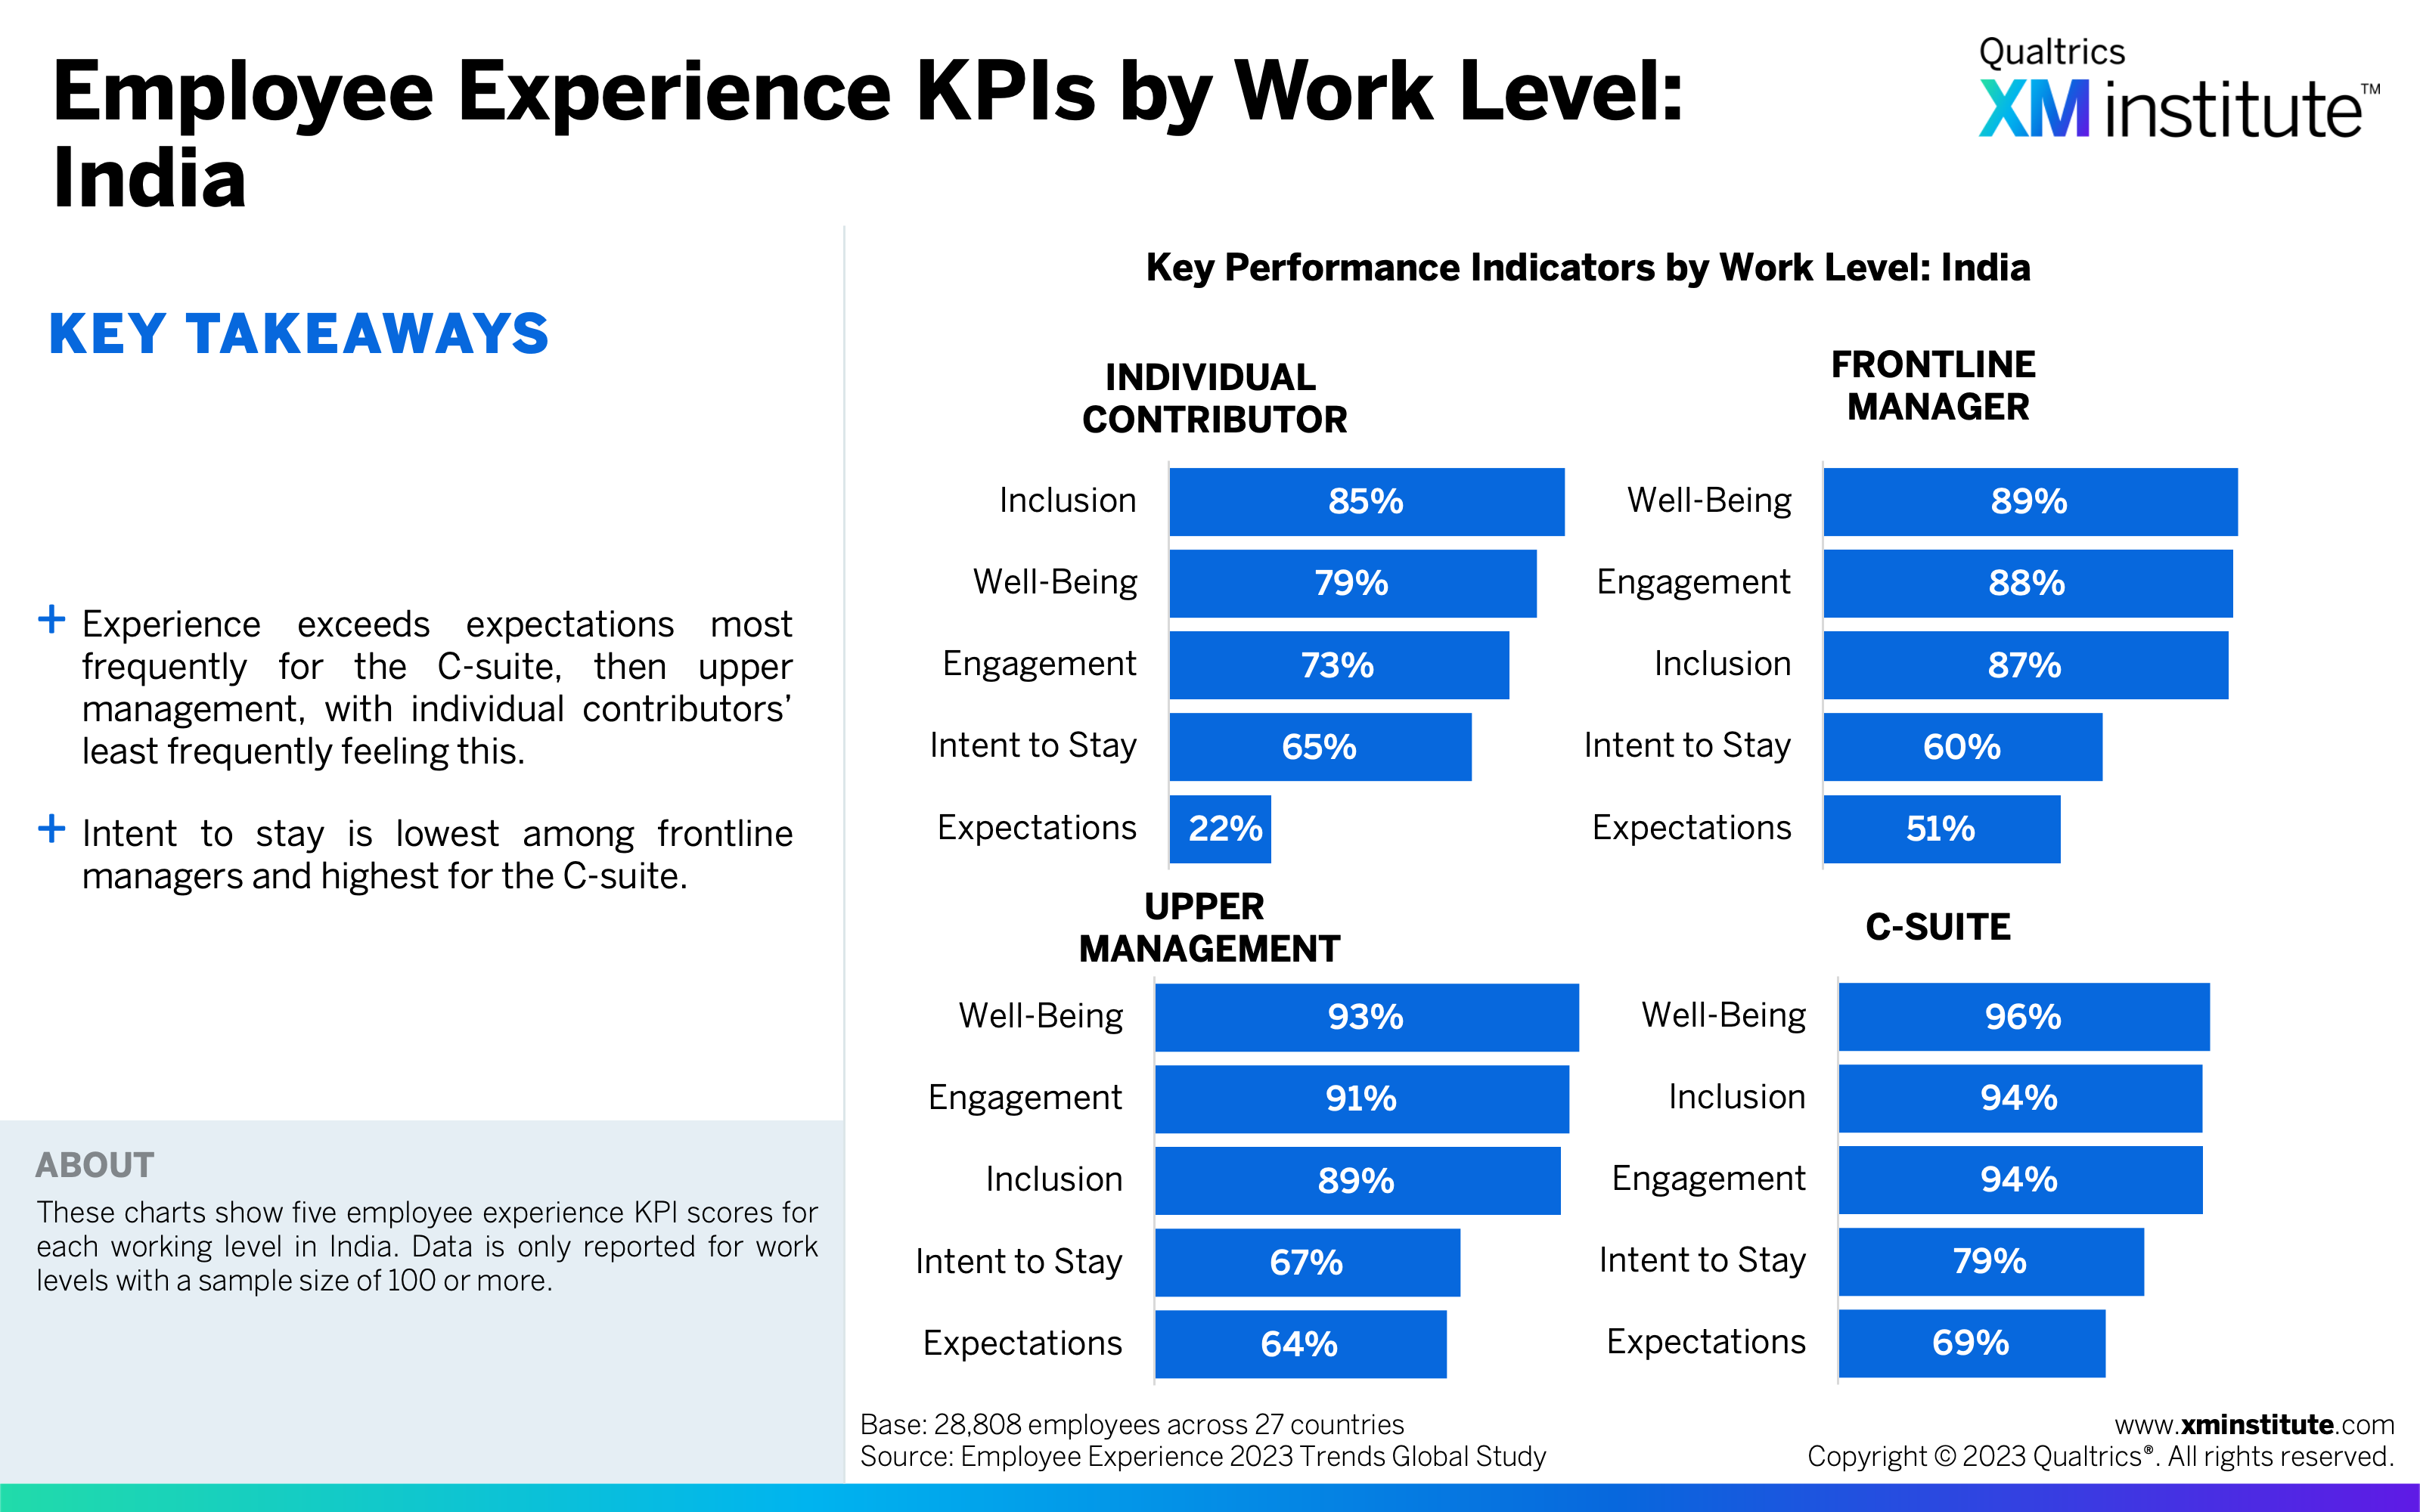
- Employee Experience KPIs by Work Level: India (see Figure 17)
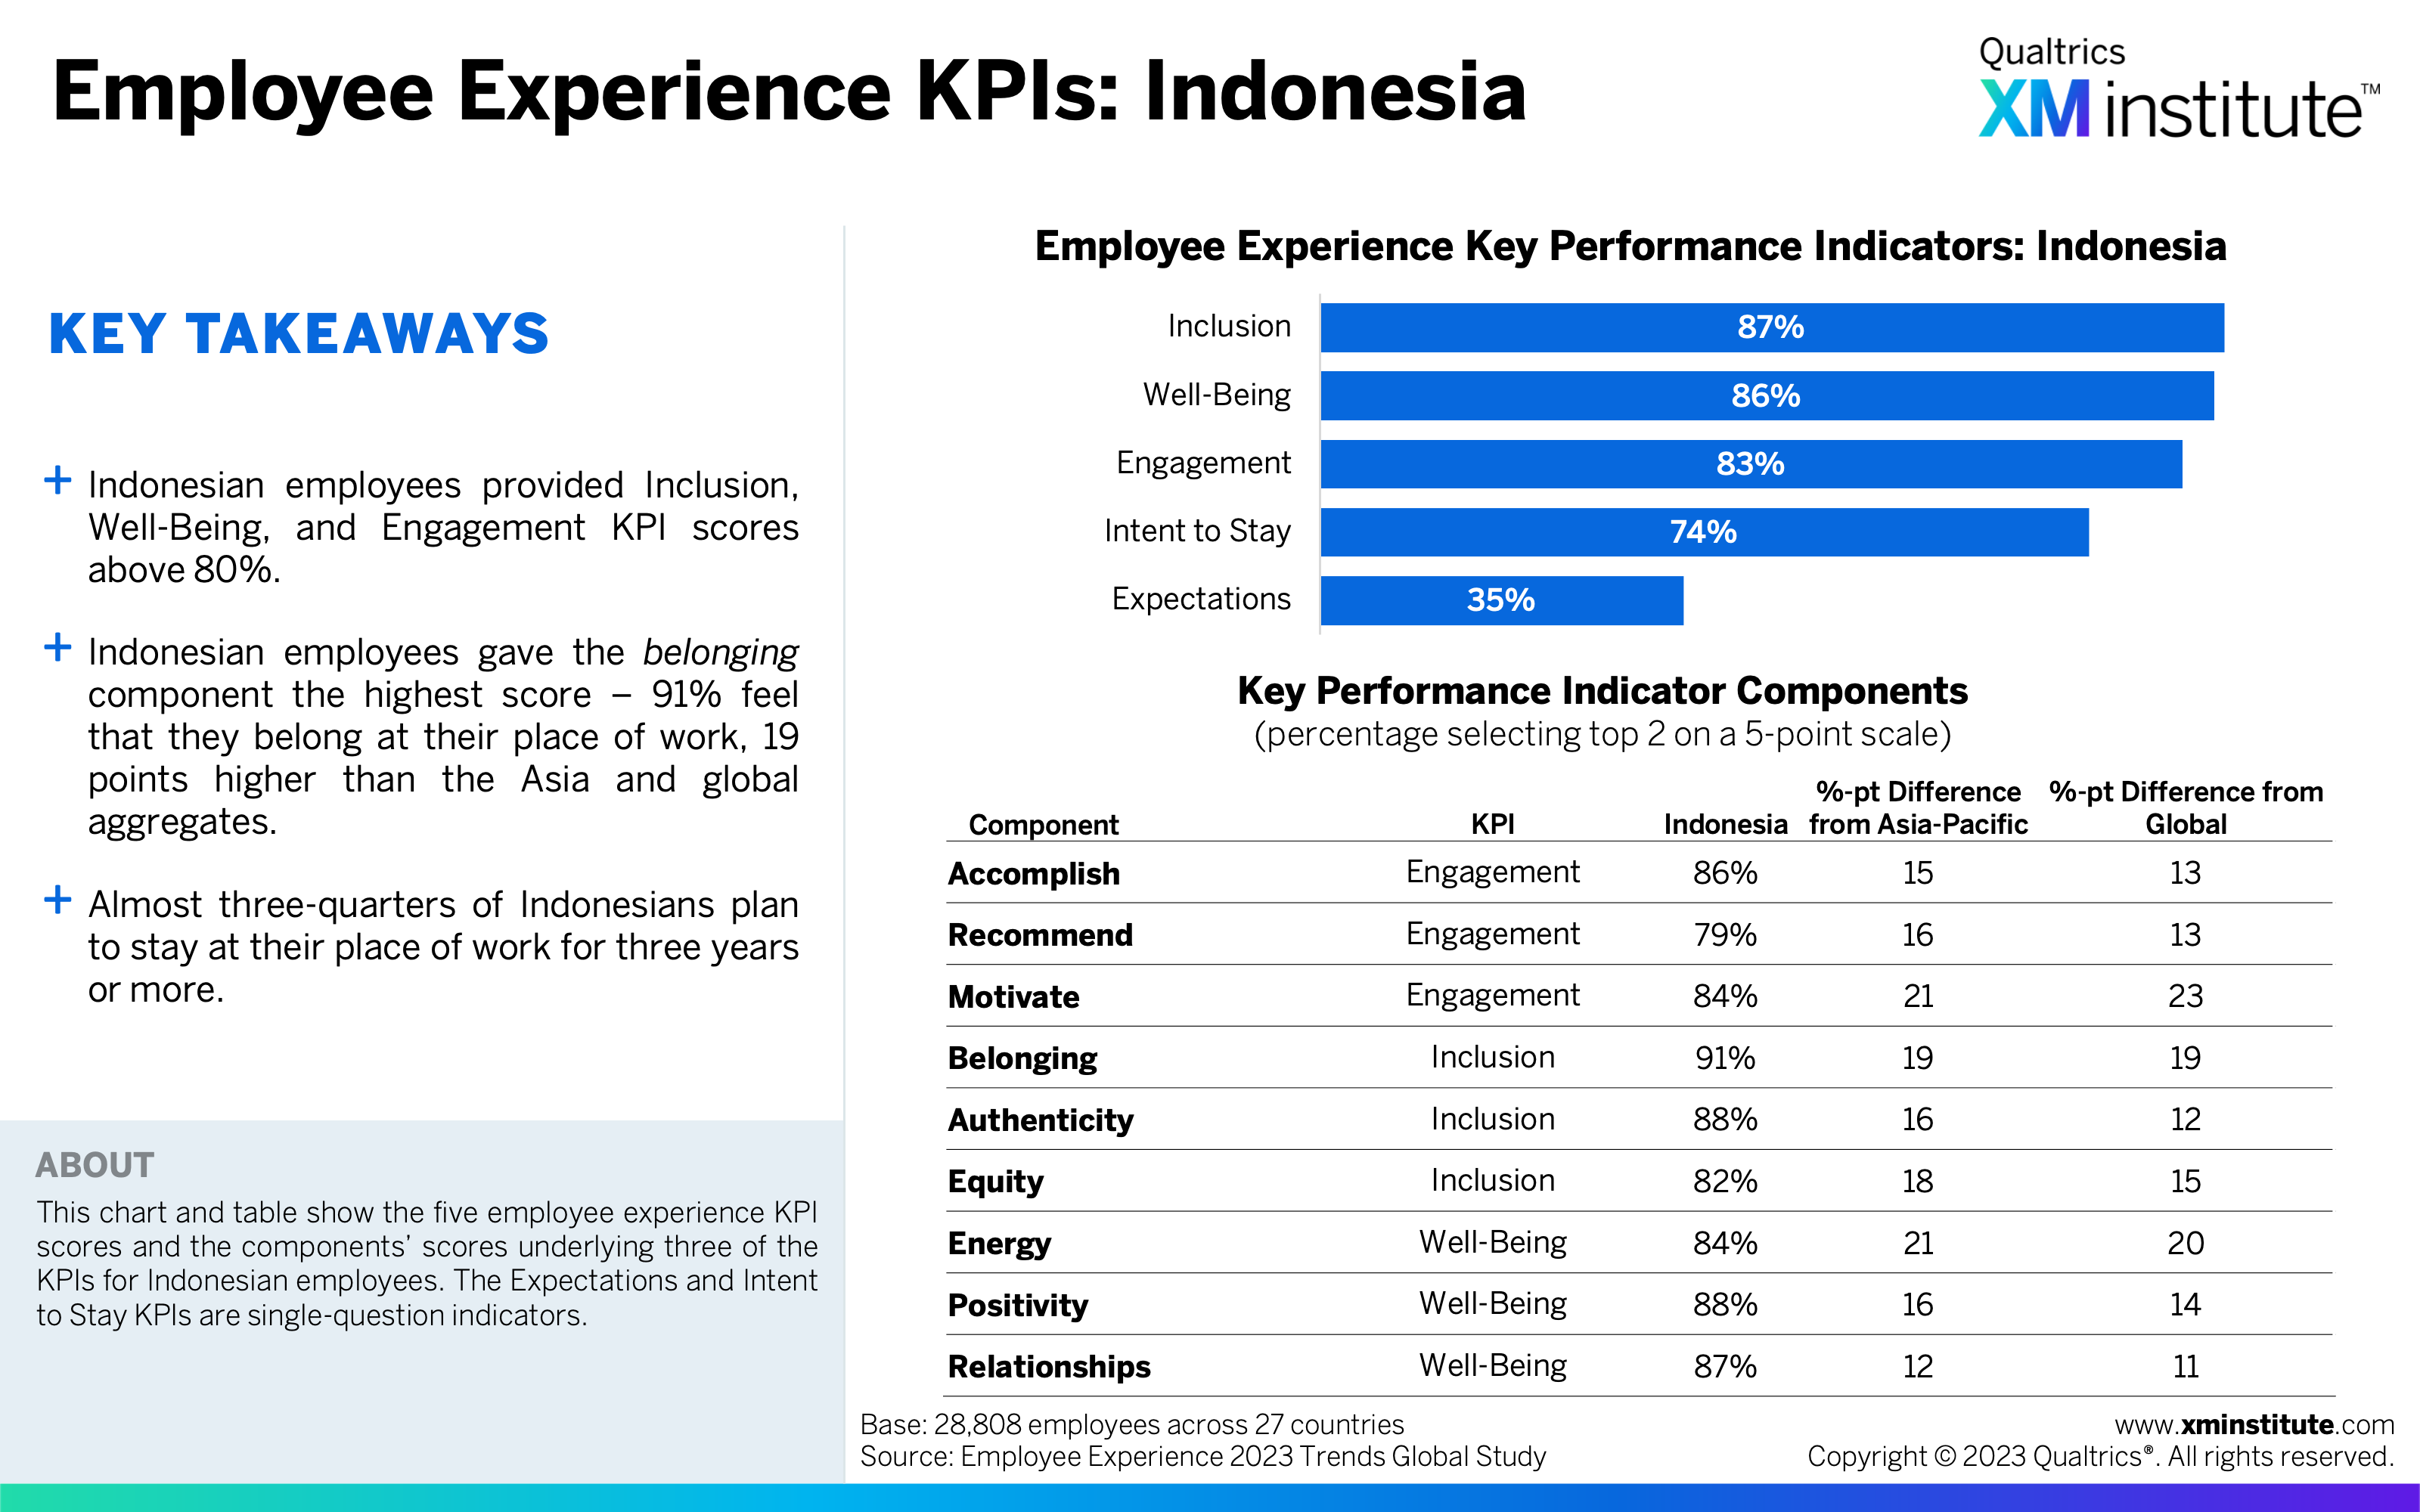
- Employee Experience KPIs: Indonesia (see Figure 18)
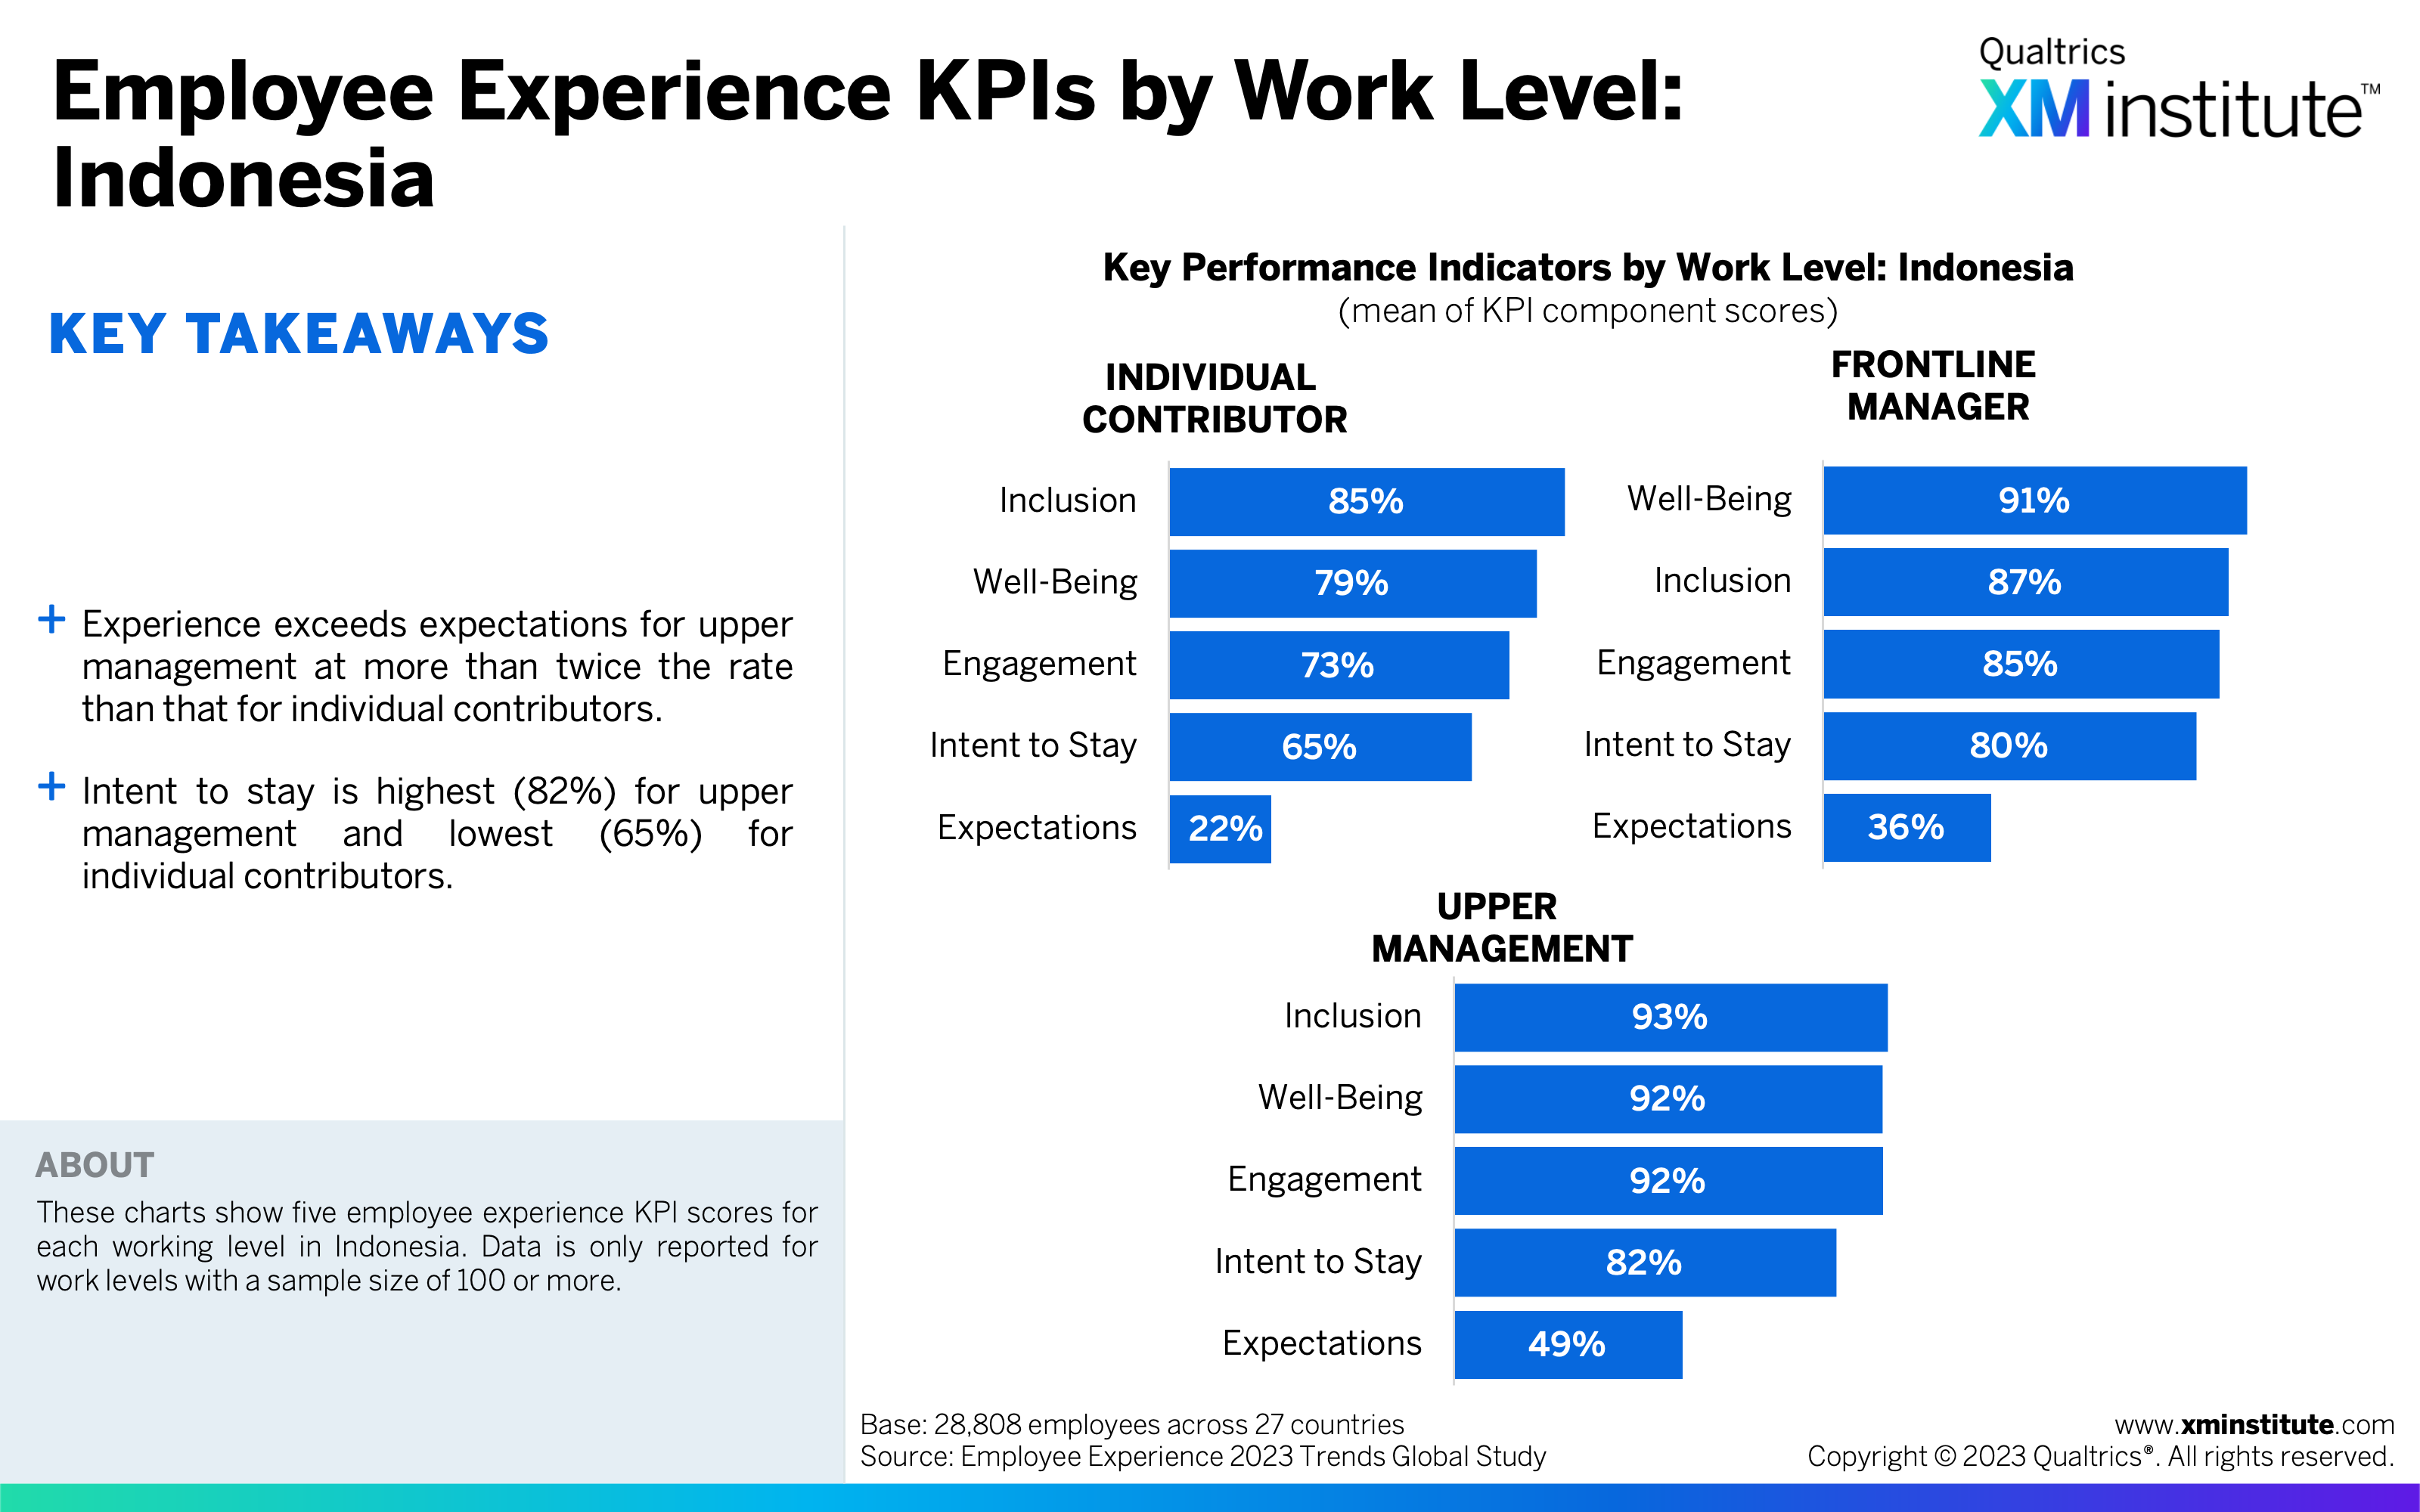
- Employee Experience KPIs by Work Level: Indonesia (see Figure 19)
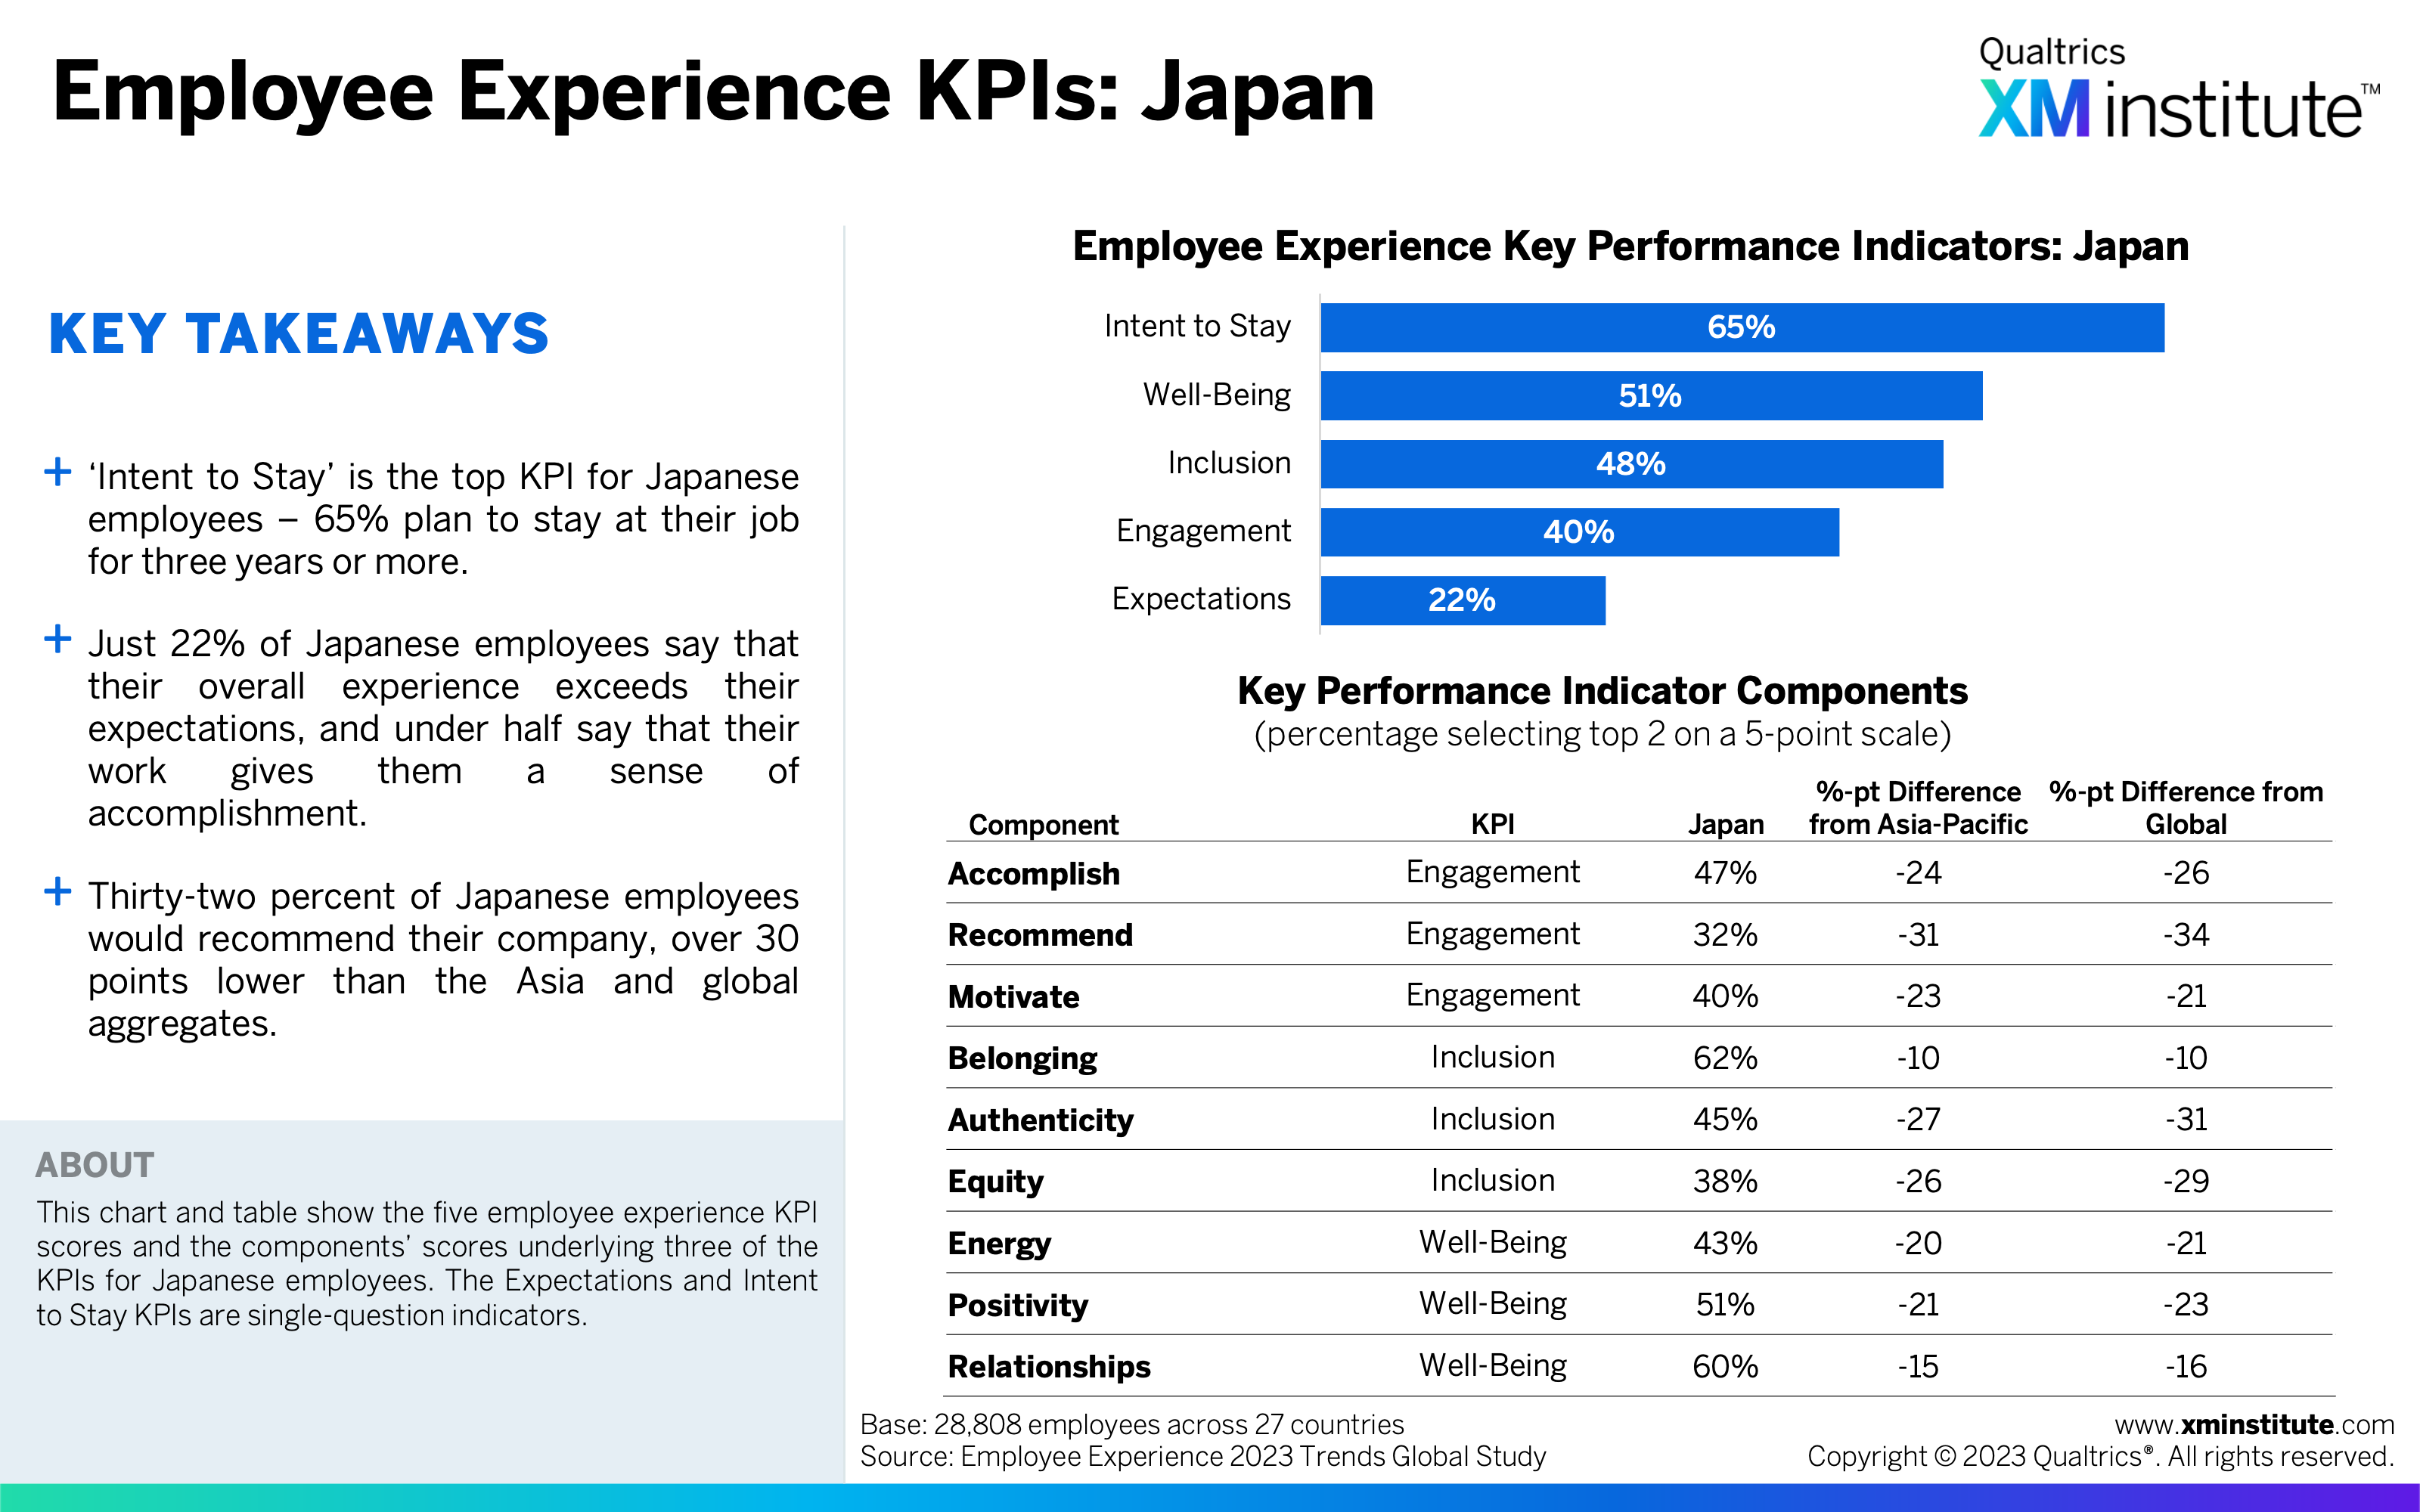
- Employee Experience KPIs: Japan (see Figure 20)
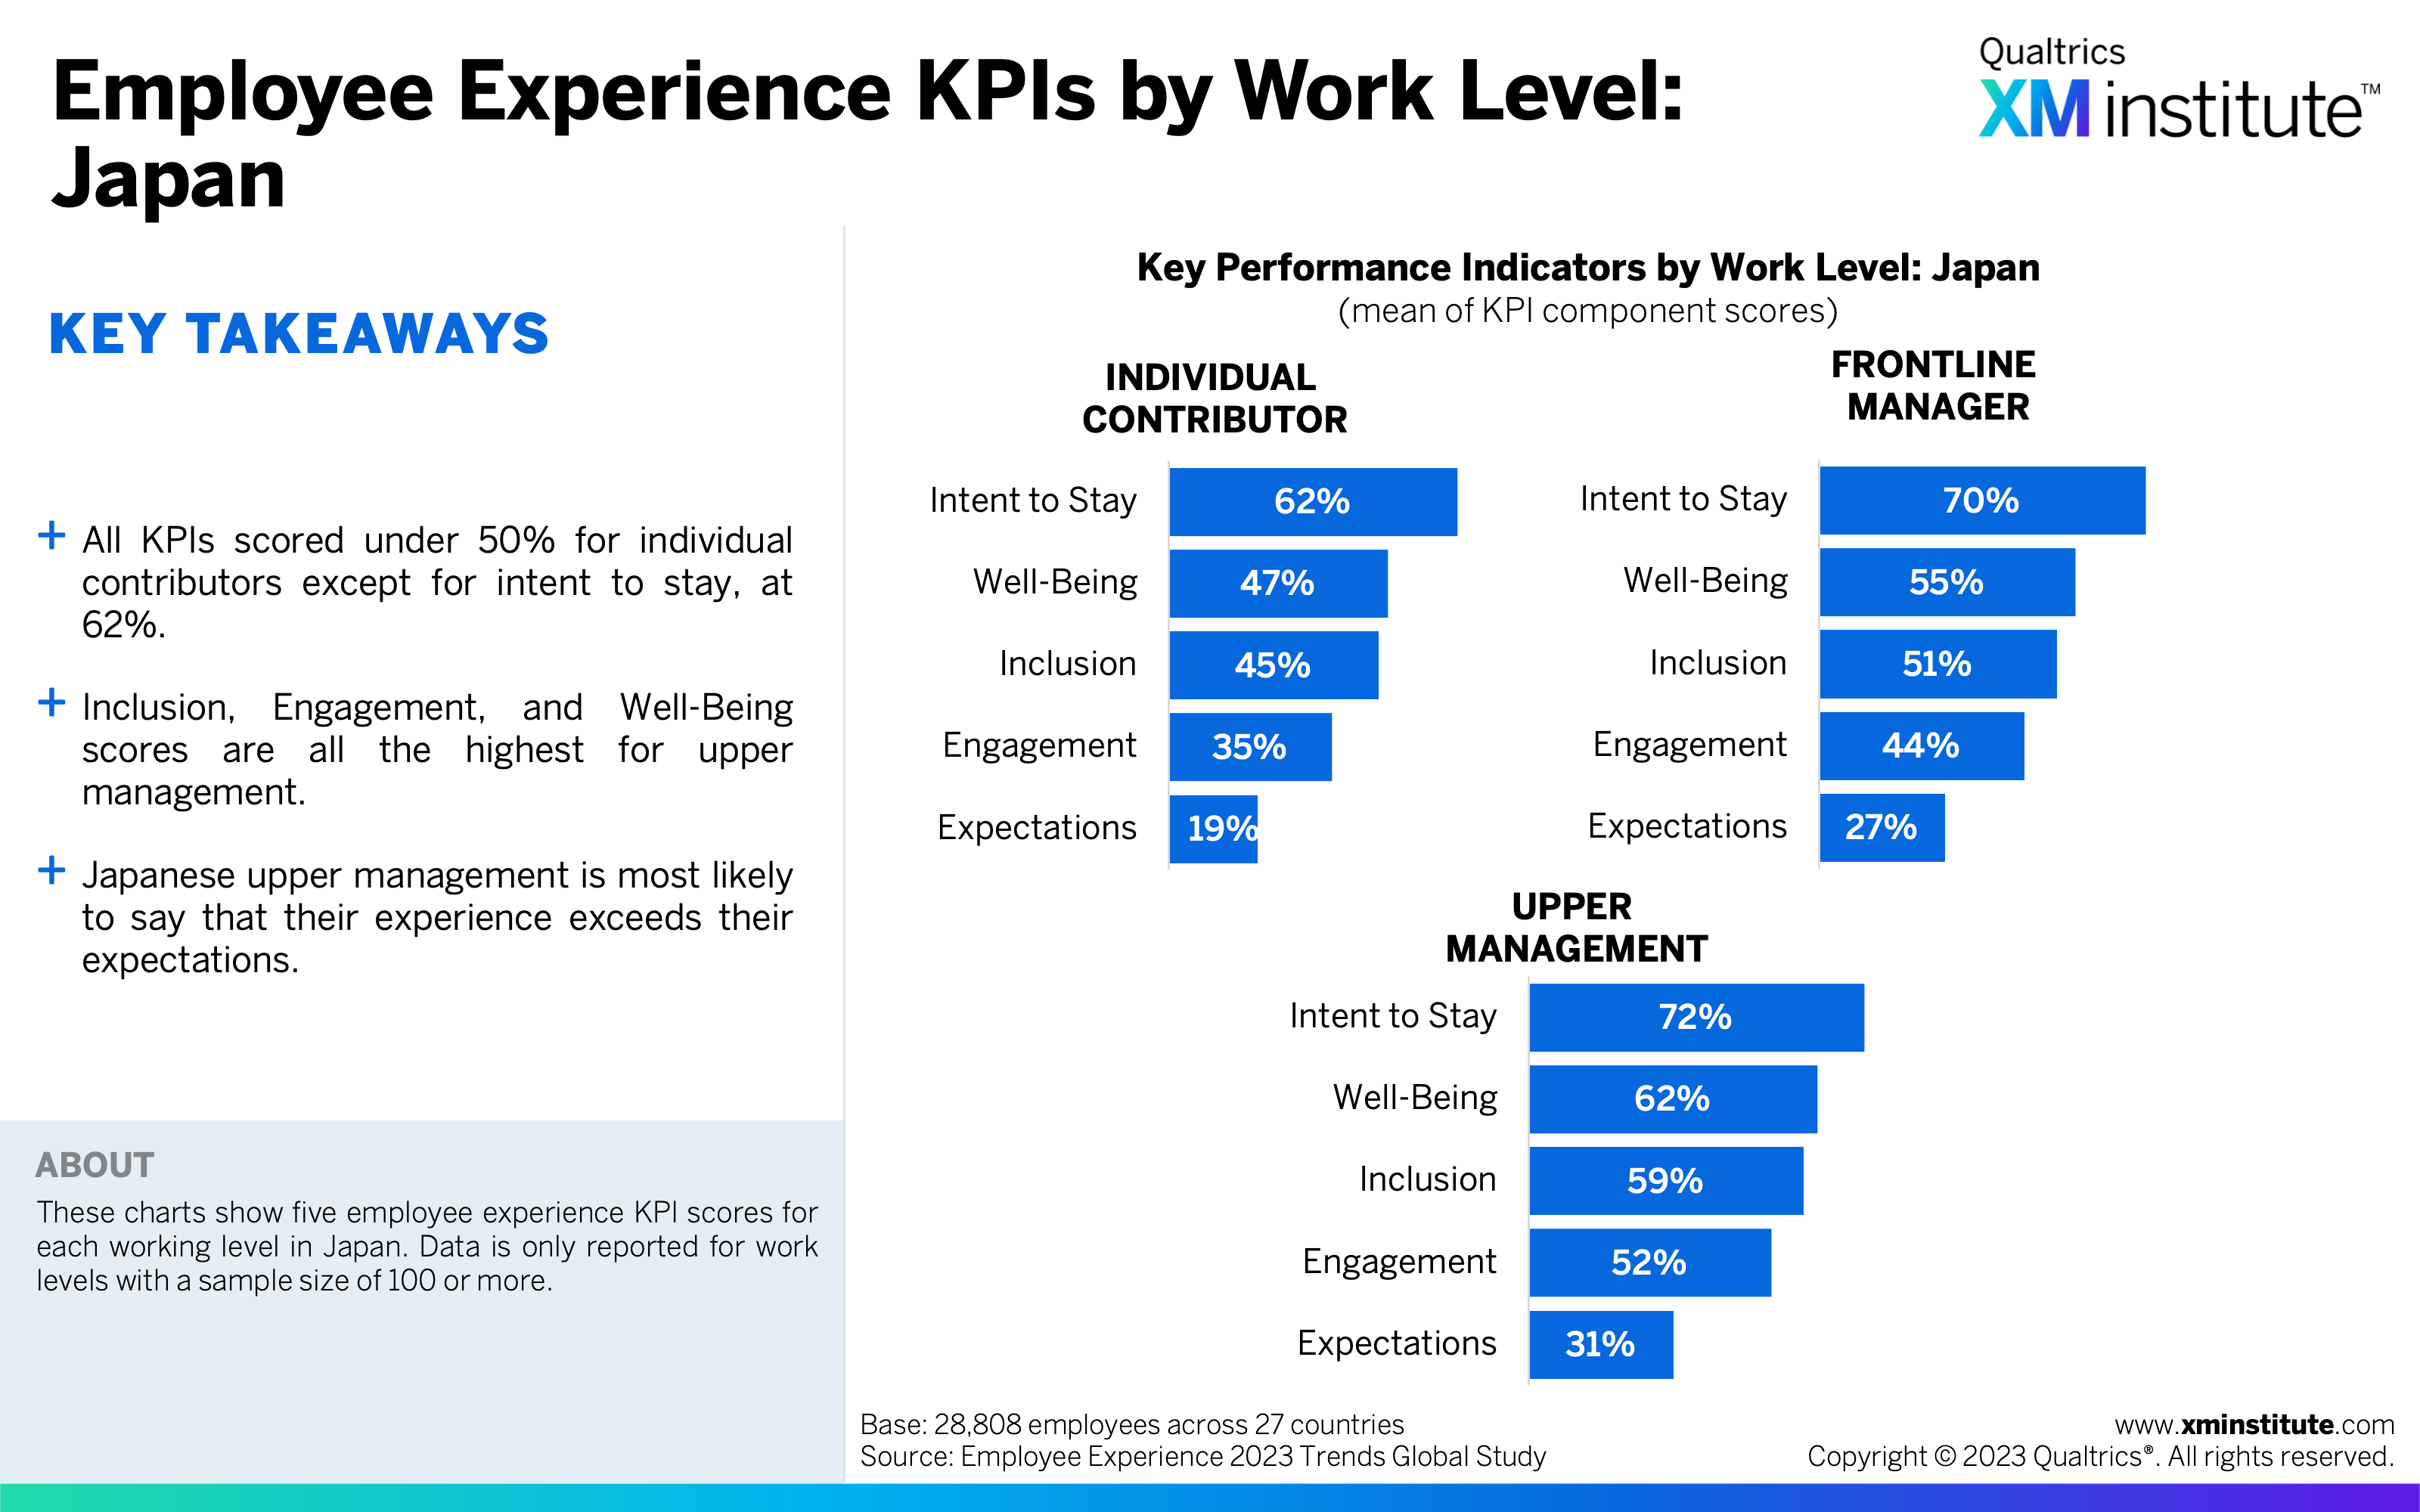
- Employee Experience KPIs by Work Level: Japan (see Figure 21)
- Employee Experience KPIs: Malaysia (see Figure 22)
- Employee Experience KPIs by Work Level: Malaysia (see Figure 23)
- Employee Experience KPIs: New Zealand (see Figure 24)
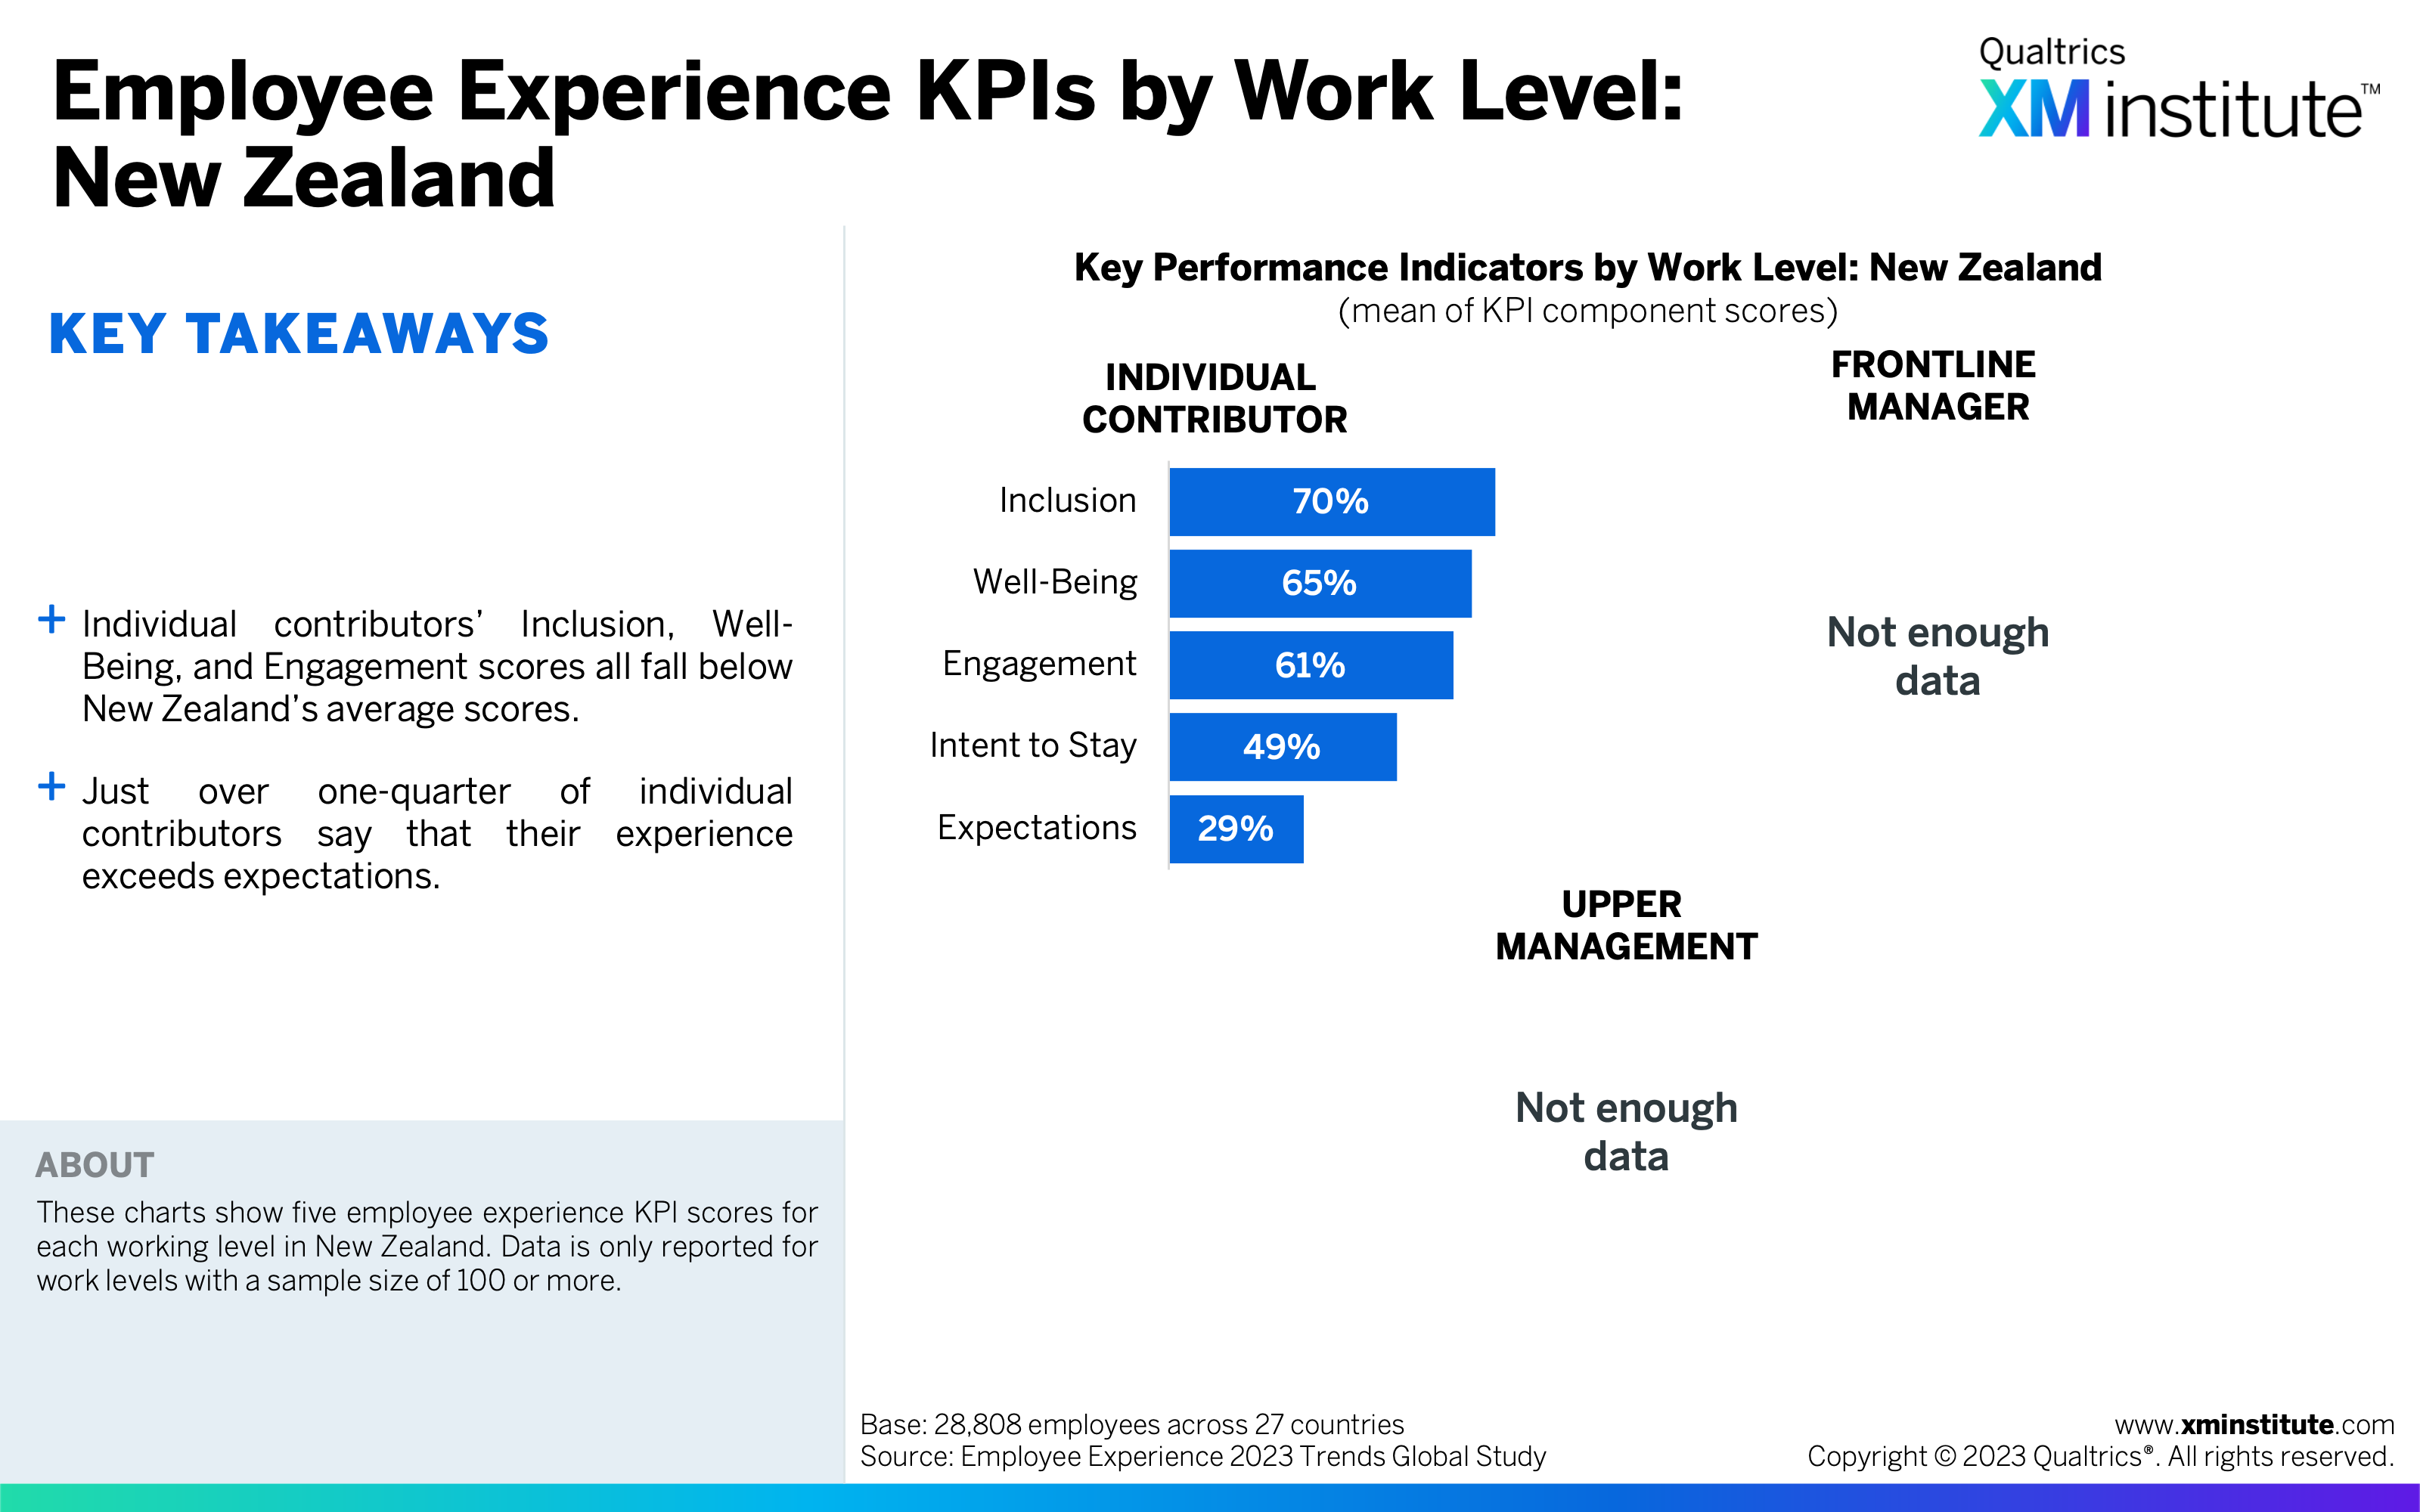
- Employee Experience KPIs by Work Level: New Zealand (see Figure 25)
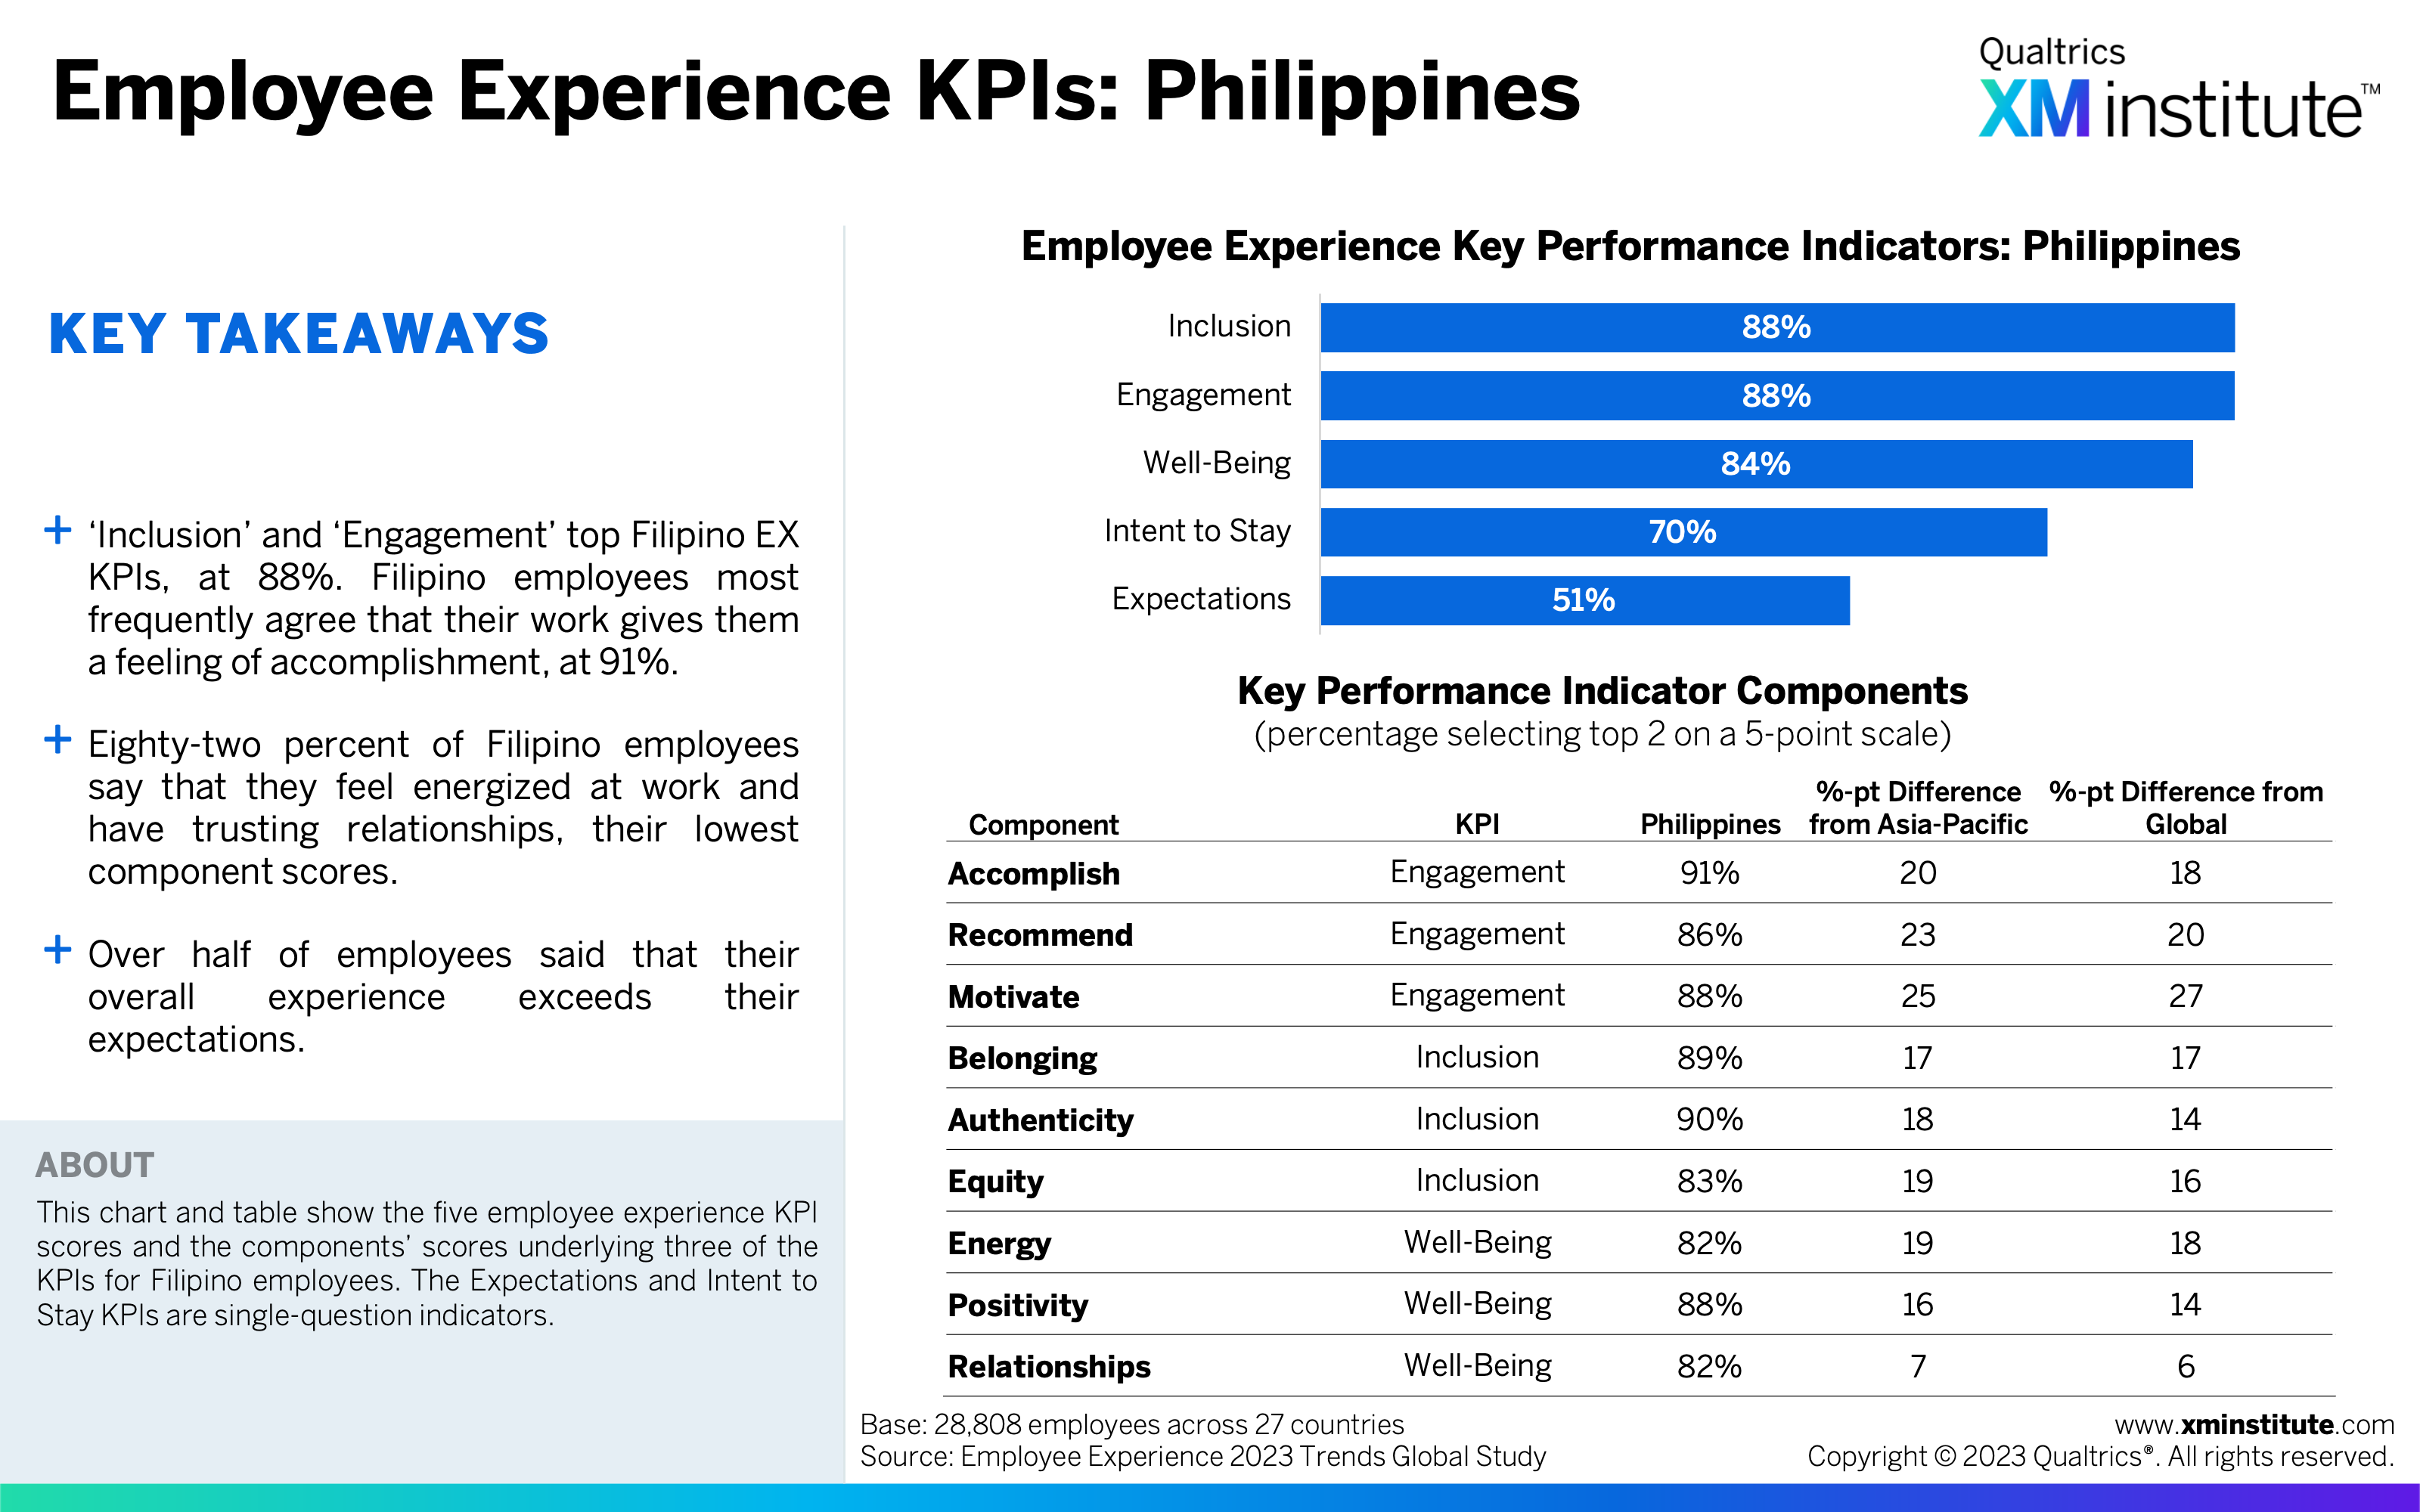
- Employee Experience KPIs: Philippines (see Figure 26)
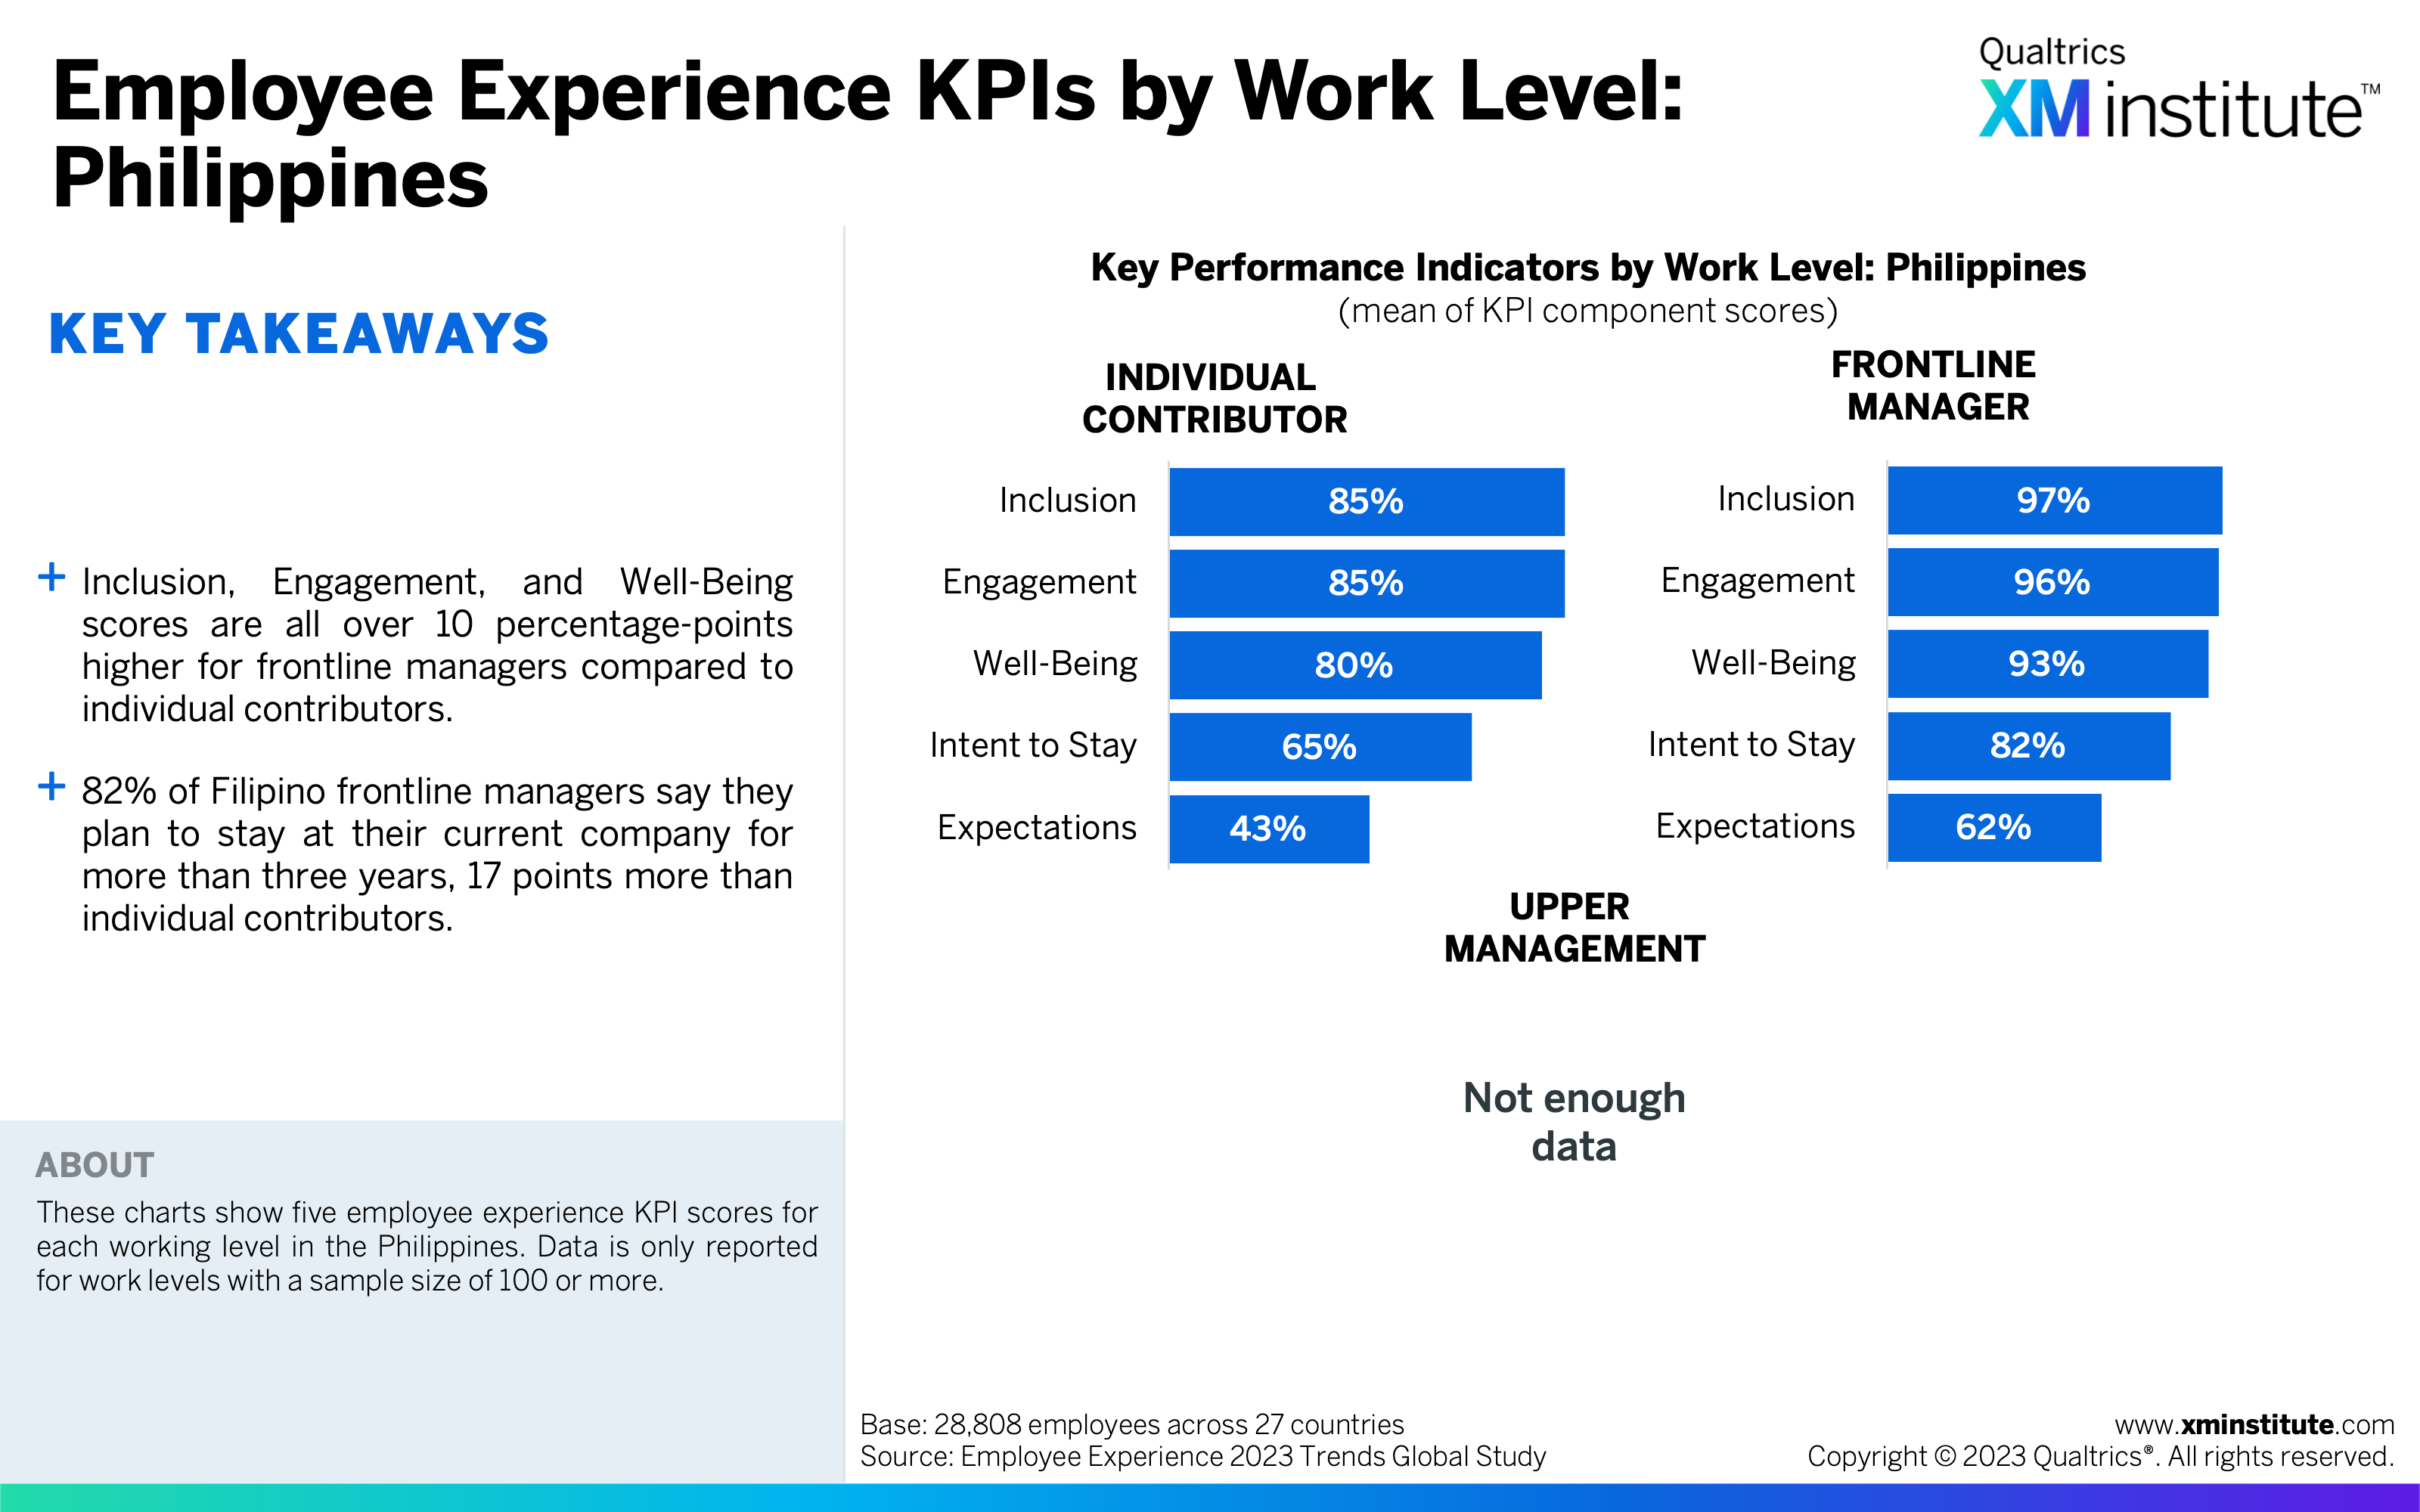
- Employee Experience KPIs by Work Level: Philippines (see Figure 27)
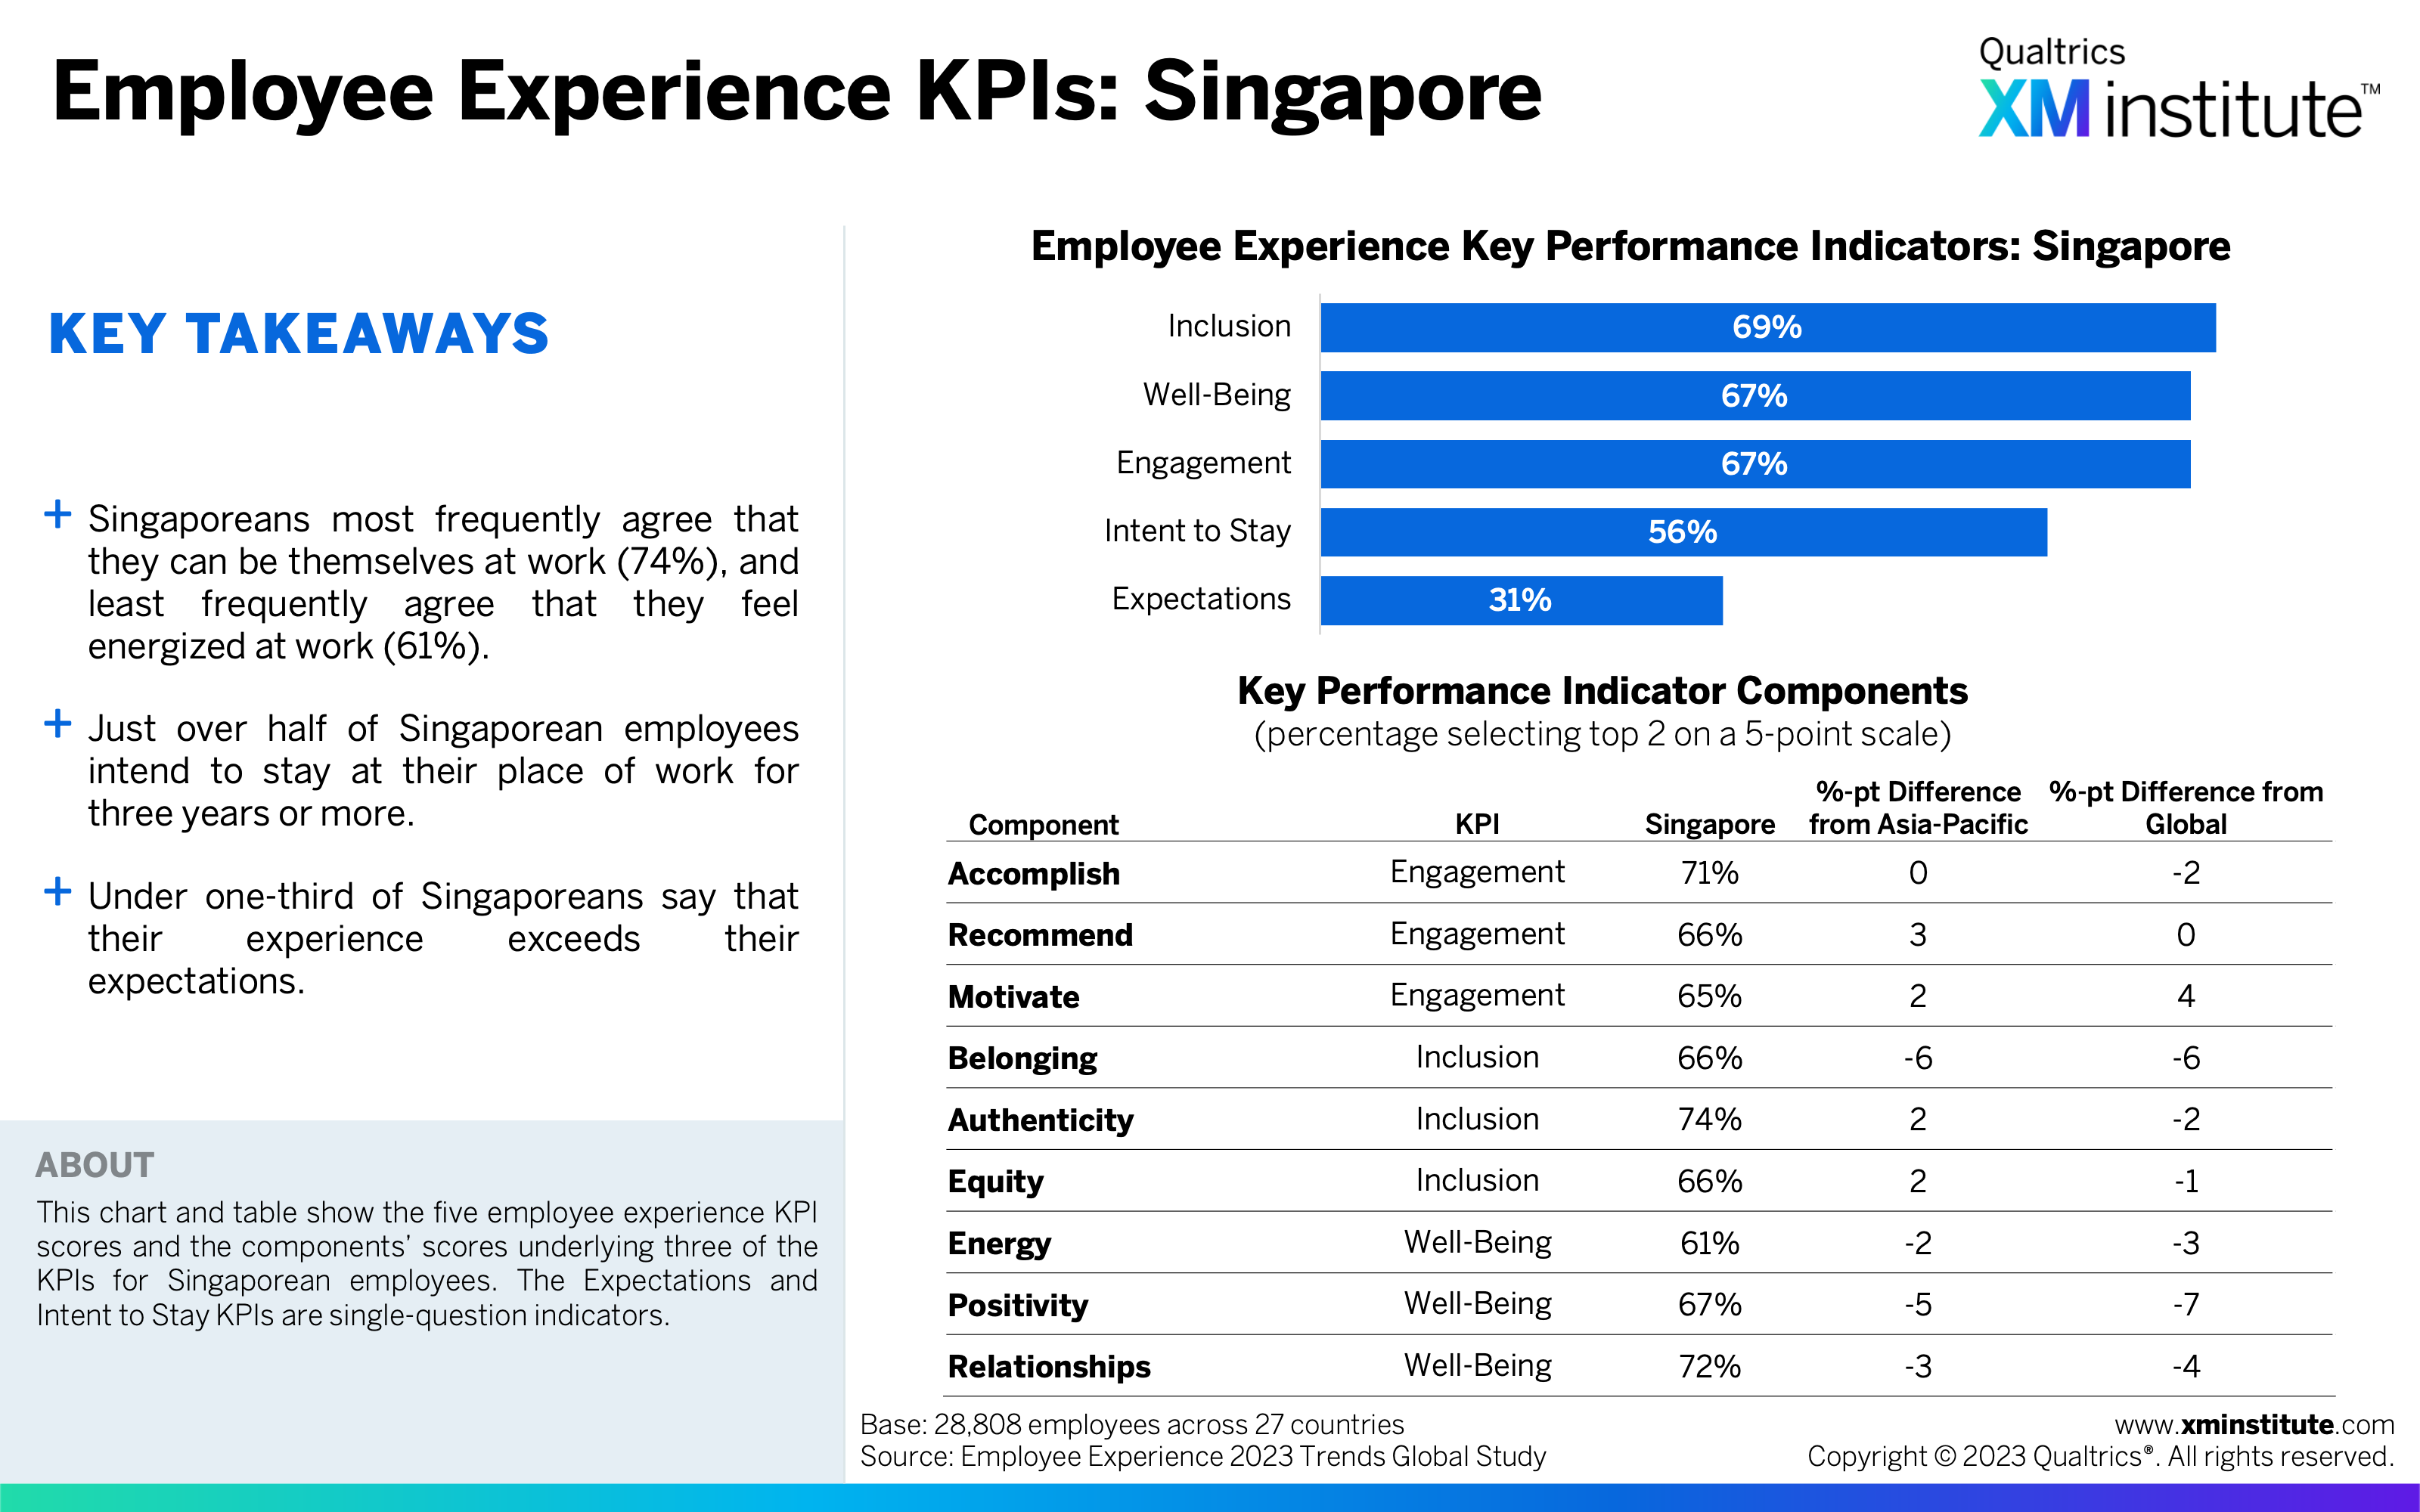
- Employee Experience KPIs: Singapore (see Figure 28)
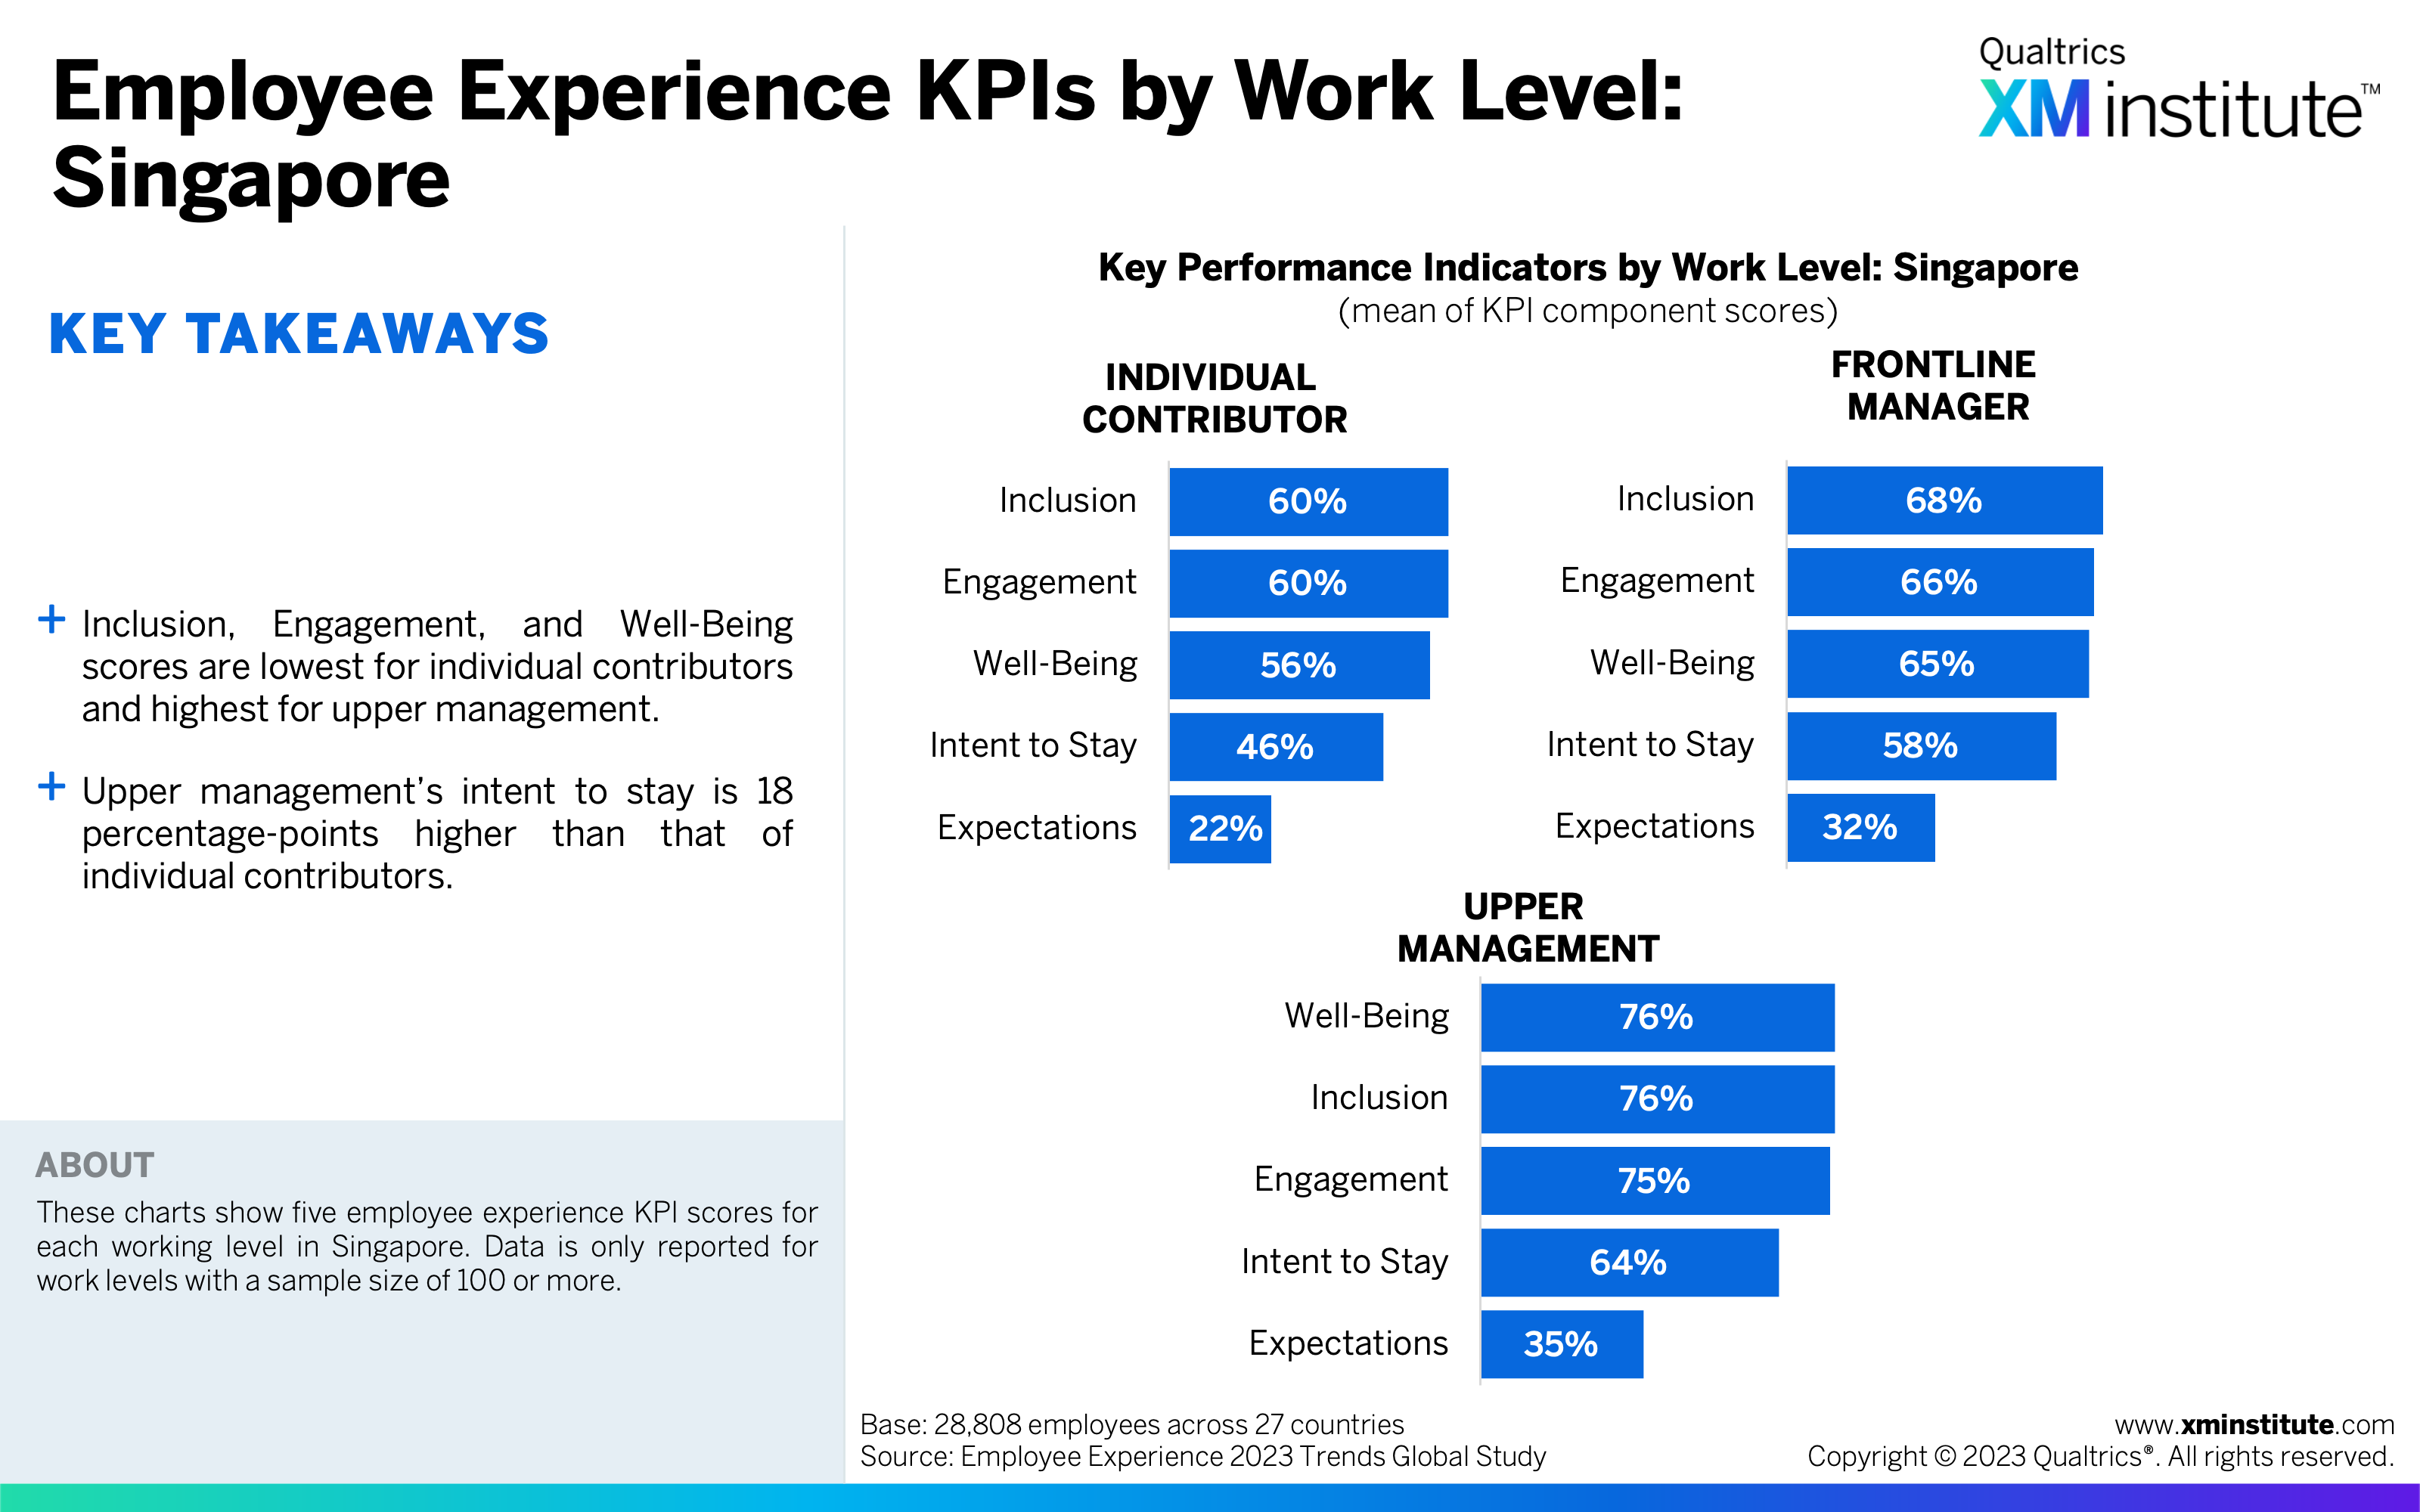
- Employee Experience KPIs by Work Level: Singapore (see Figure 29)
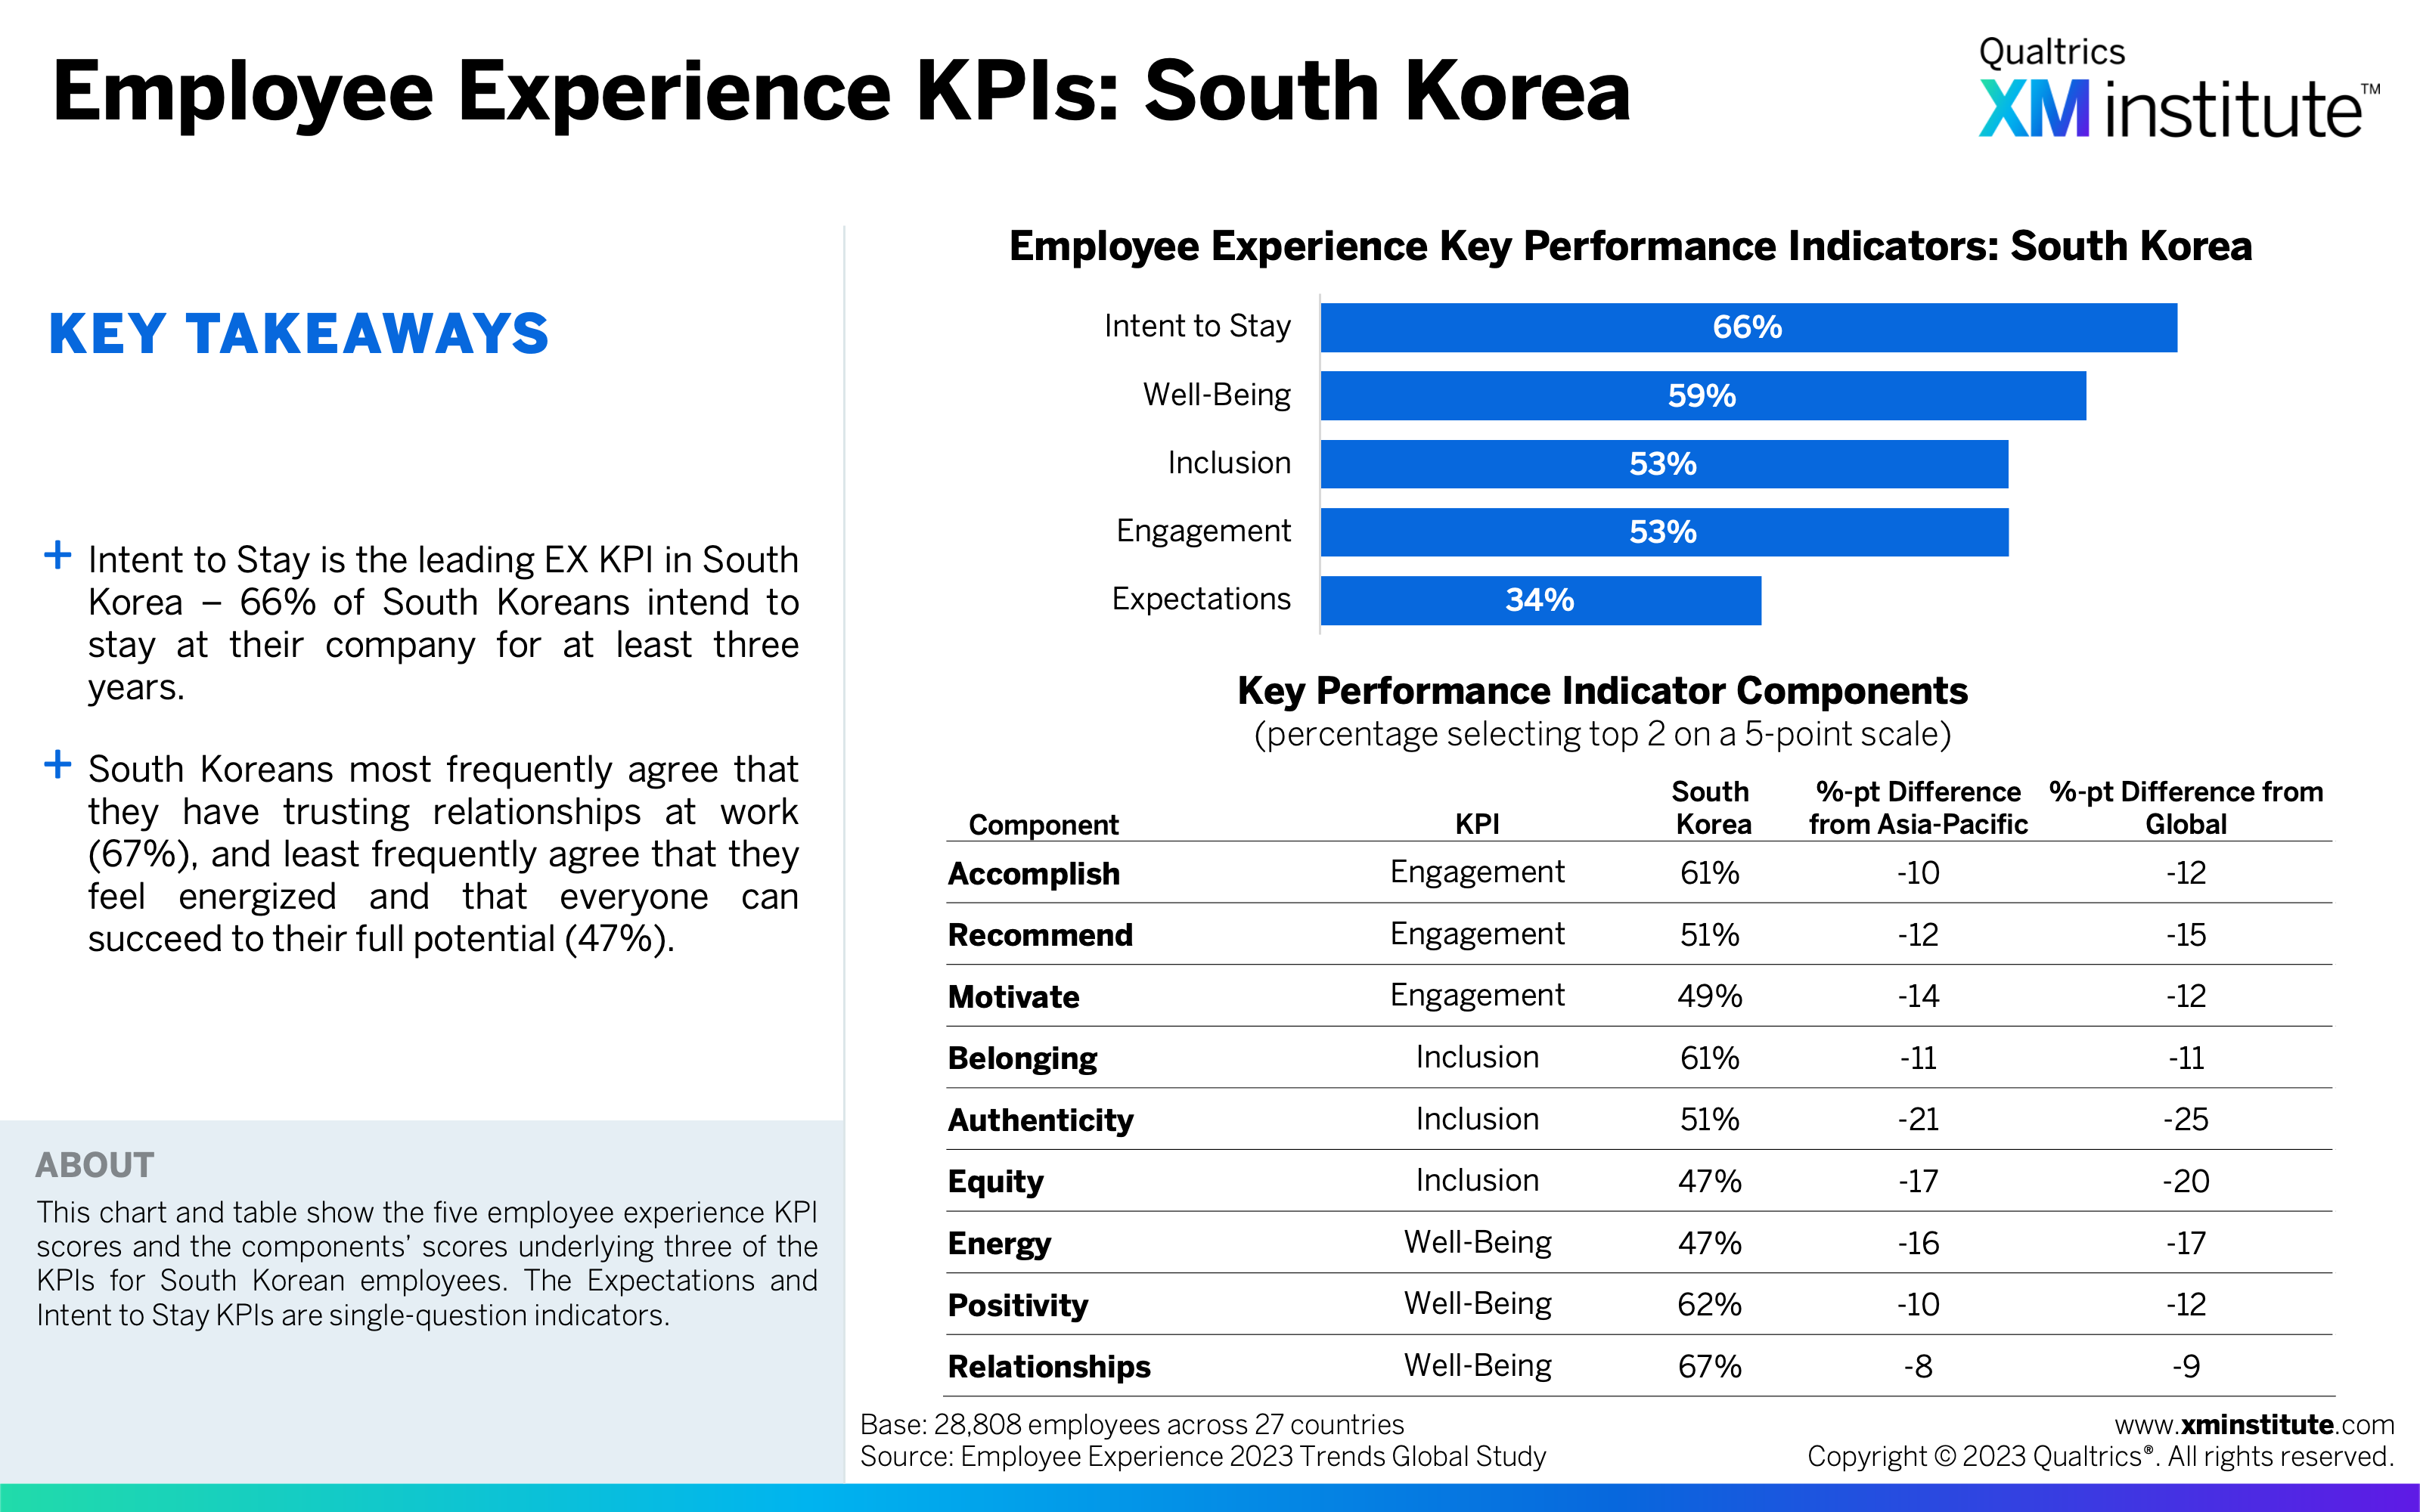
- Employee Experience KPIs: South Korea (see Figure 30)
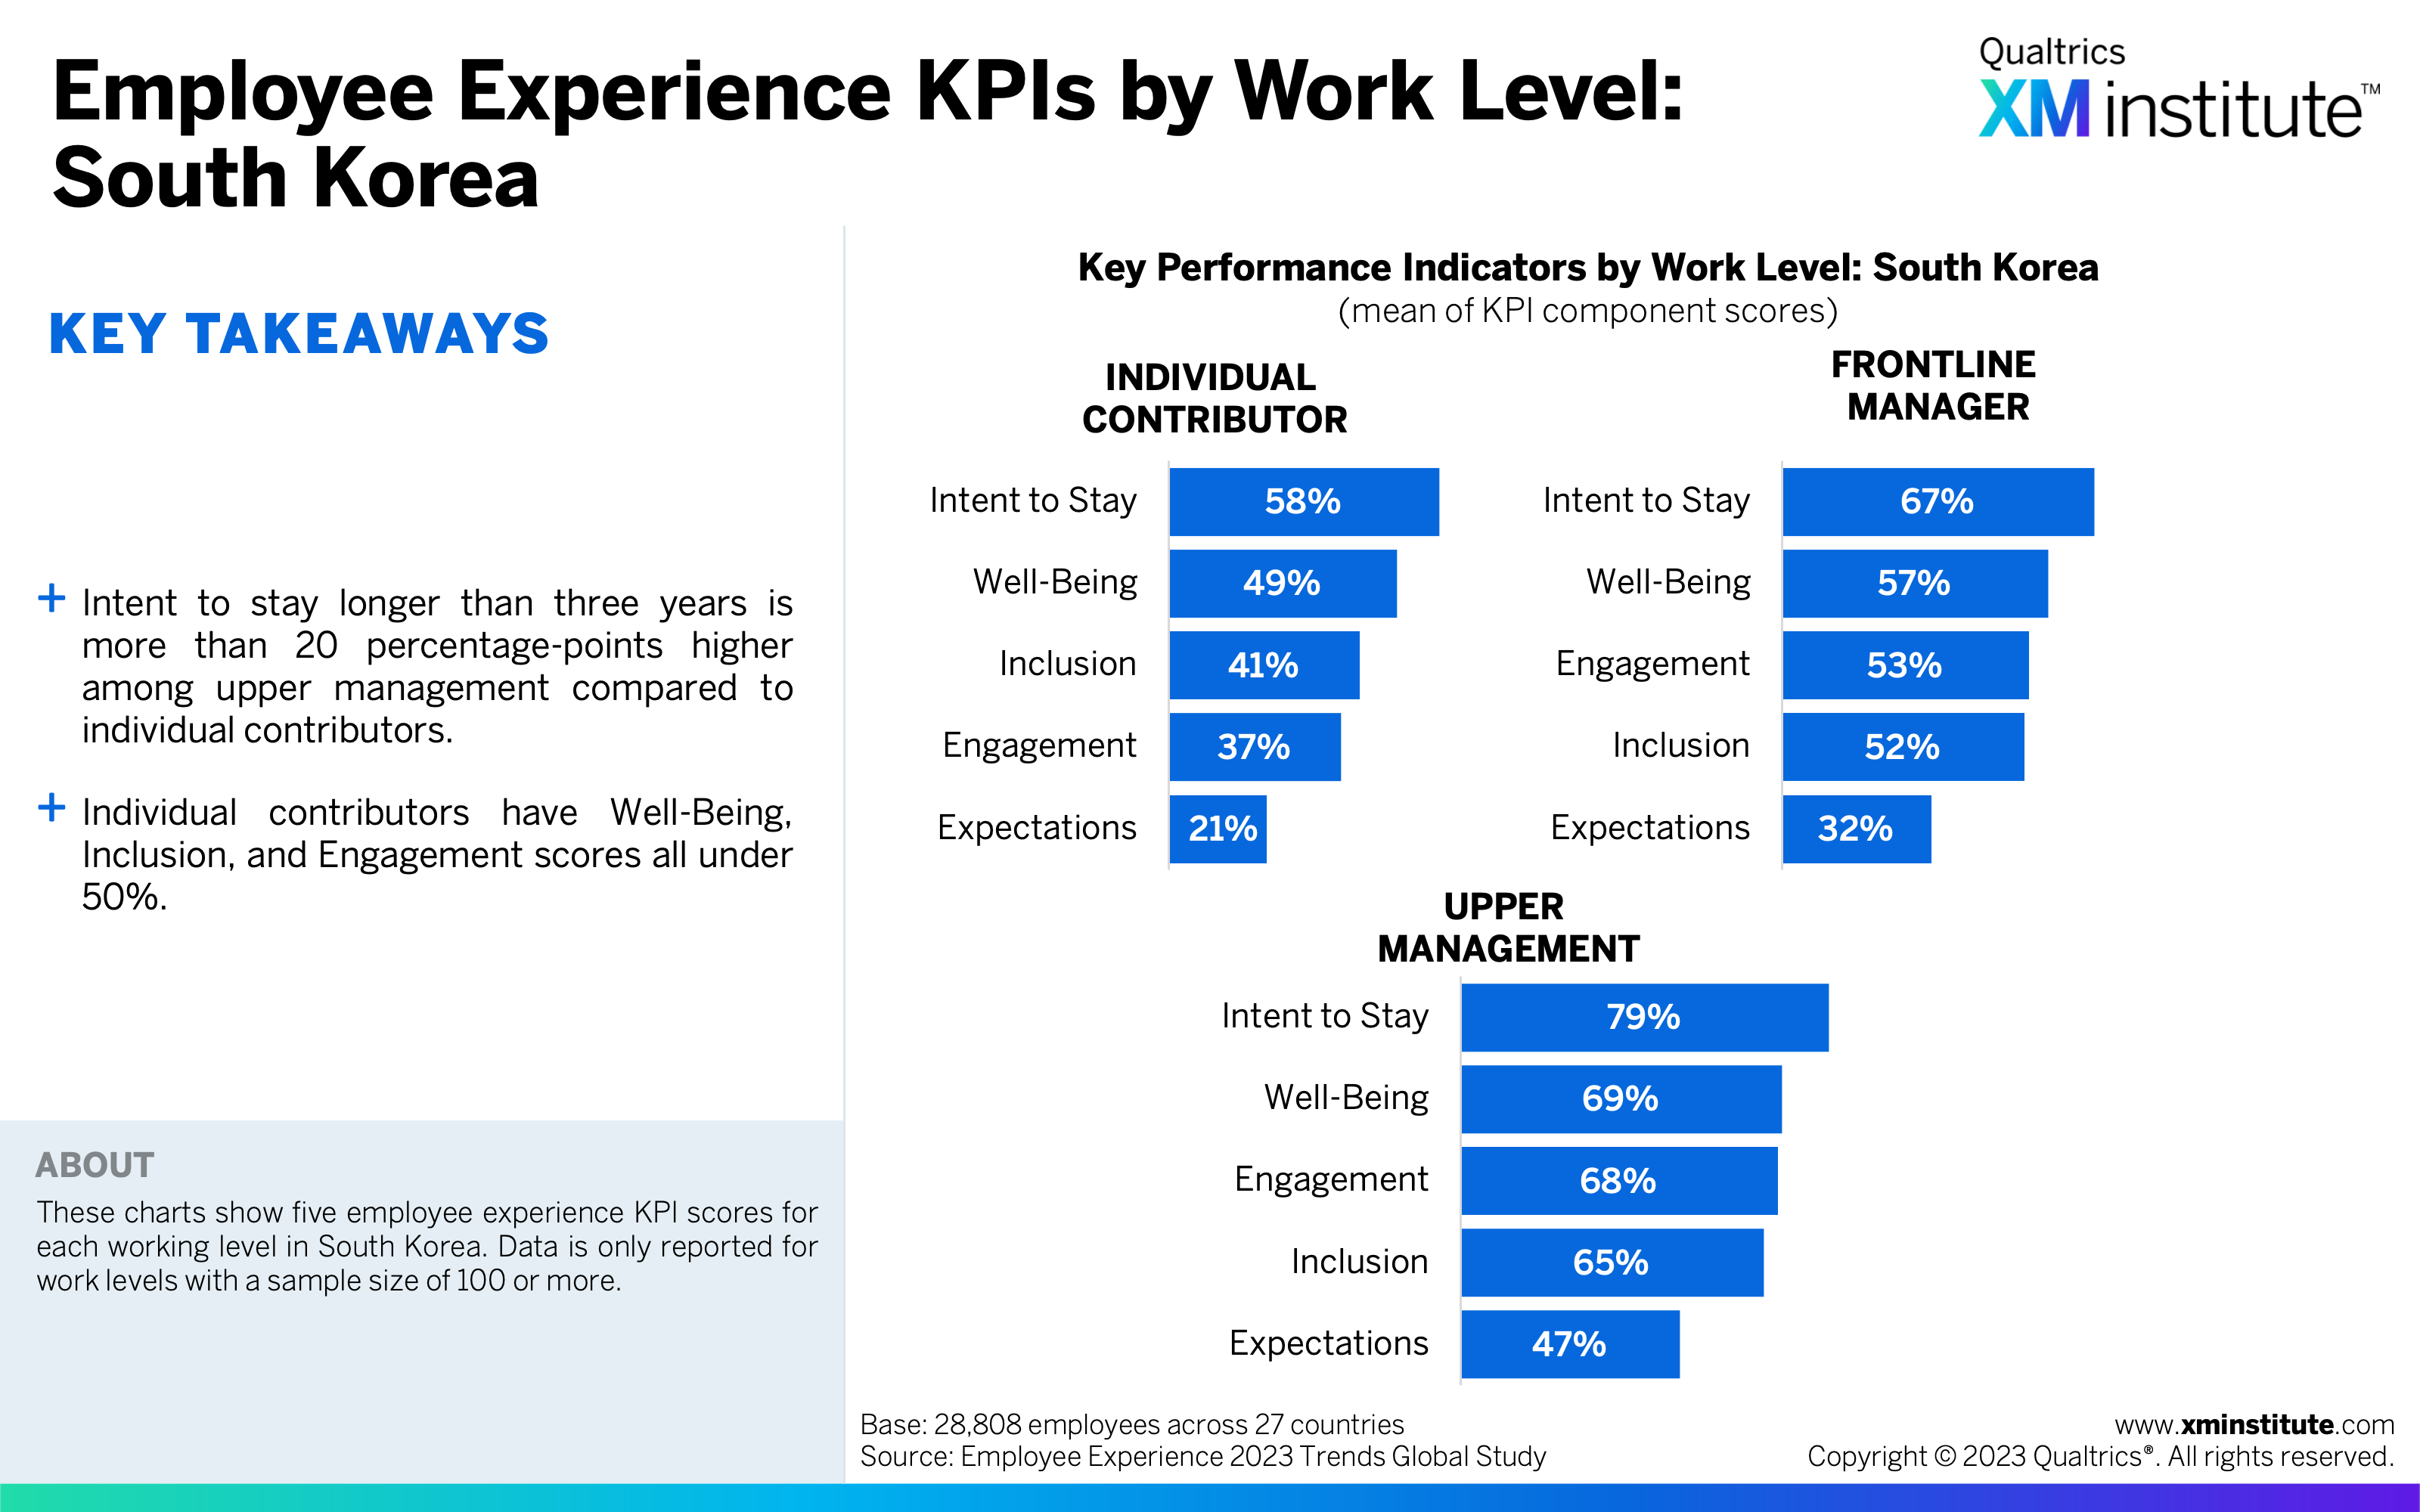
- Employee Experience KPIs by Work Level: South Korea (see Figure 31)
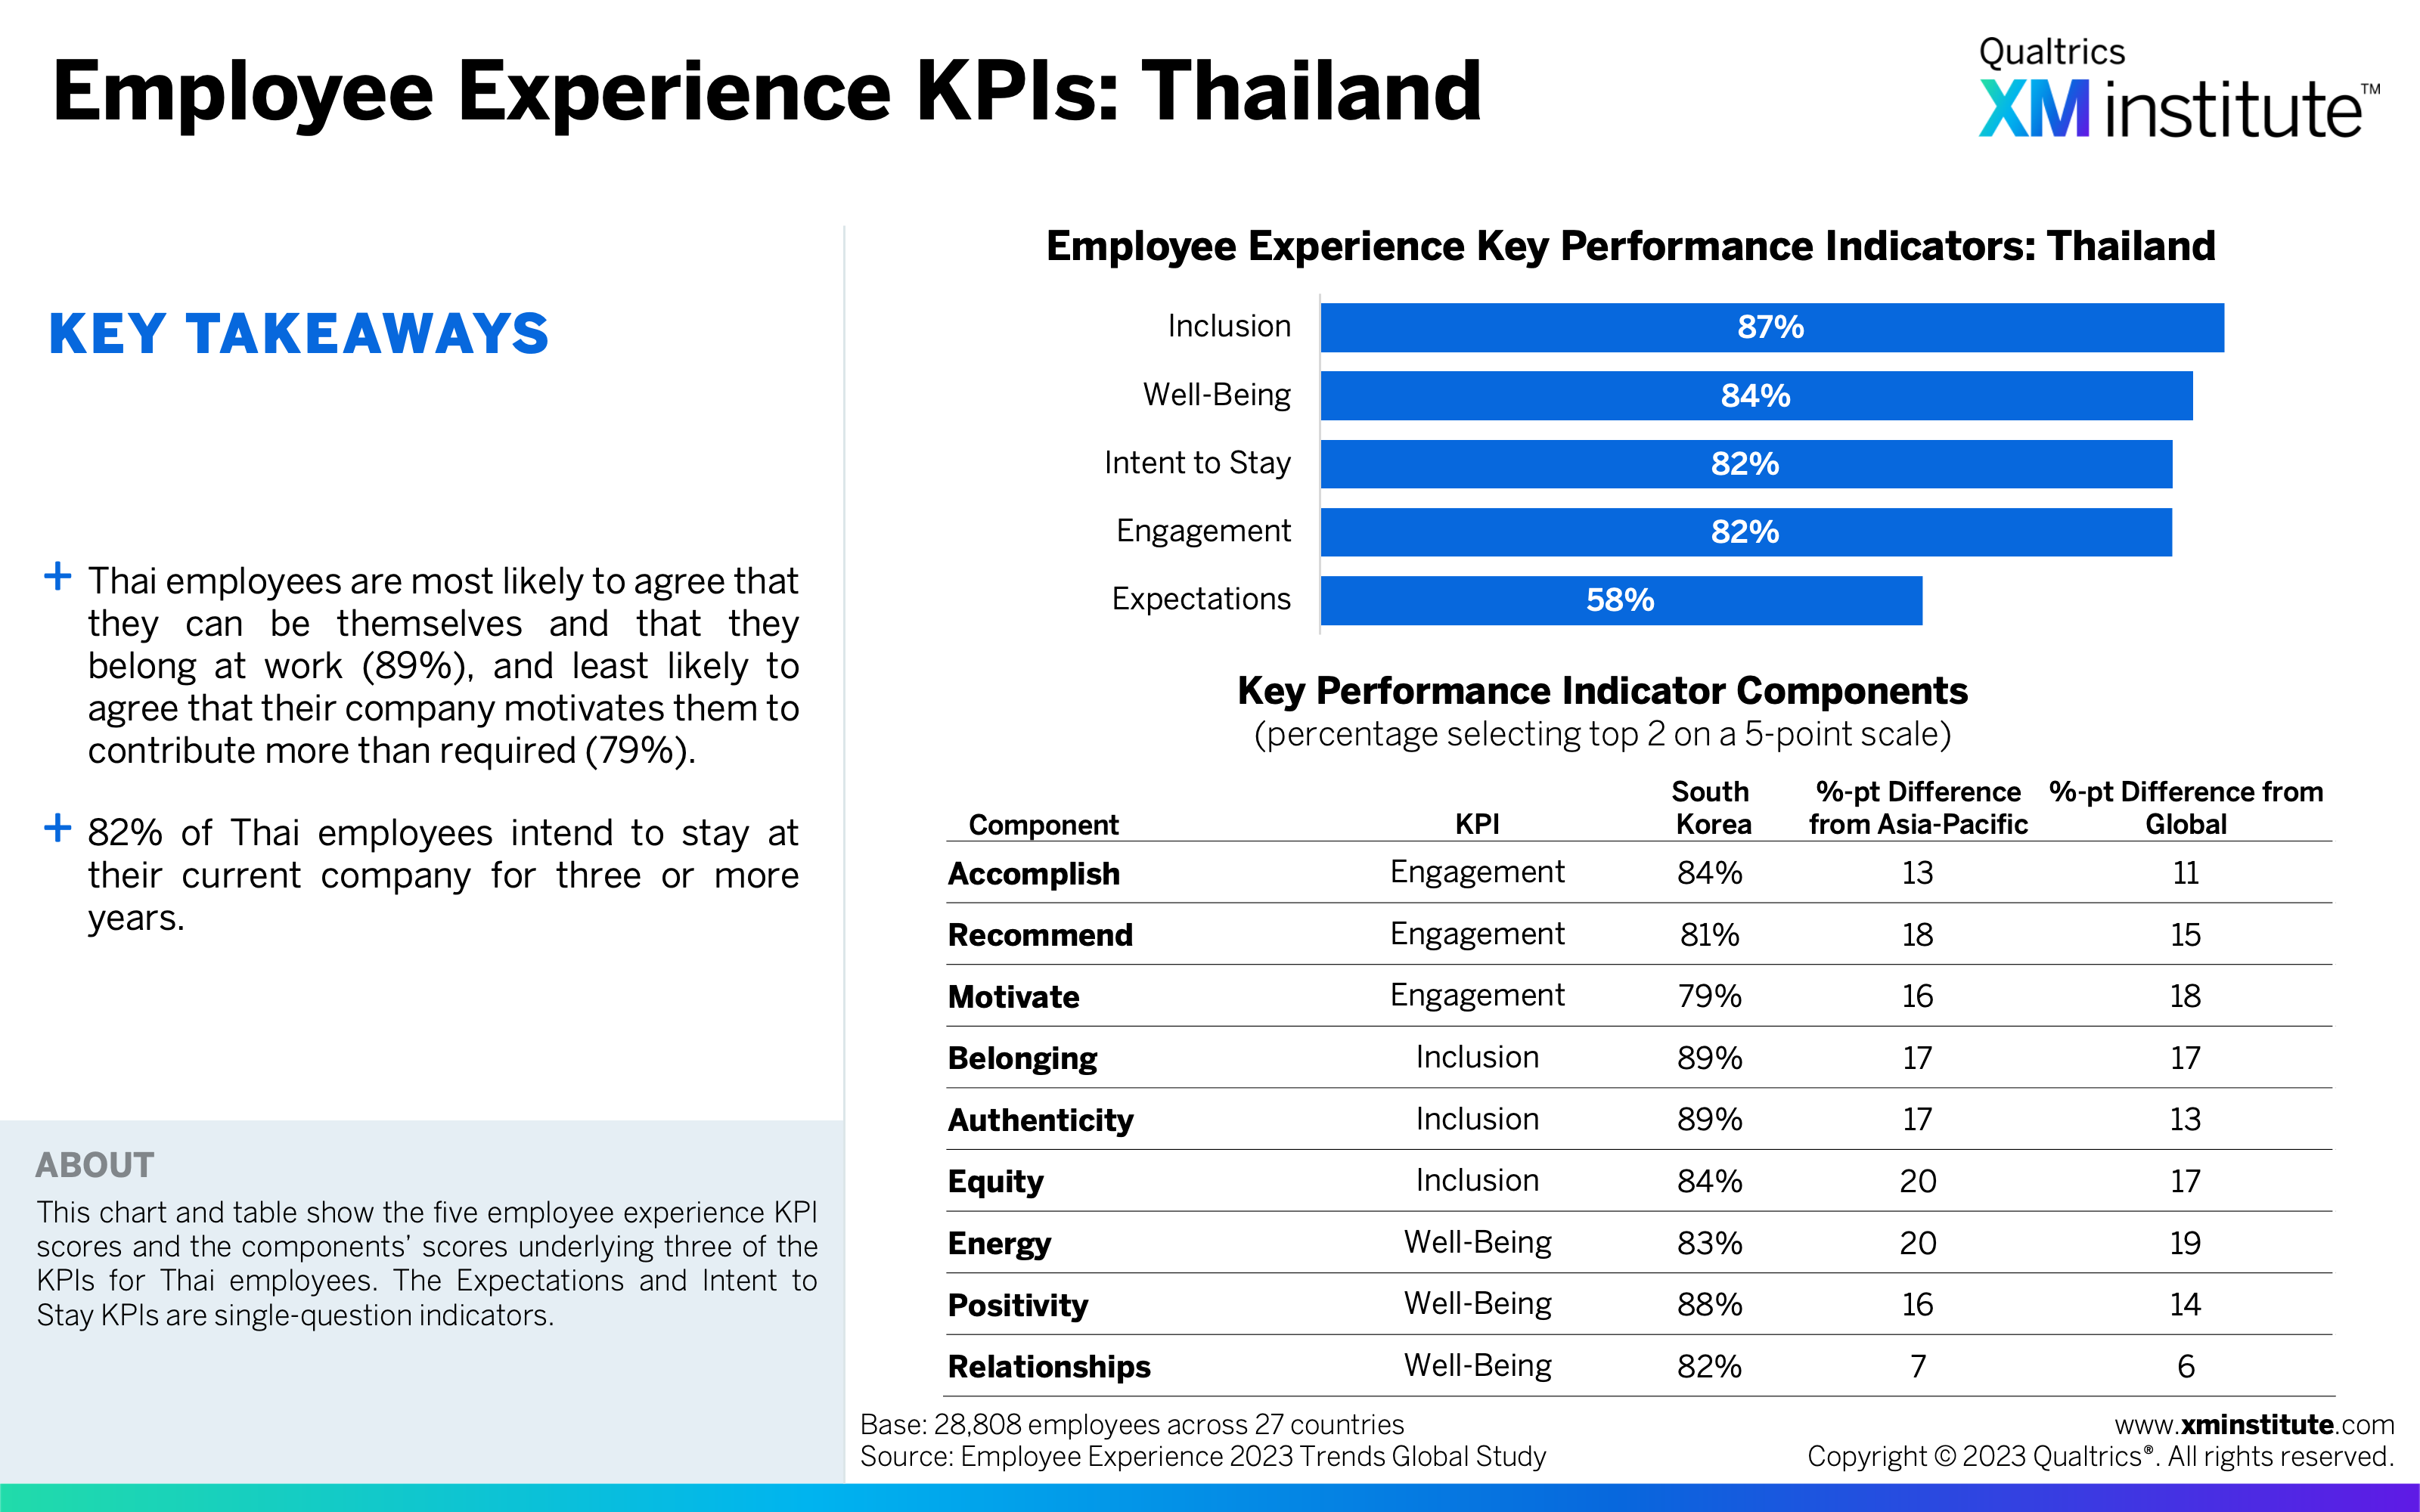
- Employee Experience KPIs: Thailand (see Figure 32)
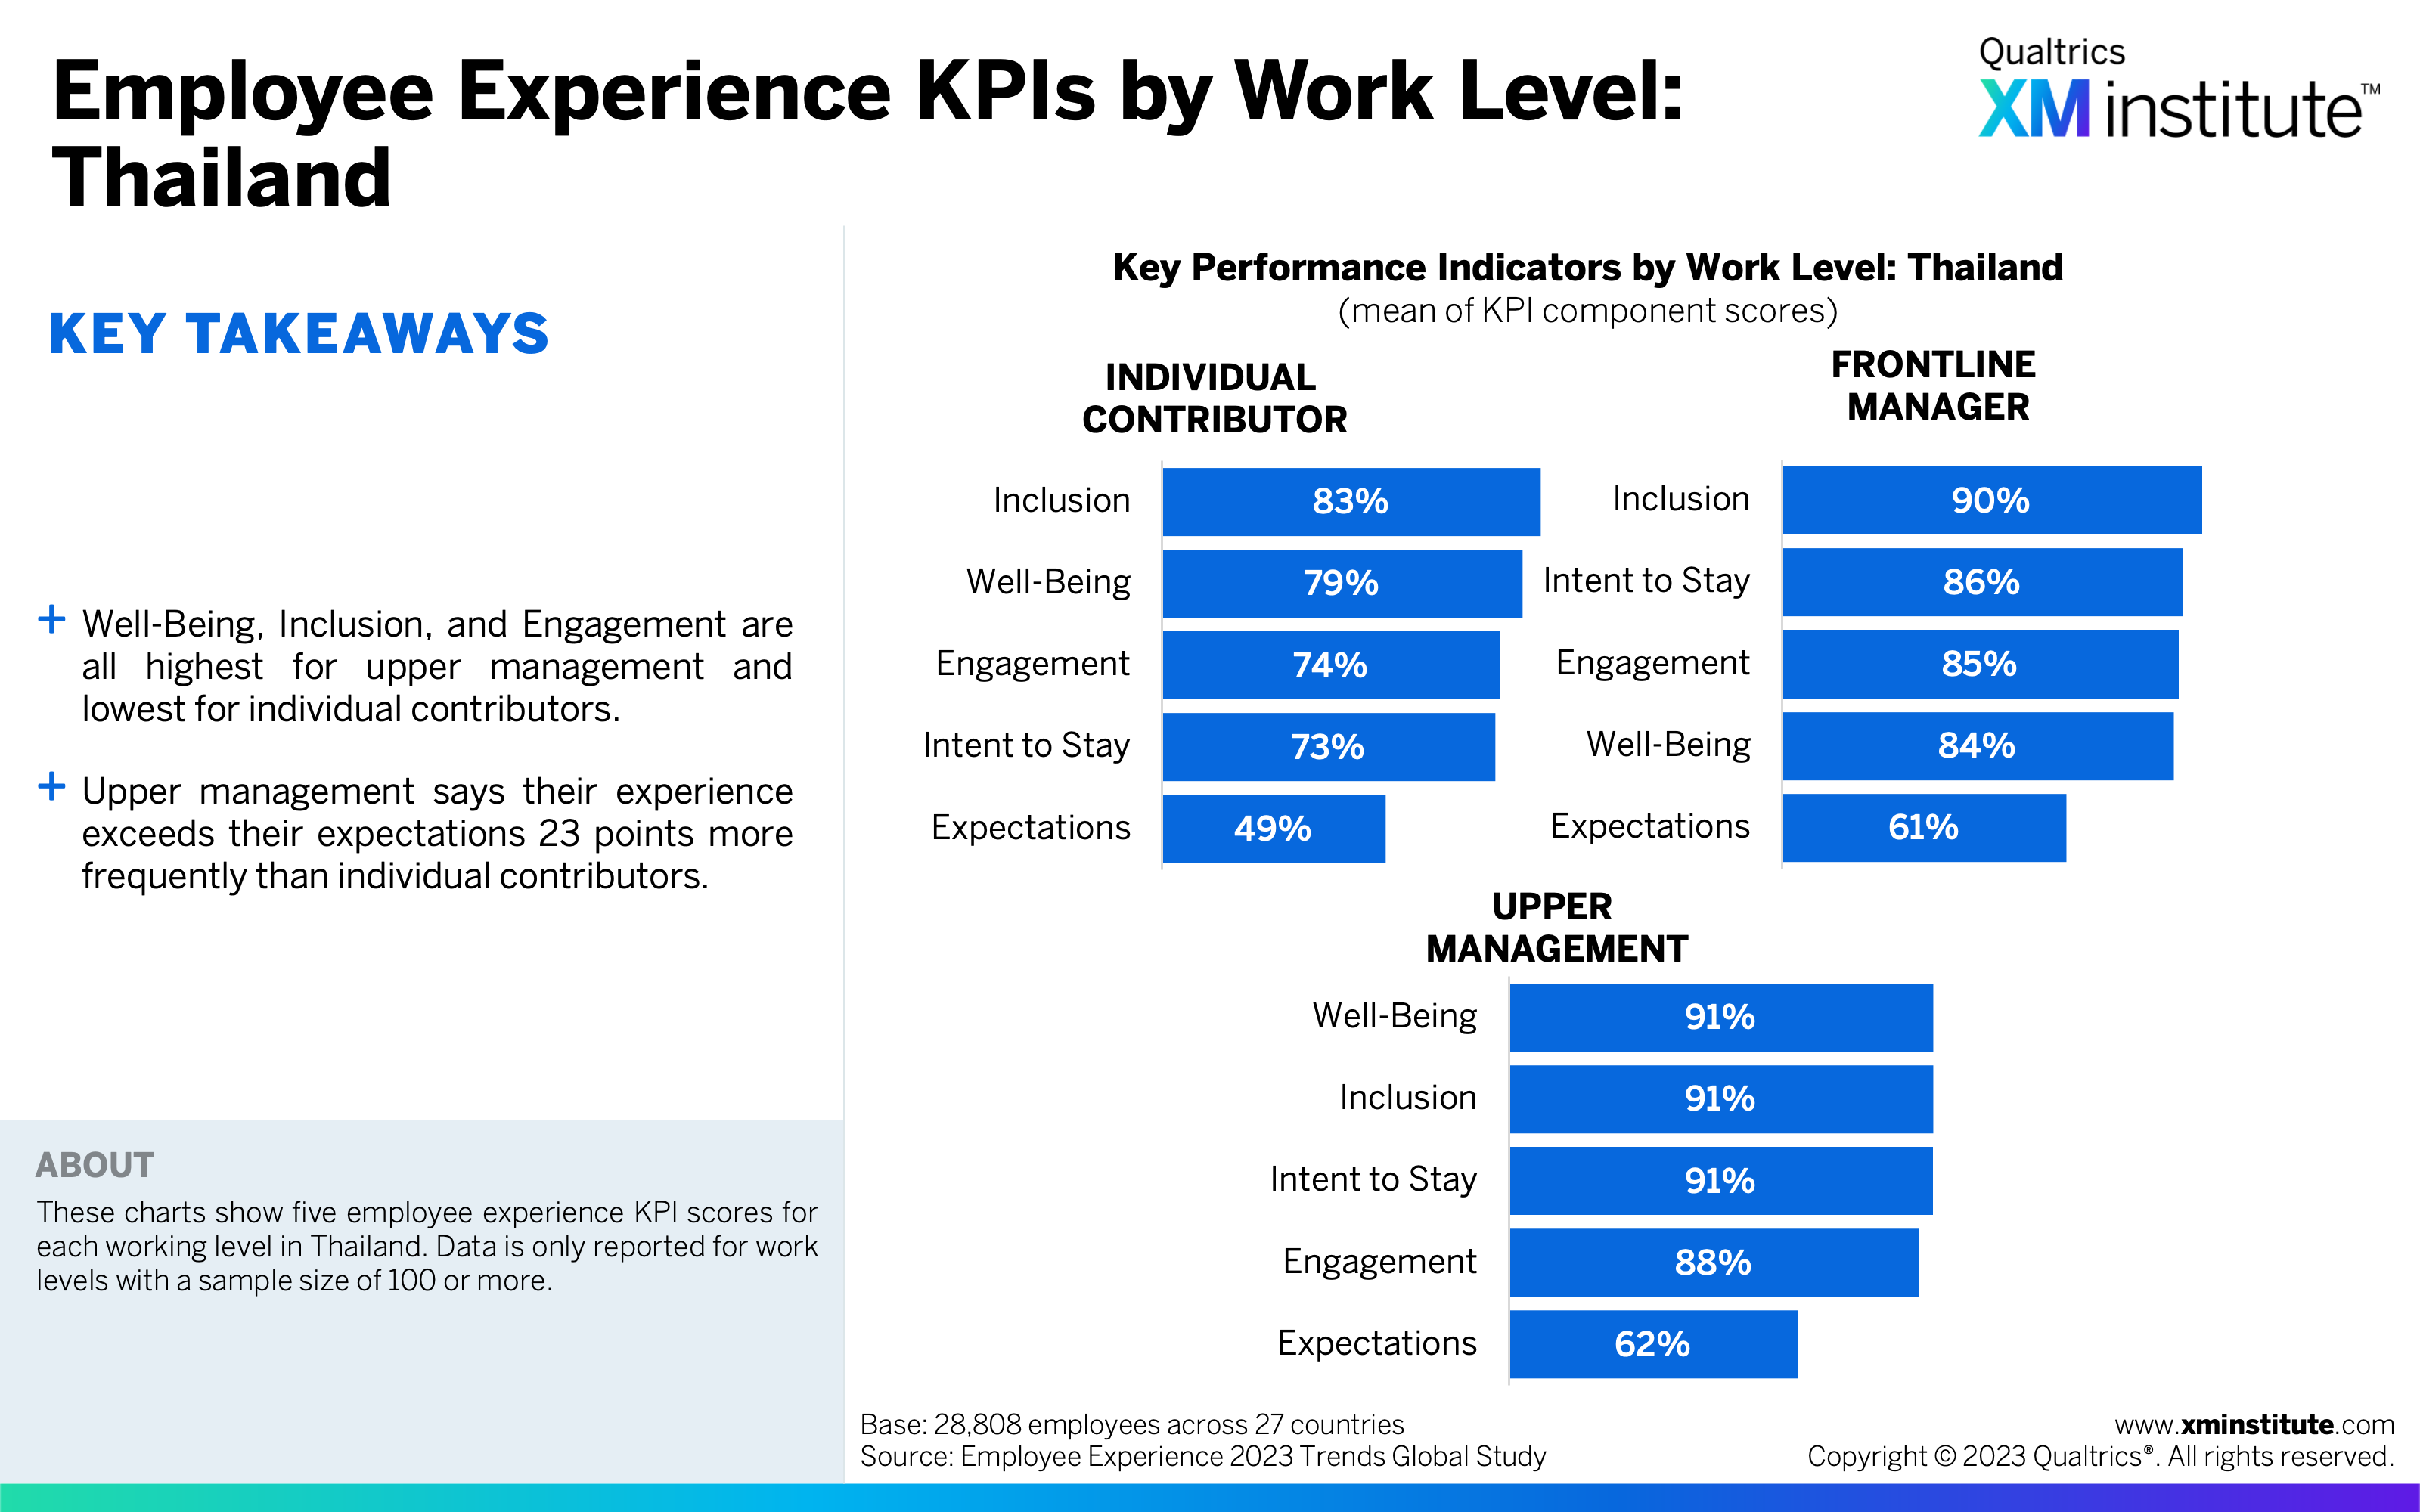
- Employee Experience KPIs by Work Level: Thailand (see Figure 33)
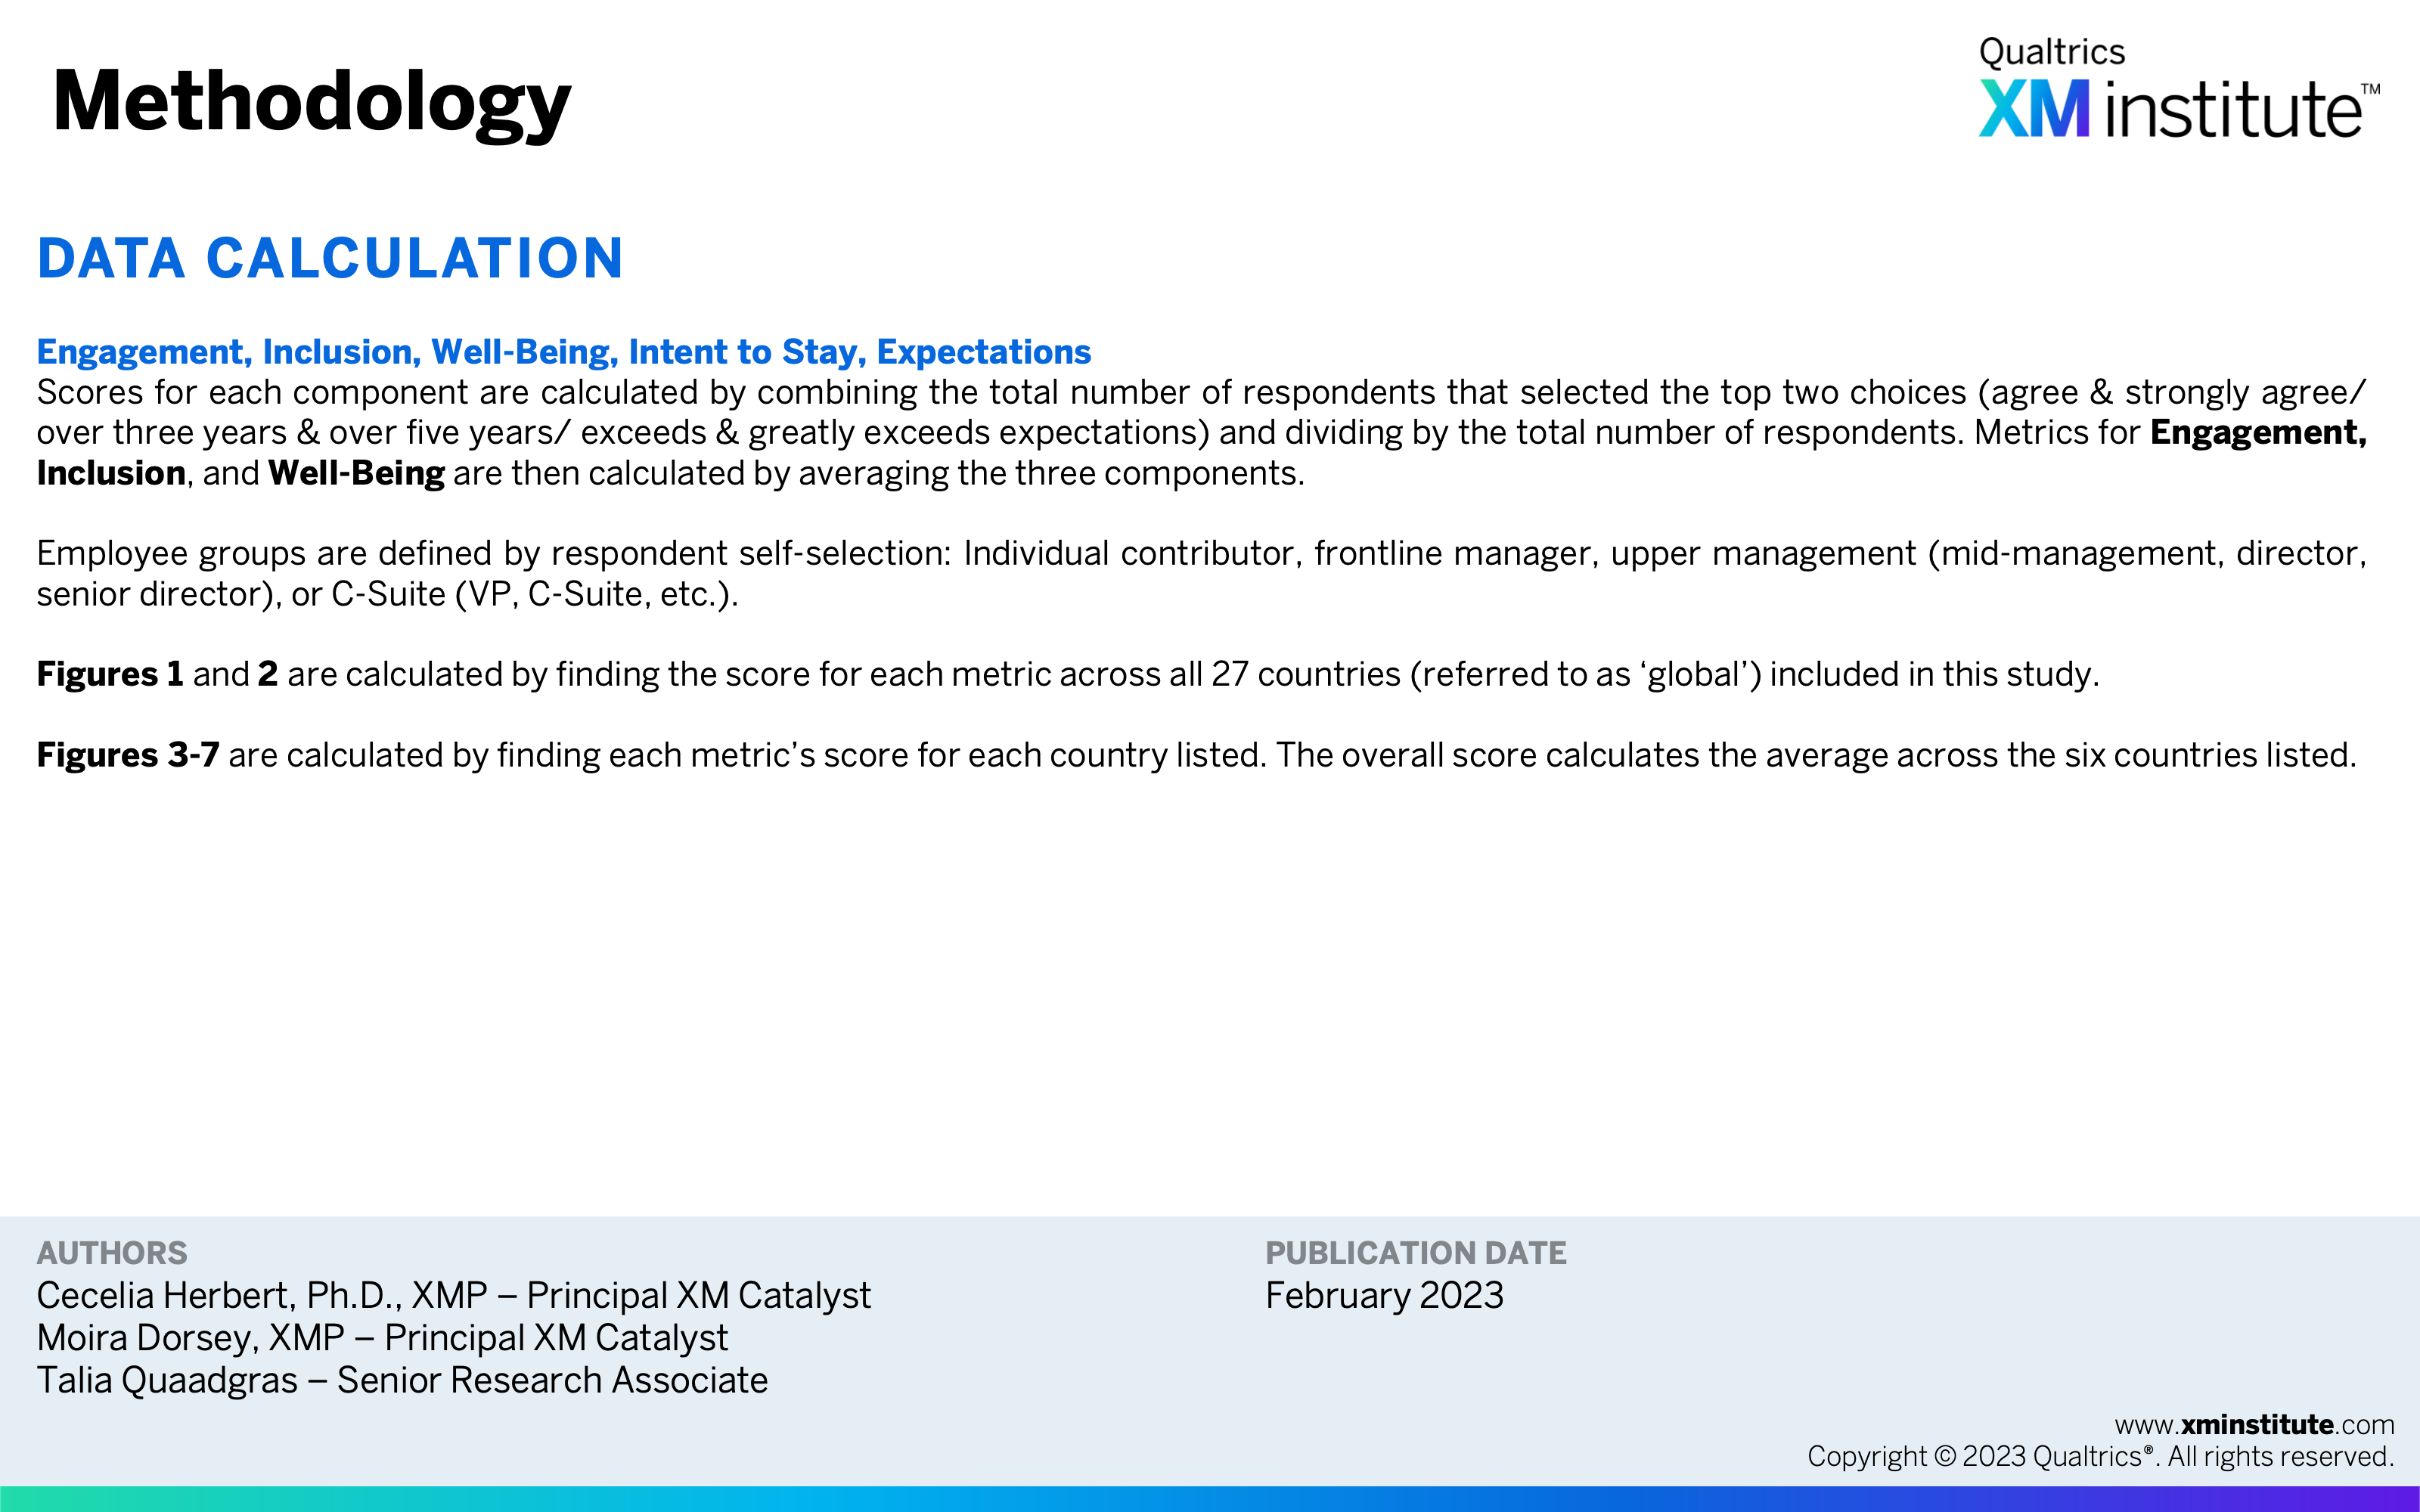
- Methodology (see Figure 34)