As part of Qualtrics’ global employee study, employees from 32 countries rated their current work experiences across several components. From this study, we analyzed the five key performance indicators (Engagement, Inclusion, Well-Being, Intent to Stay, and Experience v Expectations) for employee experience as well as the top seven drivers of Engagement in each country. In this snapshot, we share the metrics from Europe, the Middle East, and Africa (EMEA). We found that:
- KPI ratings vary by country. Experience v Expectations ratings span 32 percentage points in this region, the greatest variation of all KPIs. Inclusion ratings have the smallest gap, spanning 17 percentage-points across the 12 countries measured in this region,
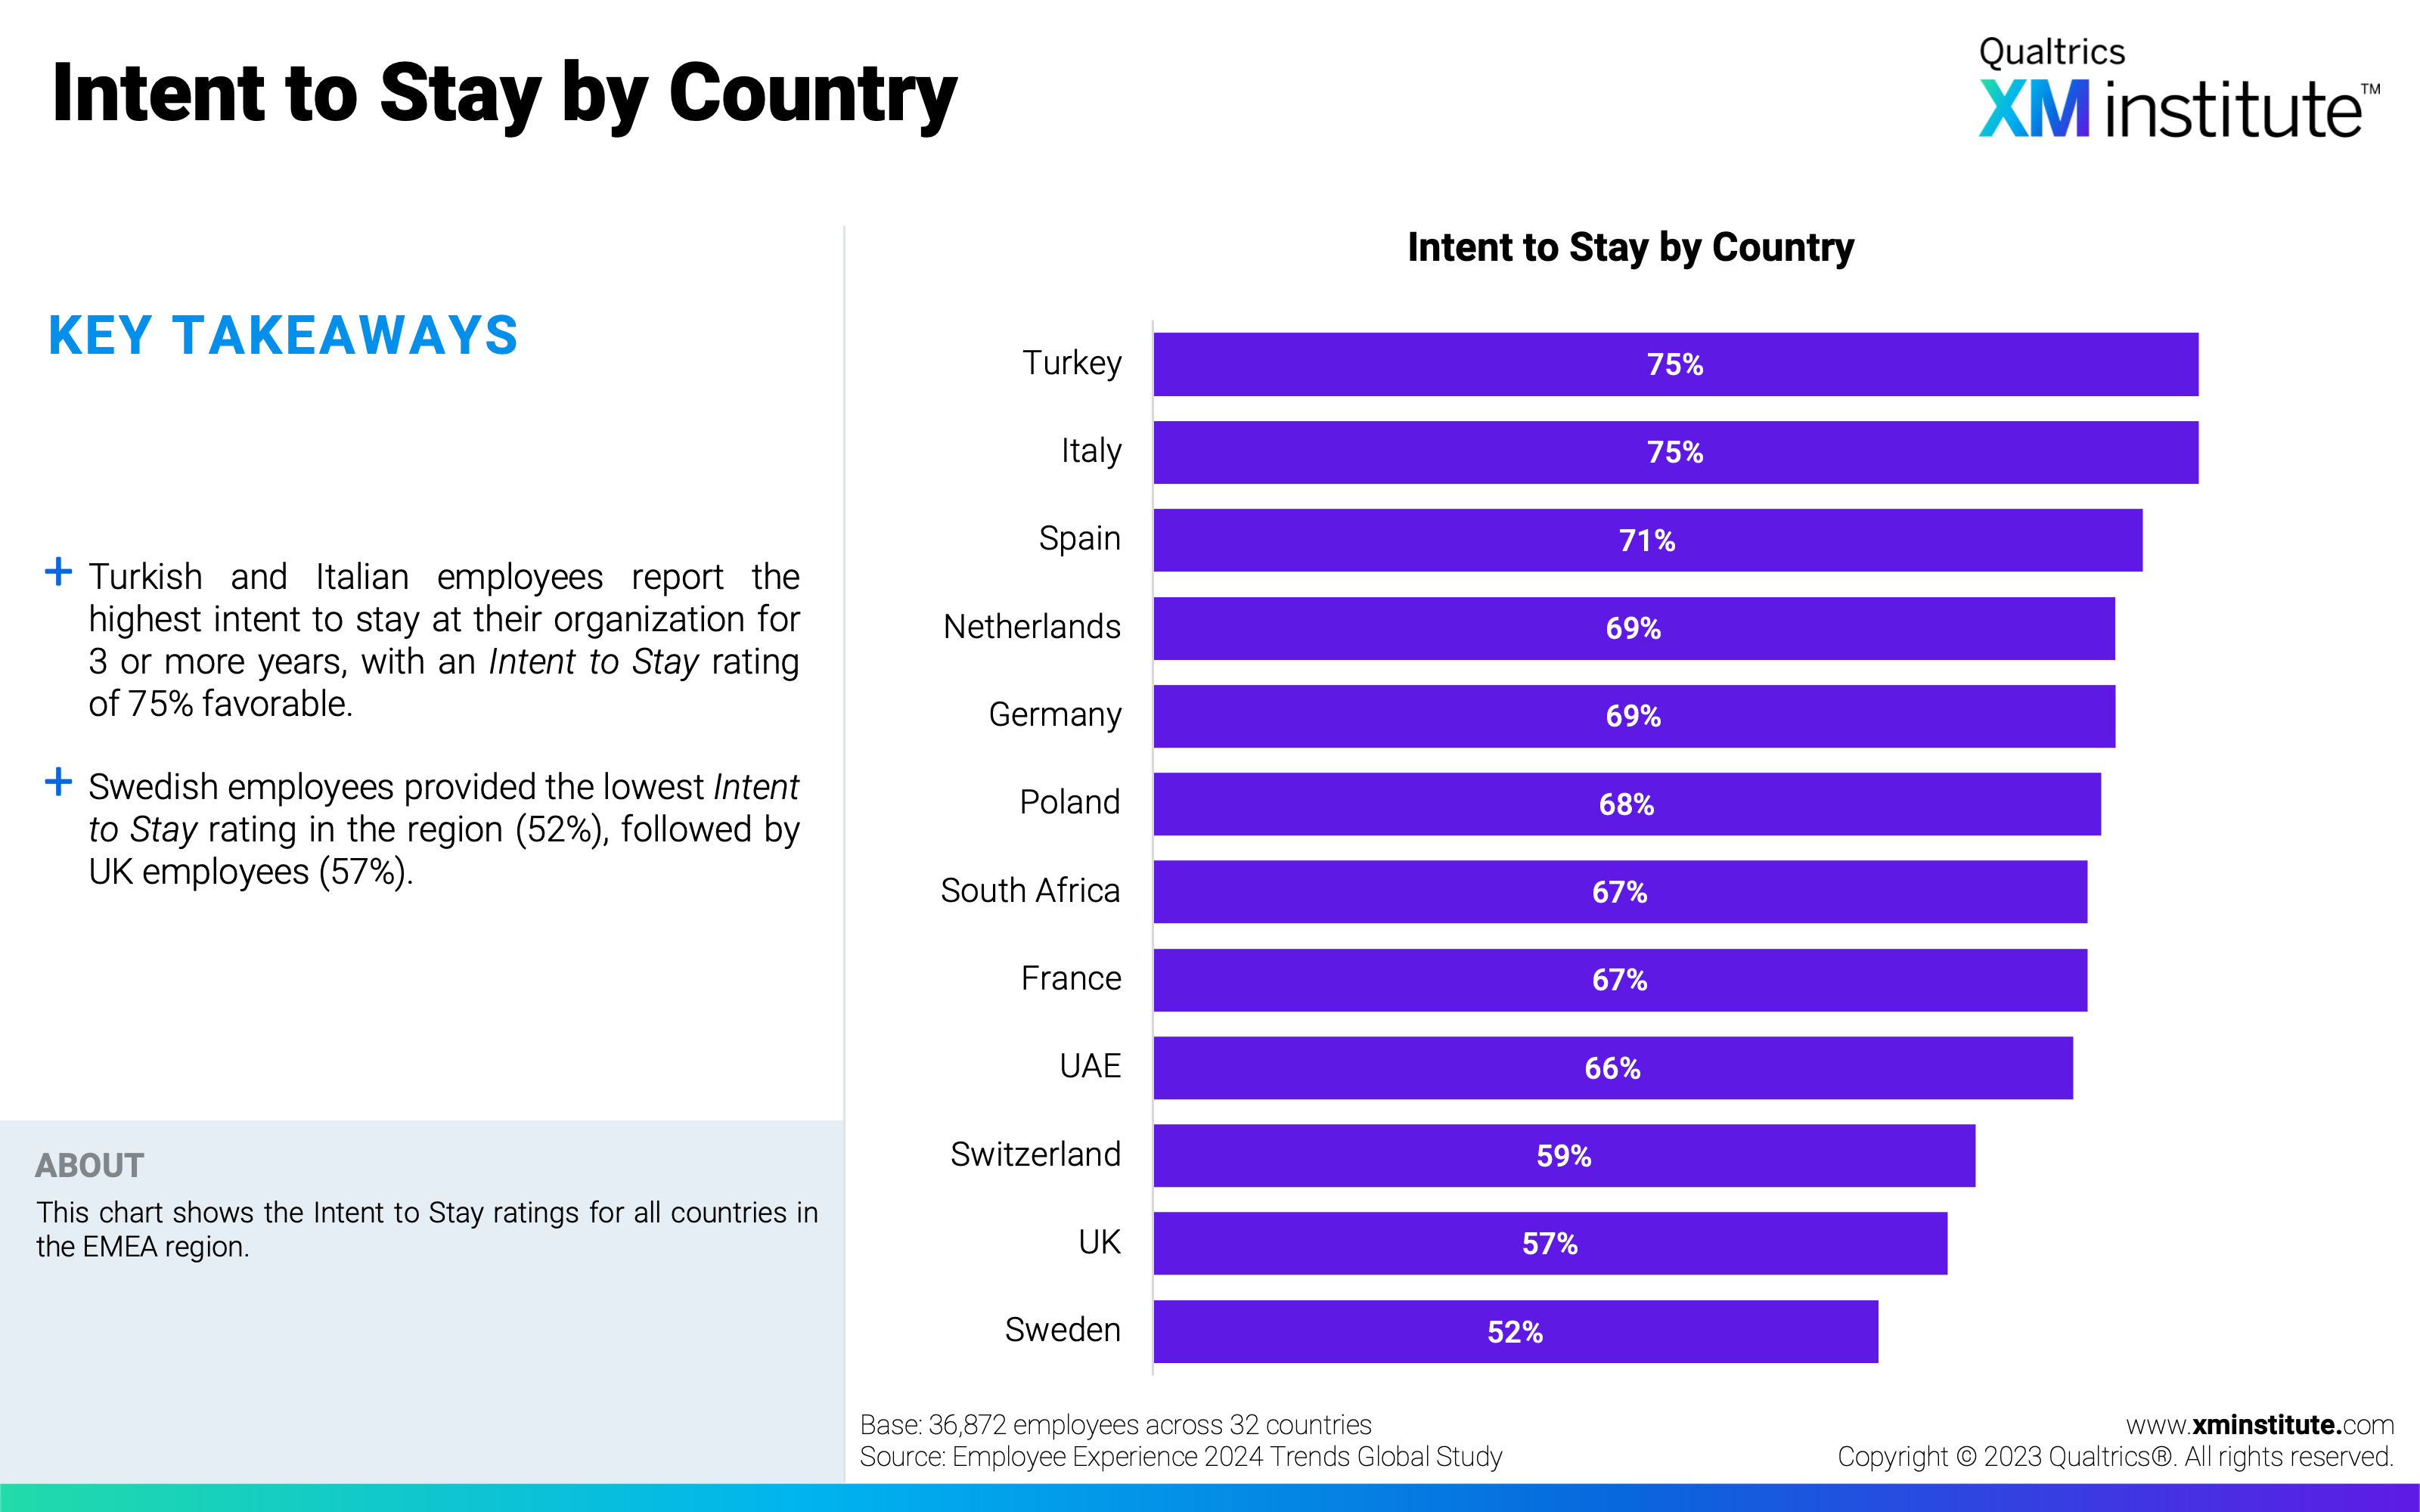
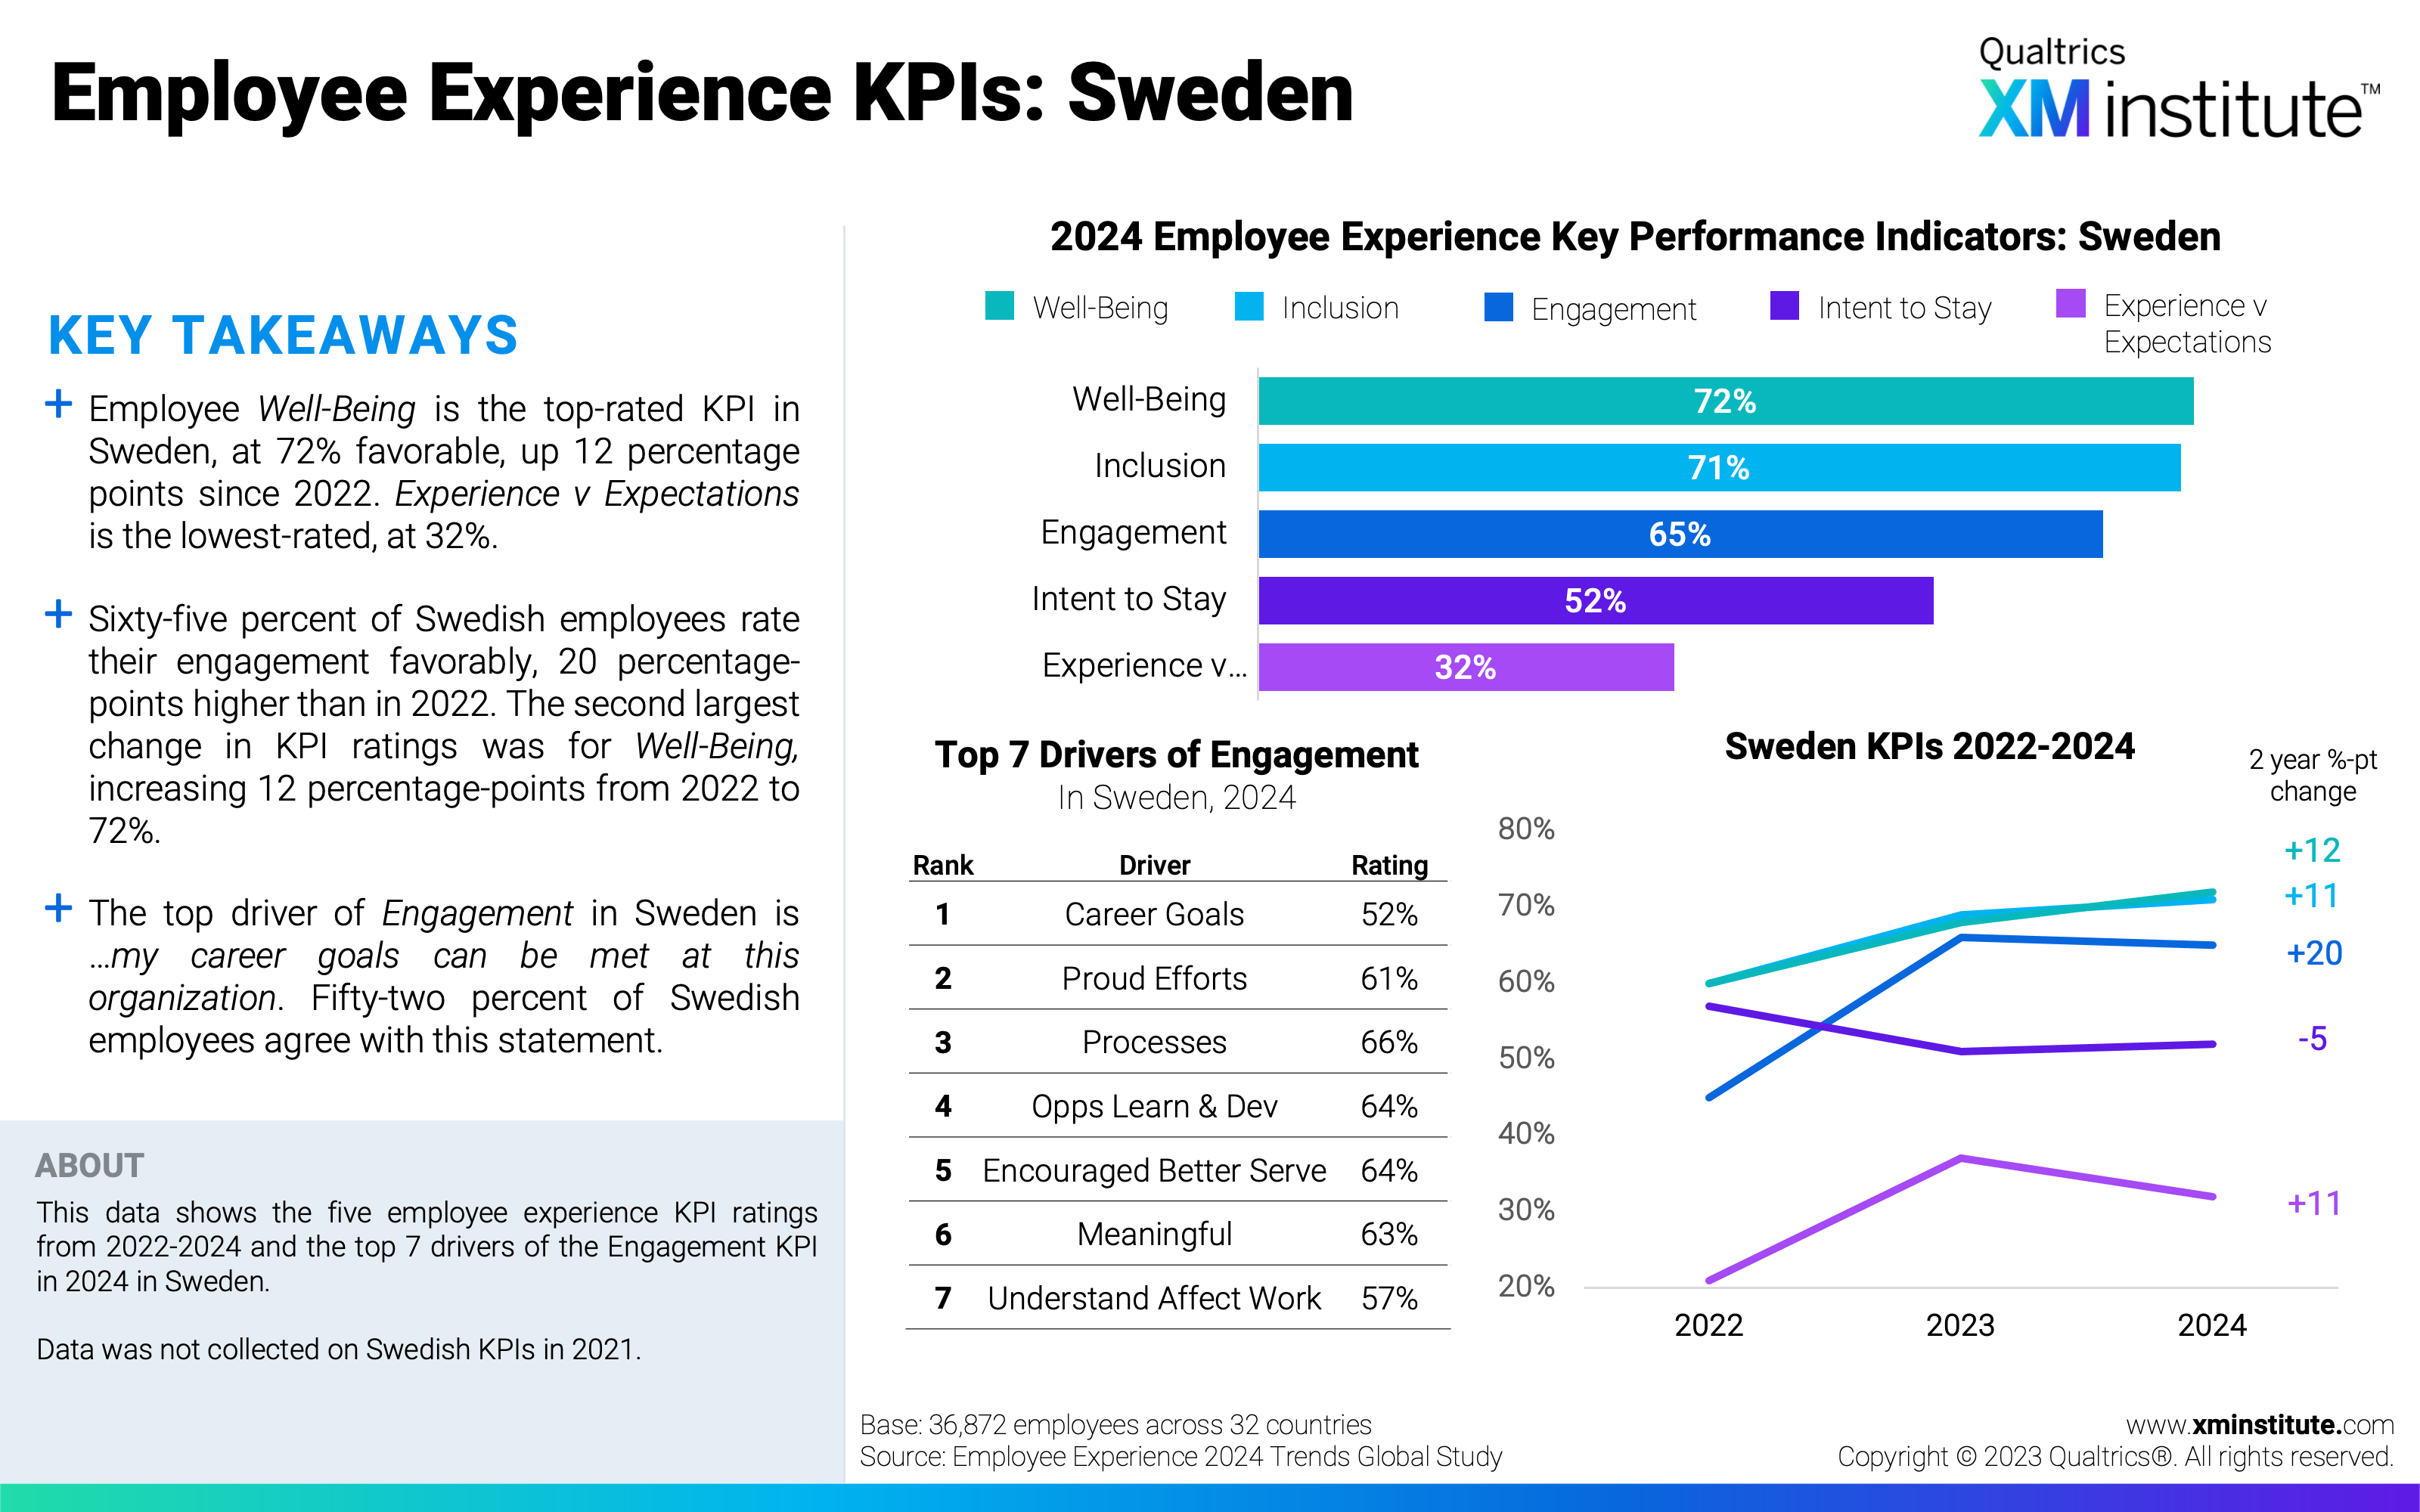
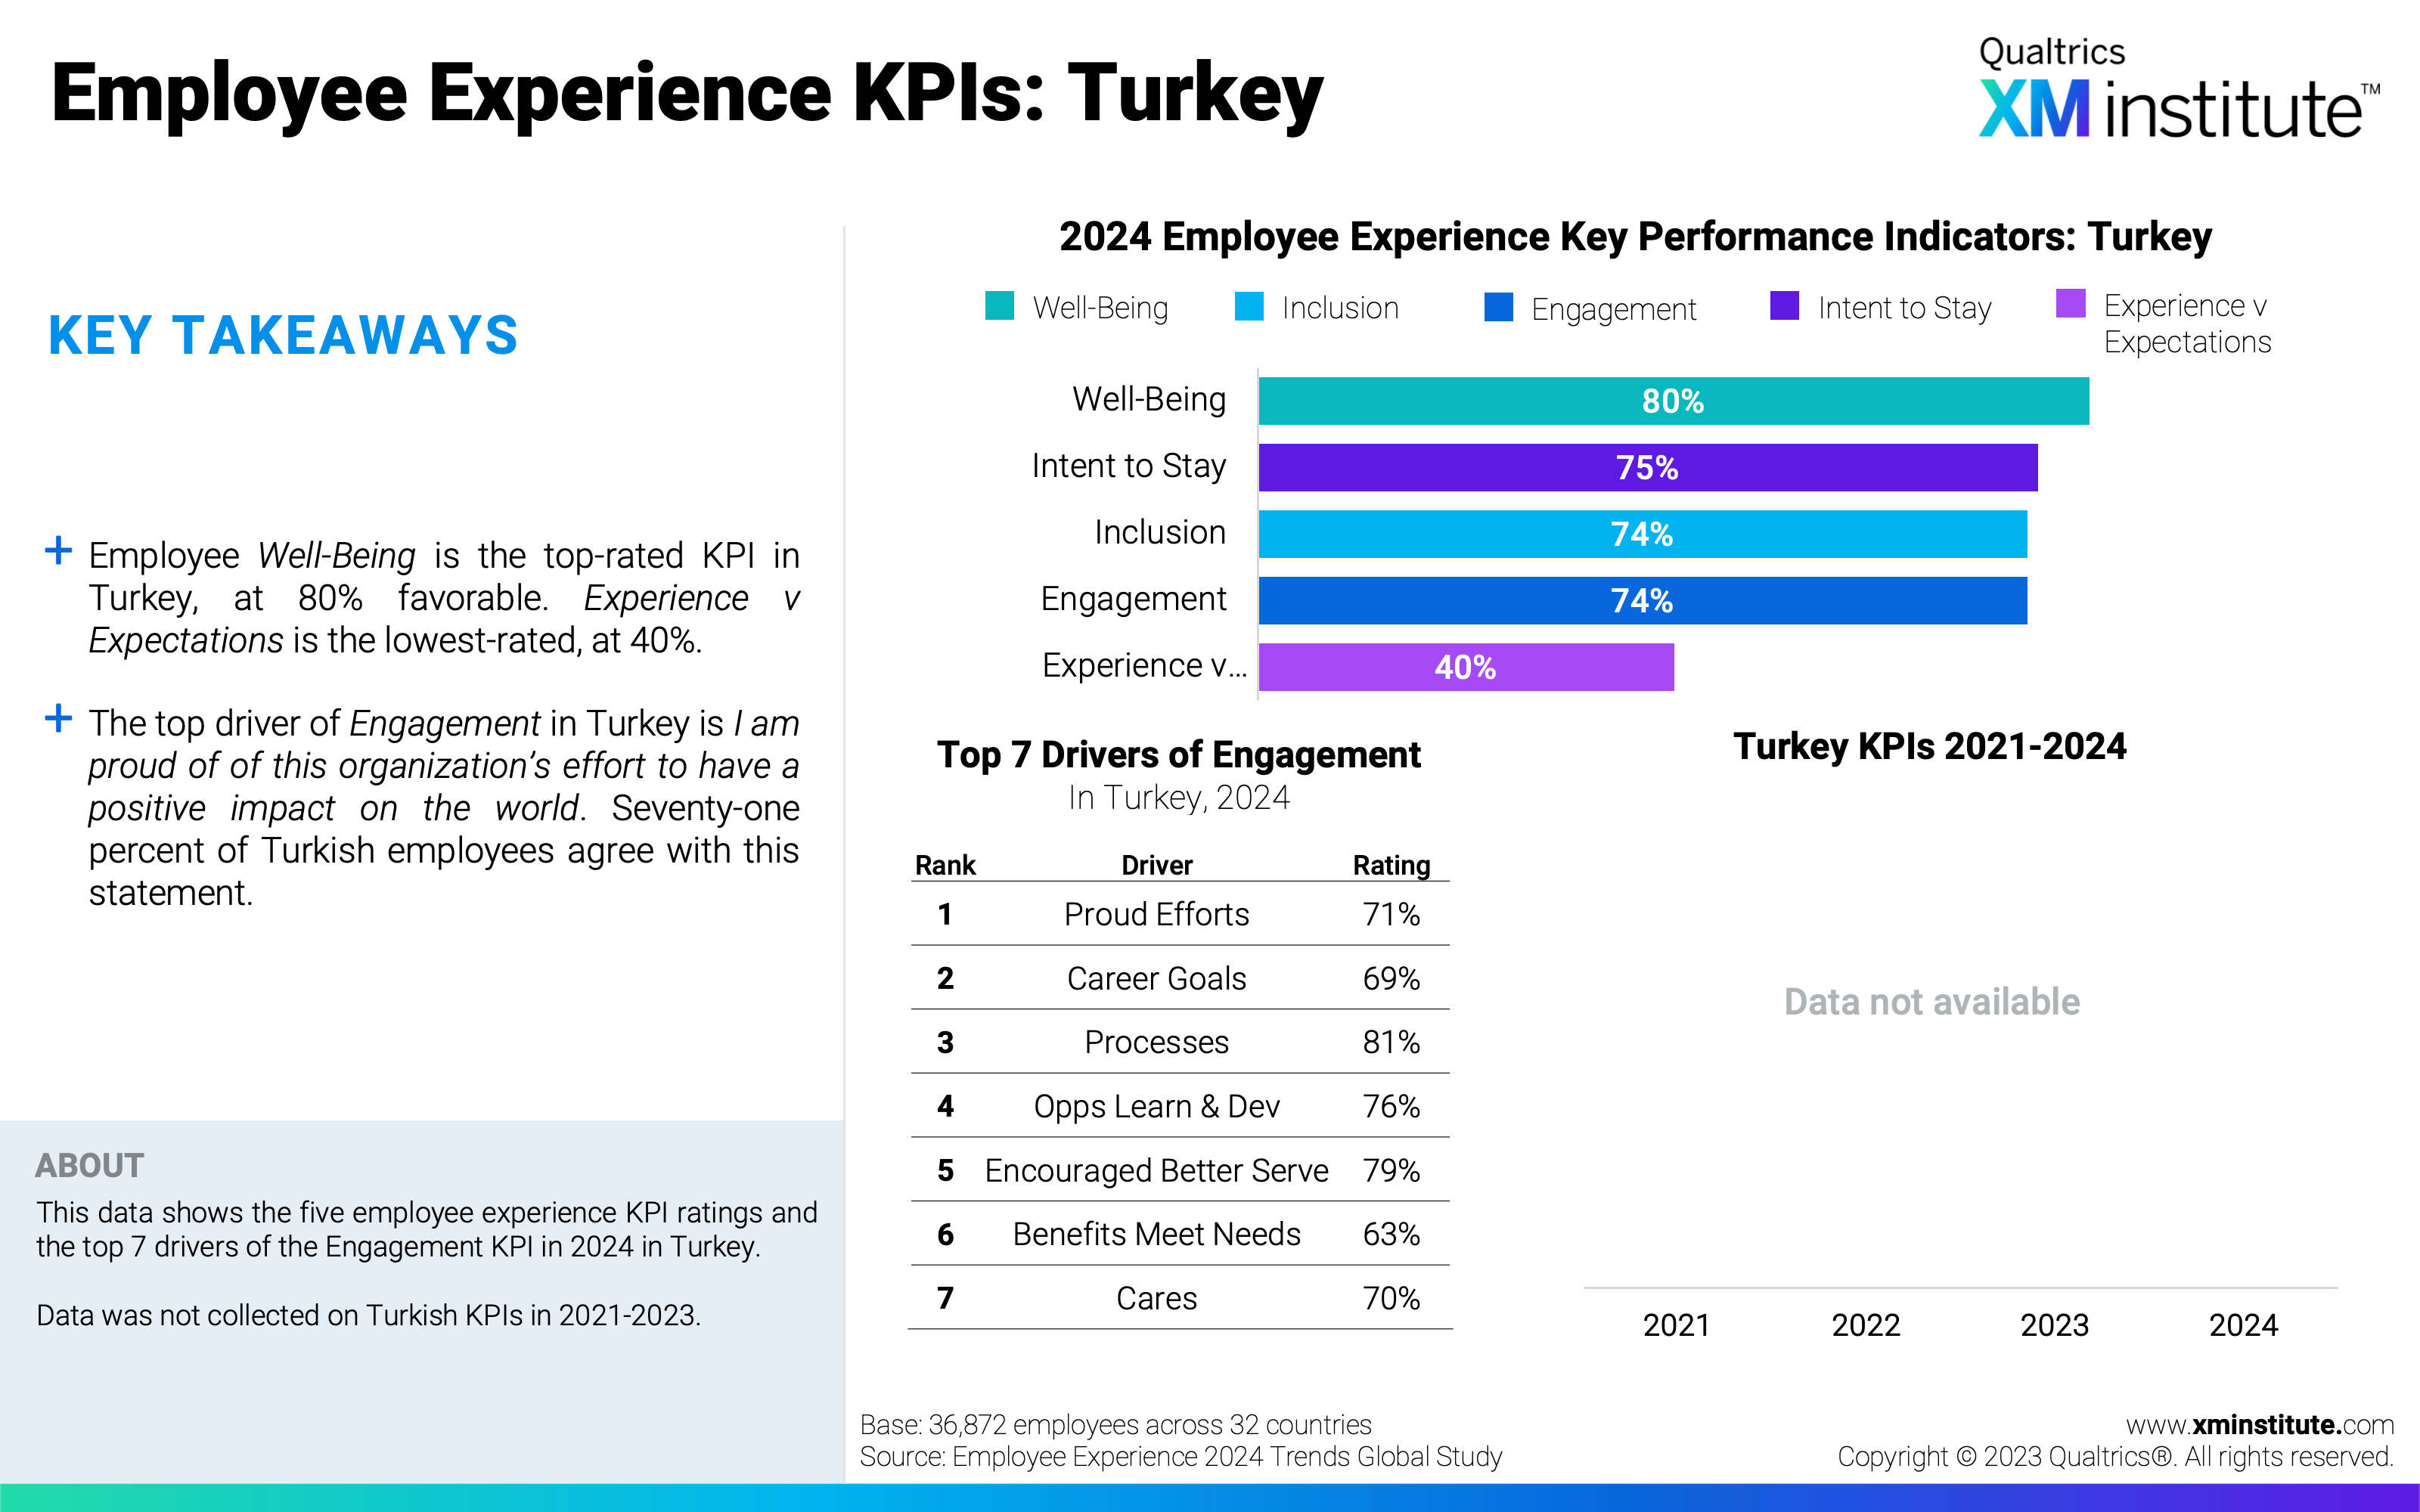
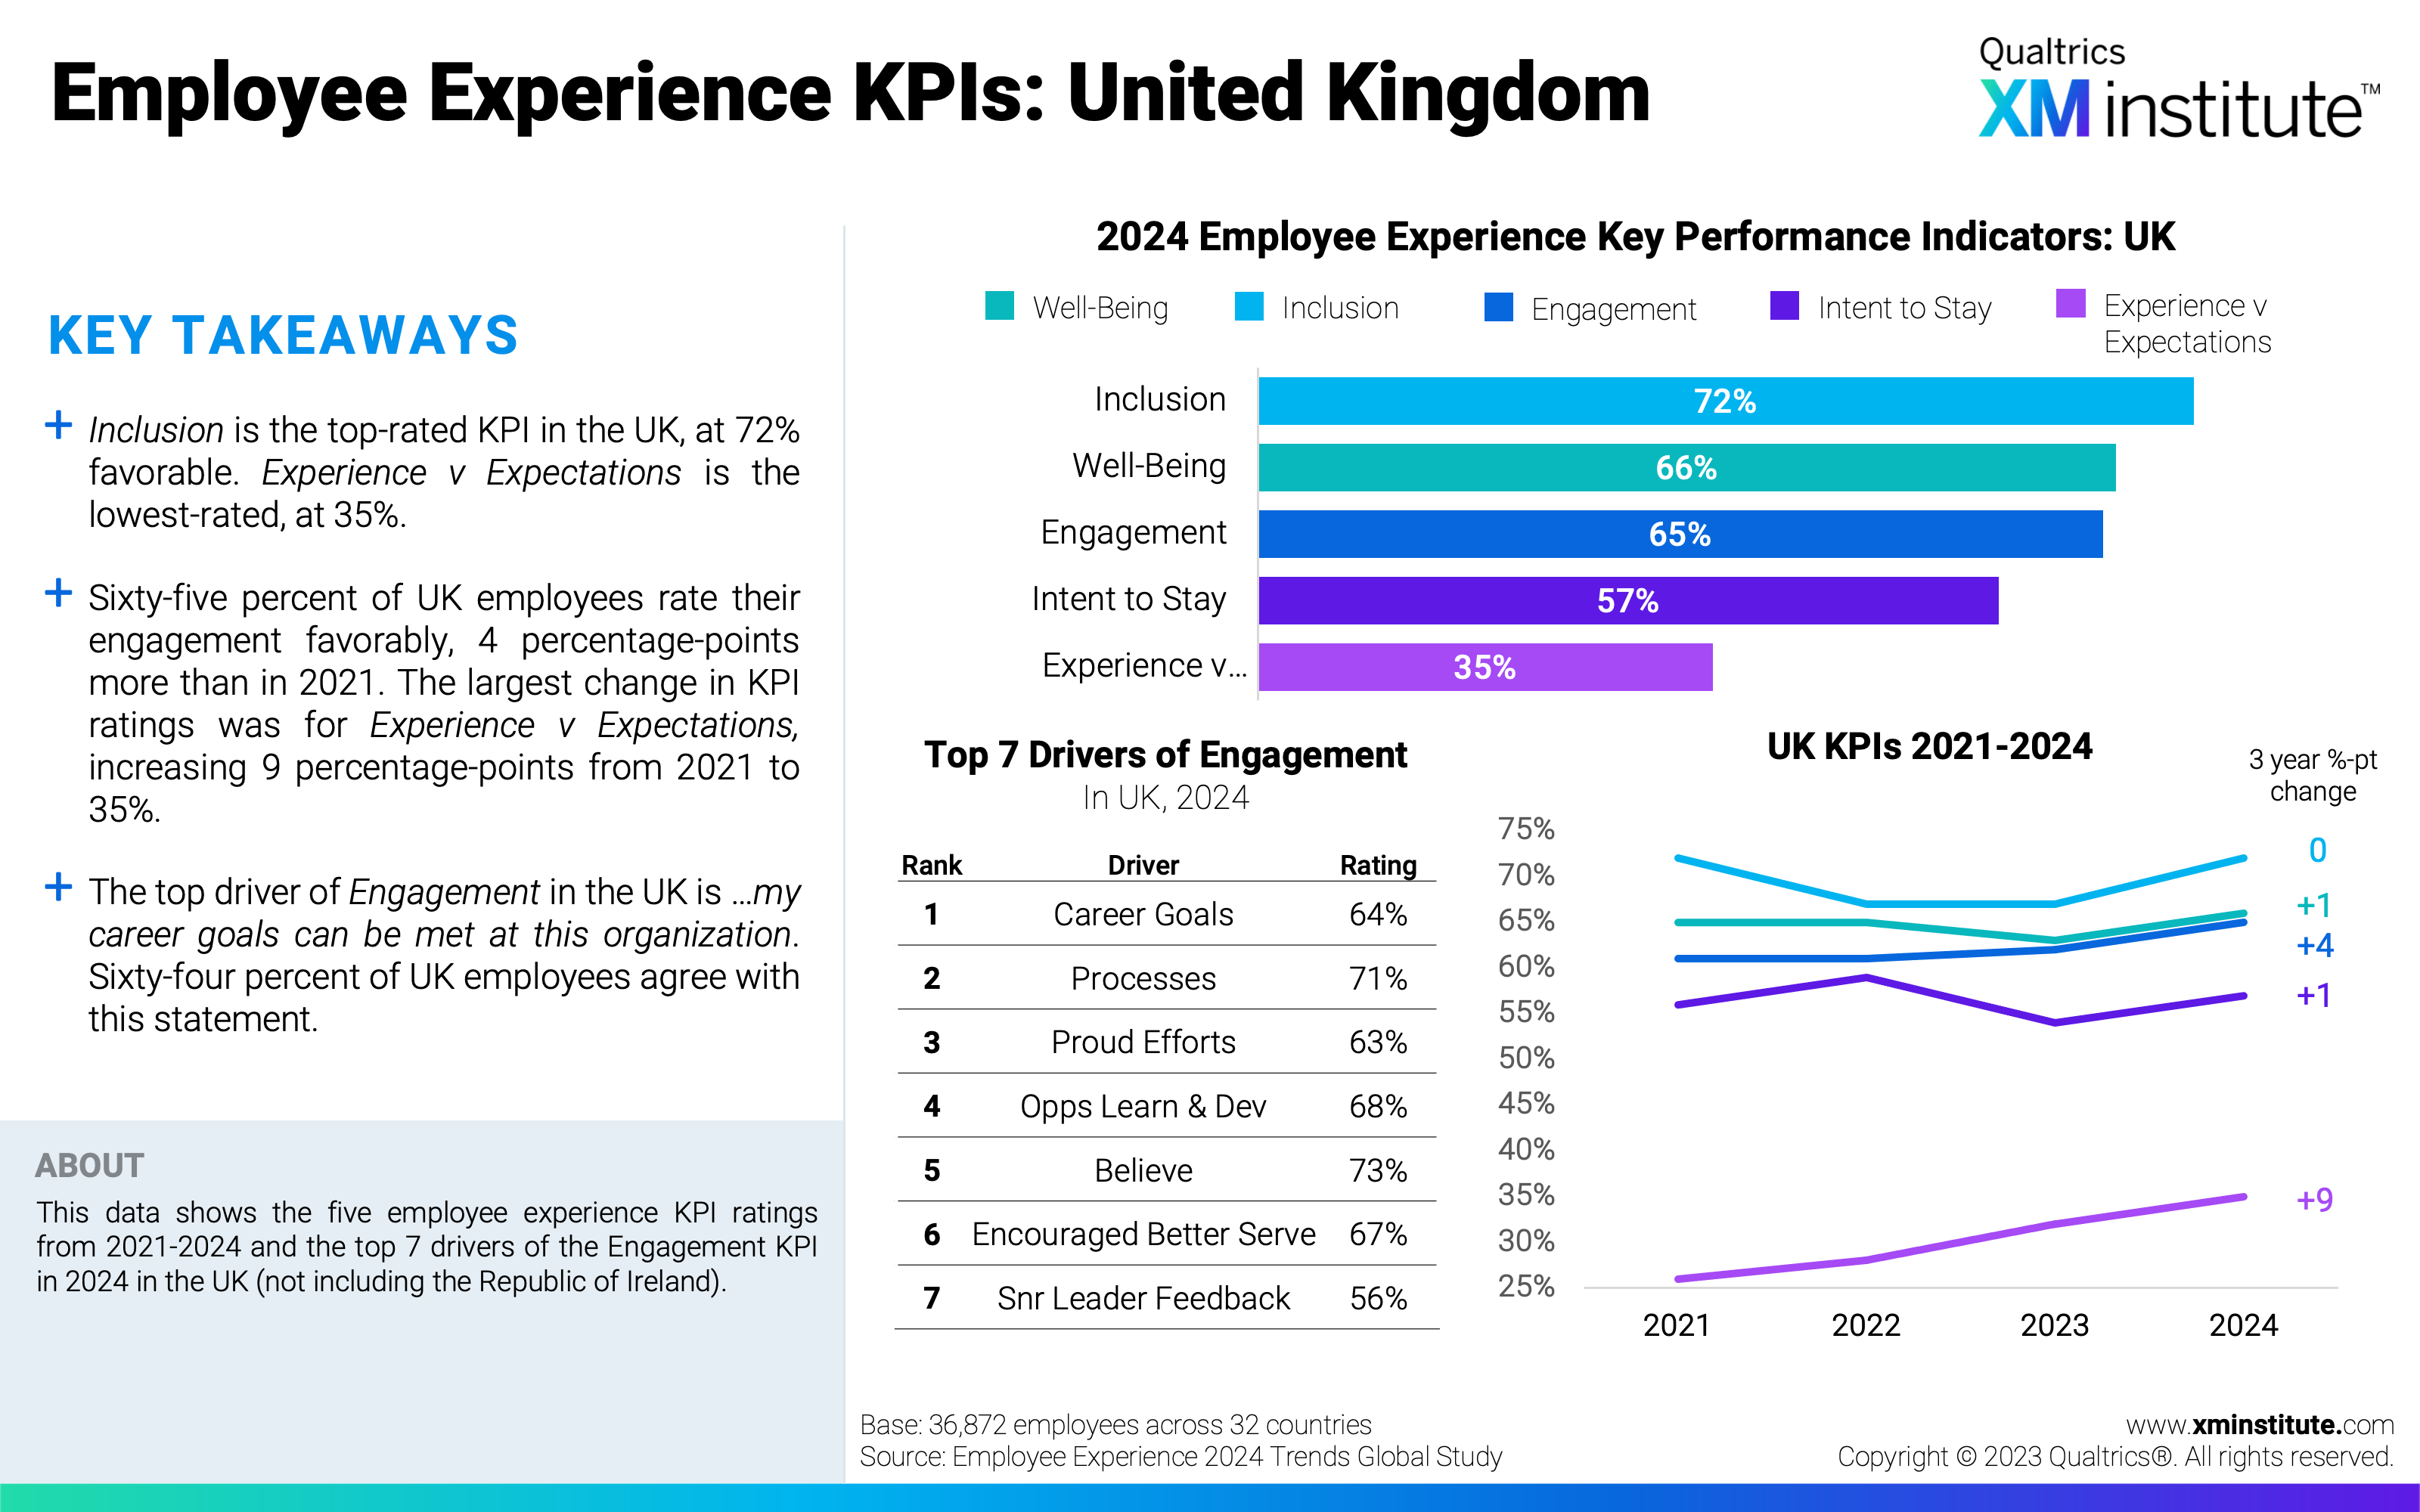
- Italian and Turkish employees have the highest Intent to Stay. The majority of Turkish and Italian employees (75%) expressed an intention to stay working with their employer for 3 years or more. Employers in Sweden and the United Kingdom should expect the most turnover as a little over half of employees in these countries report the lowest Intent to Stay.
- Spanish employees report the greatest change in experience since 2021. Since 2021, Spain’s KPI metrics have changed nearly 8 percentage-points on average. Italian employees ratings have deviated the least from 2021, shifting by about 2 percentage-points.
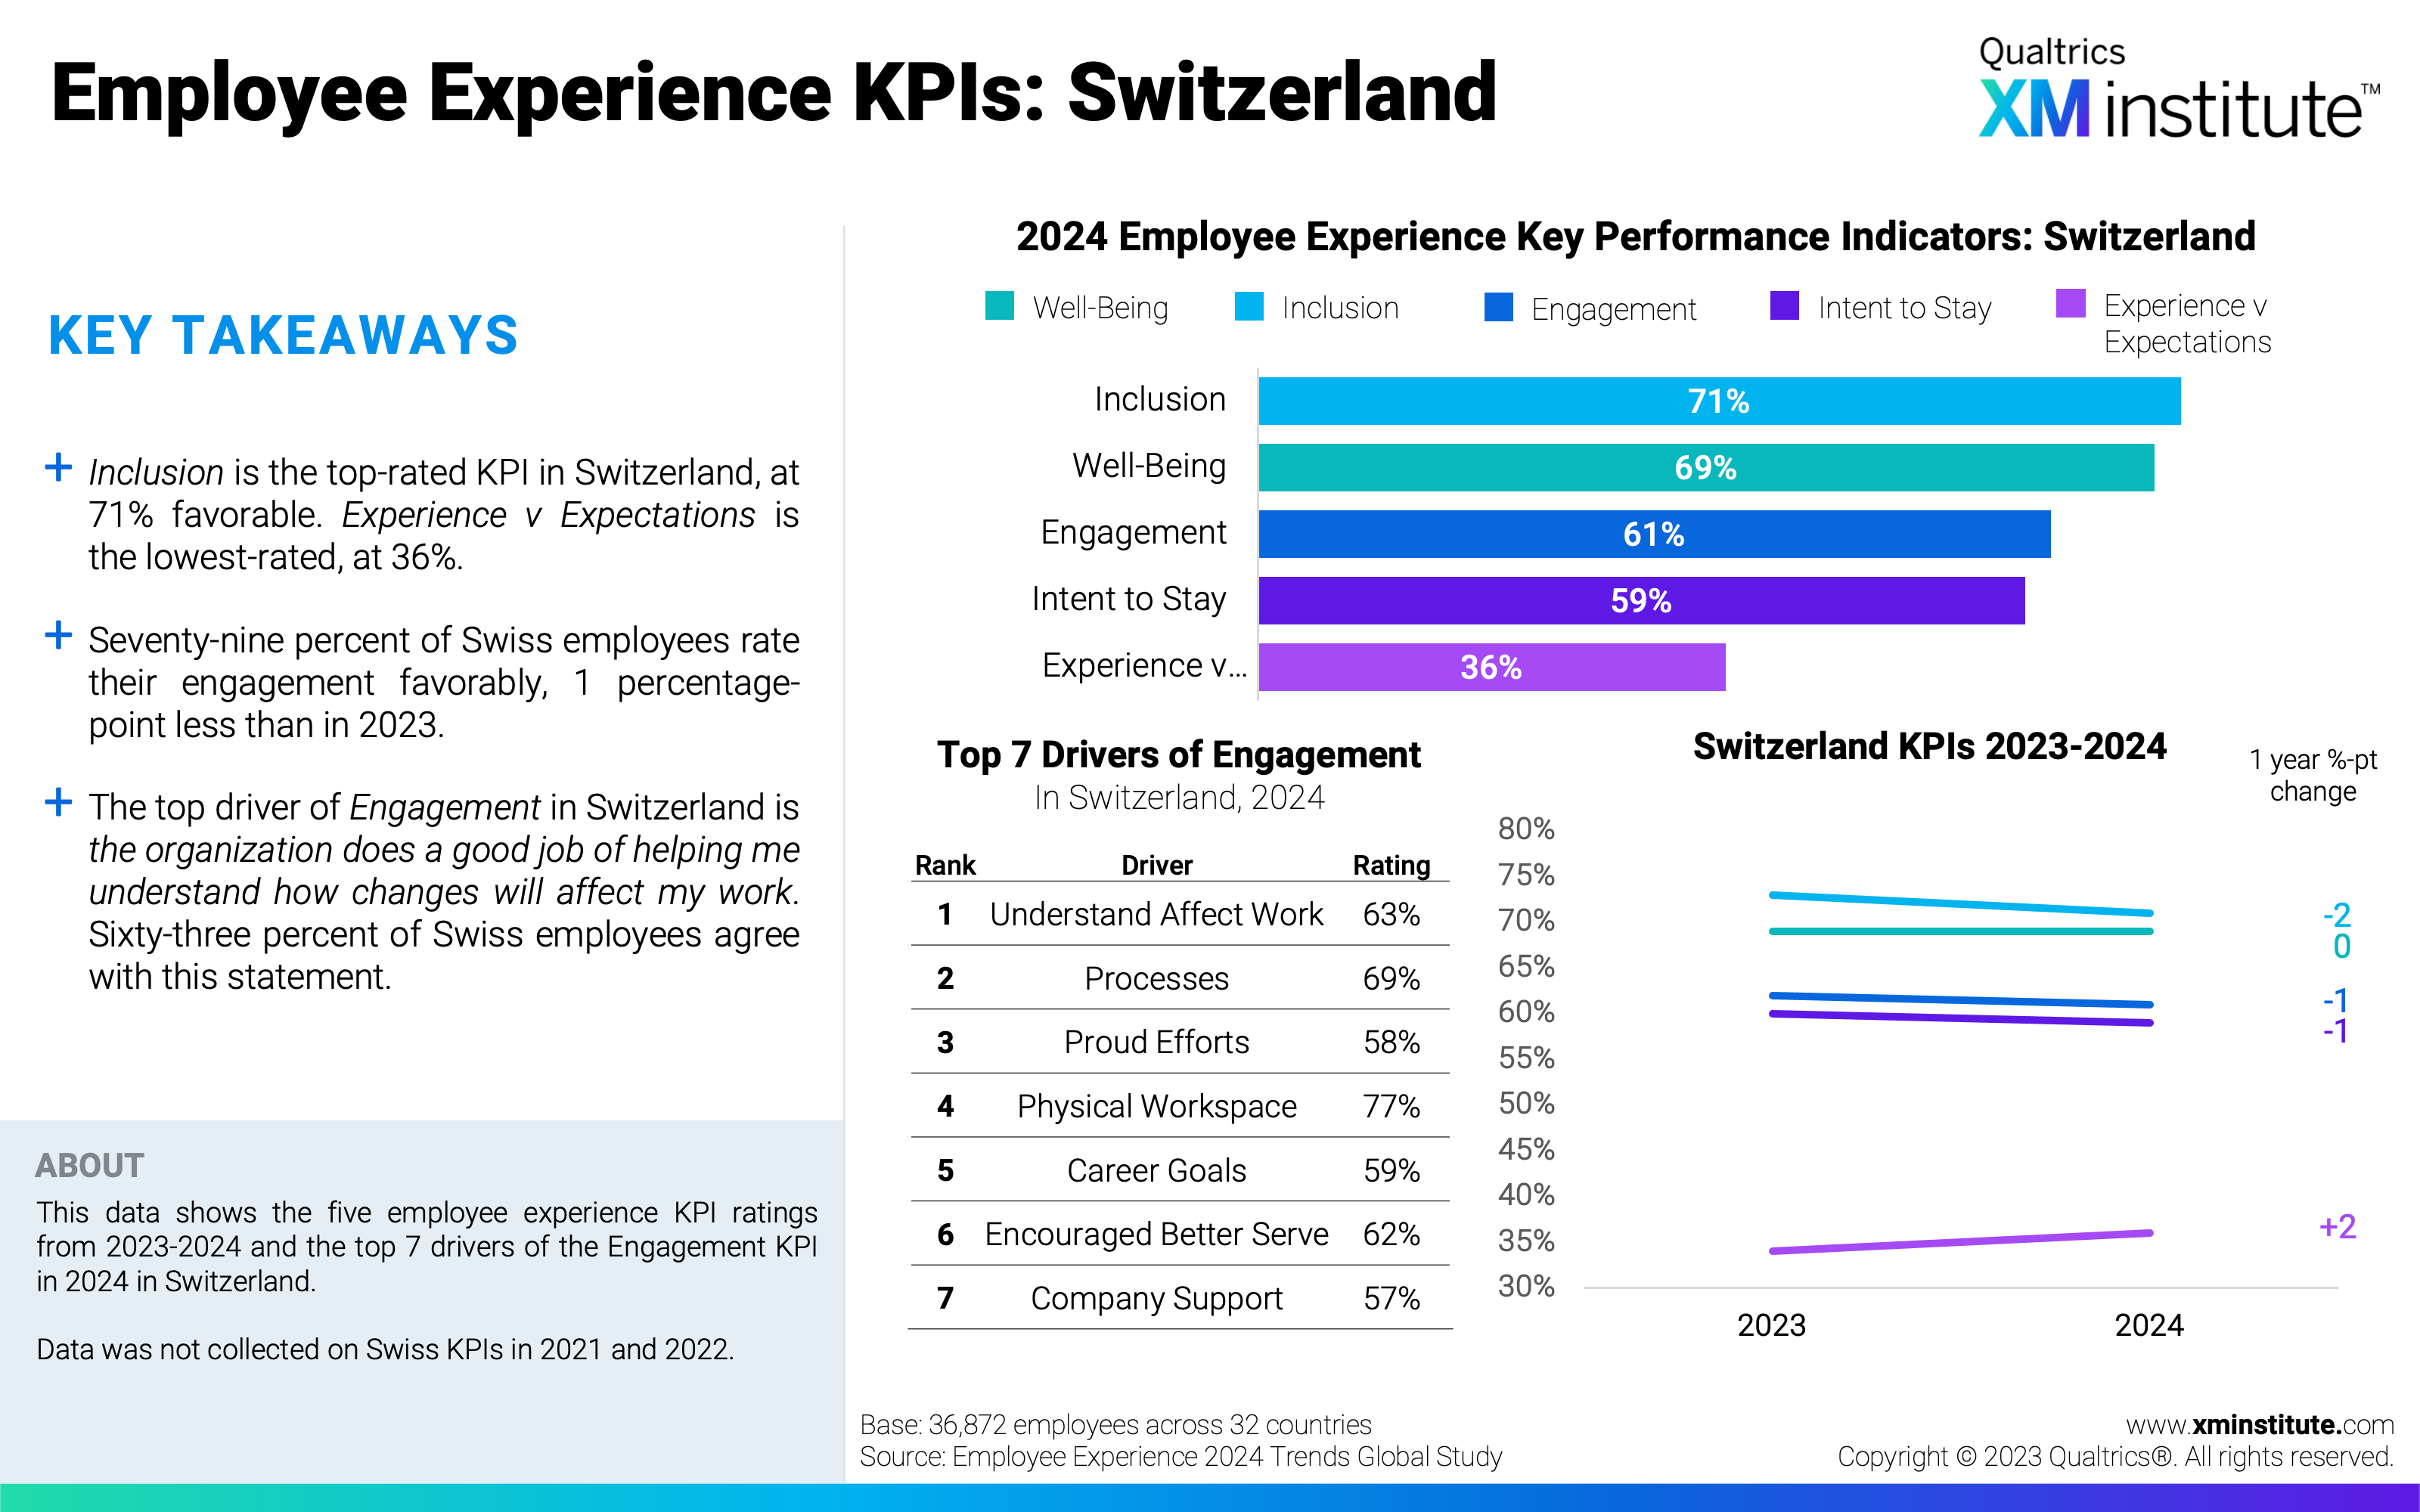
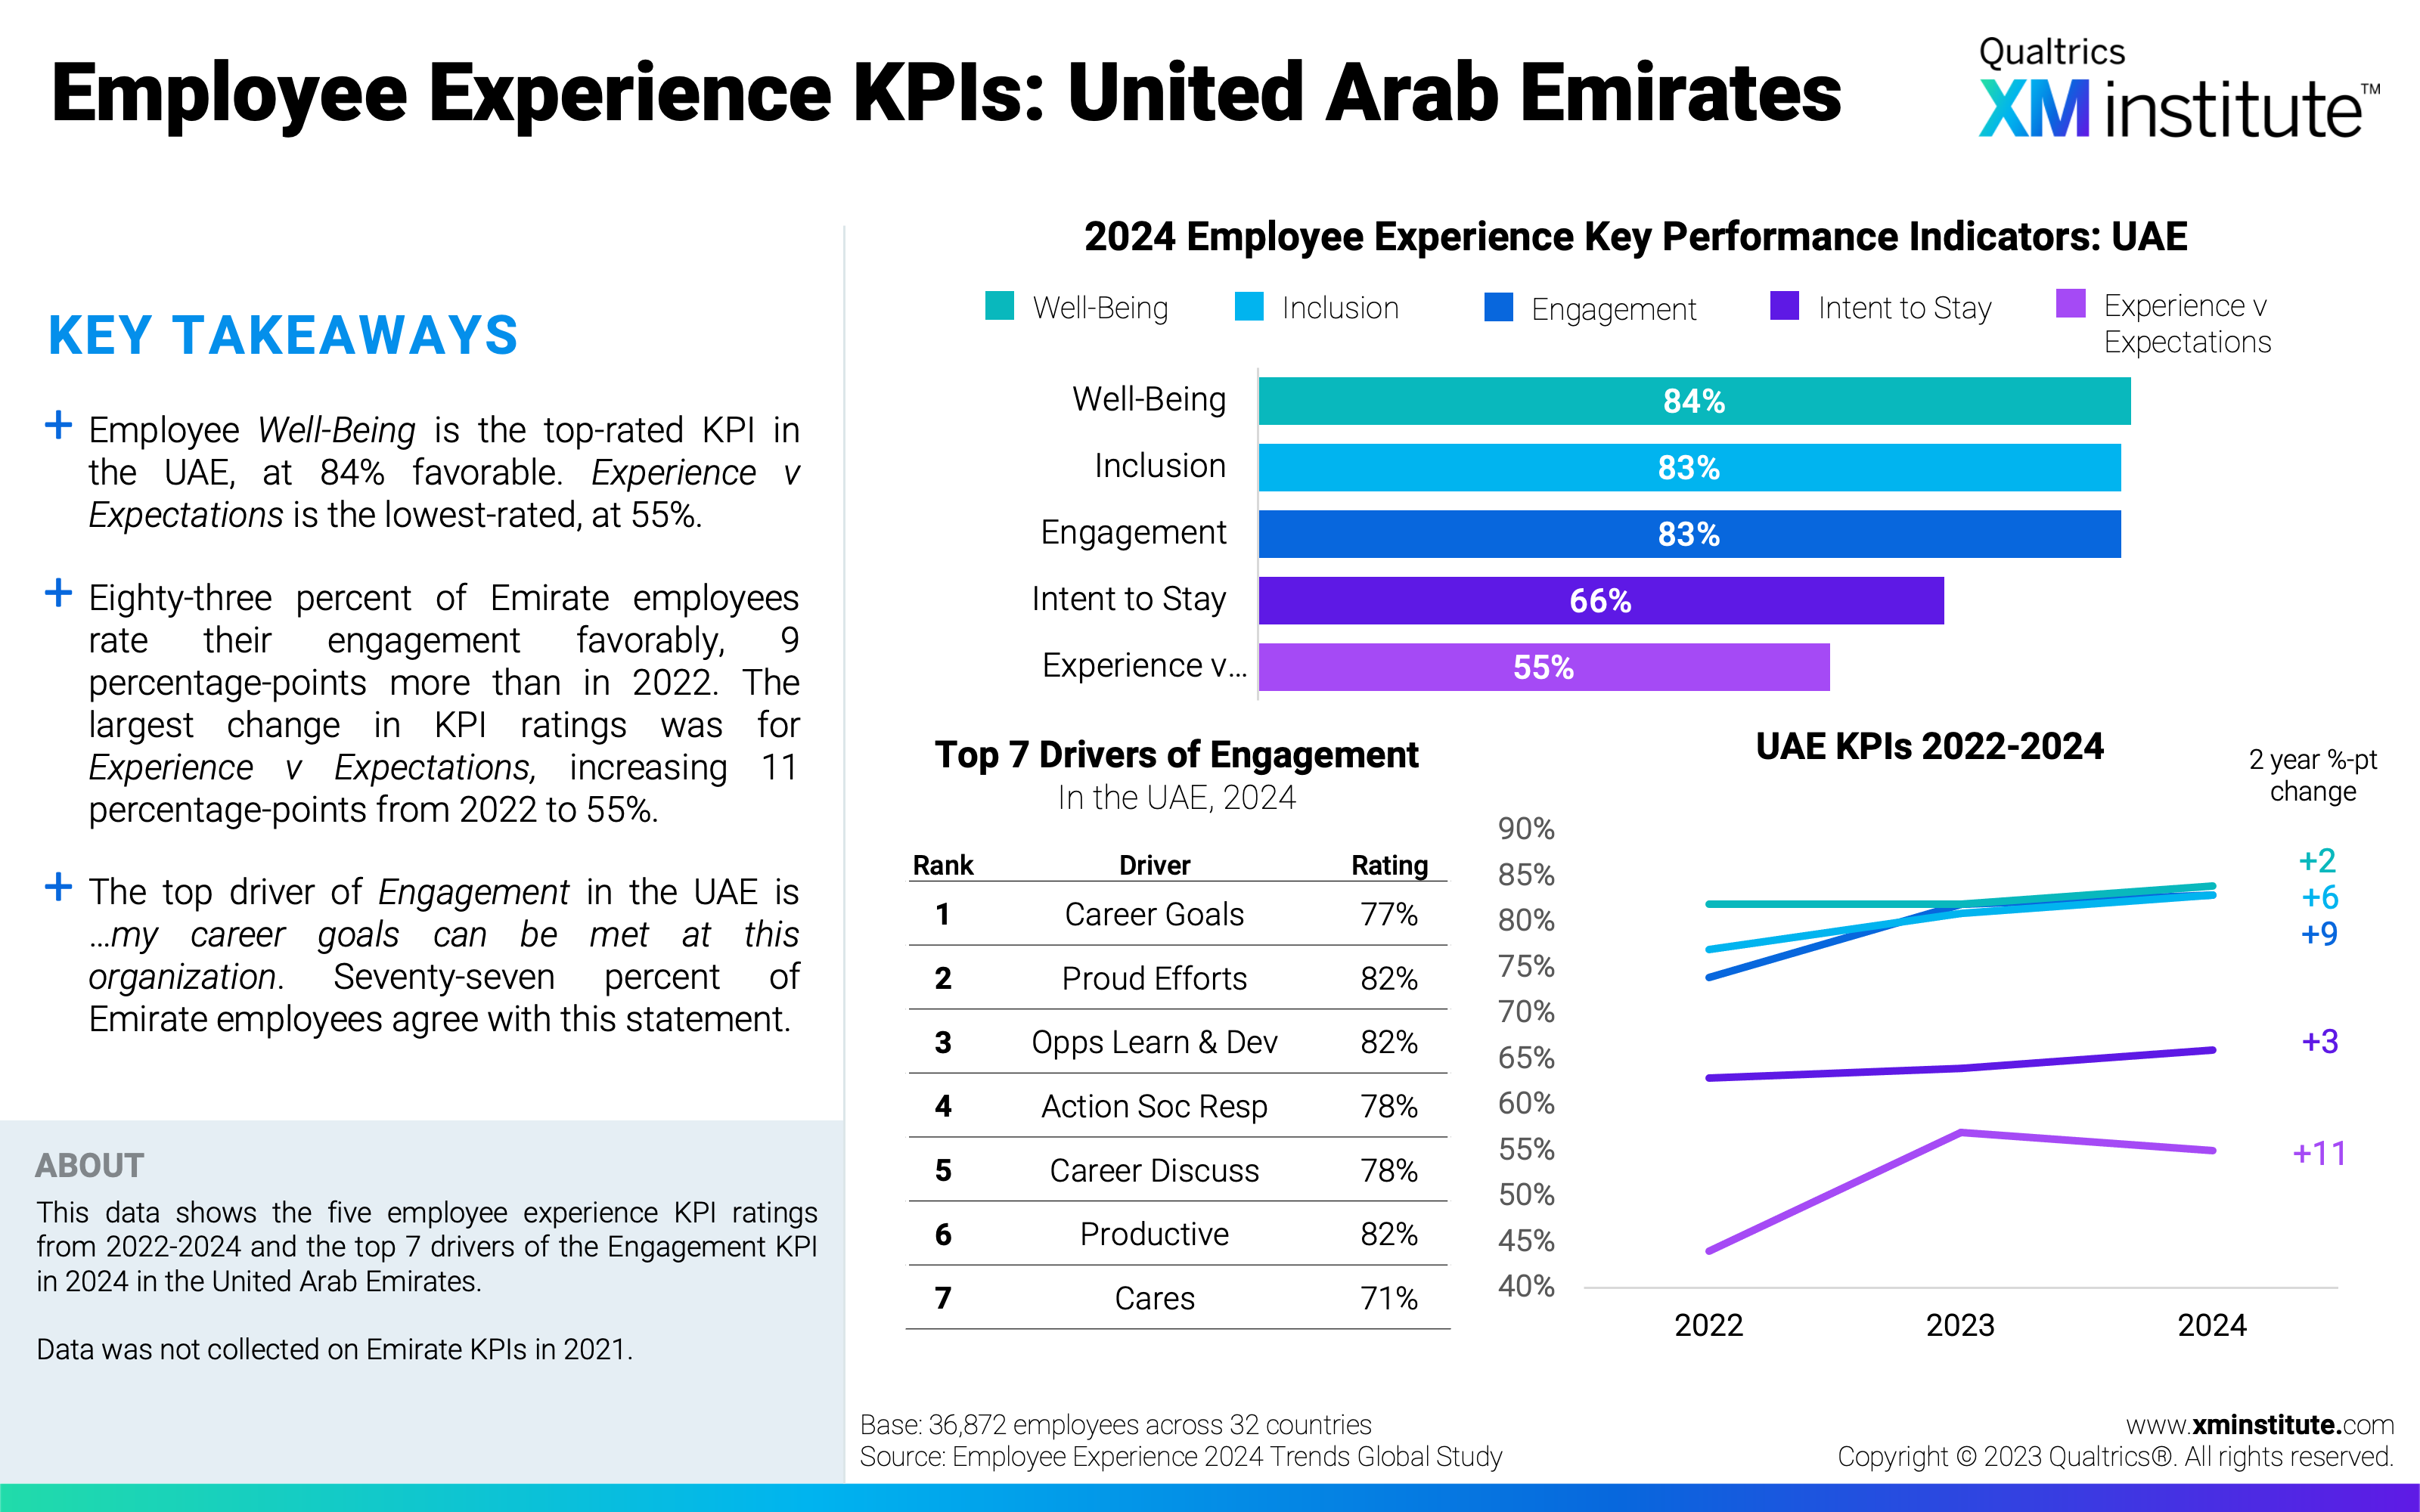
- Professional development is a top driver of employee engagement. Seven of the 12 EMEA countries in this study selected I feel that my career goals can be met at this organization as the top driver of employee engagement, and another four have it in their top five drivers. I have good opportunities to learn and develop at this organization is also in their top drivers of Engagement in nine of 12 countries.
- EMEA employees changed their Experience v Expectations ratings the most since 2021. Of the five KPIs, Experience v Expectations saw the biggest change in ratings since 2021, shifting by 9 percentage-points on average in the EMEA countries included in both studies. Inclusion ratings deviated the least over the same period in this region, with an average change of just 2.1 percentage-points.
Figures
Here are the figures in this Data Snapshot:
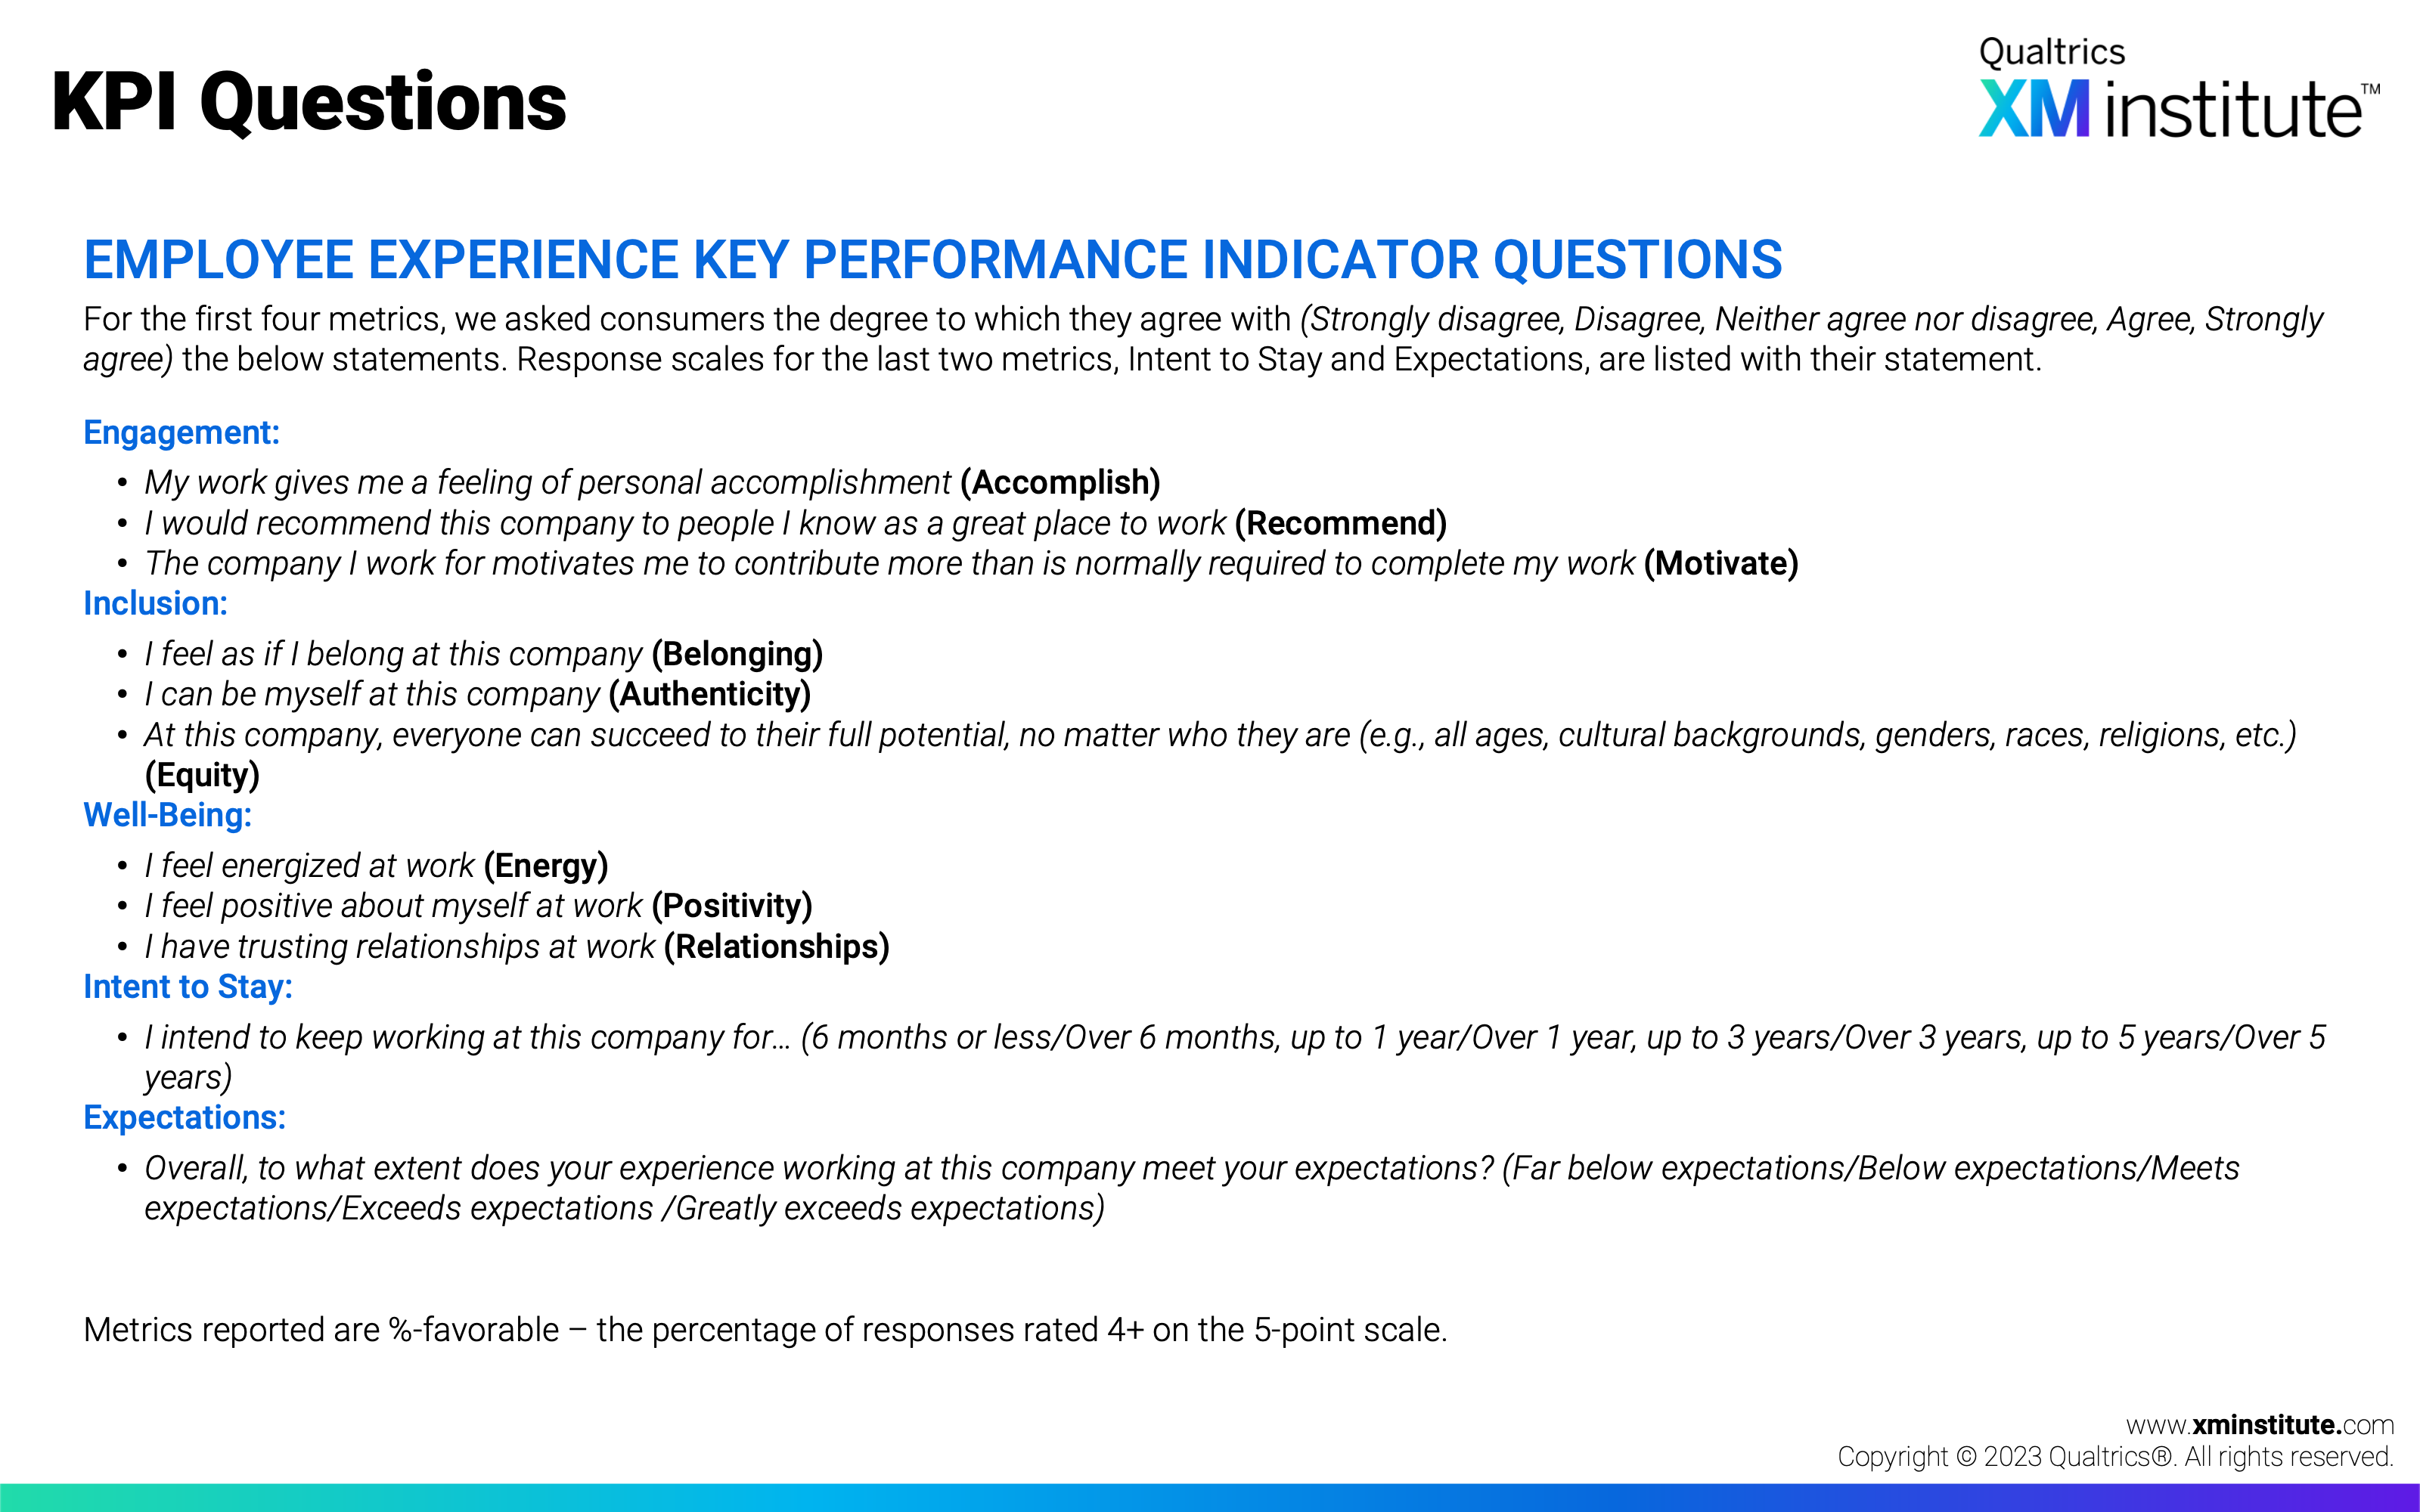
- KPI Questions (see Figure 1)
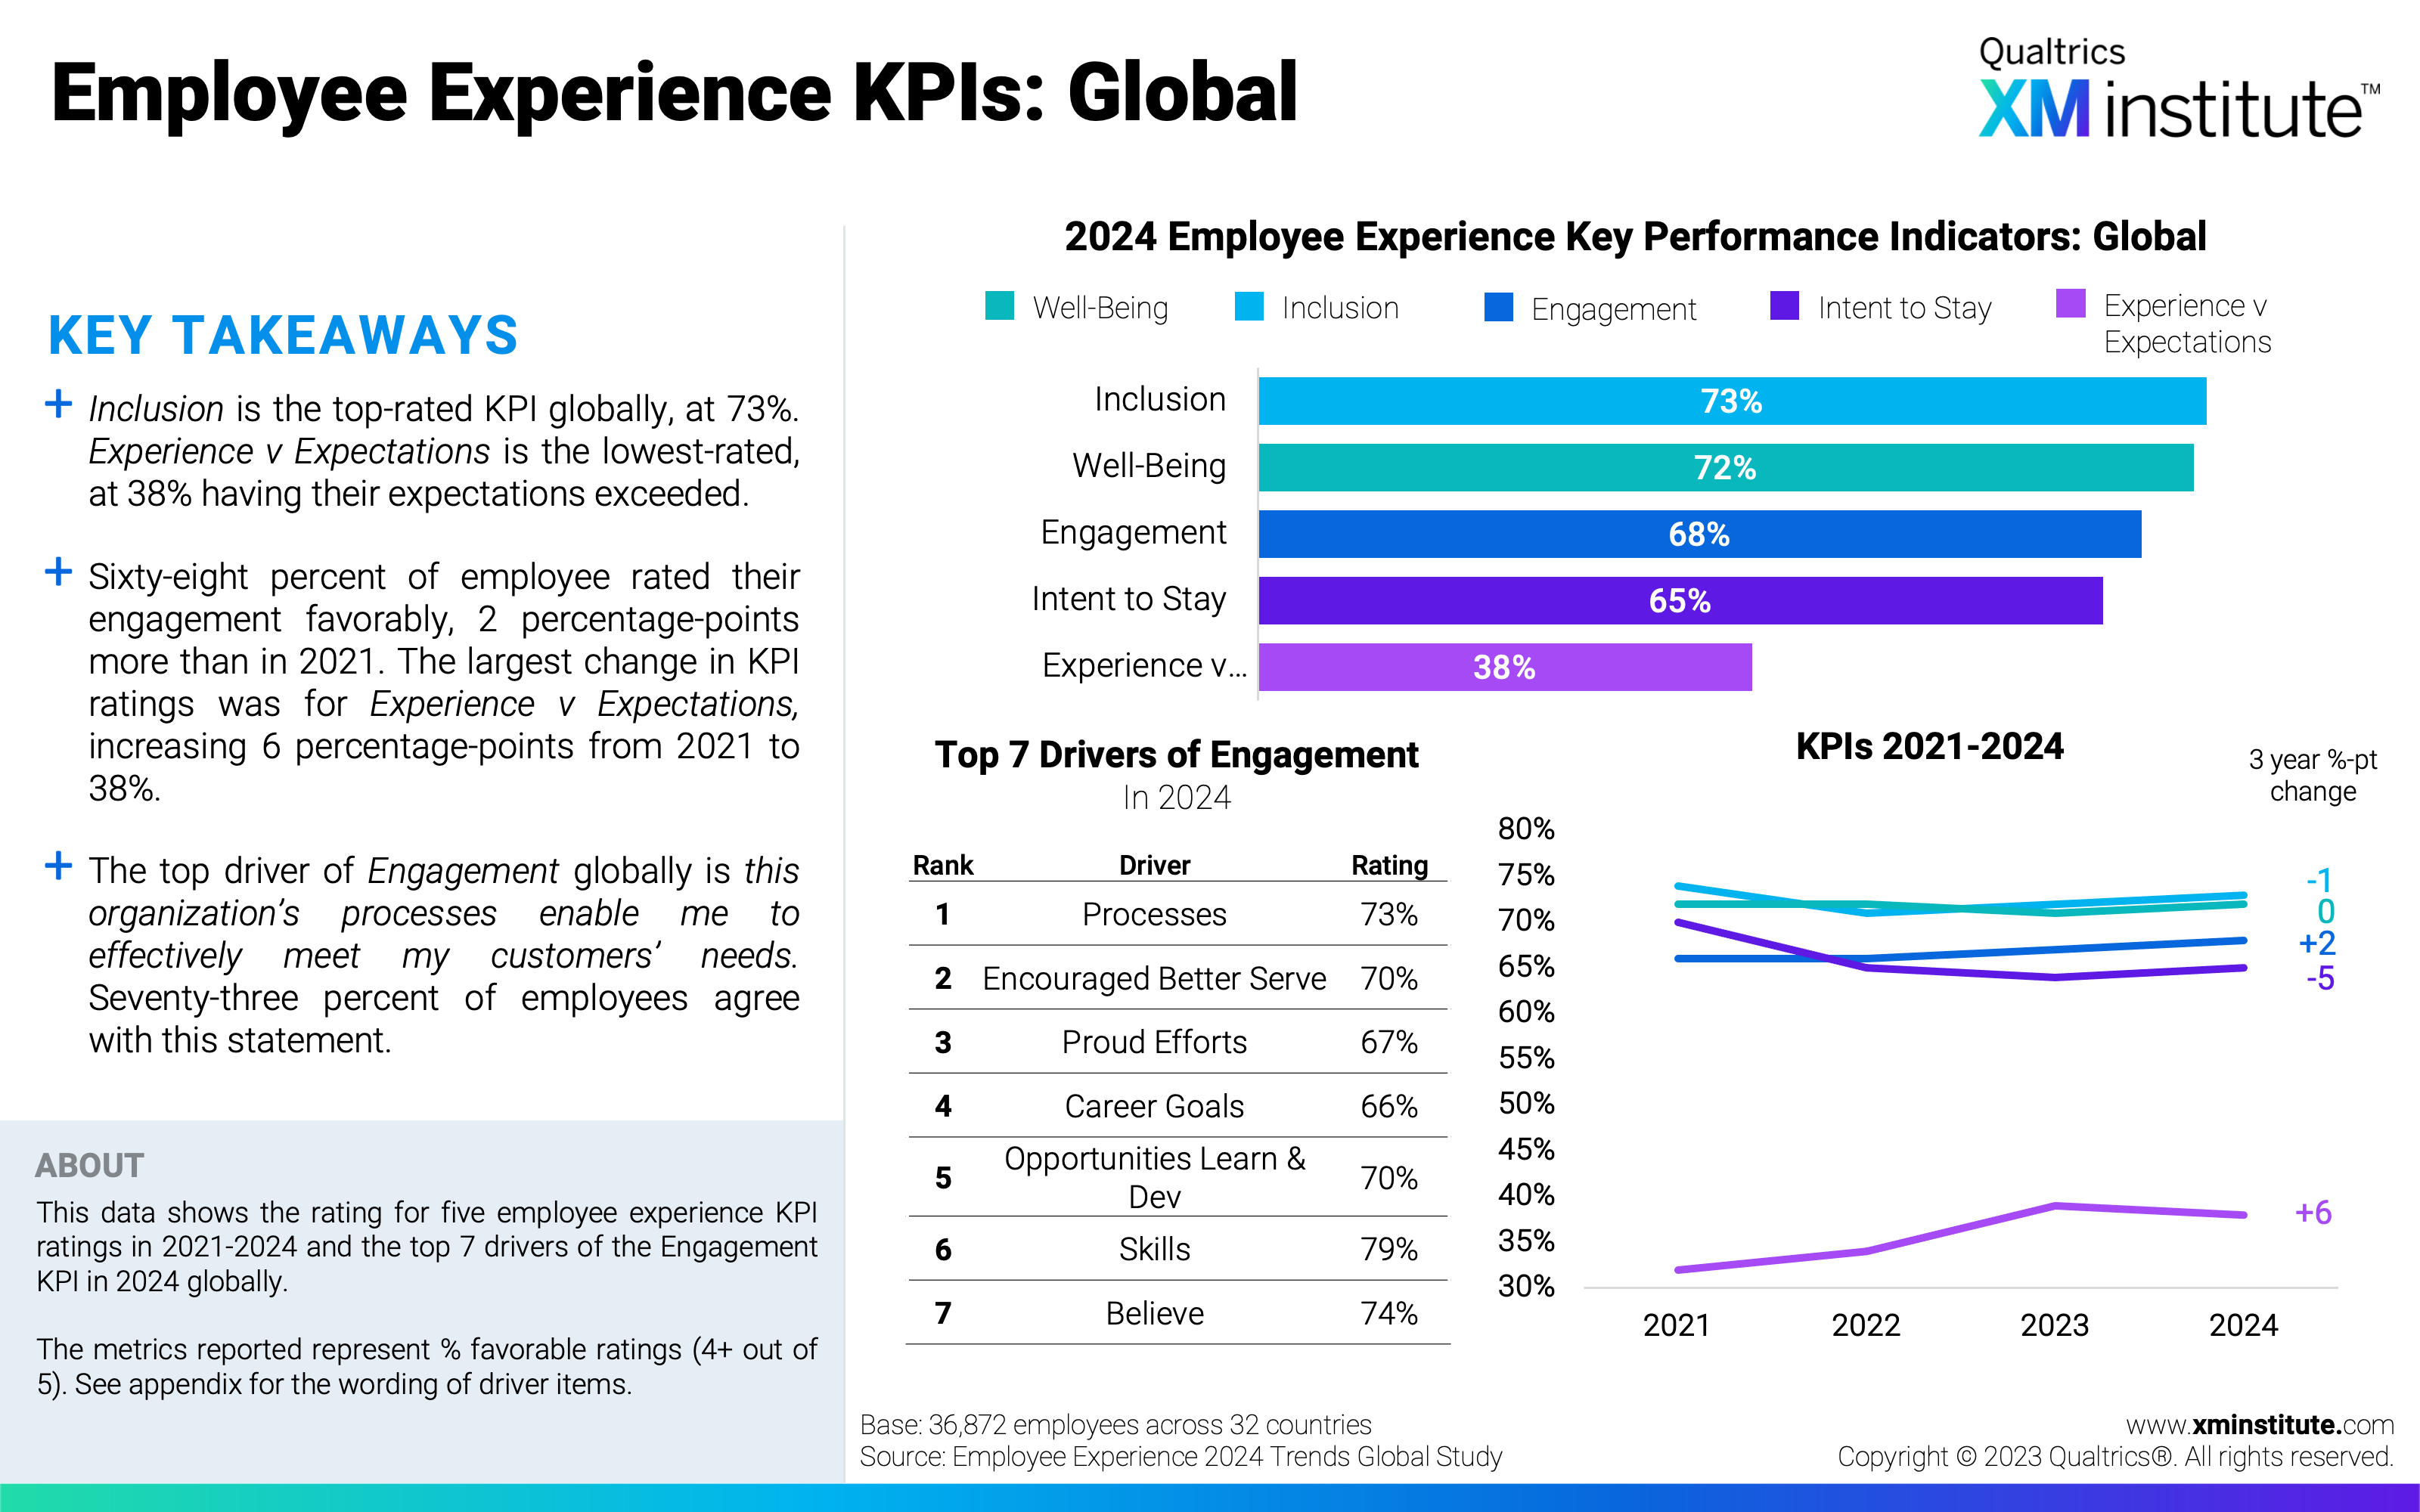
- Employee Experience KPIs: Global (see Figure 2)
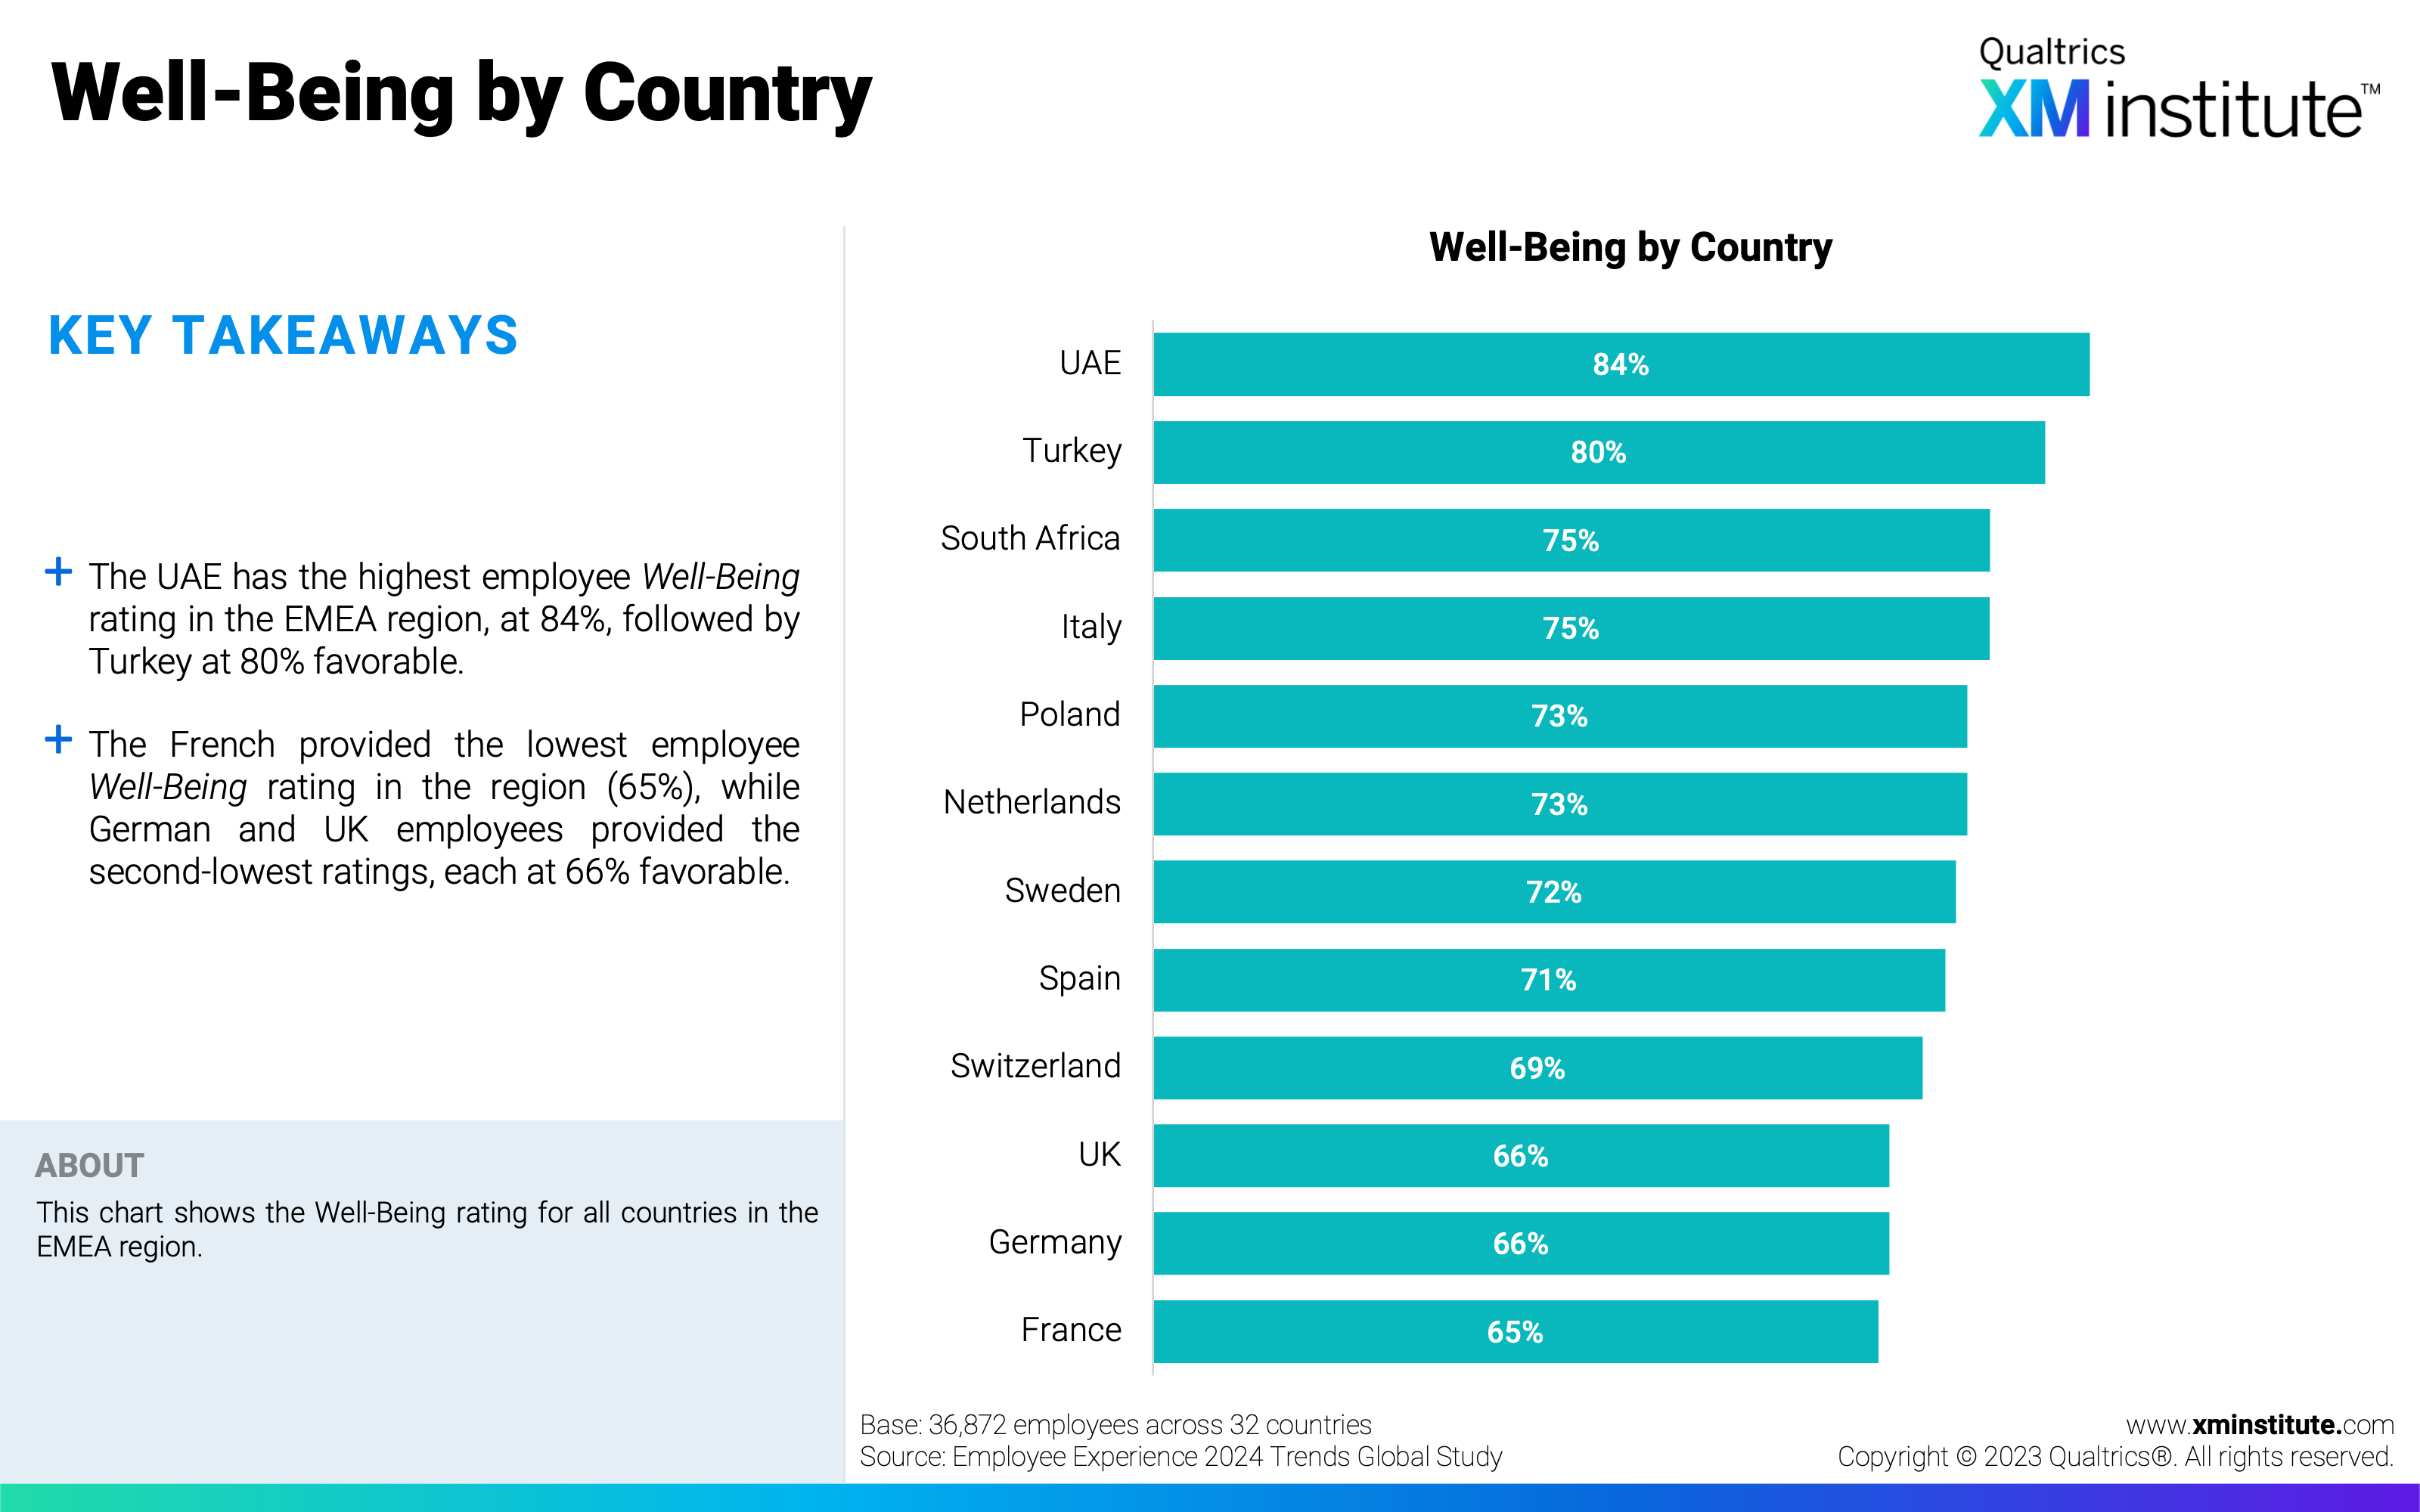
- Well-Being by Country (see Figure 3)
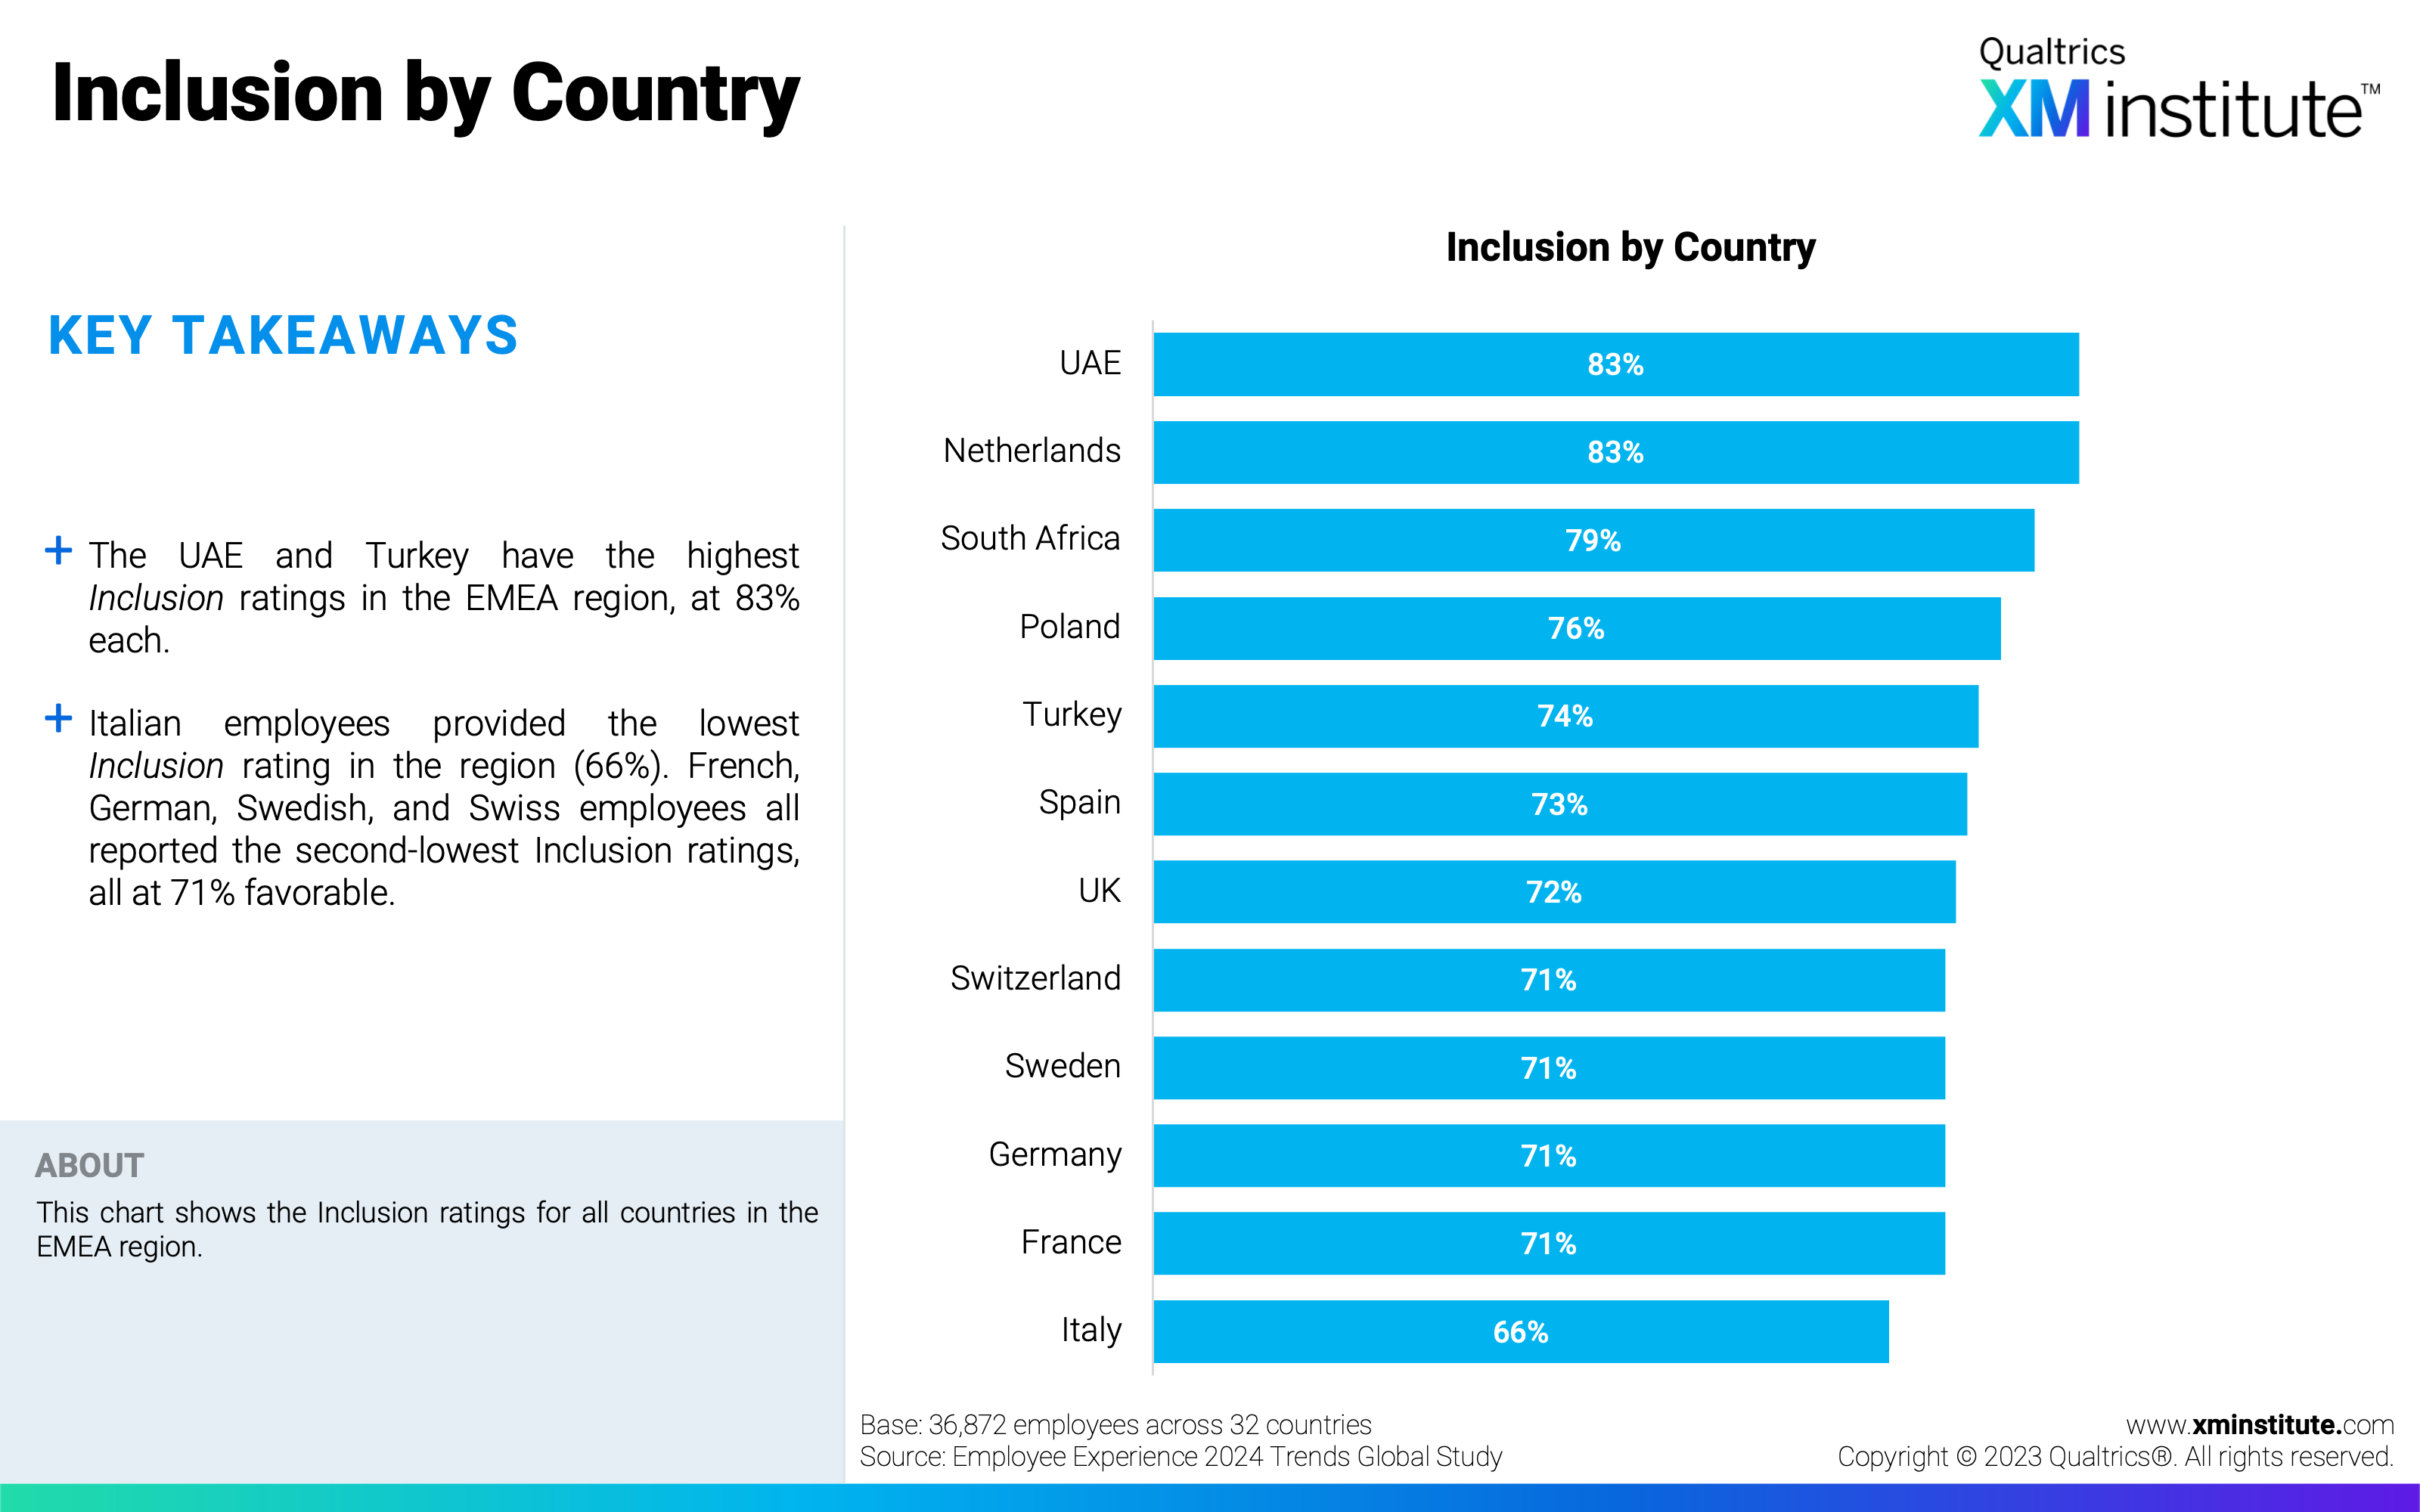
- Inclusion by Country (see Figure 4)
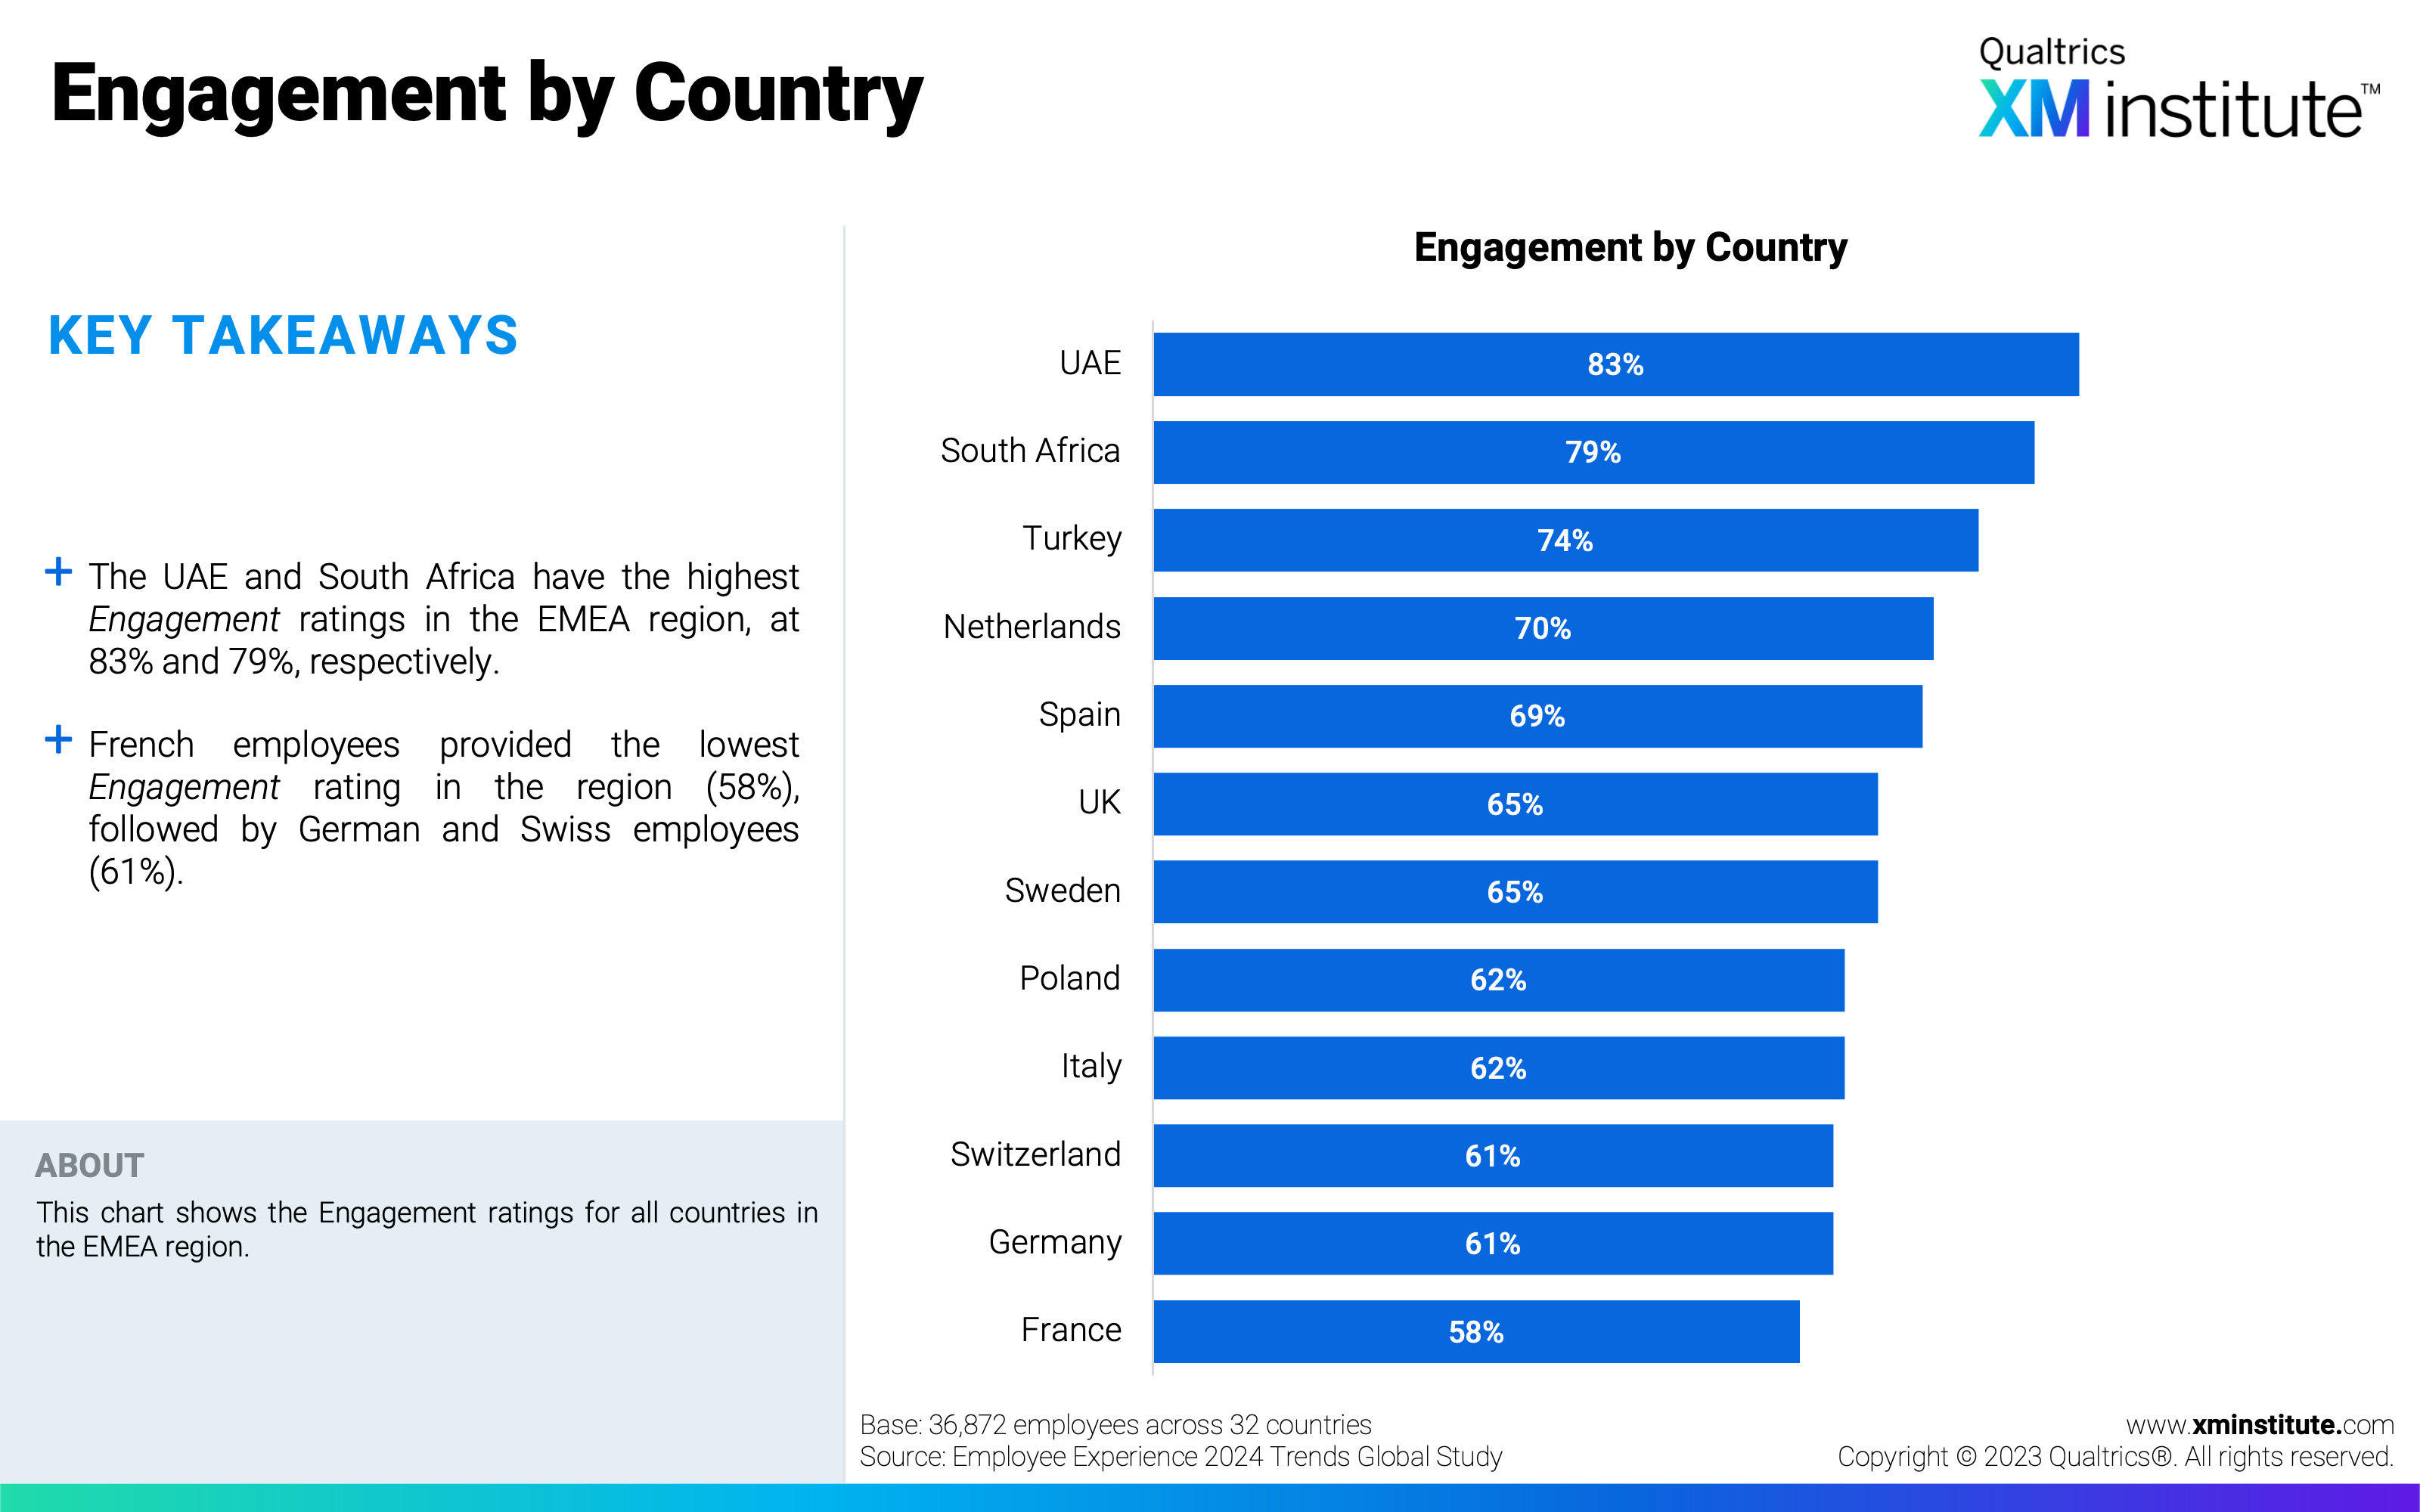
- Engagement by Country (see Figure 5)
- Intent to Stay by Country (see Figure 6)
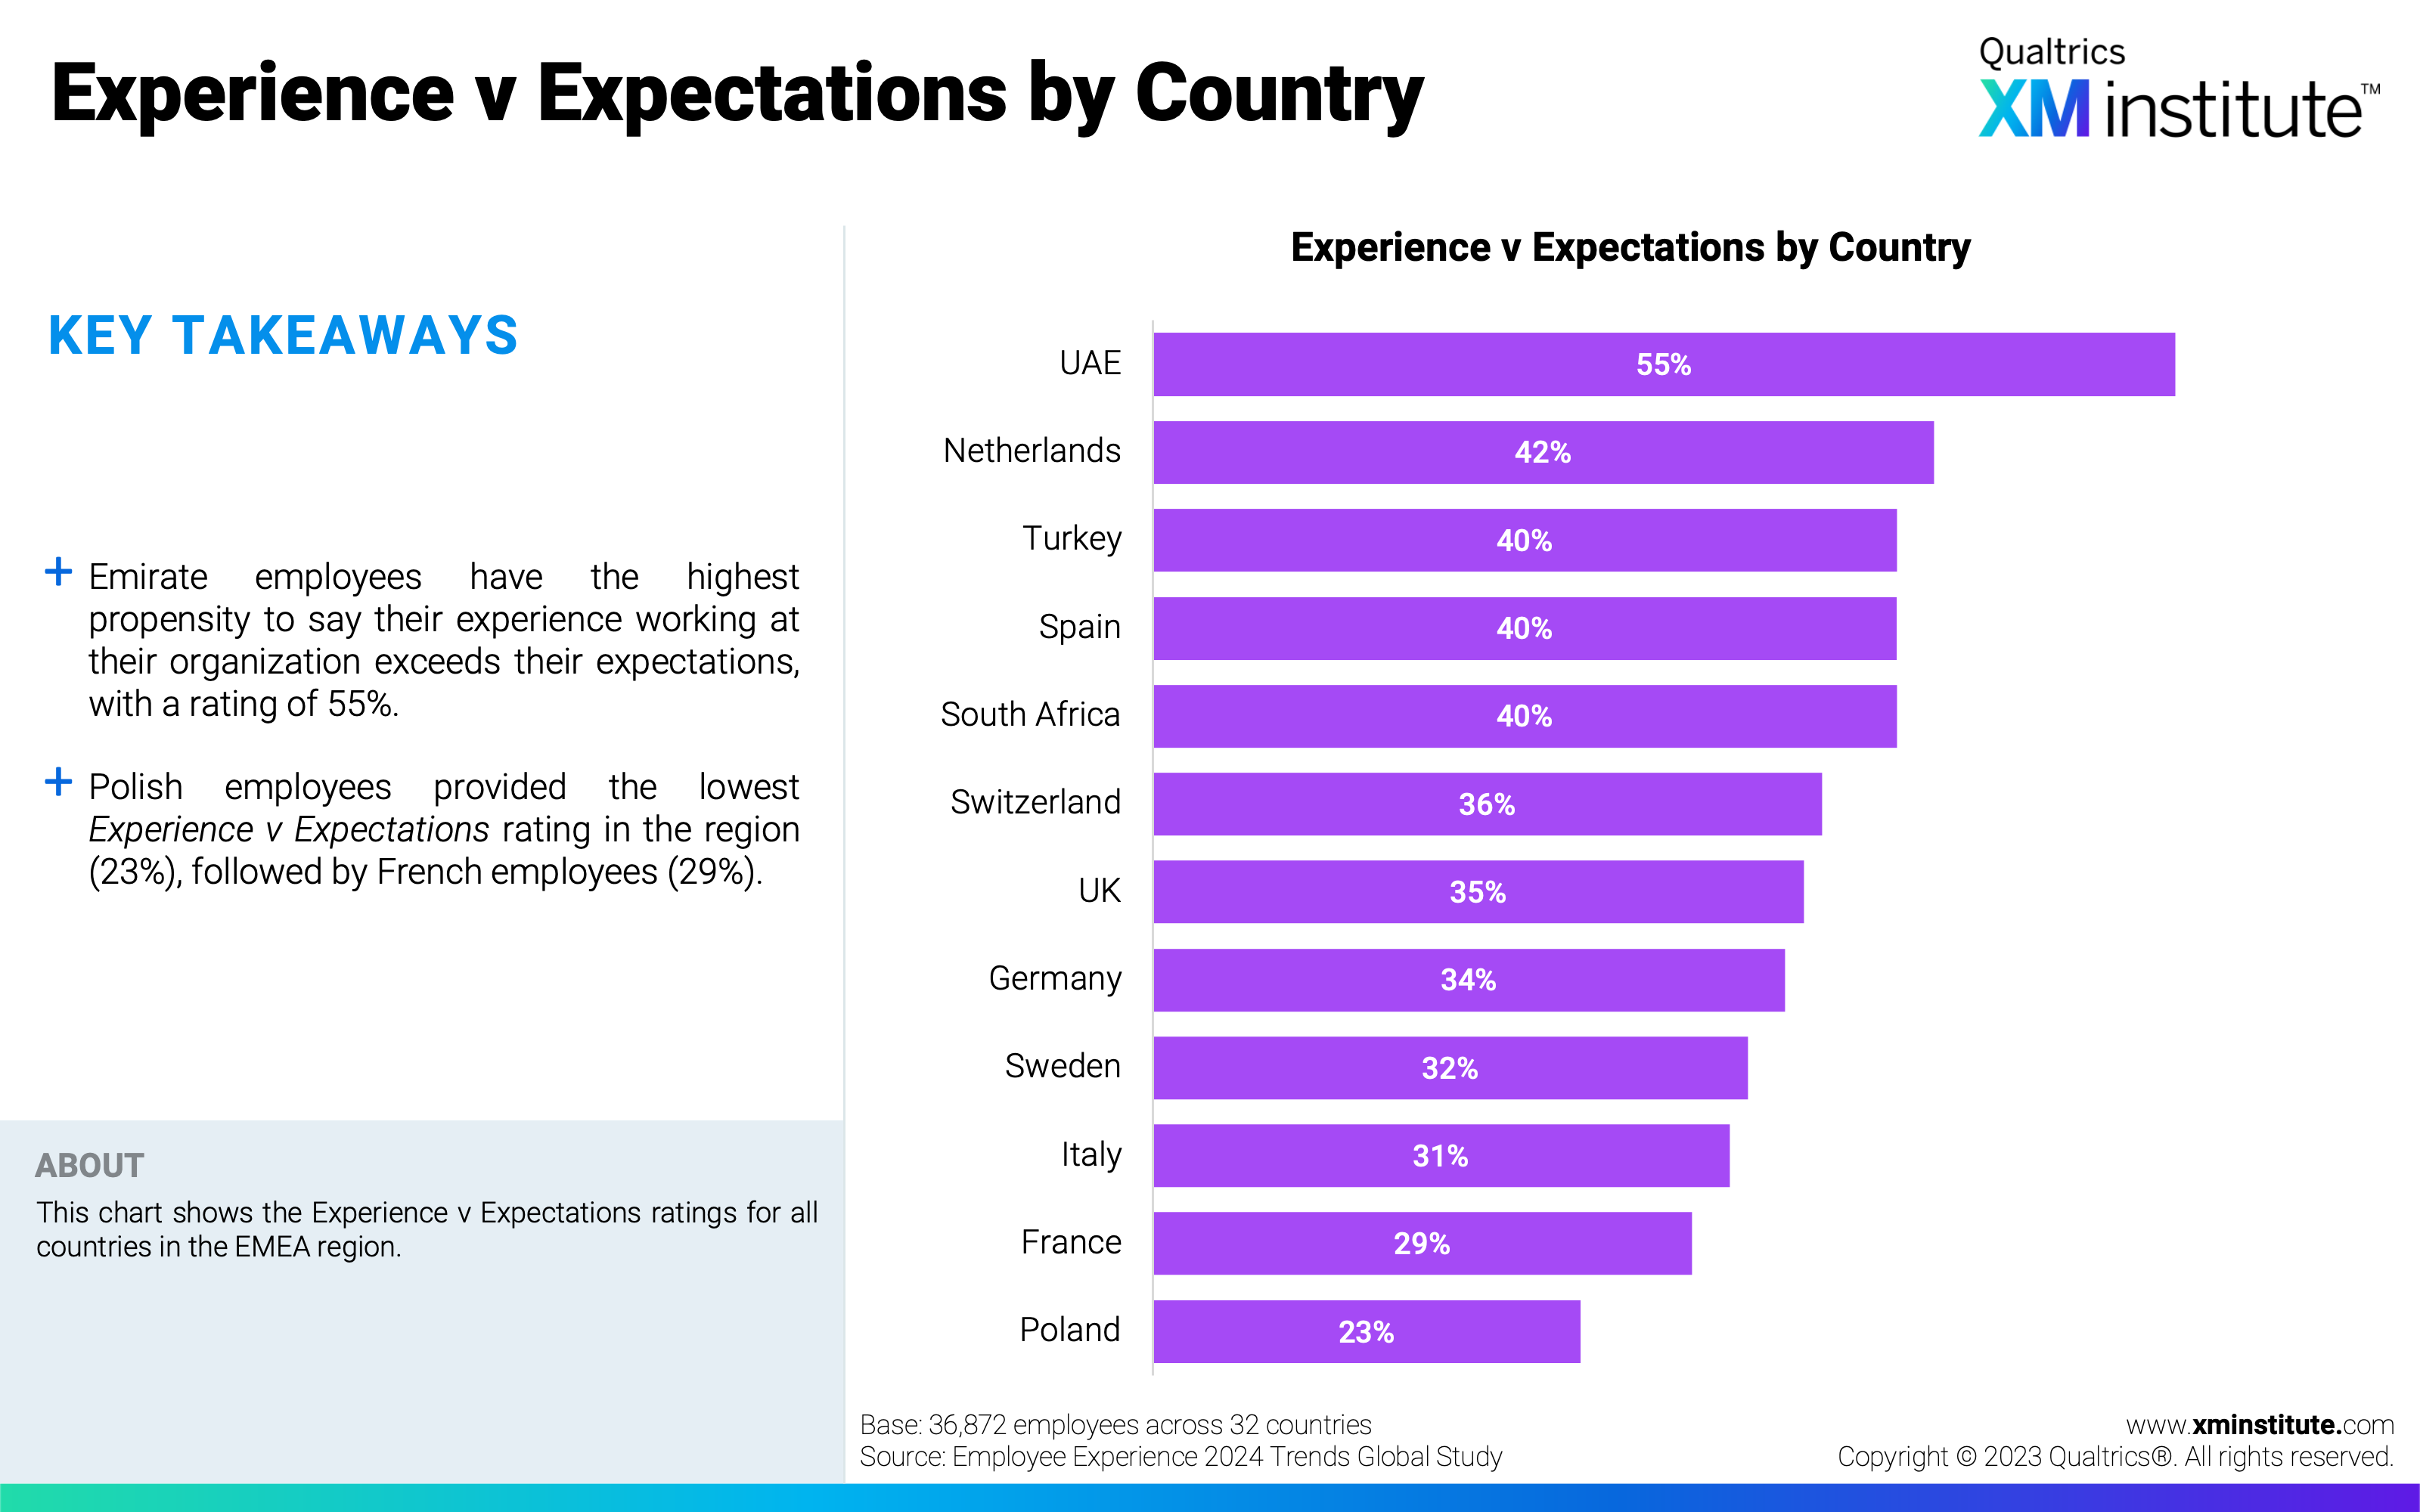
- Experience v Expectations by Country (see Figure 7)
- Employee Experience KPIs: France (see Figure 8)
- Employee Experience KPIs: Germany (see Figure 9)
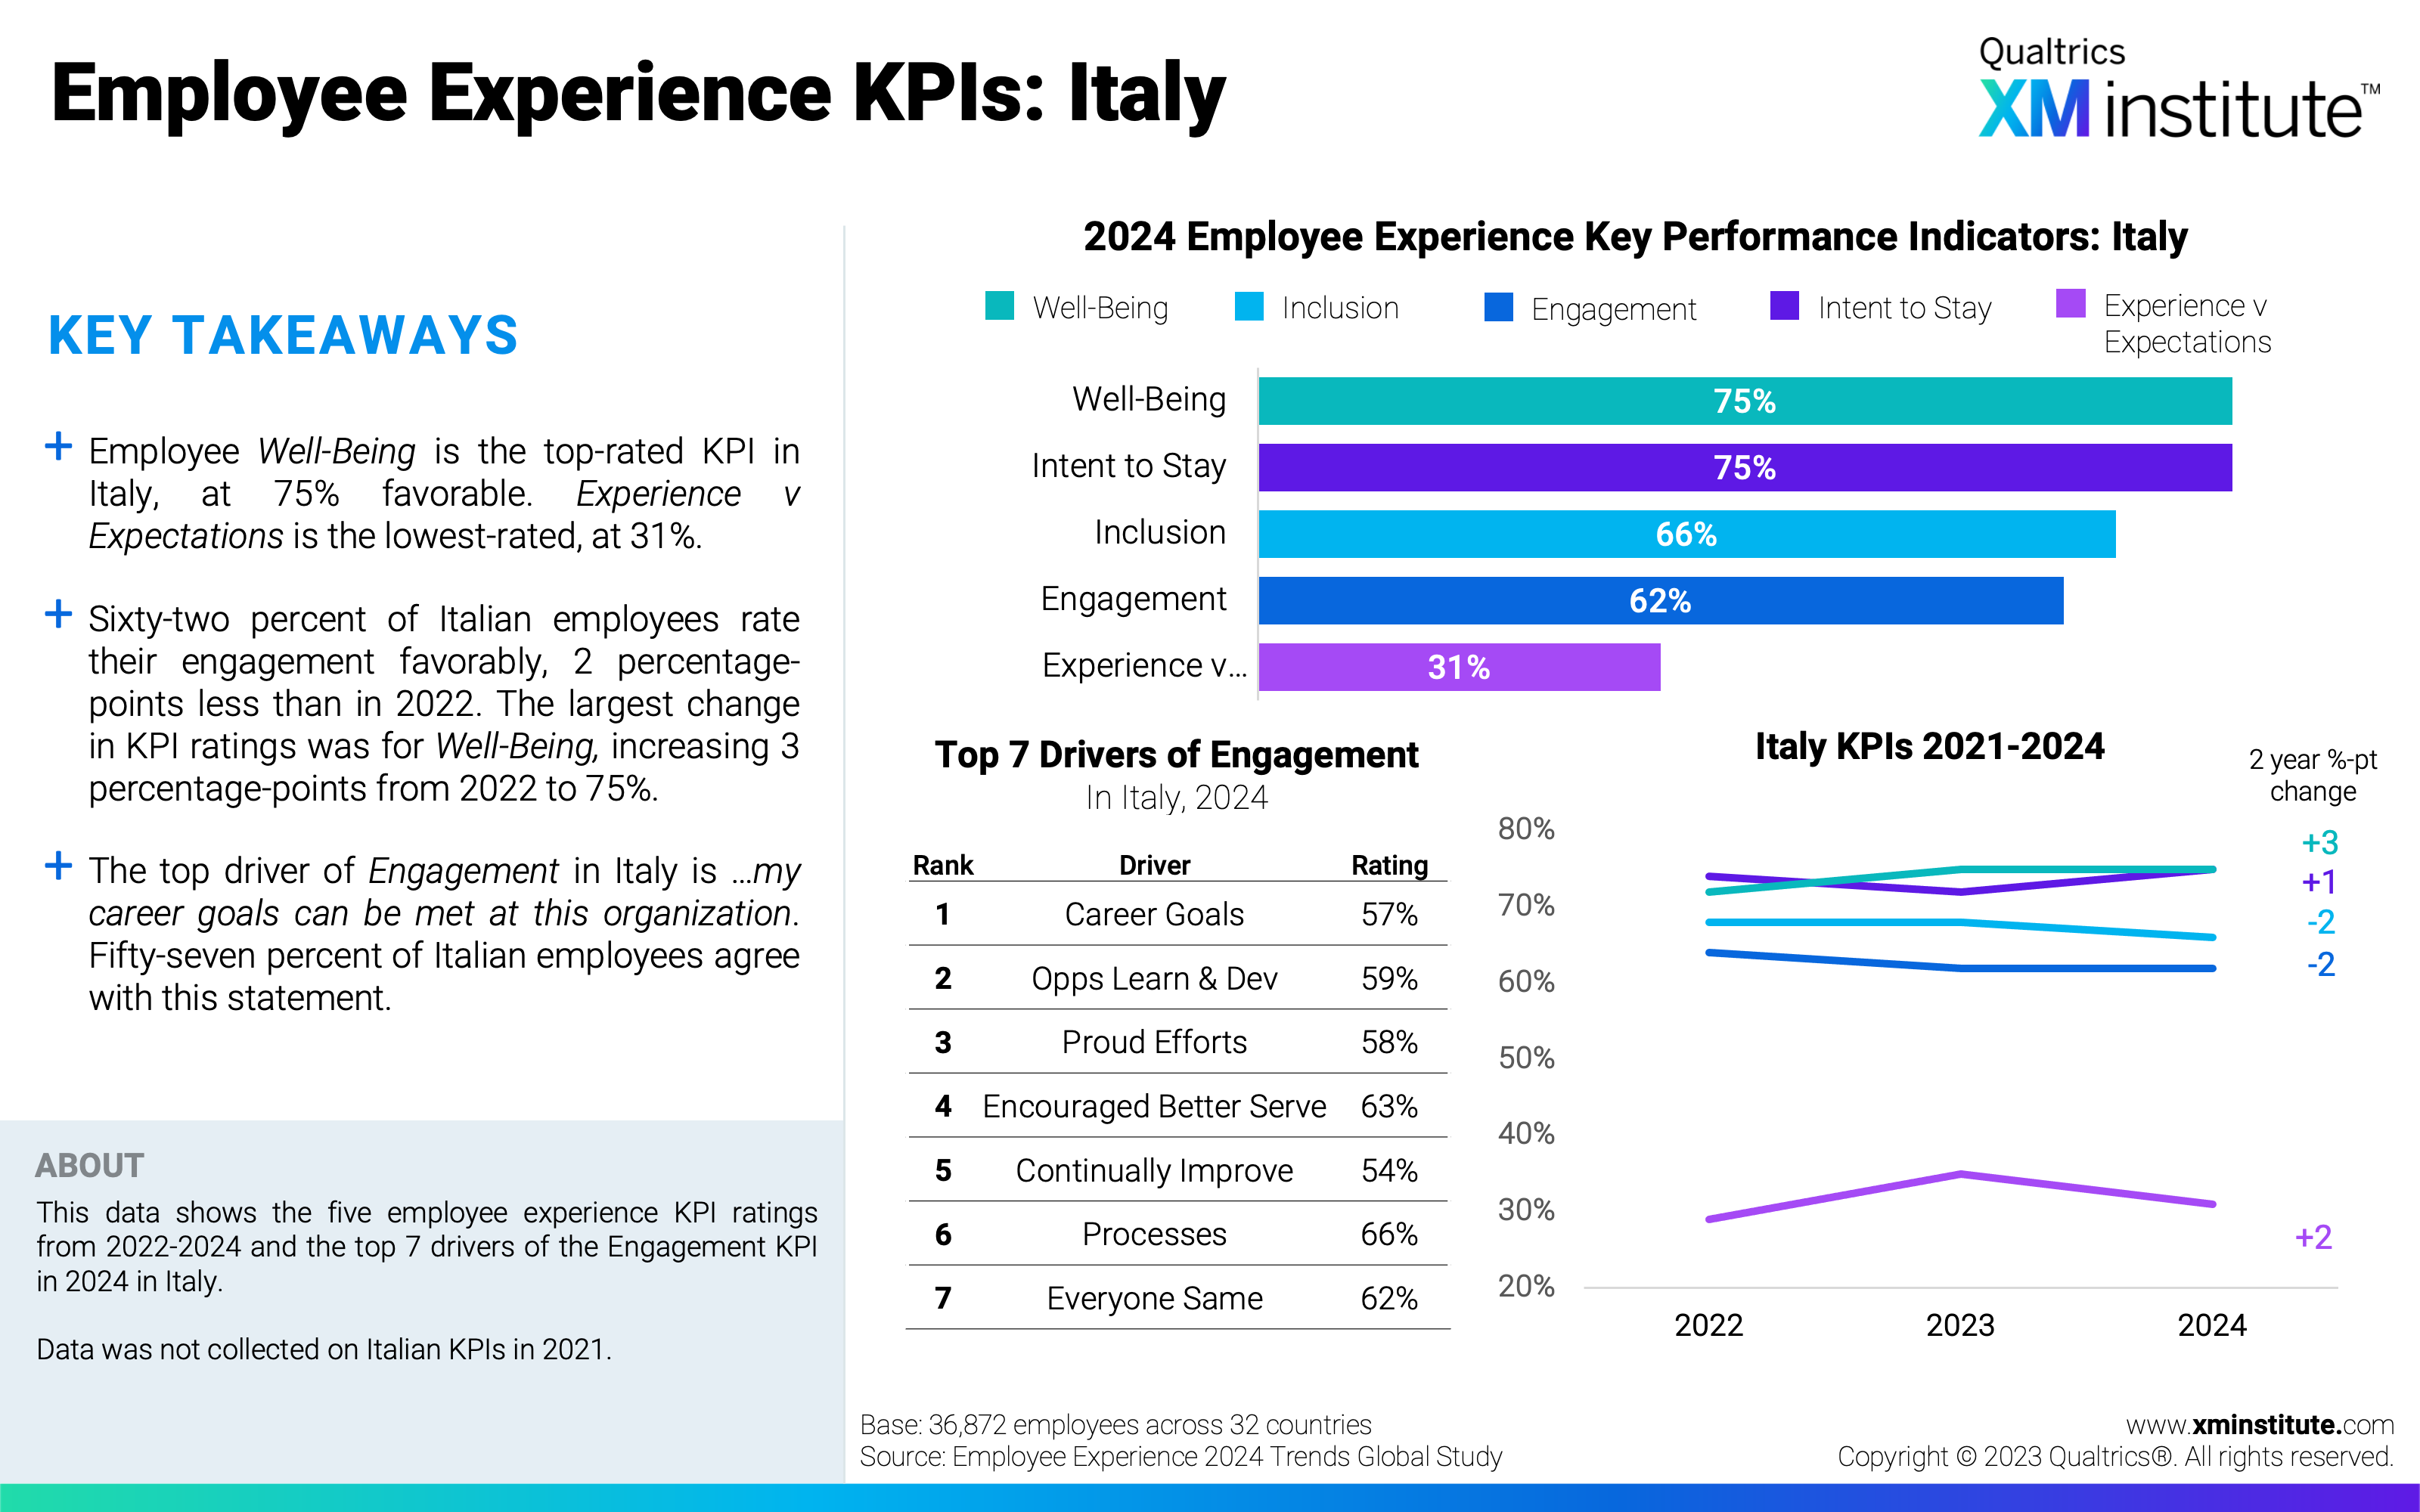
- Employee Experience KPIs: Italy (see Figure 10)
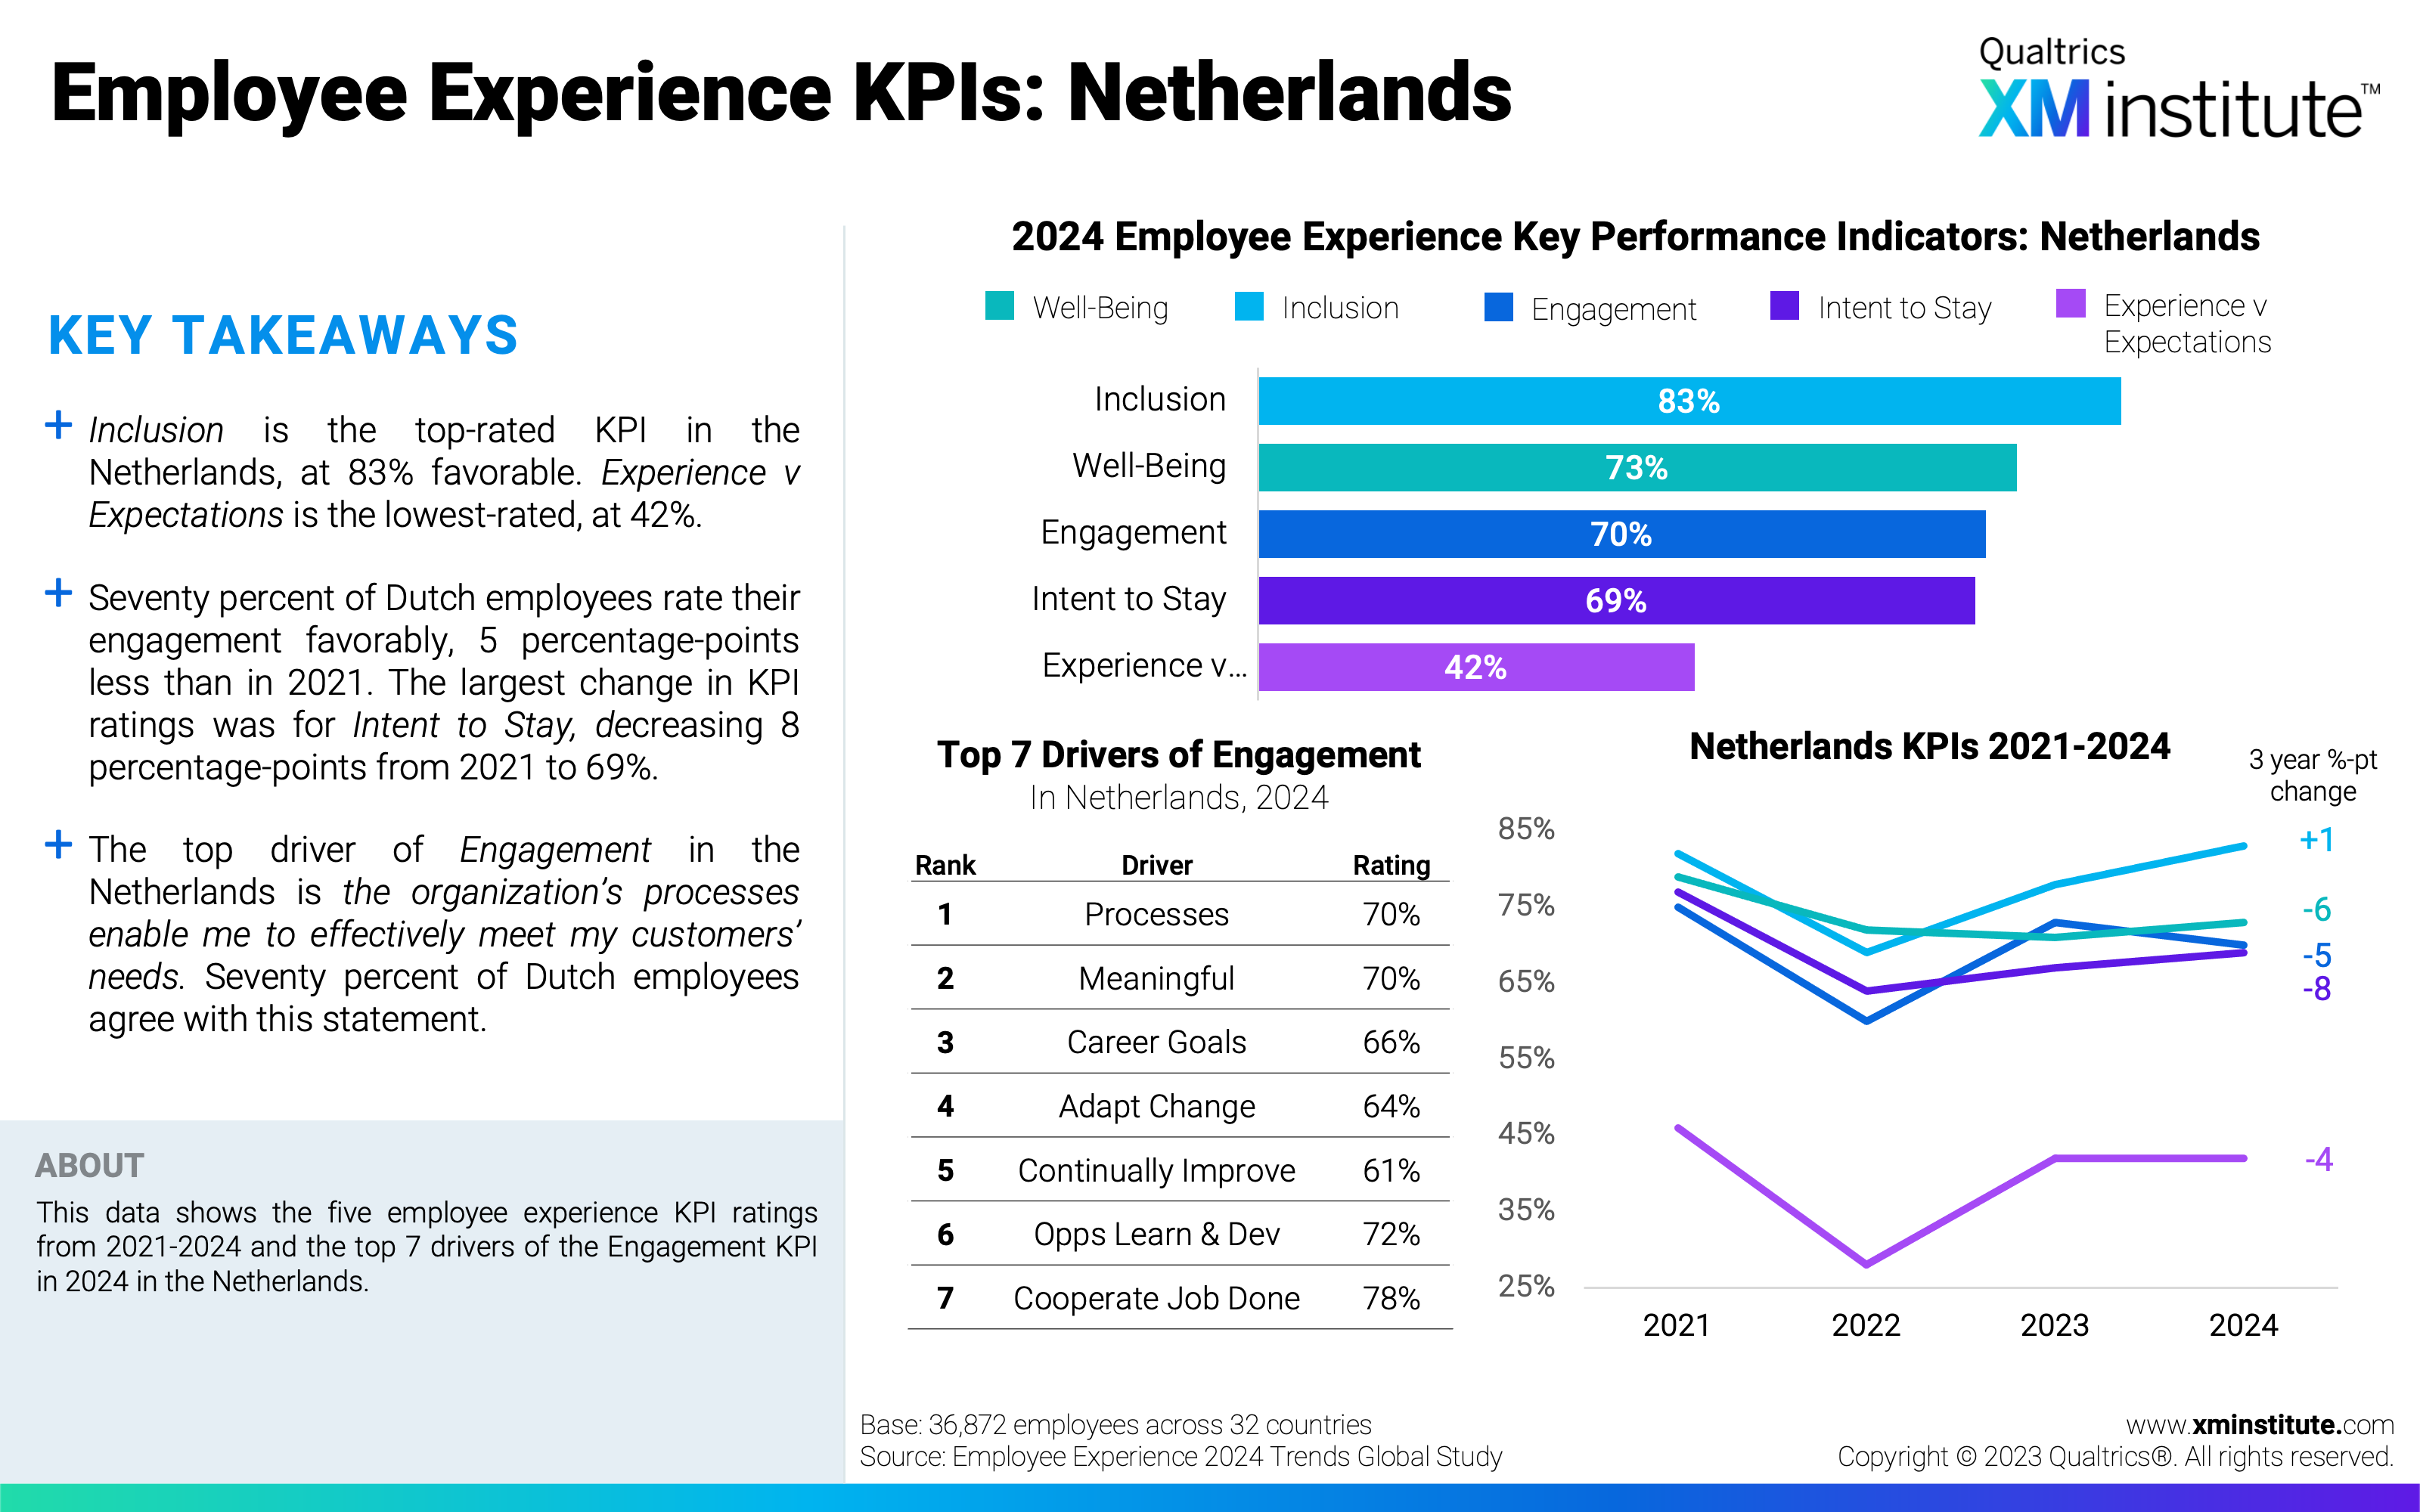
- Employee Experience KPIs: Netherlands (see Figure 11)
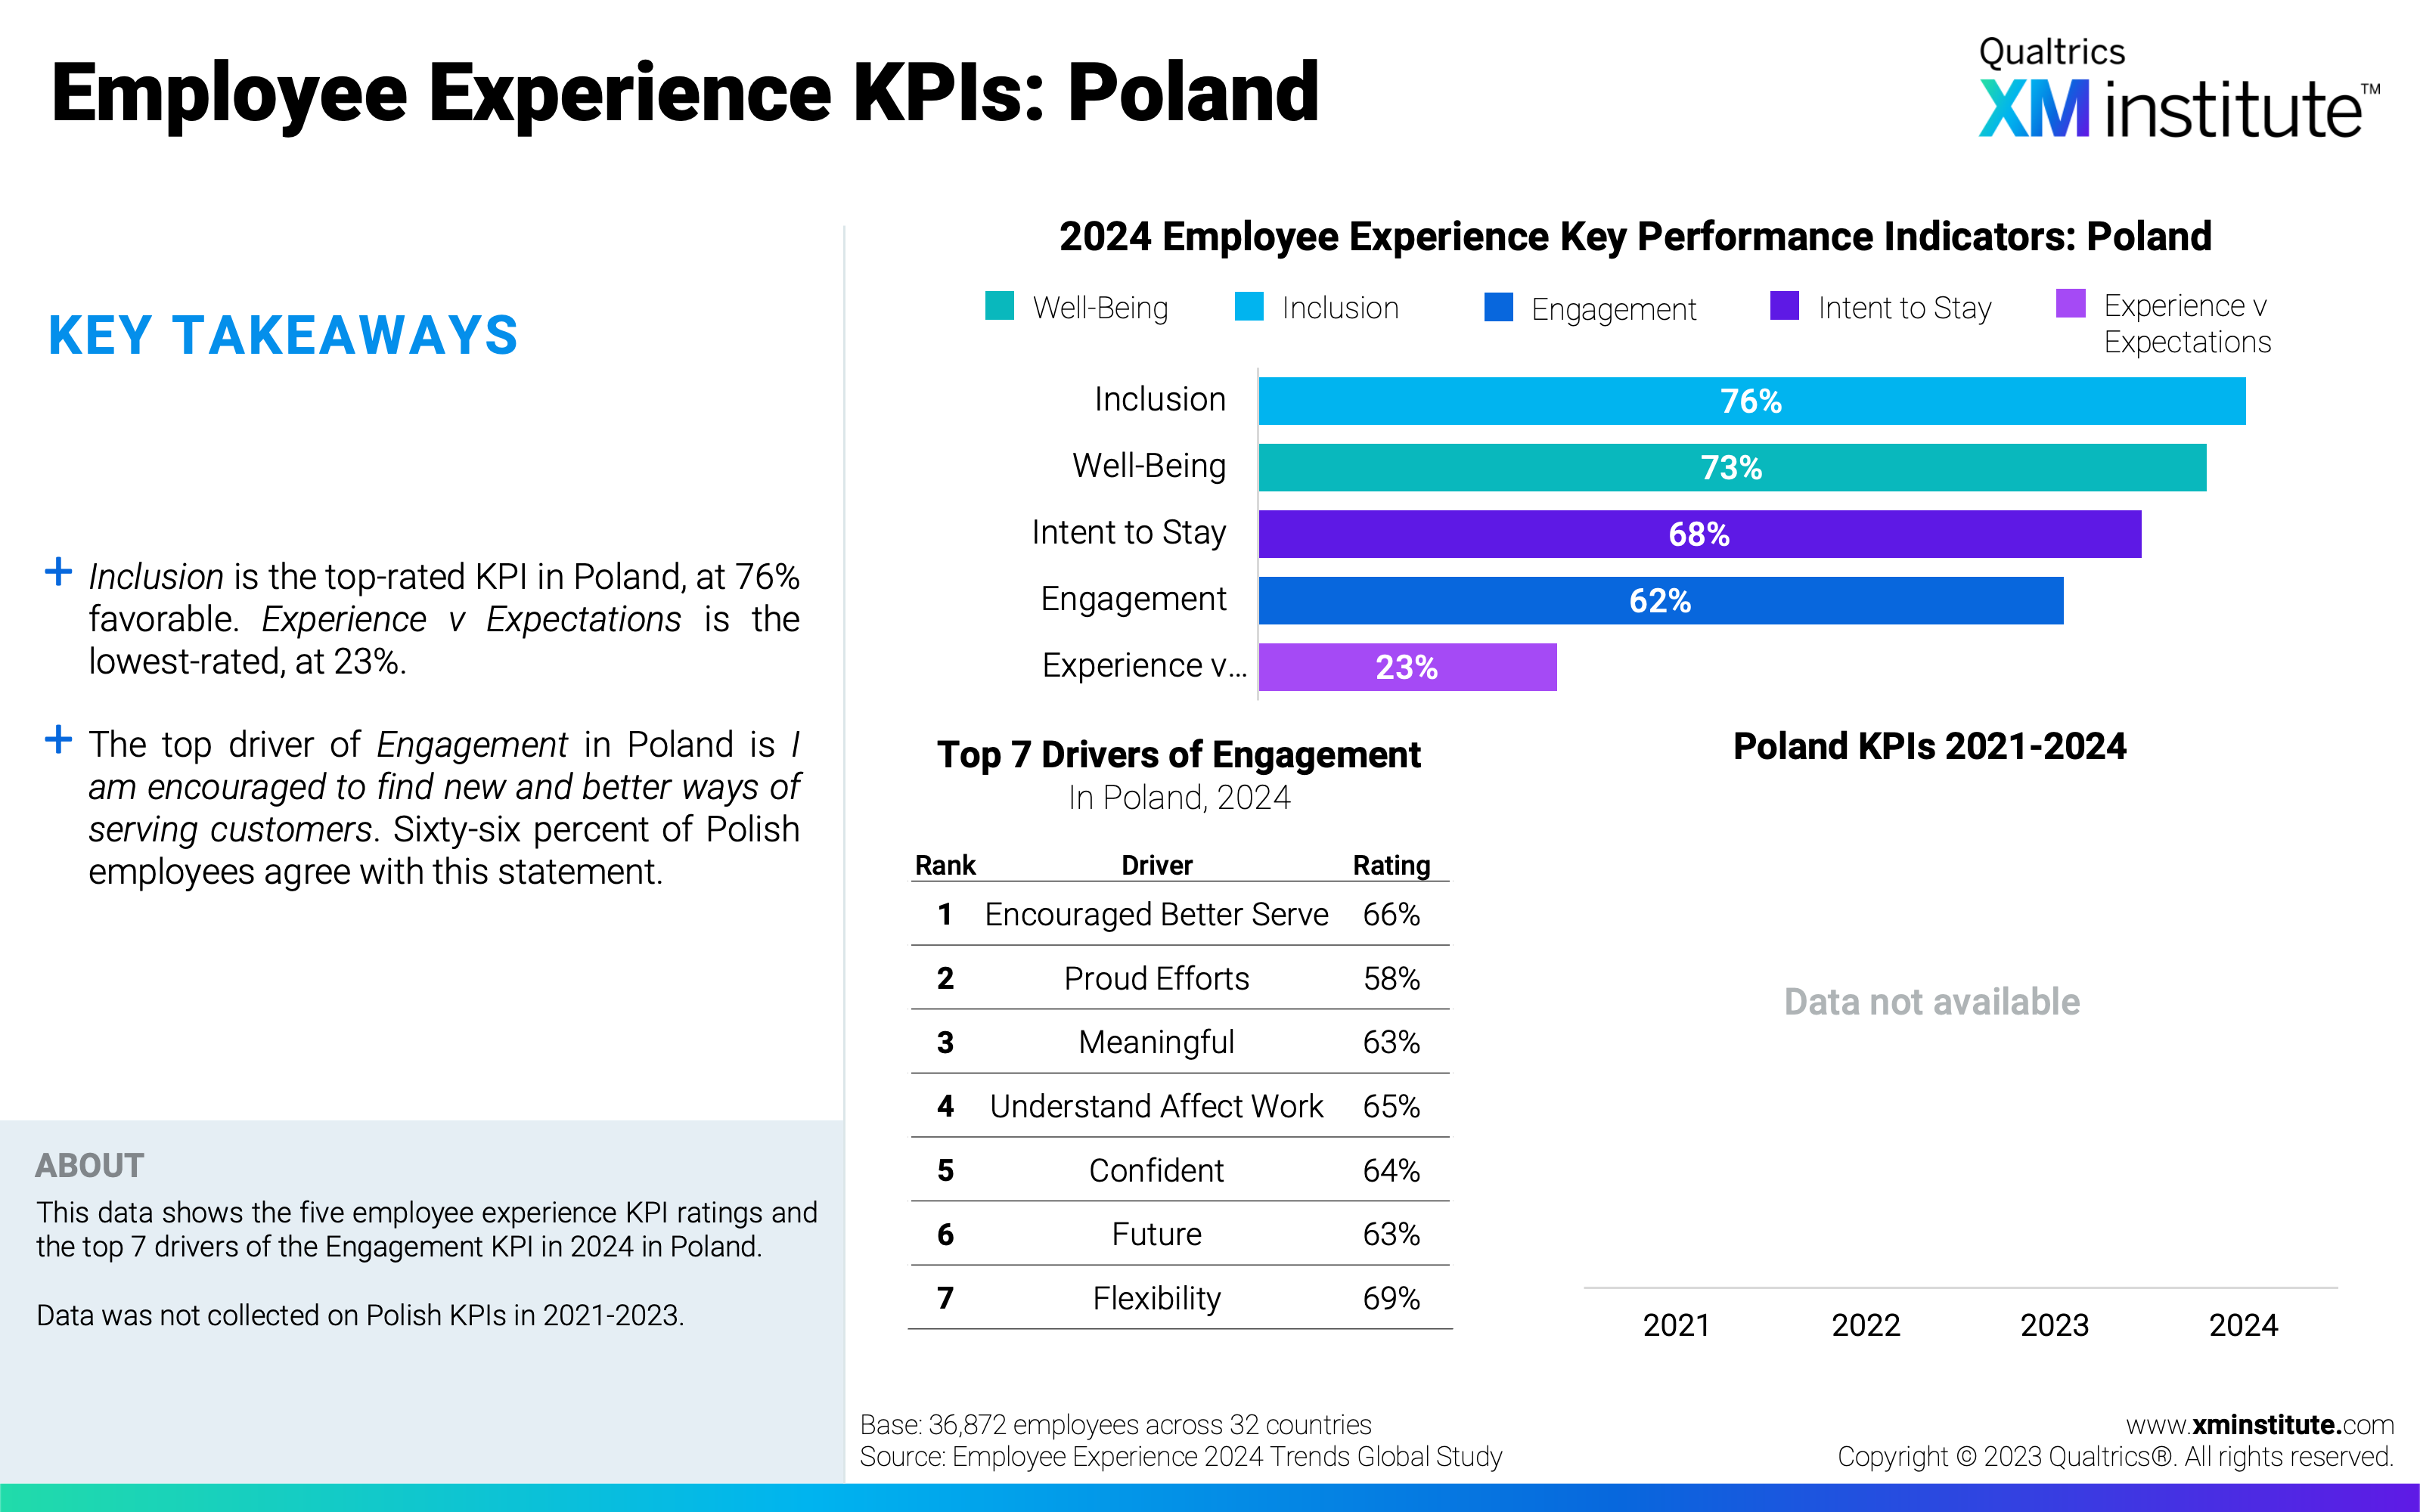
- Employee Experience KPIs: Poland (see Figure 12)
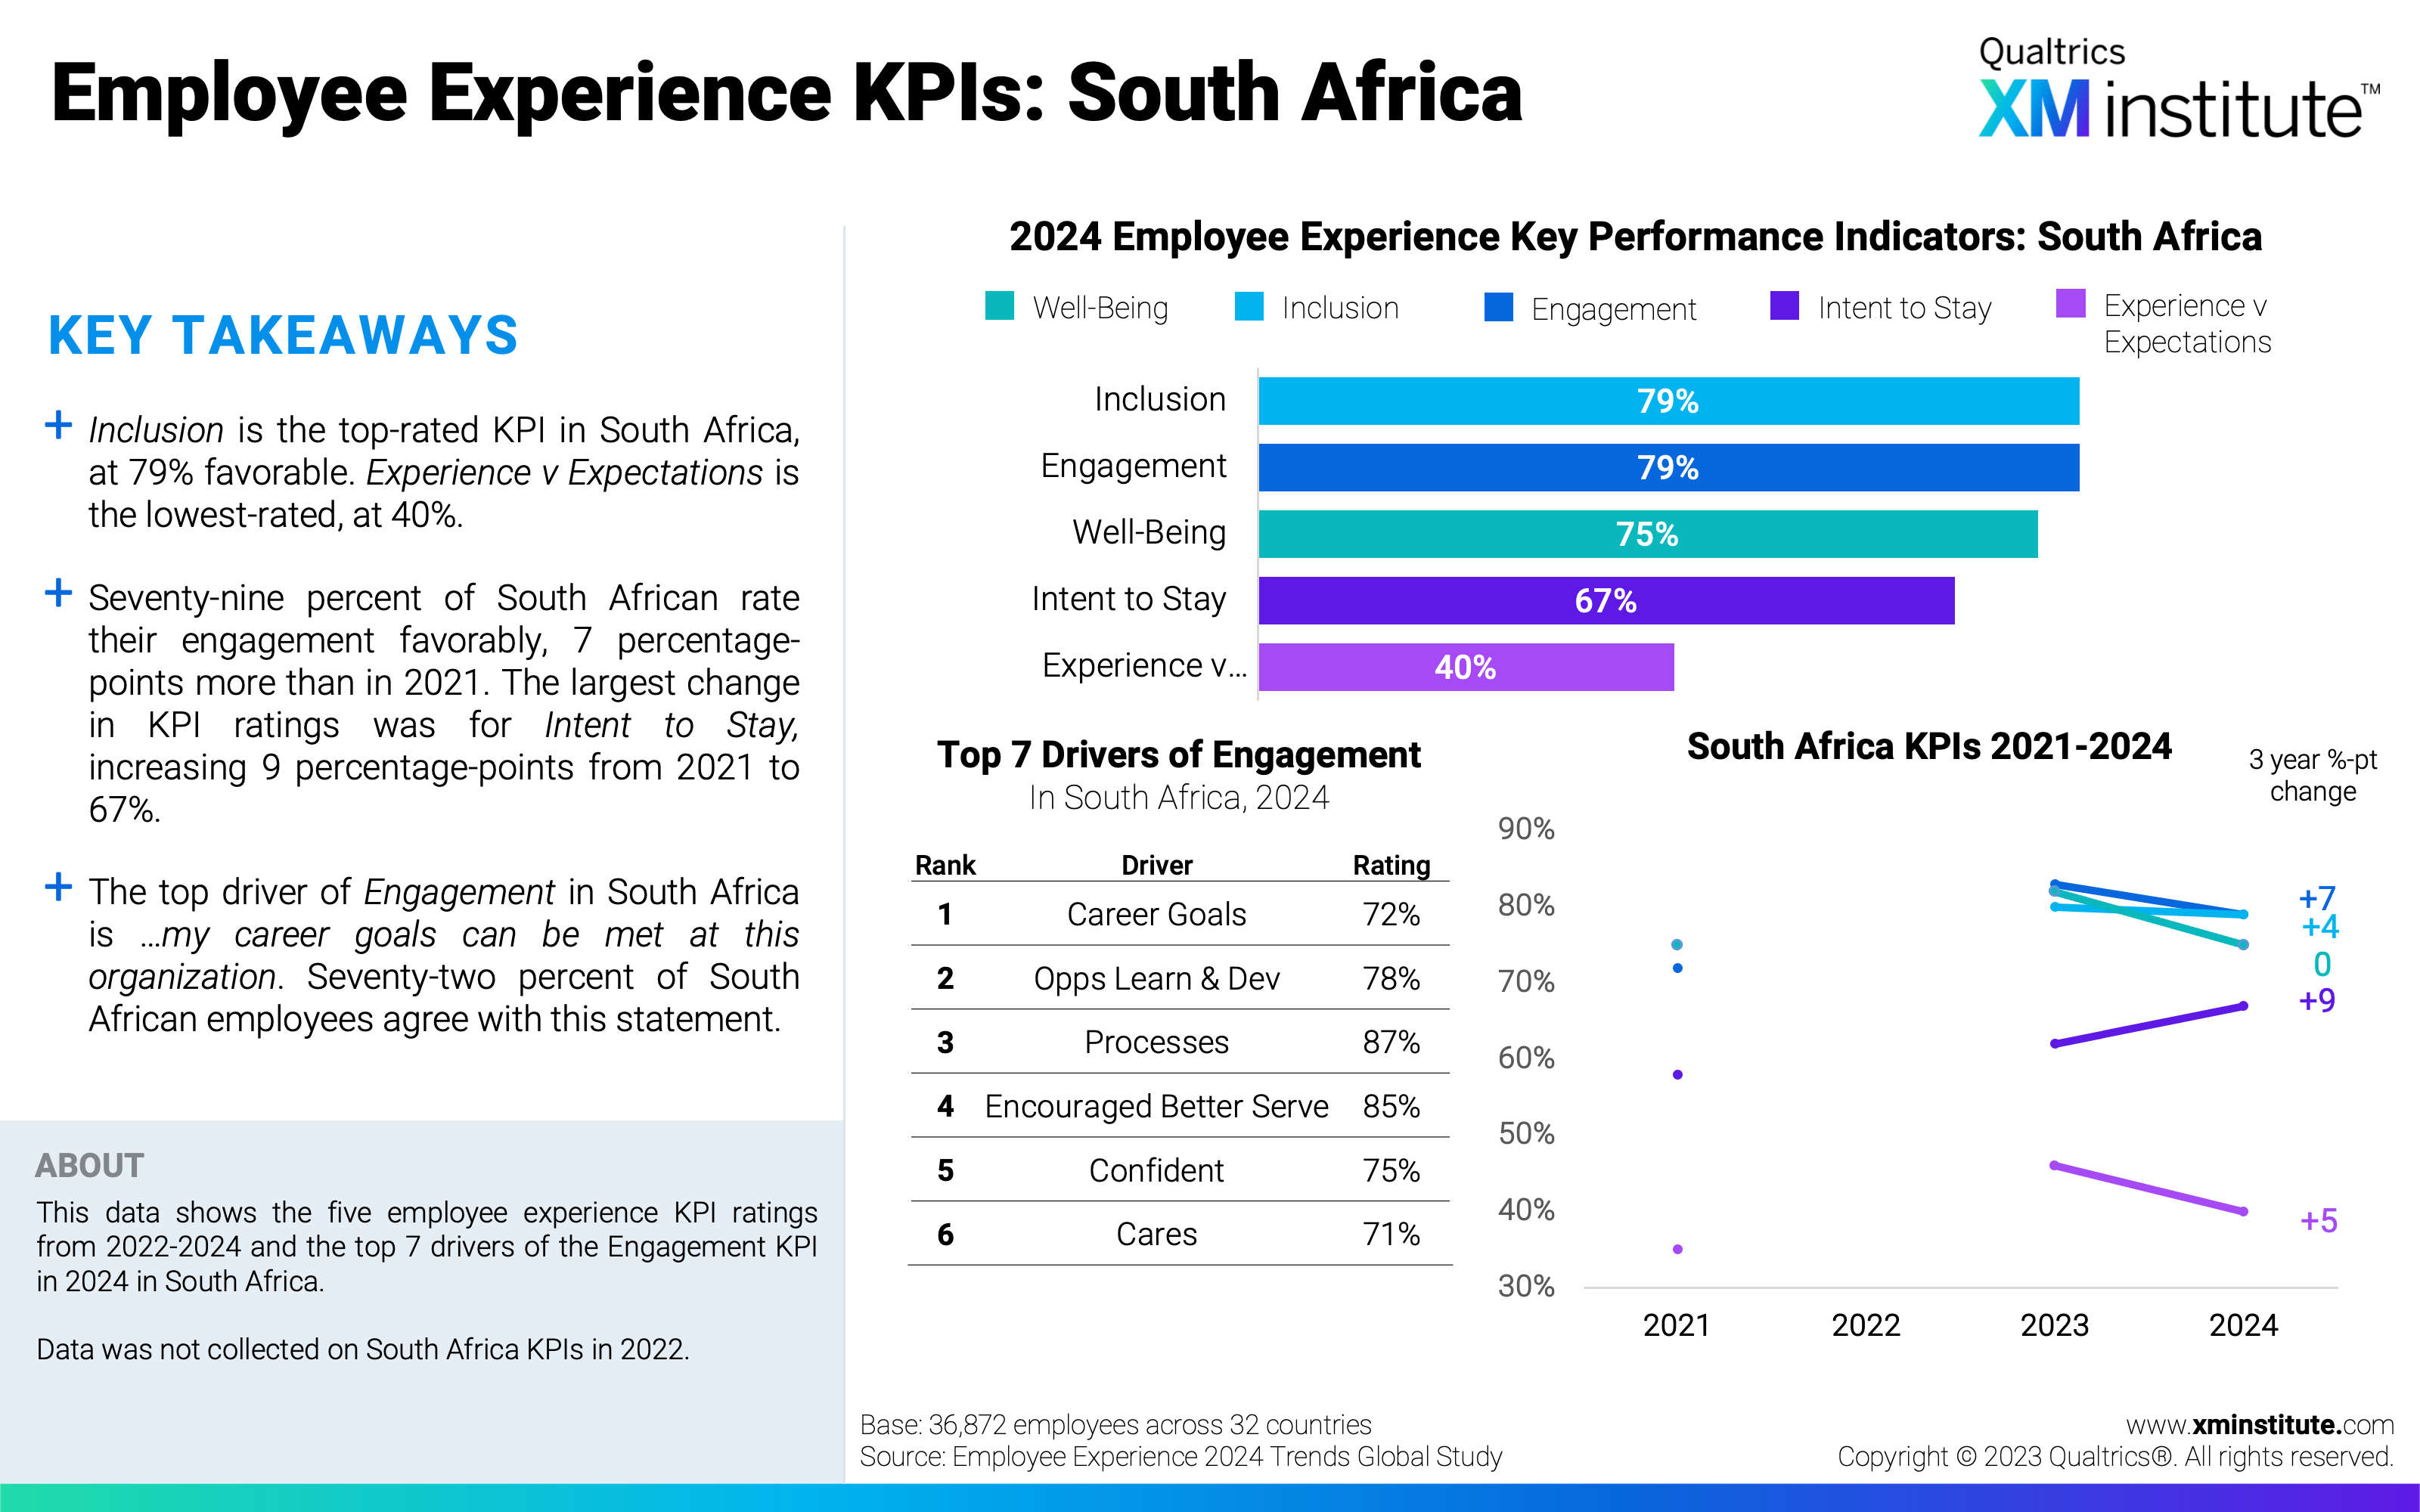
- Employee Experience KPIs: South Africa (see Figure 13)
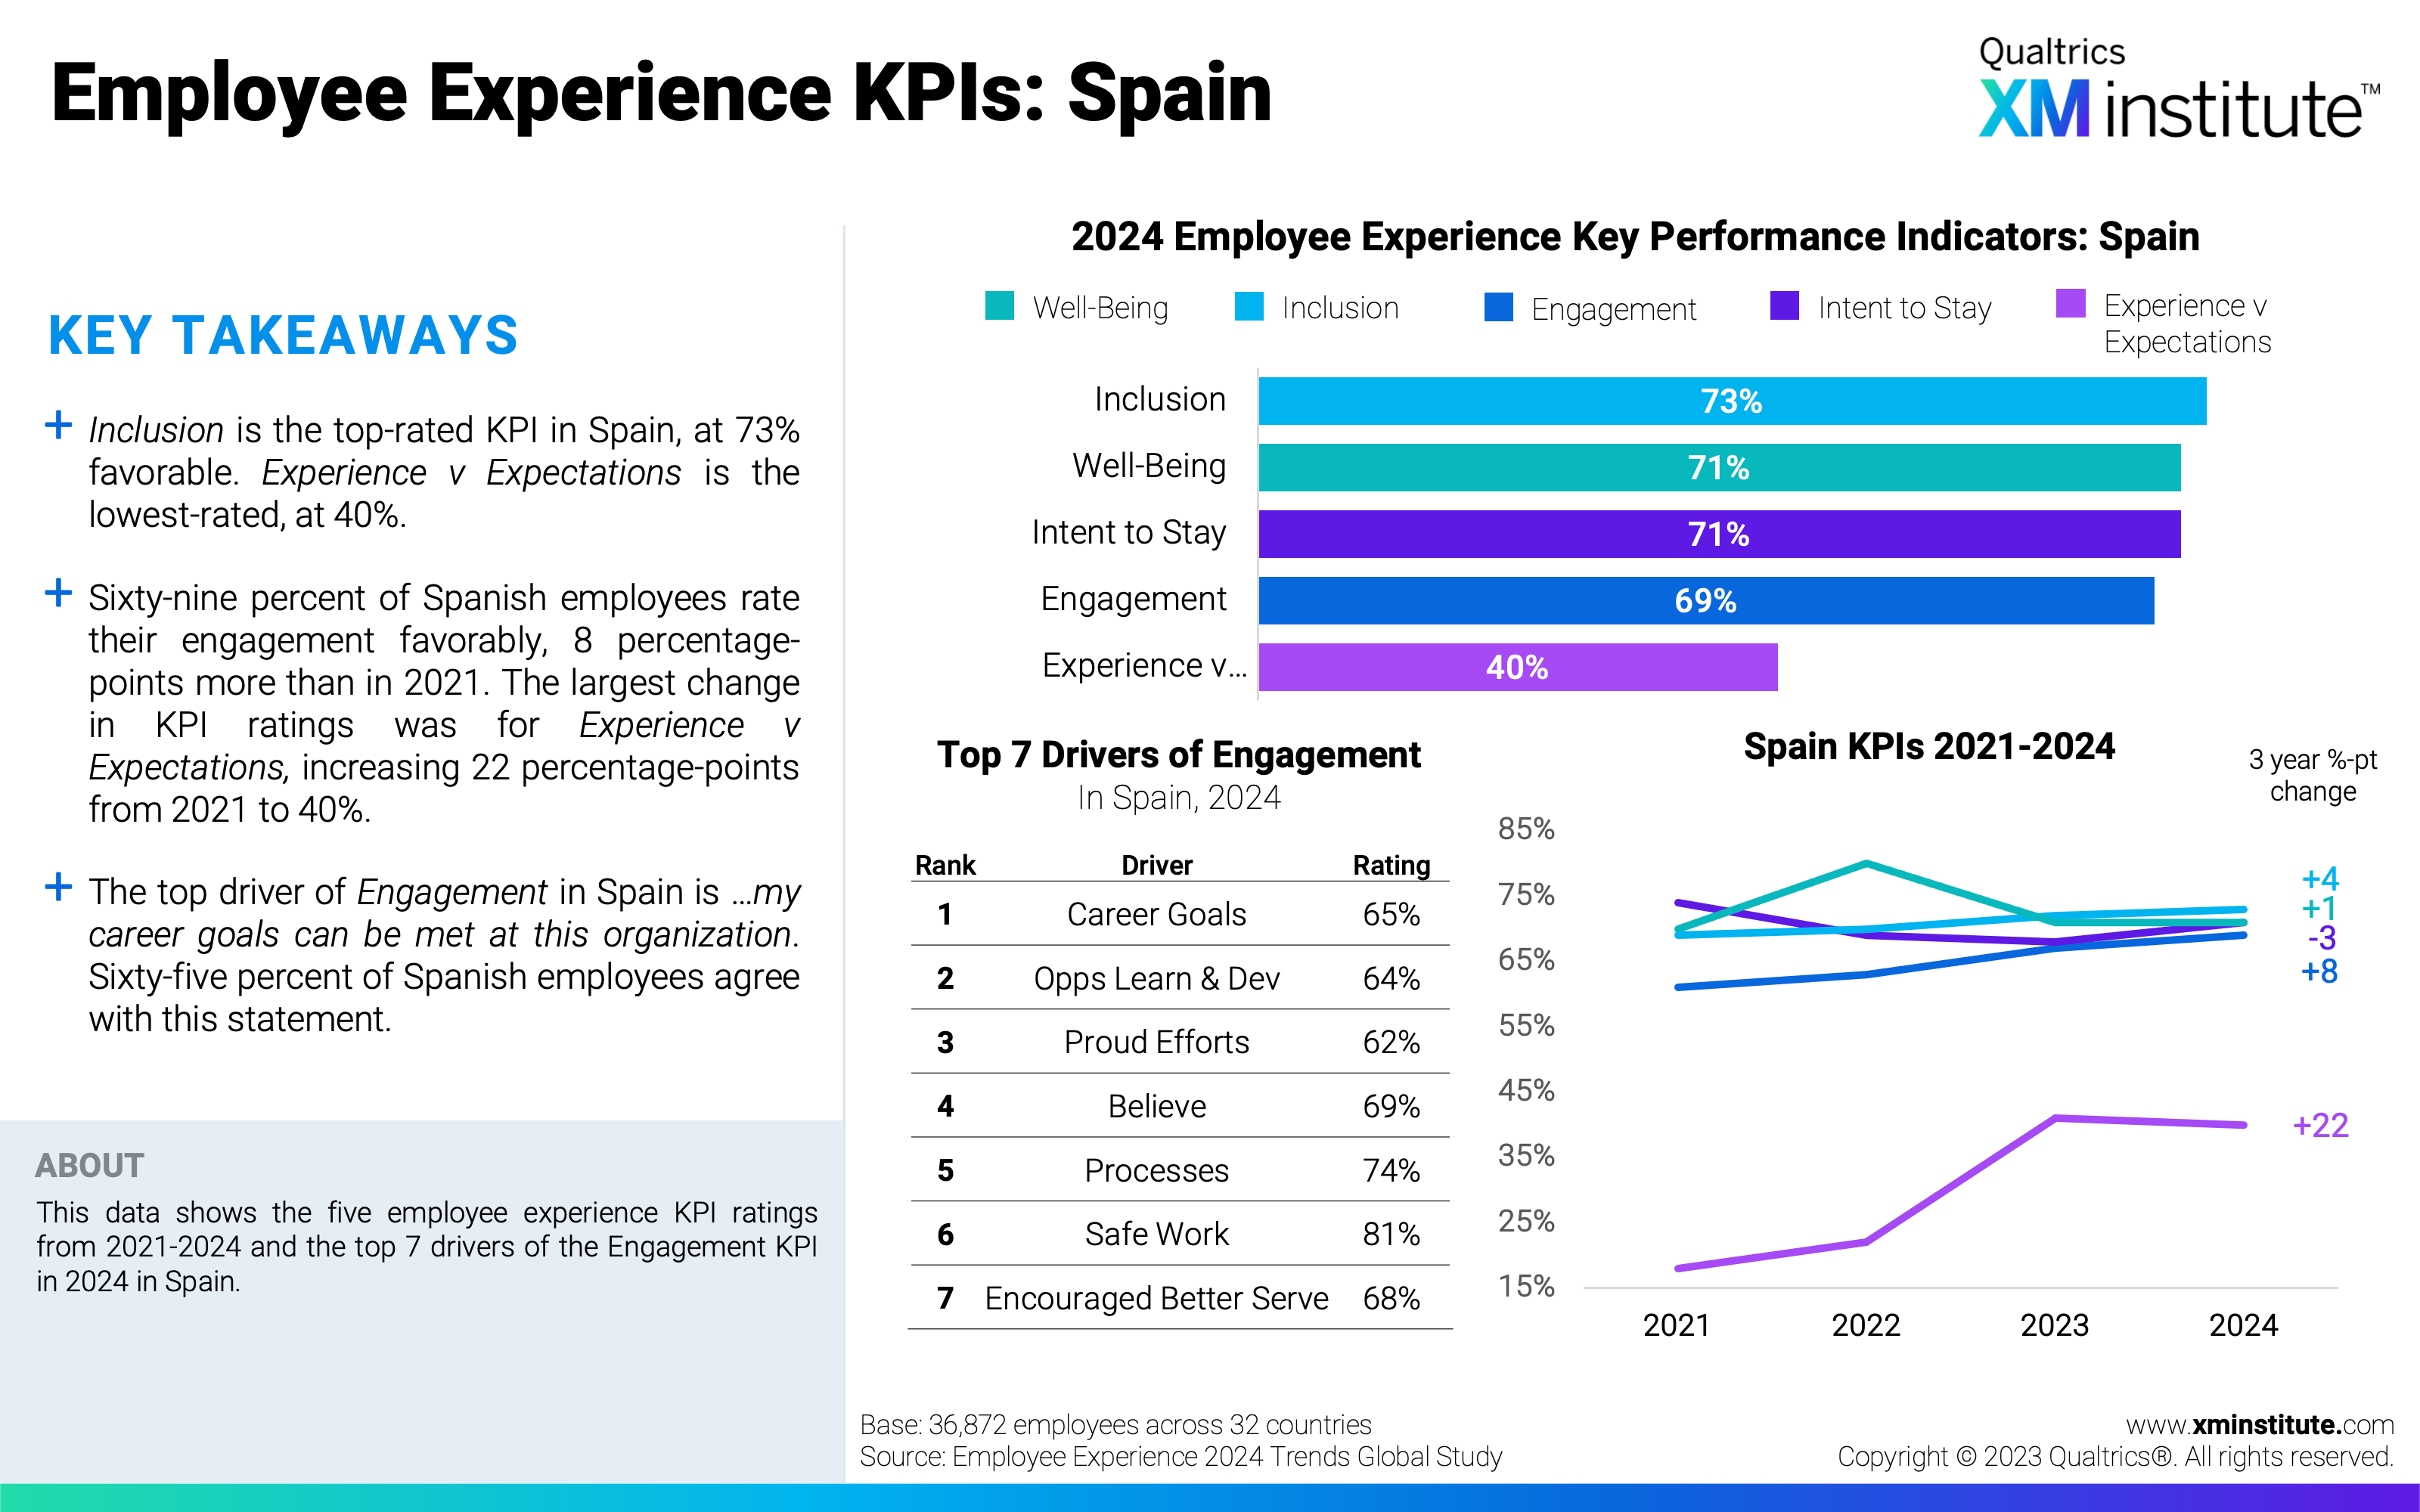
- Employee Experience KPIs: Spain (see Figure 14)
- Employee Experience KPIs: Sweden (see Figure 15)
- Employee Experience KPIs: Switzerland (see Figure 16)
- Employee Experience KPIs: Turkey (see Figure 17)
- Employee Experience KPIs: United Arab Emirates (see Figure 18)
- Employee Experience KPIs: United Kingdom (see Figure 19)
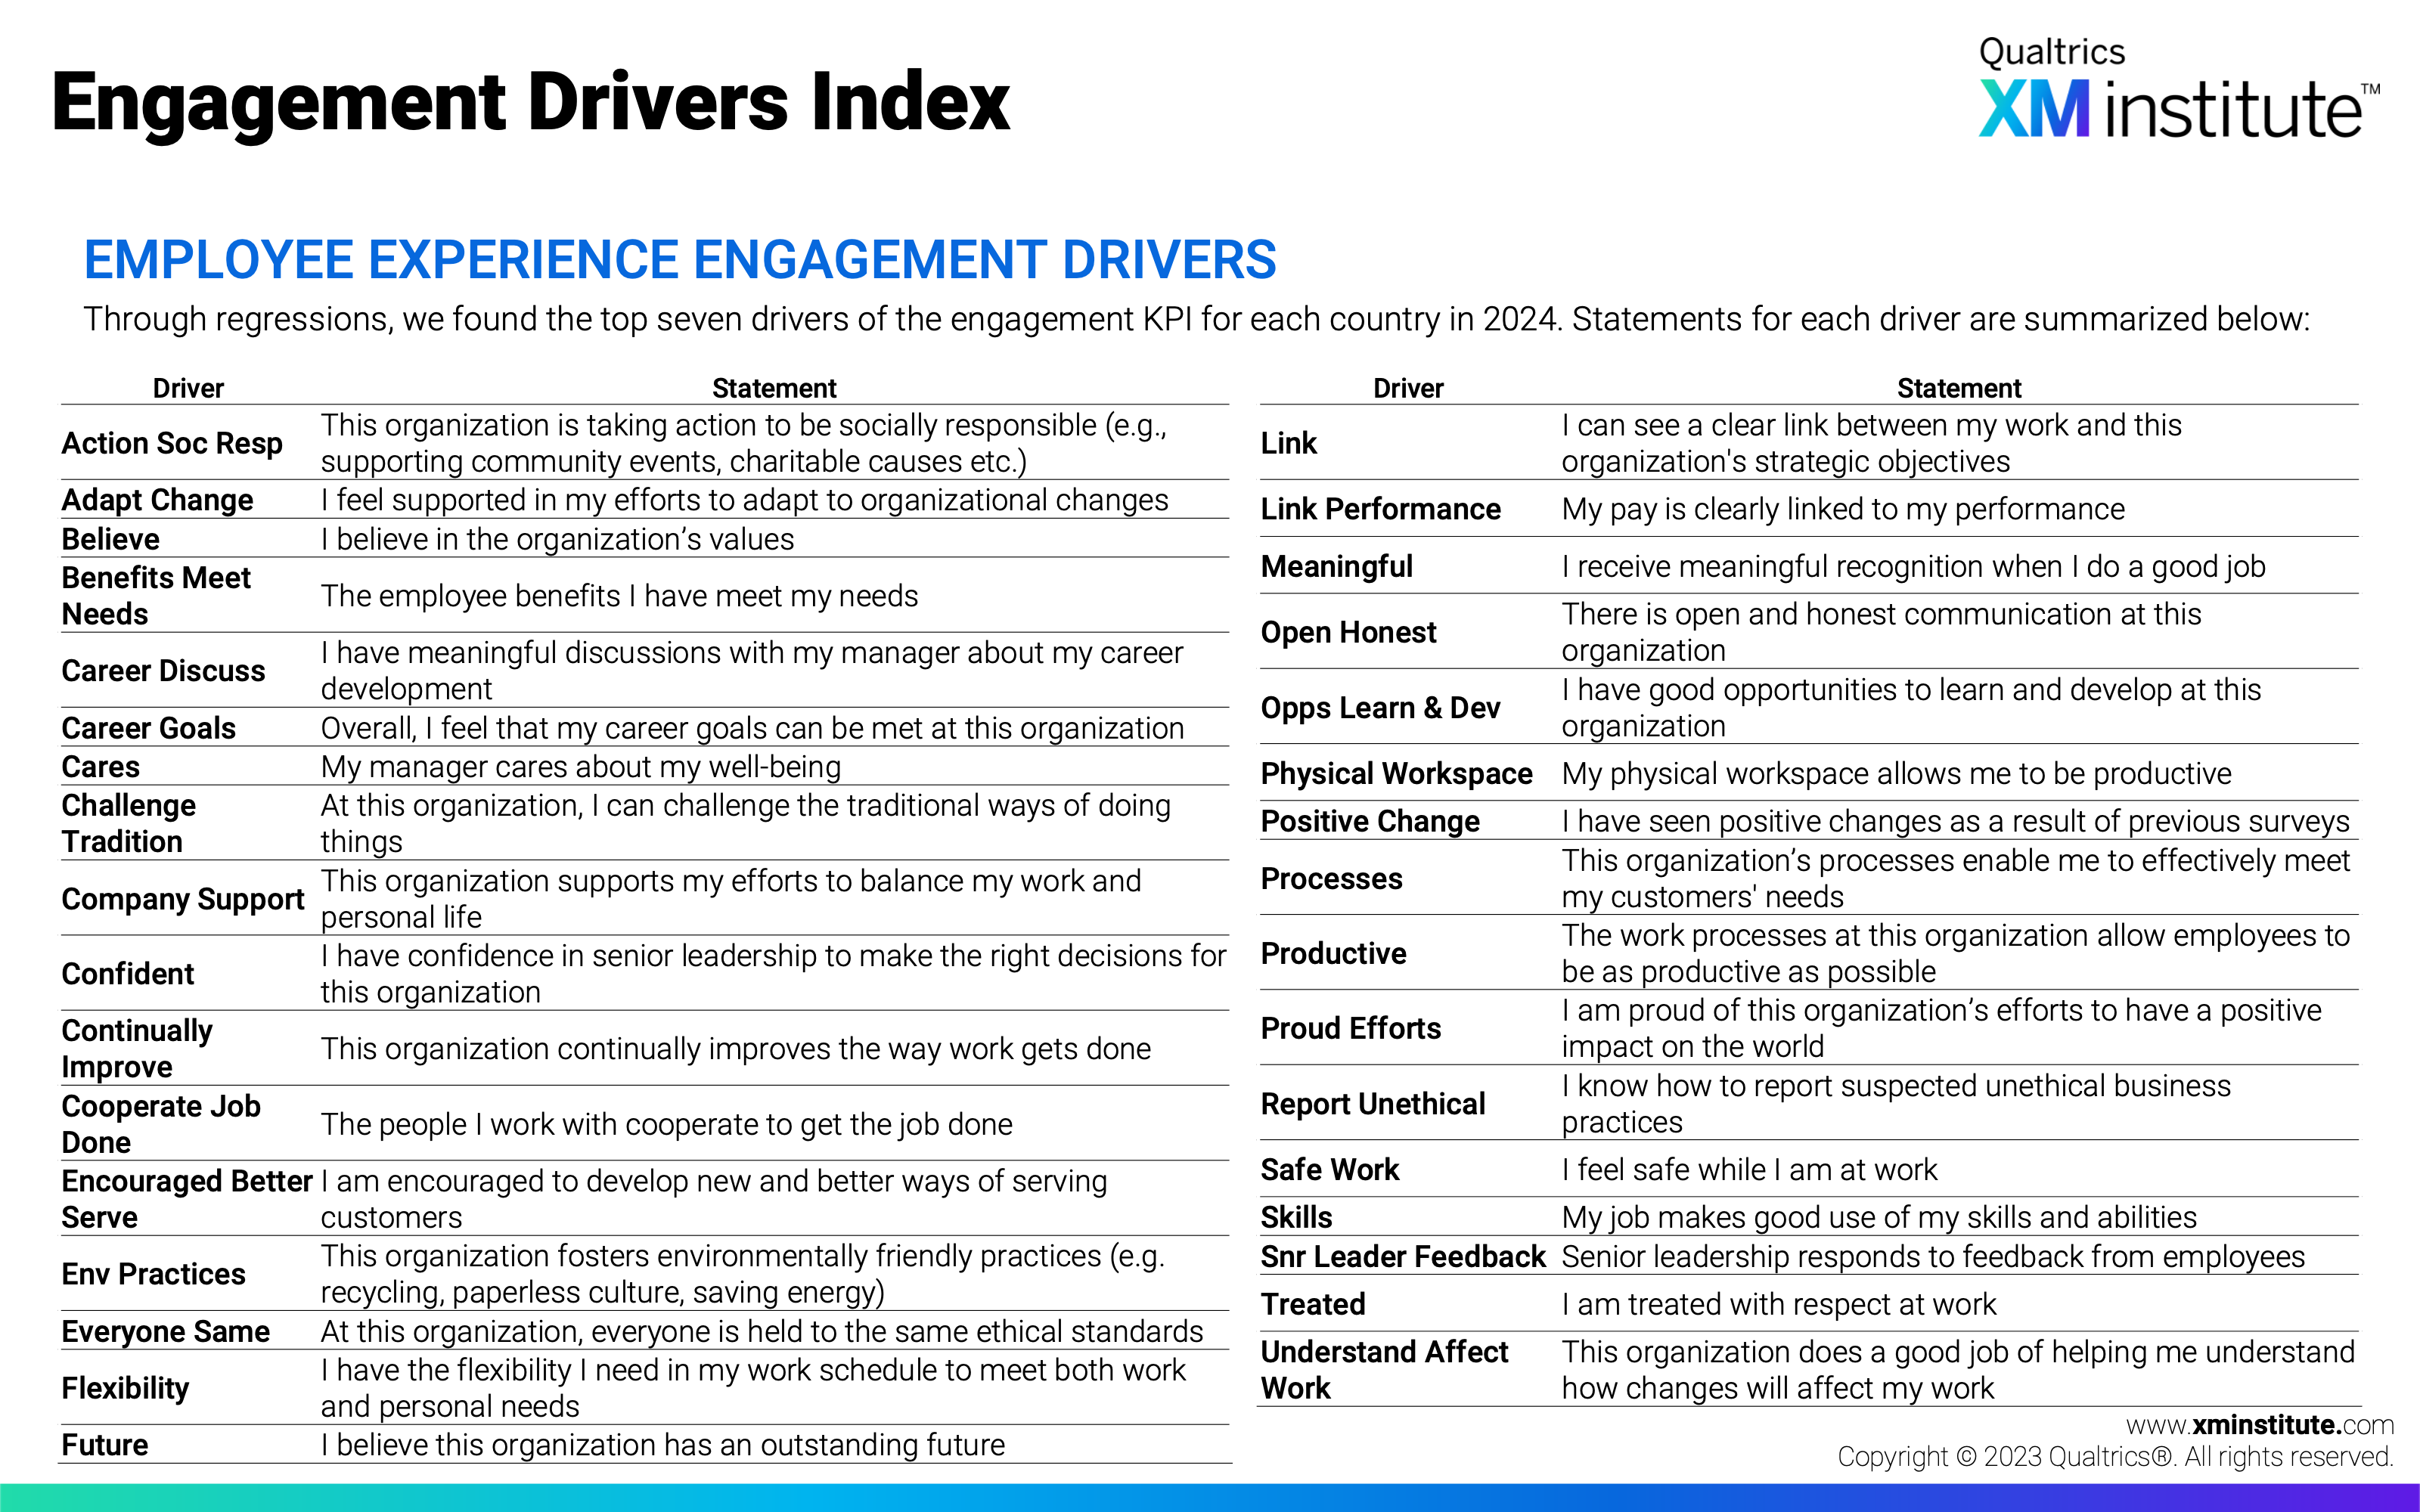
- Engagement Drivers Index (see Figure 20)
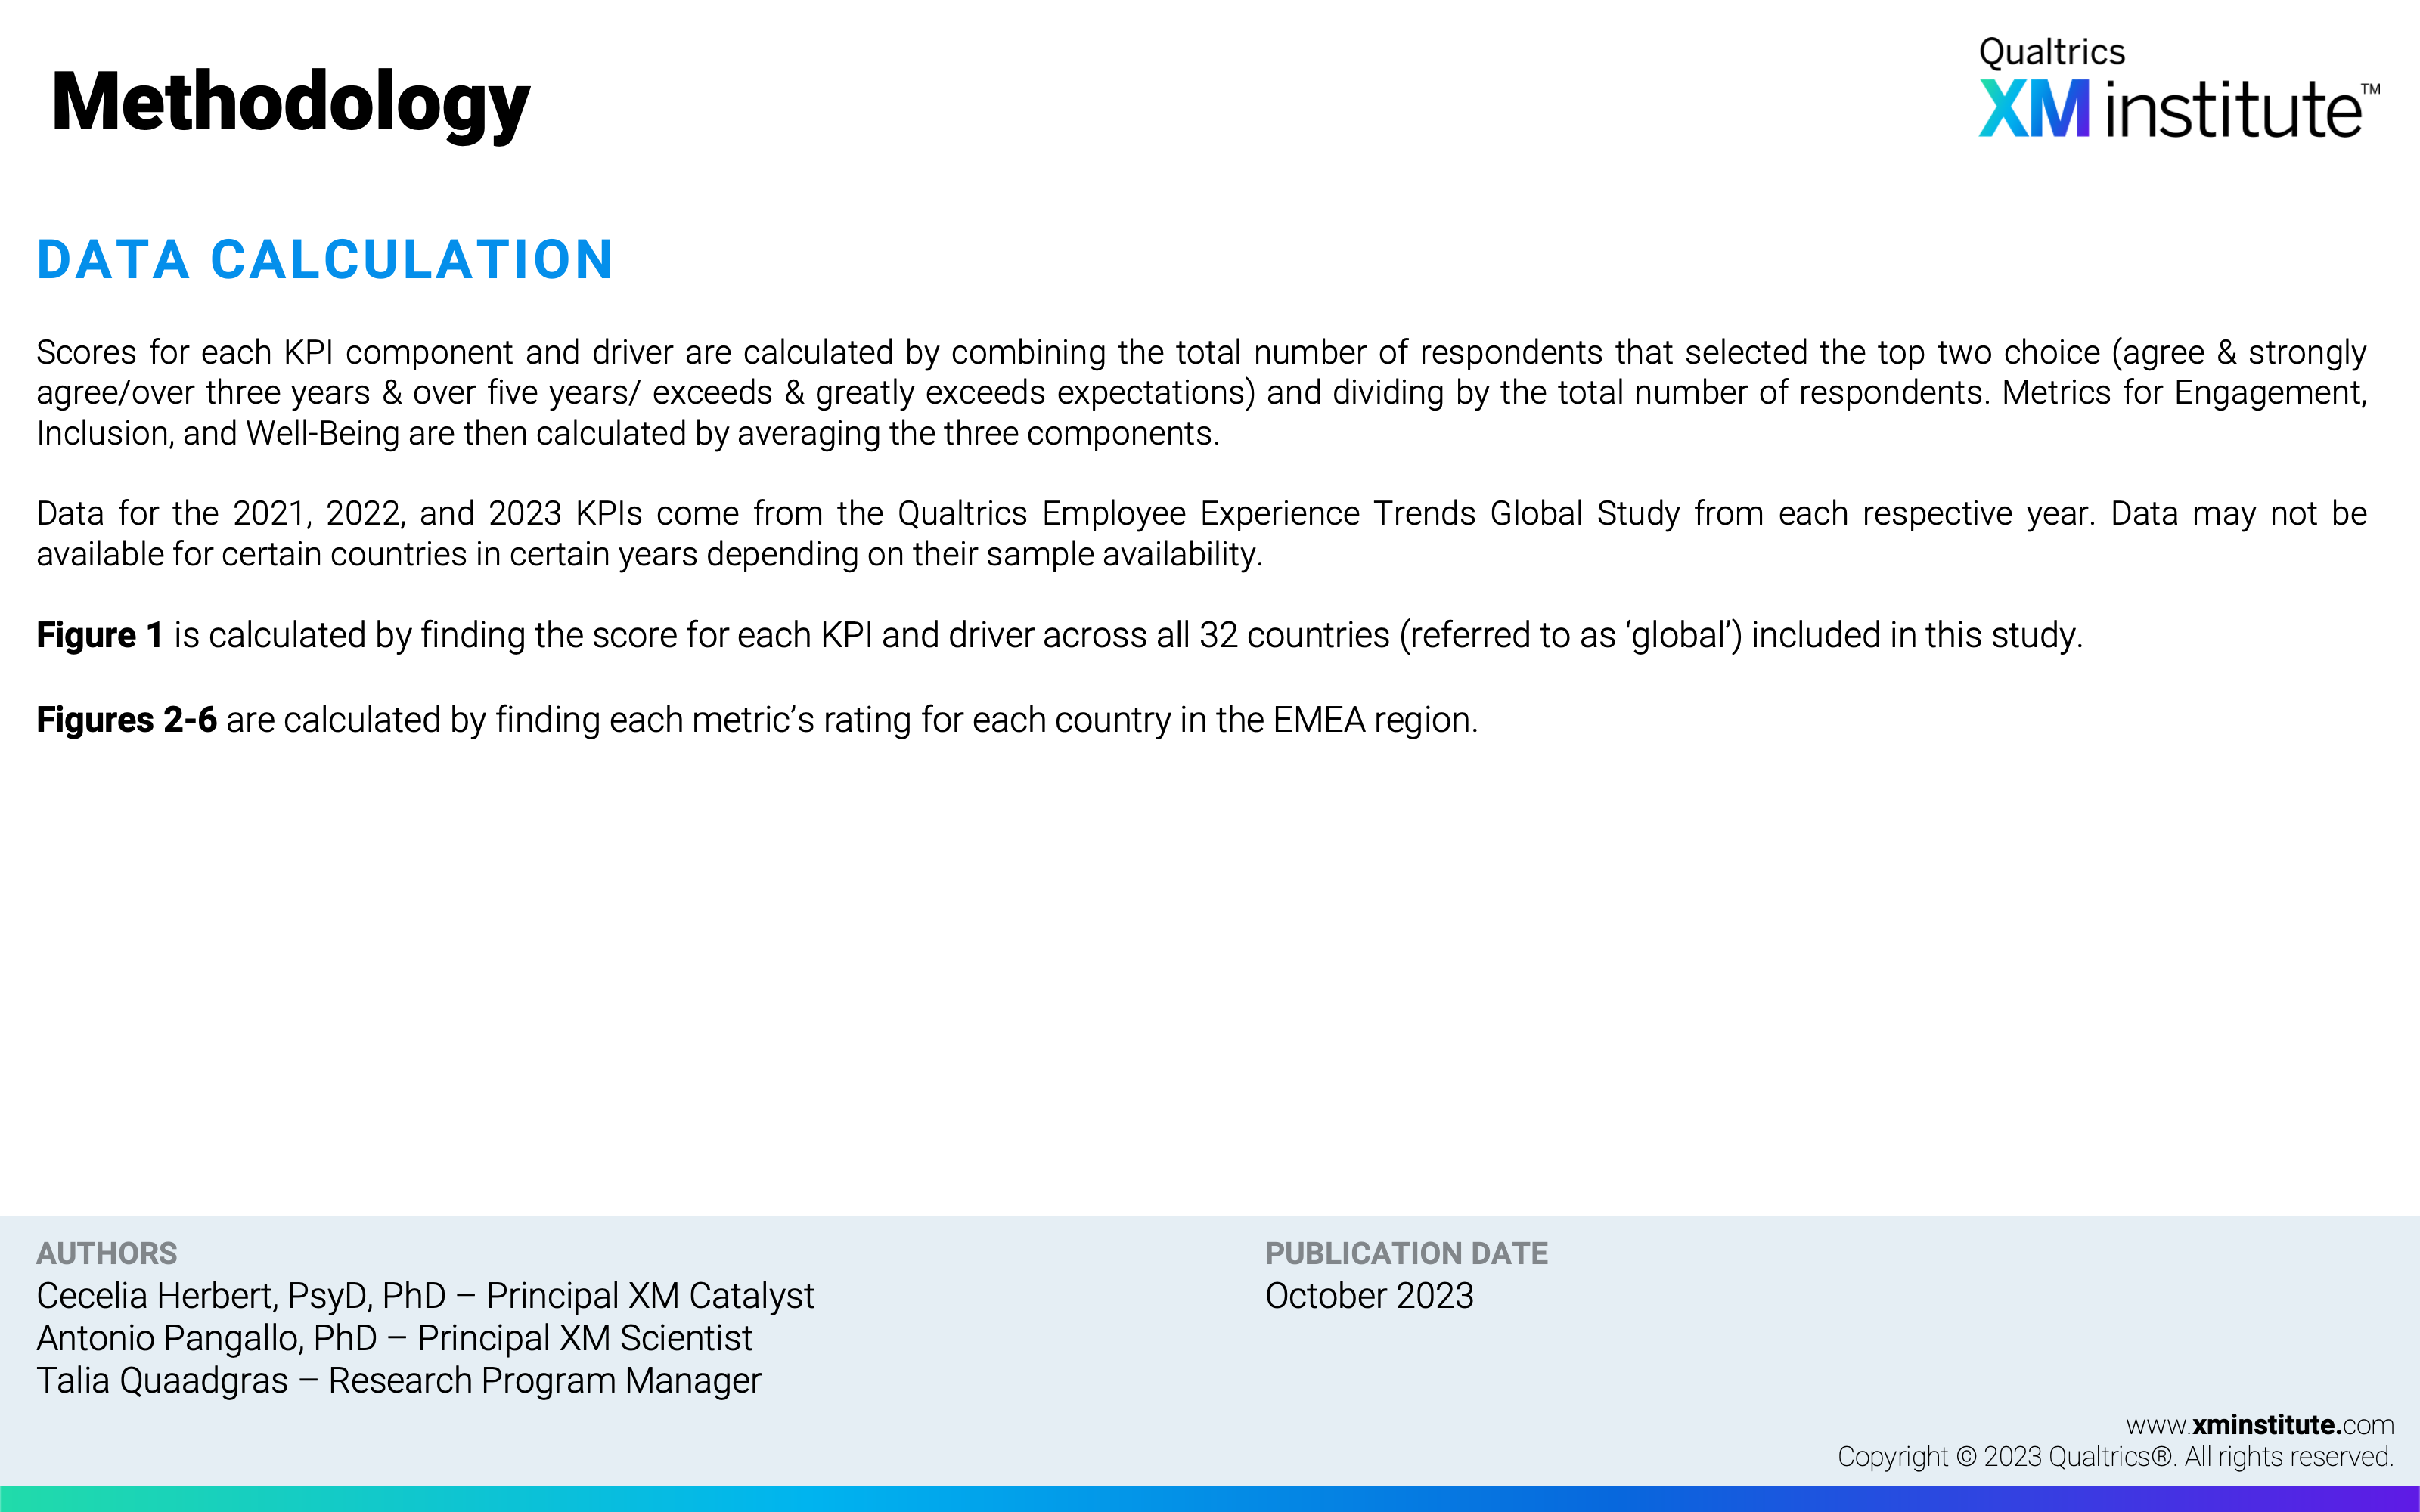
- Methodology (see Figure 21)