Key Findings
As part of the Qualtrics 2025 Employee Experience Trends Study, employees from 23 countries/regions rated their current experience at work across several components. From their responses, we analyzed the five employee experience (EX) indicators (Engagement, Inclusion, Well-Being, Intent to Stay, and Experience v Expectations) and how they have changed between 2021 and 2024. We also conducted a regression analysis to identify the top drivers of Engagement in each country. In this report, we share the metrics from EMEA.
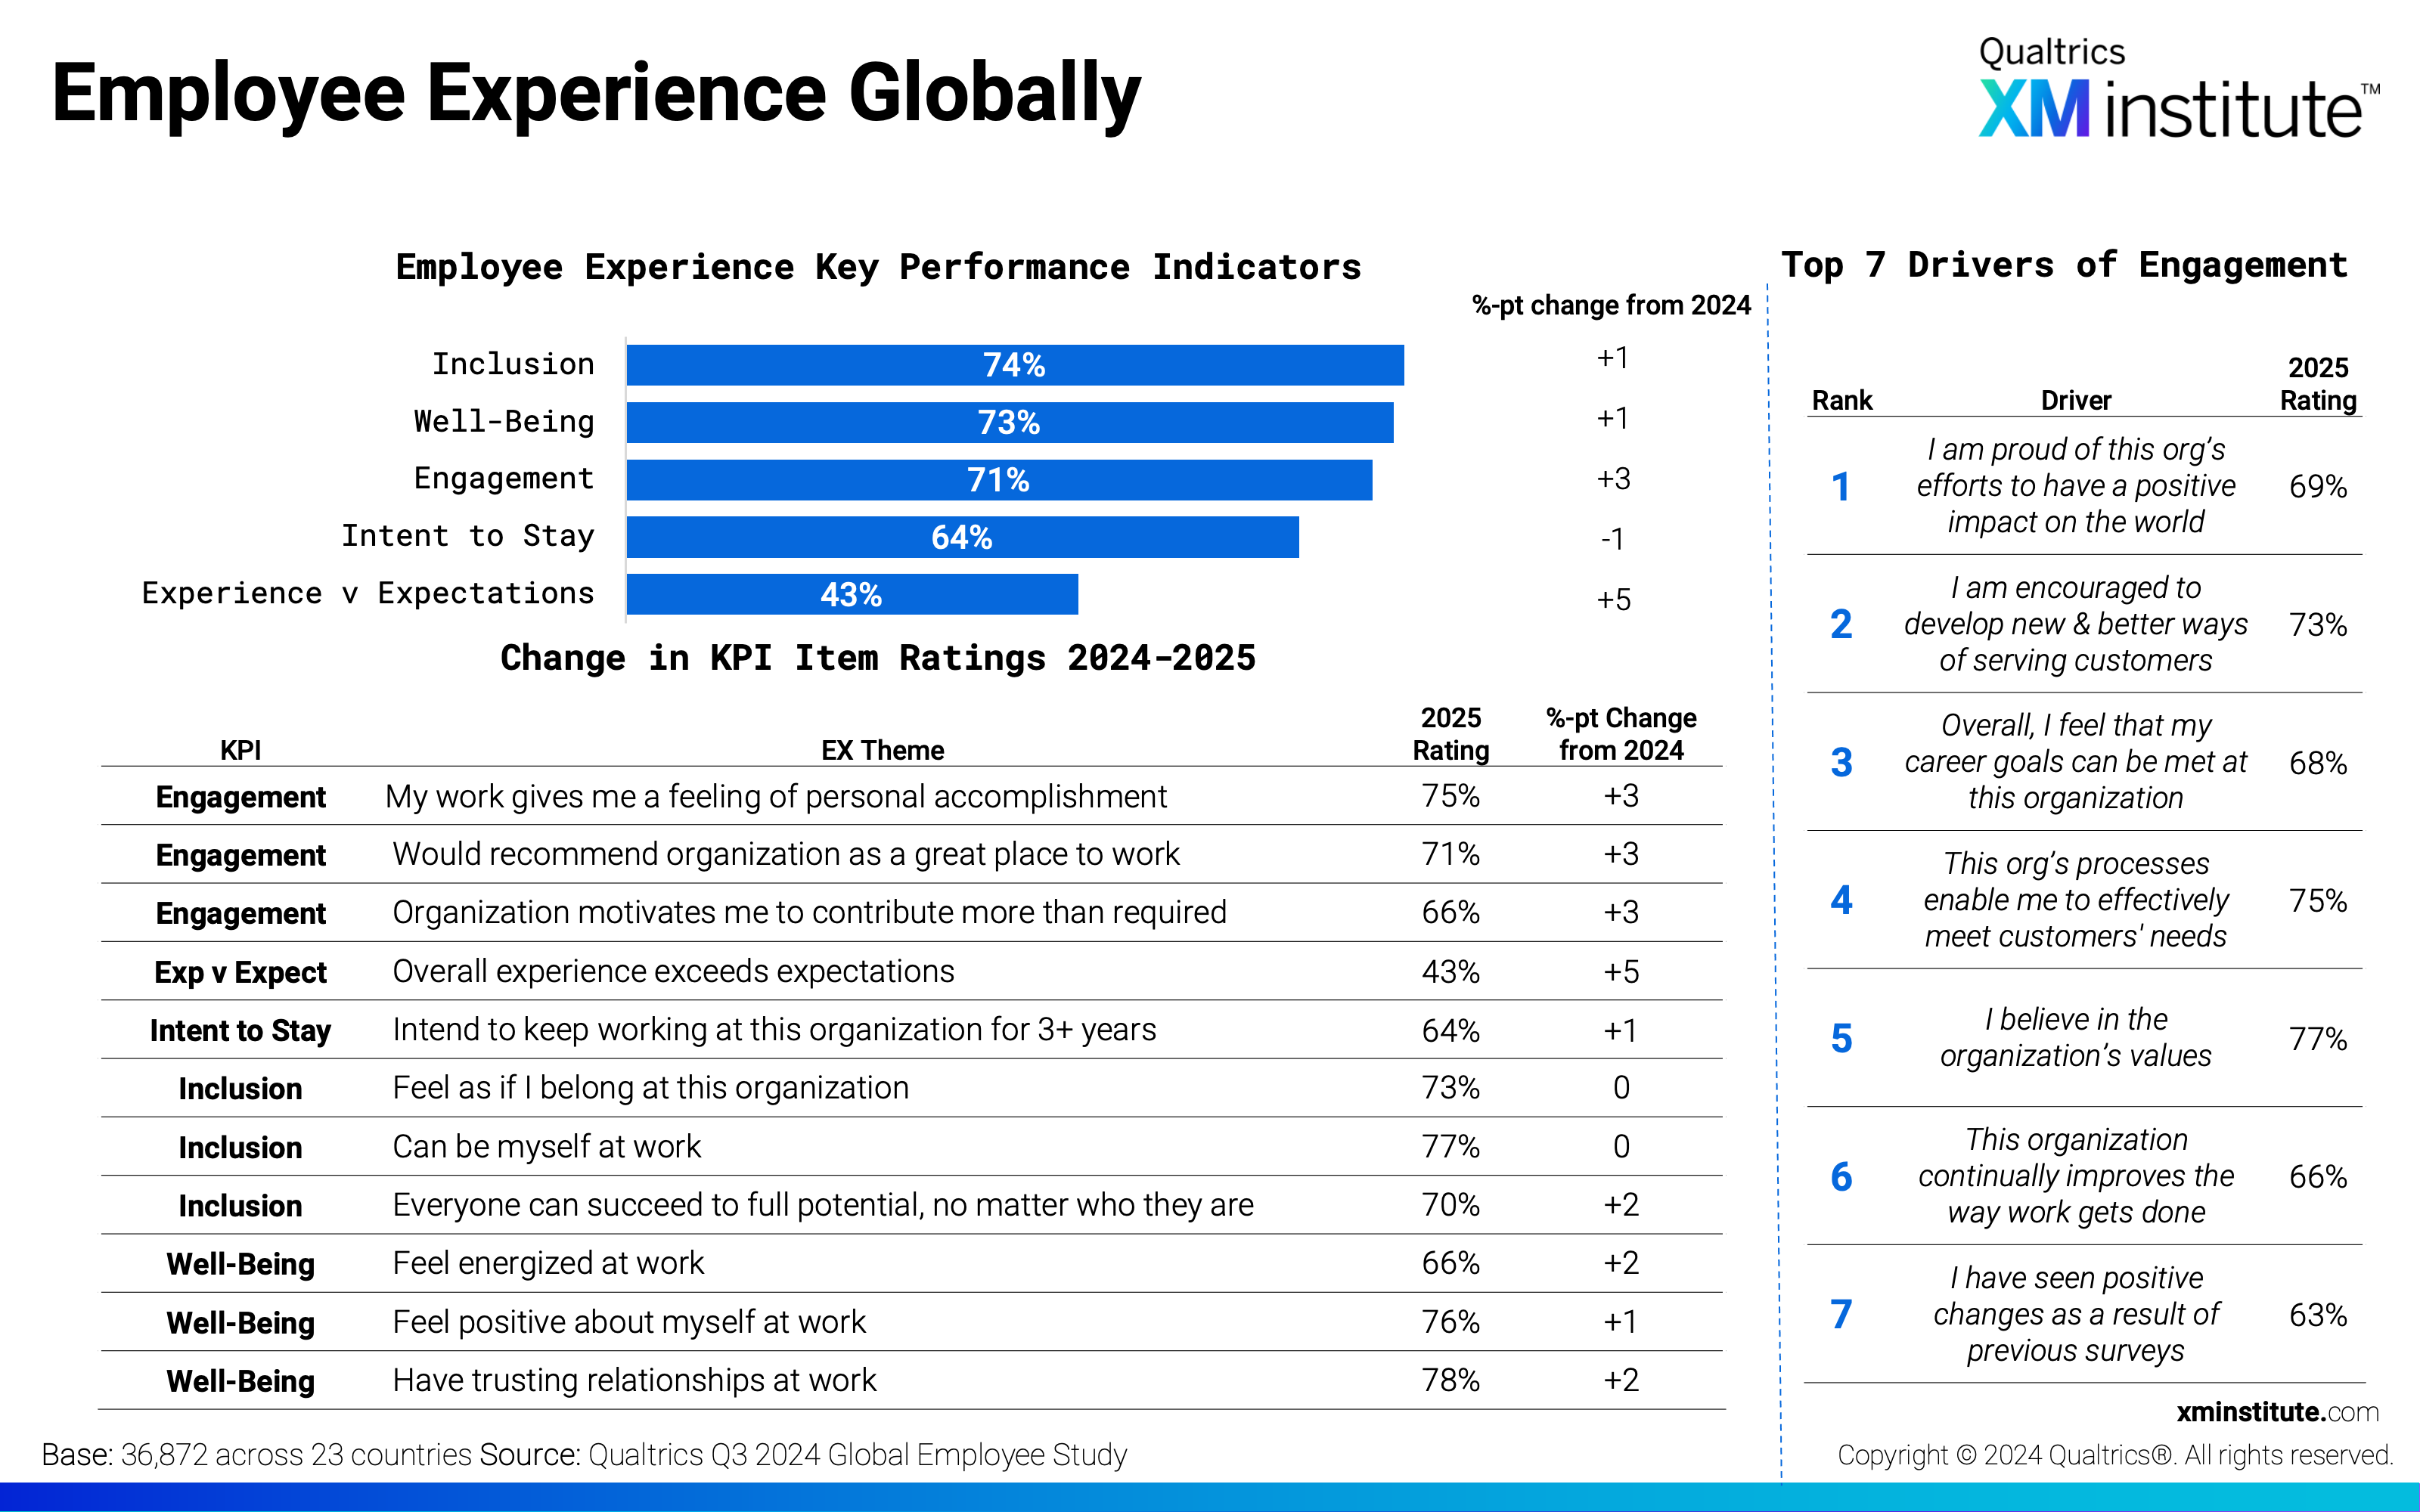
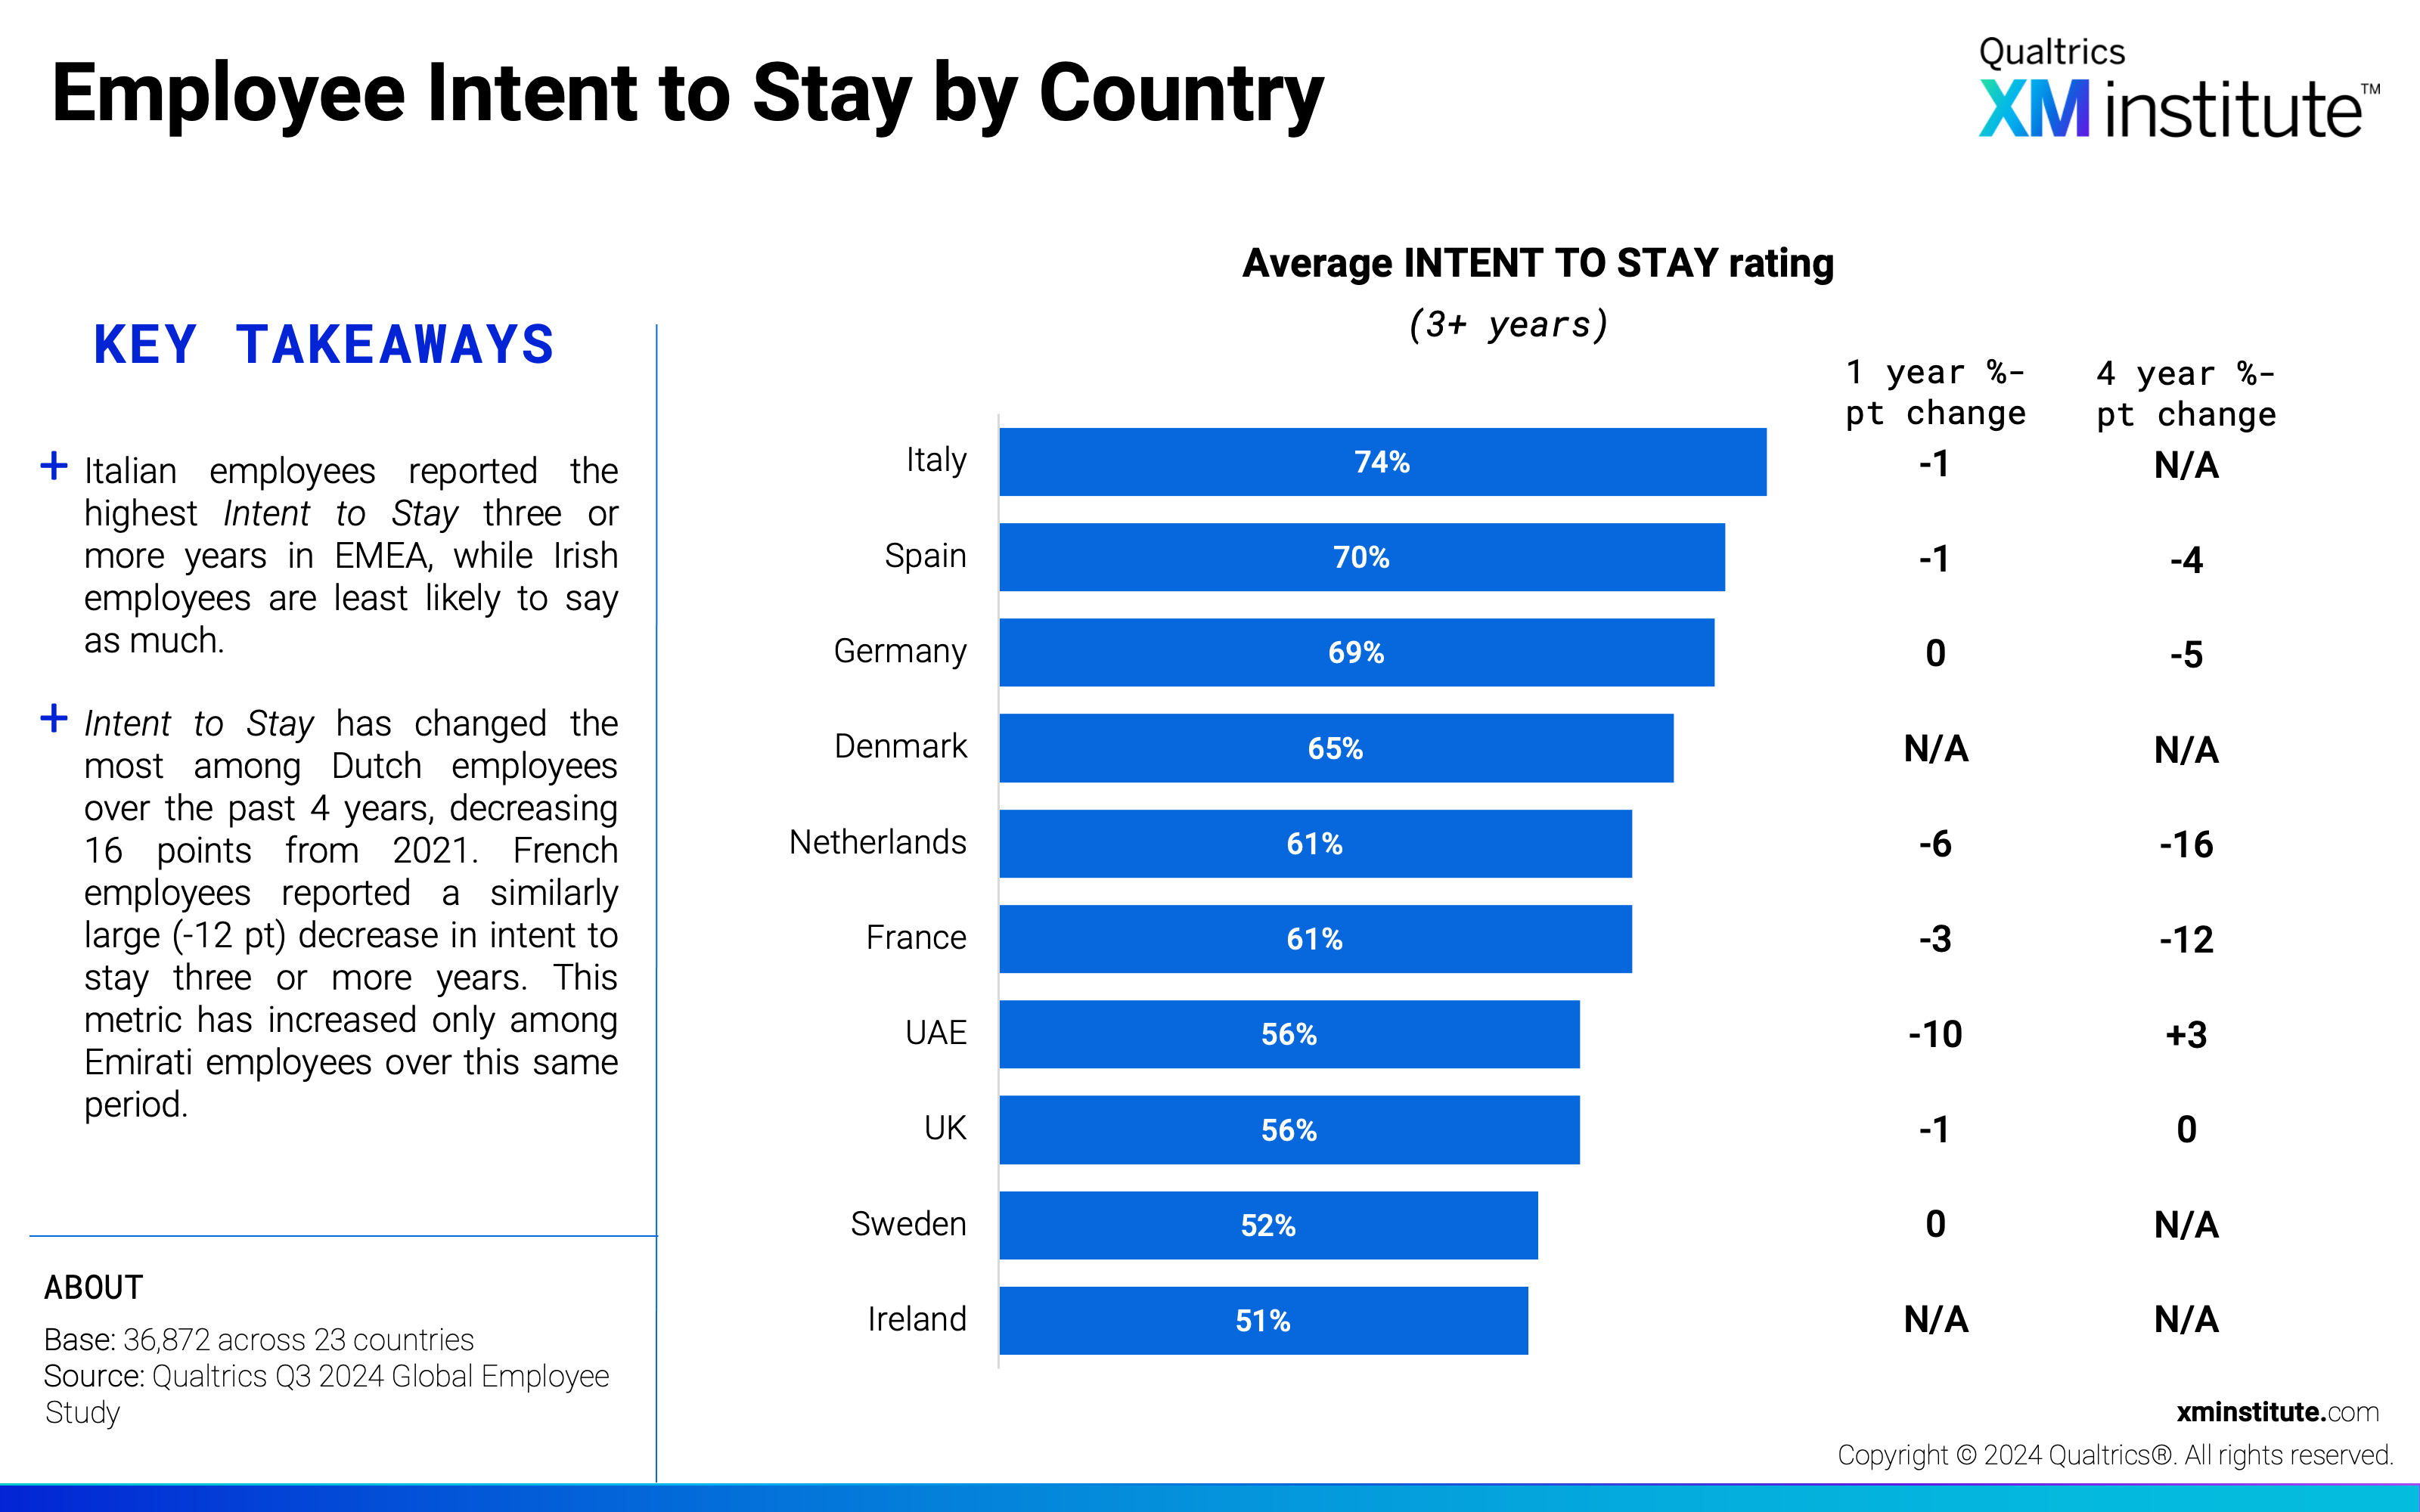
- Intent to Stay in EMEA decreased substantially. From 2024 to 2025, employee Intent to Stay in EMEA has dropped from 66% to 61%, a decrease of 5 points, and a larger change than employees reported globally (-1 pt).
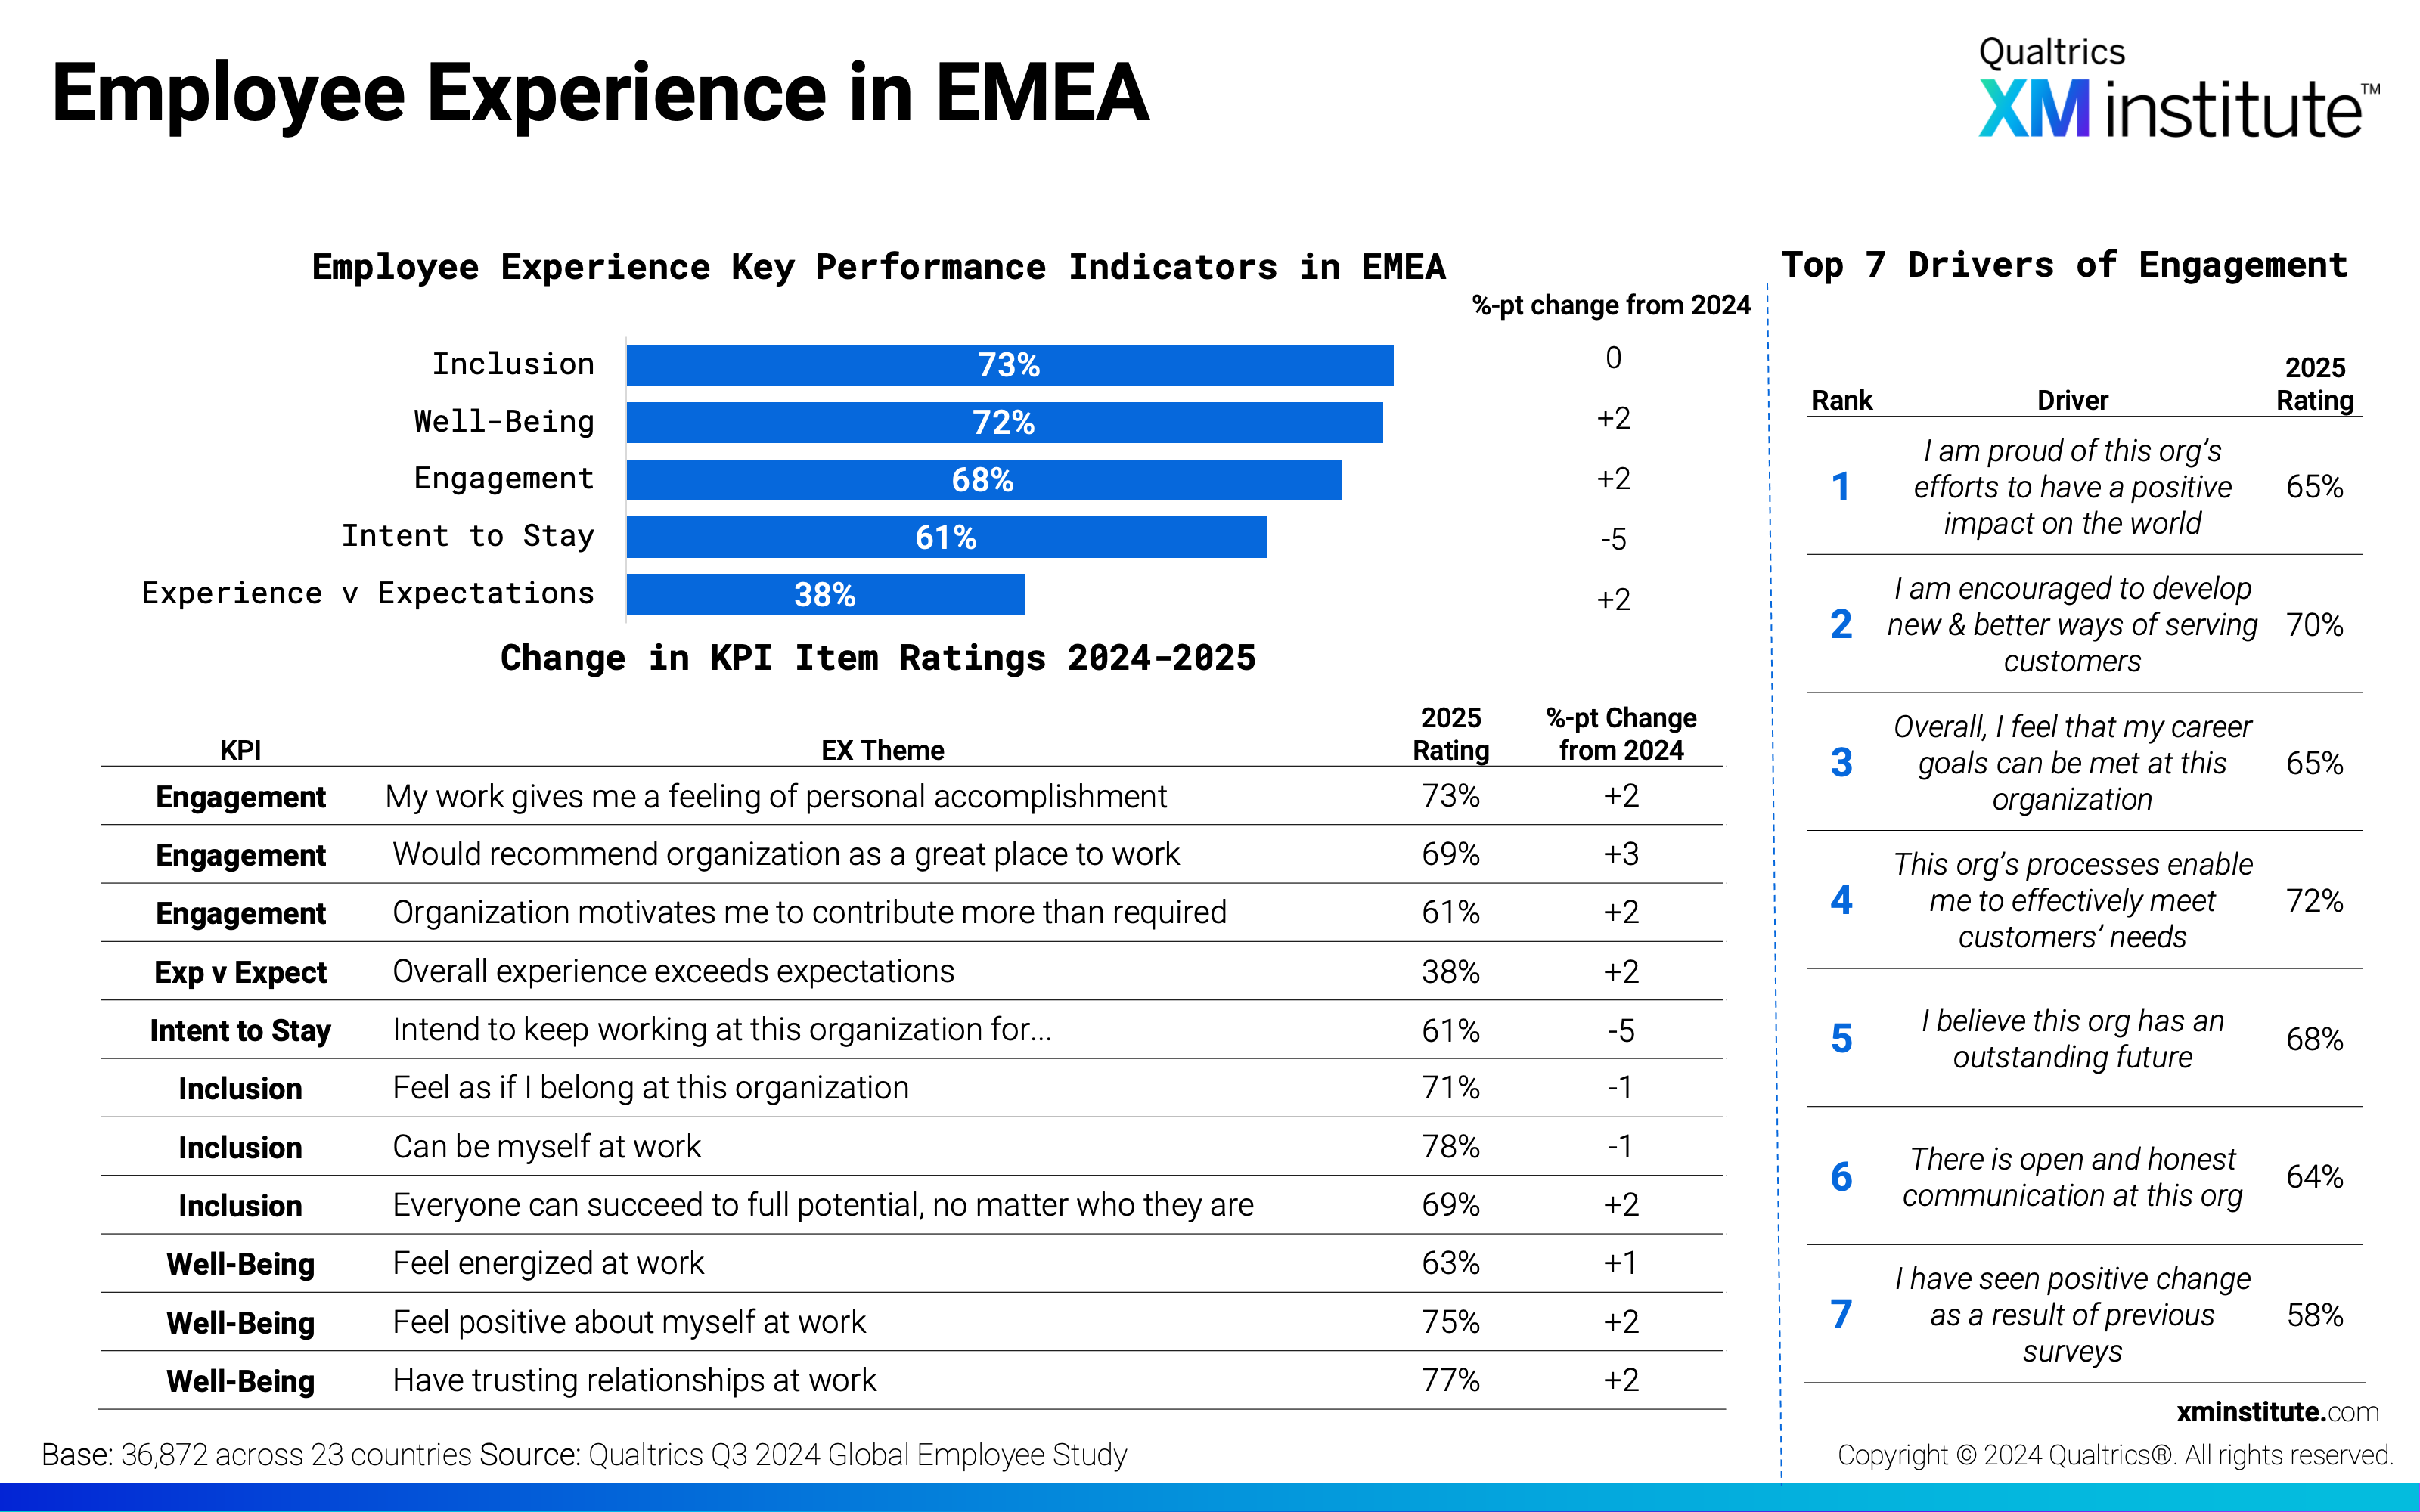
- All other EMEA employee experience KPIs remain steady or improved. Engagement, Well-Being, and Experience v Expectations had the strongest improvement, with an increase of 2 points each. Inclusion remains unchanged, at 73%.
- Company pride is a top driver of engagement. I am proud of this organization’s efforts to have an impact on the world and I believe this company has an outstanding future are top drivers of engagement among employees in EMEA. Customer focus is also a top driver; analysis shows that I am encouraged to come up with new and better ways of serving customers is the second-strongest driver in EMEA, and rates at 70% favorable.
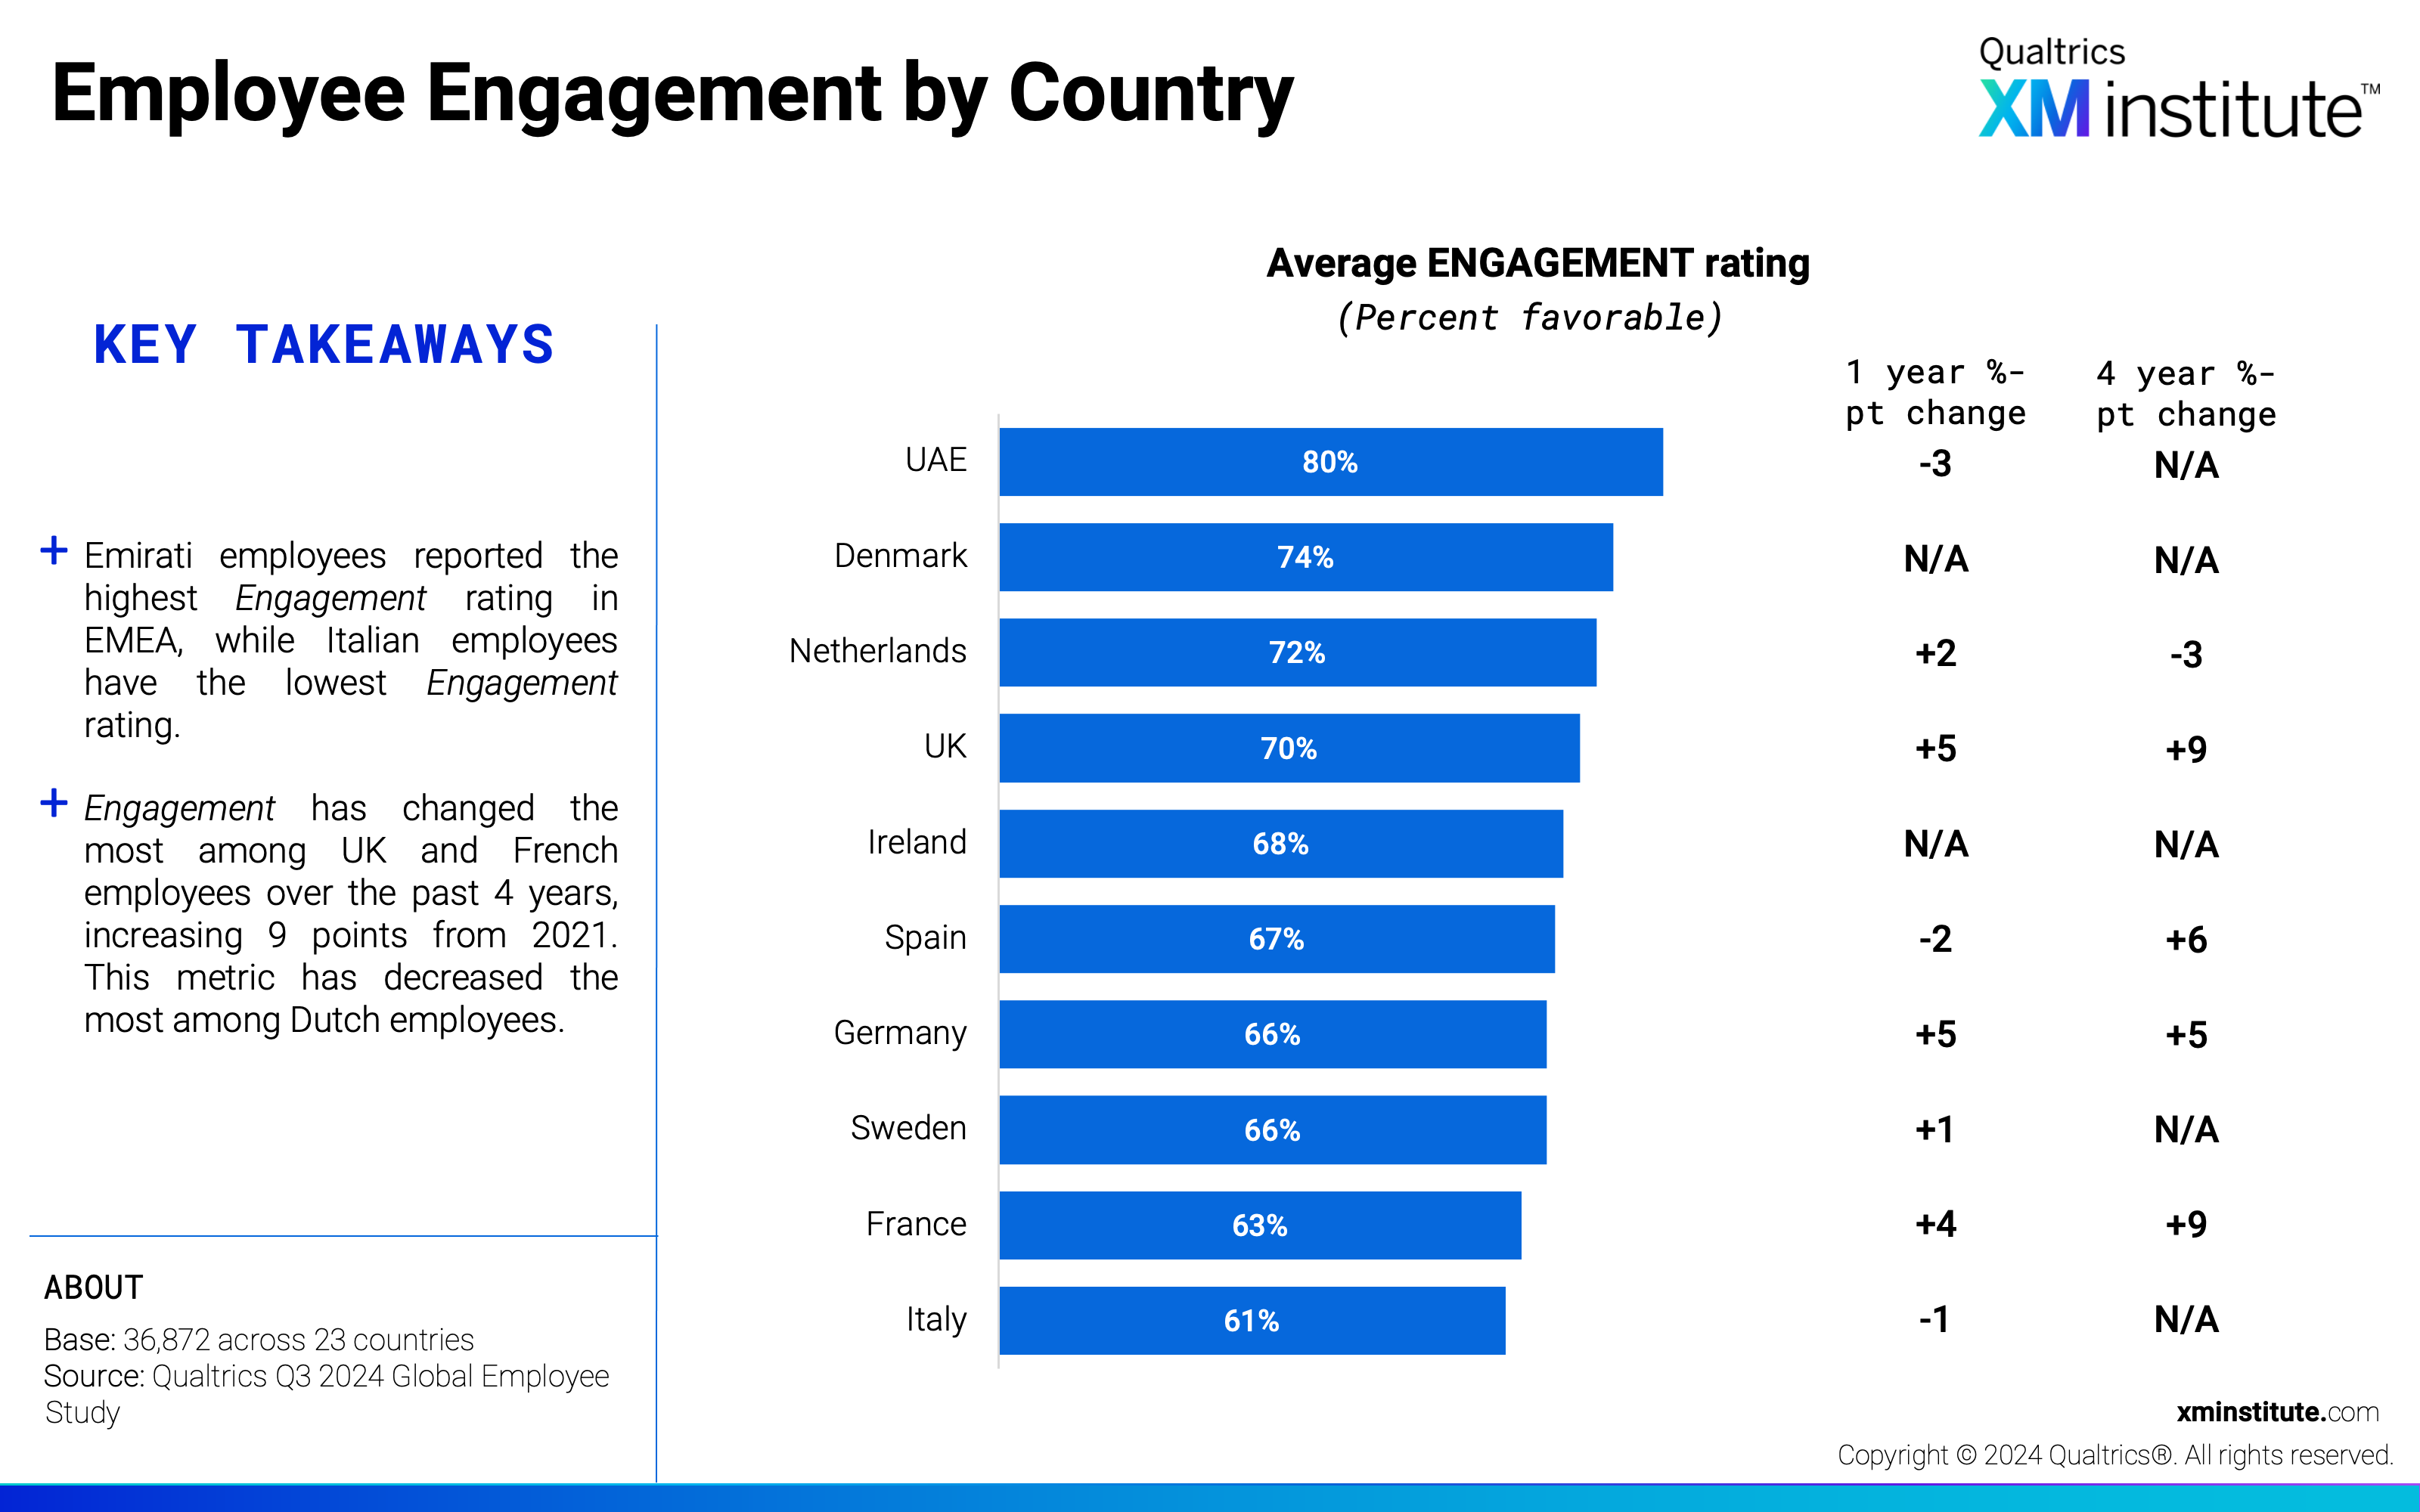
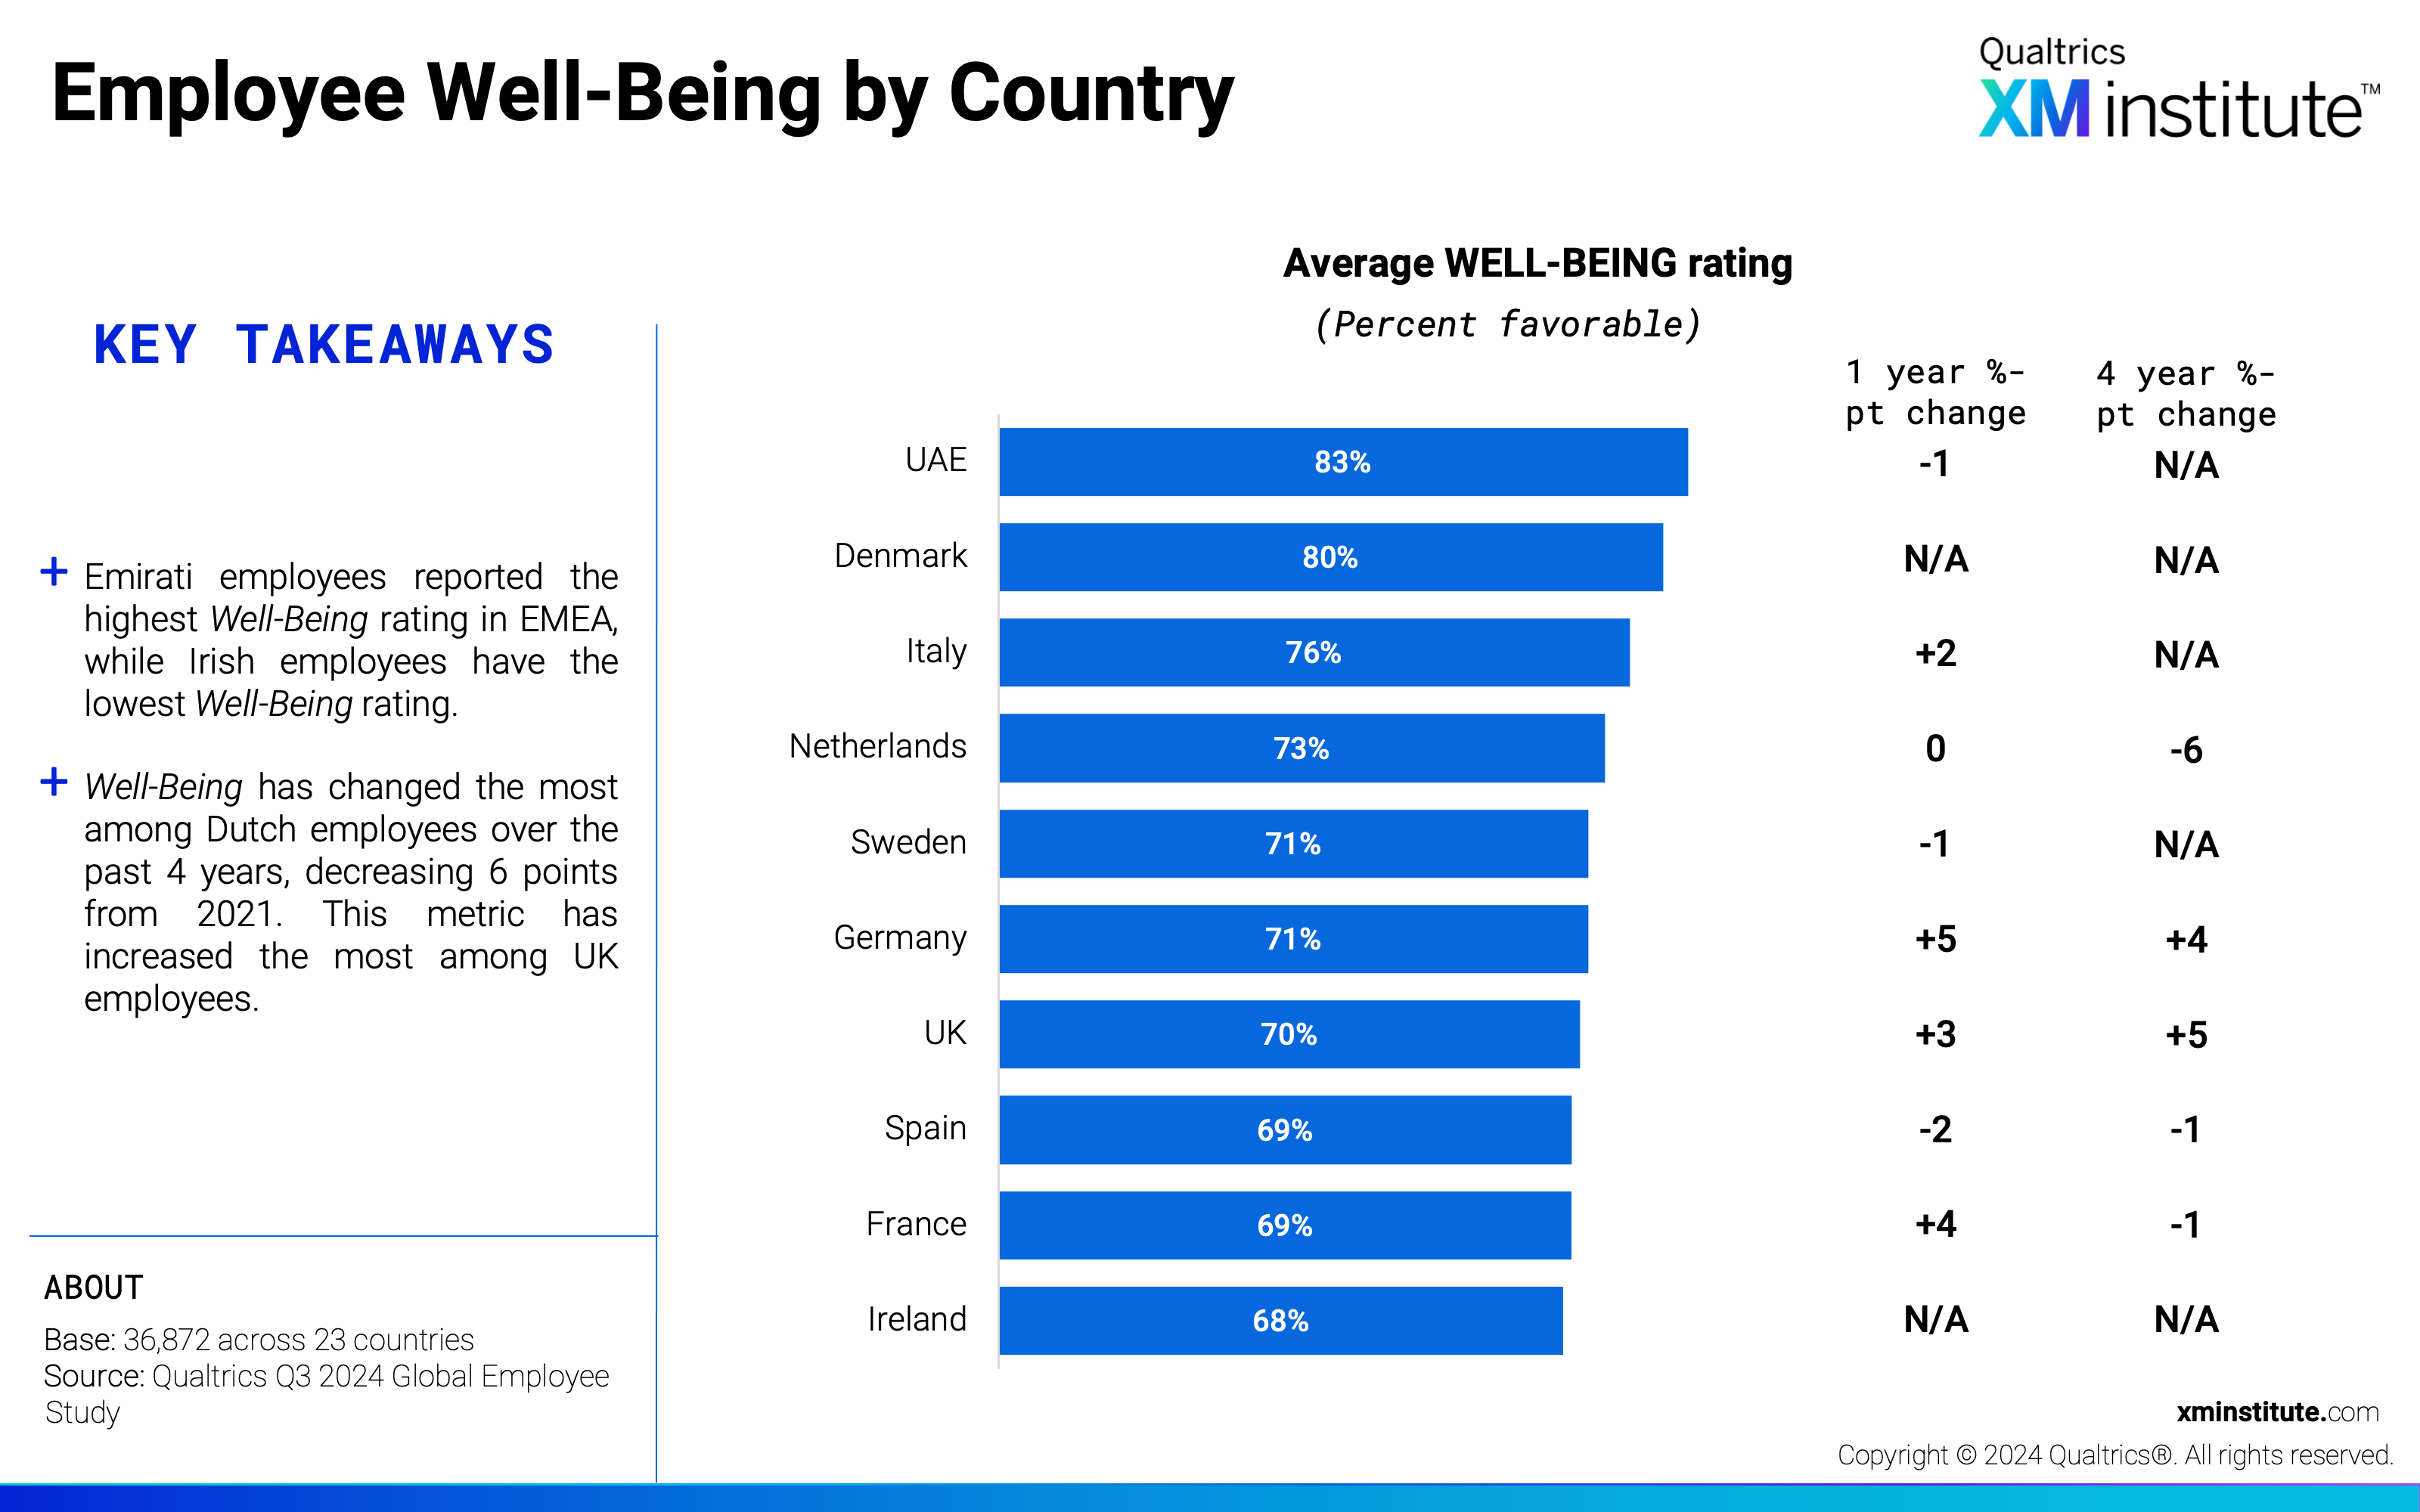
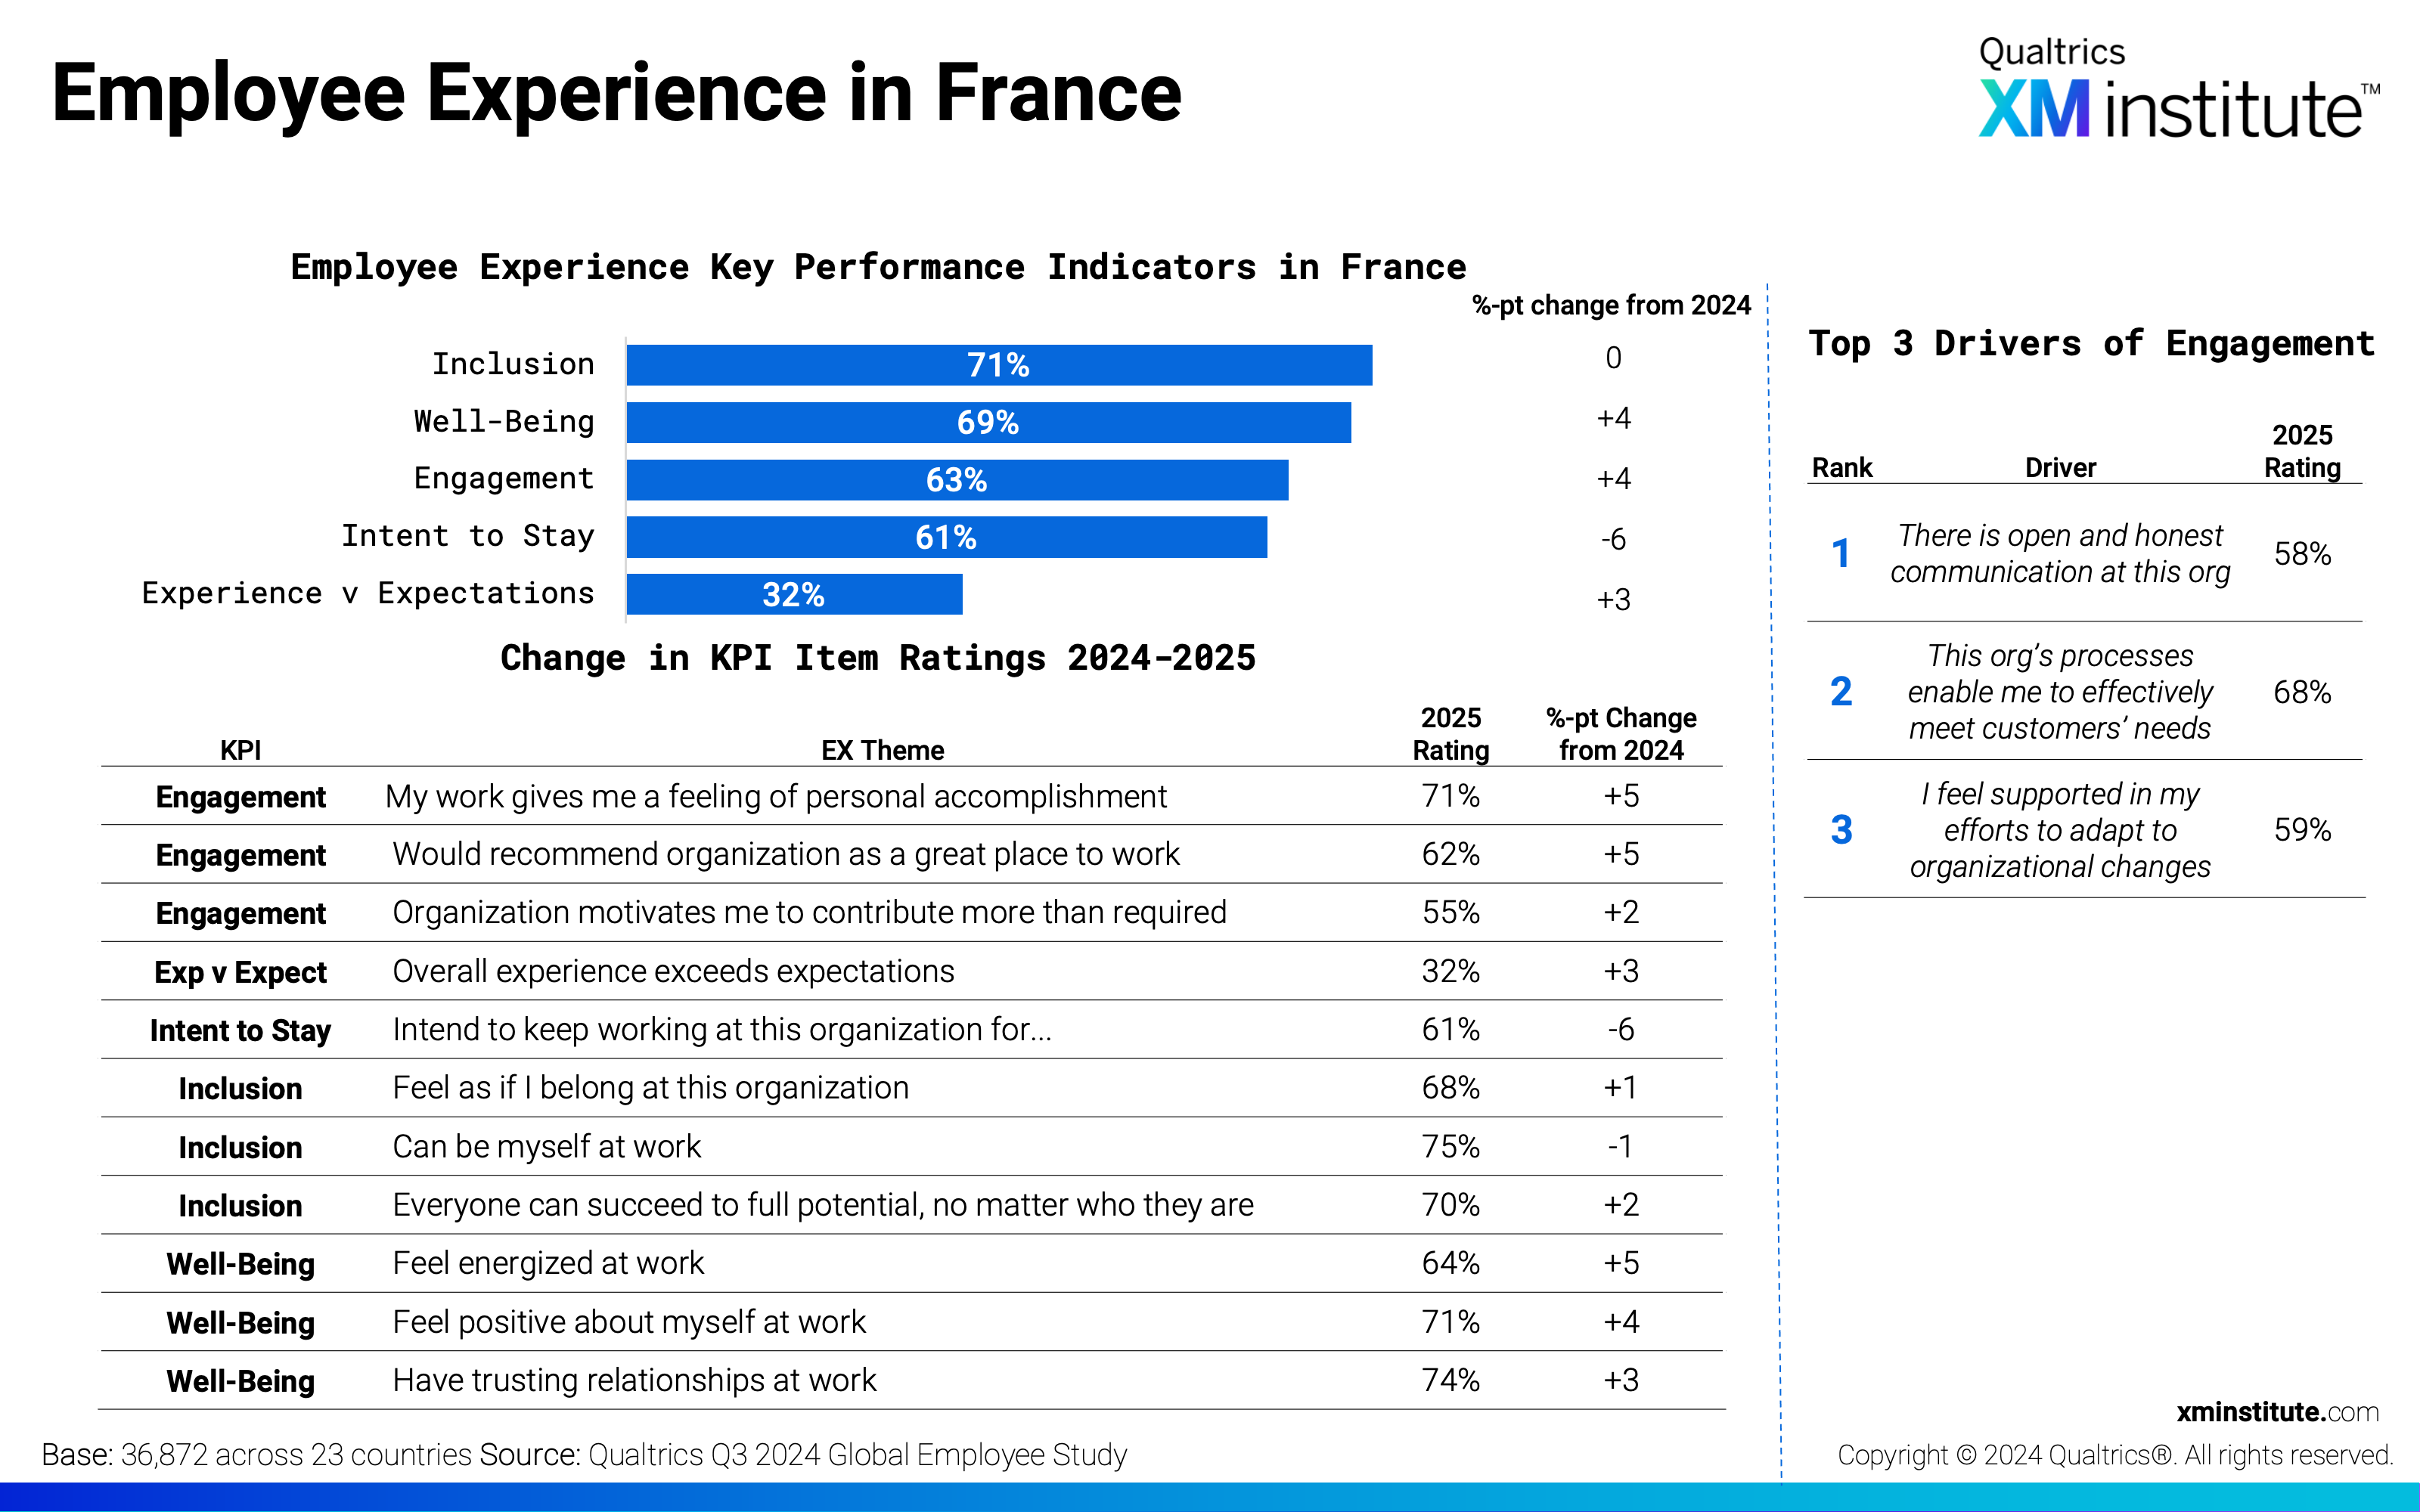
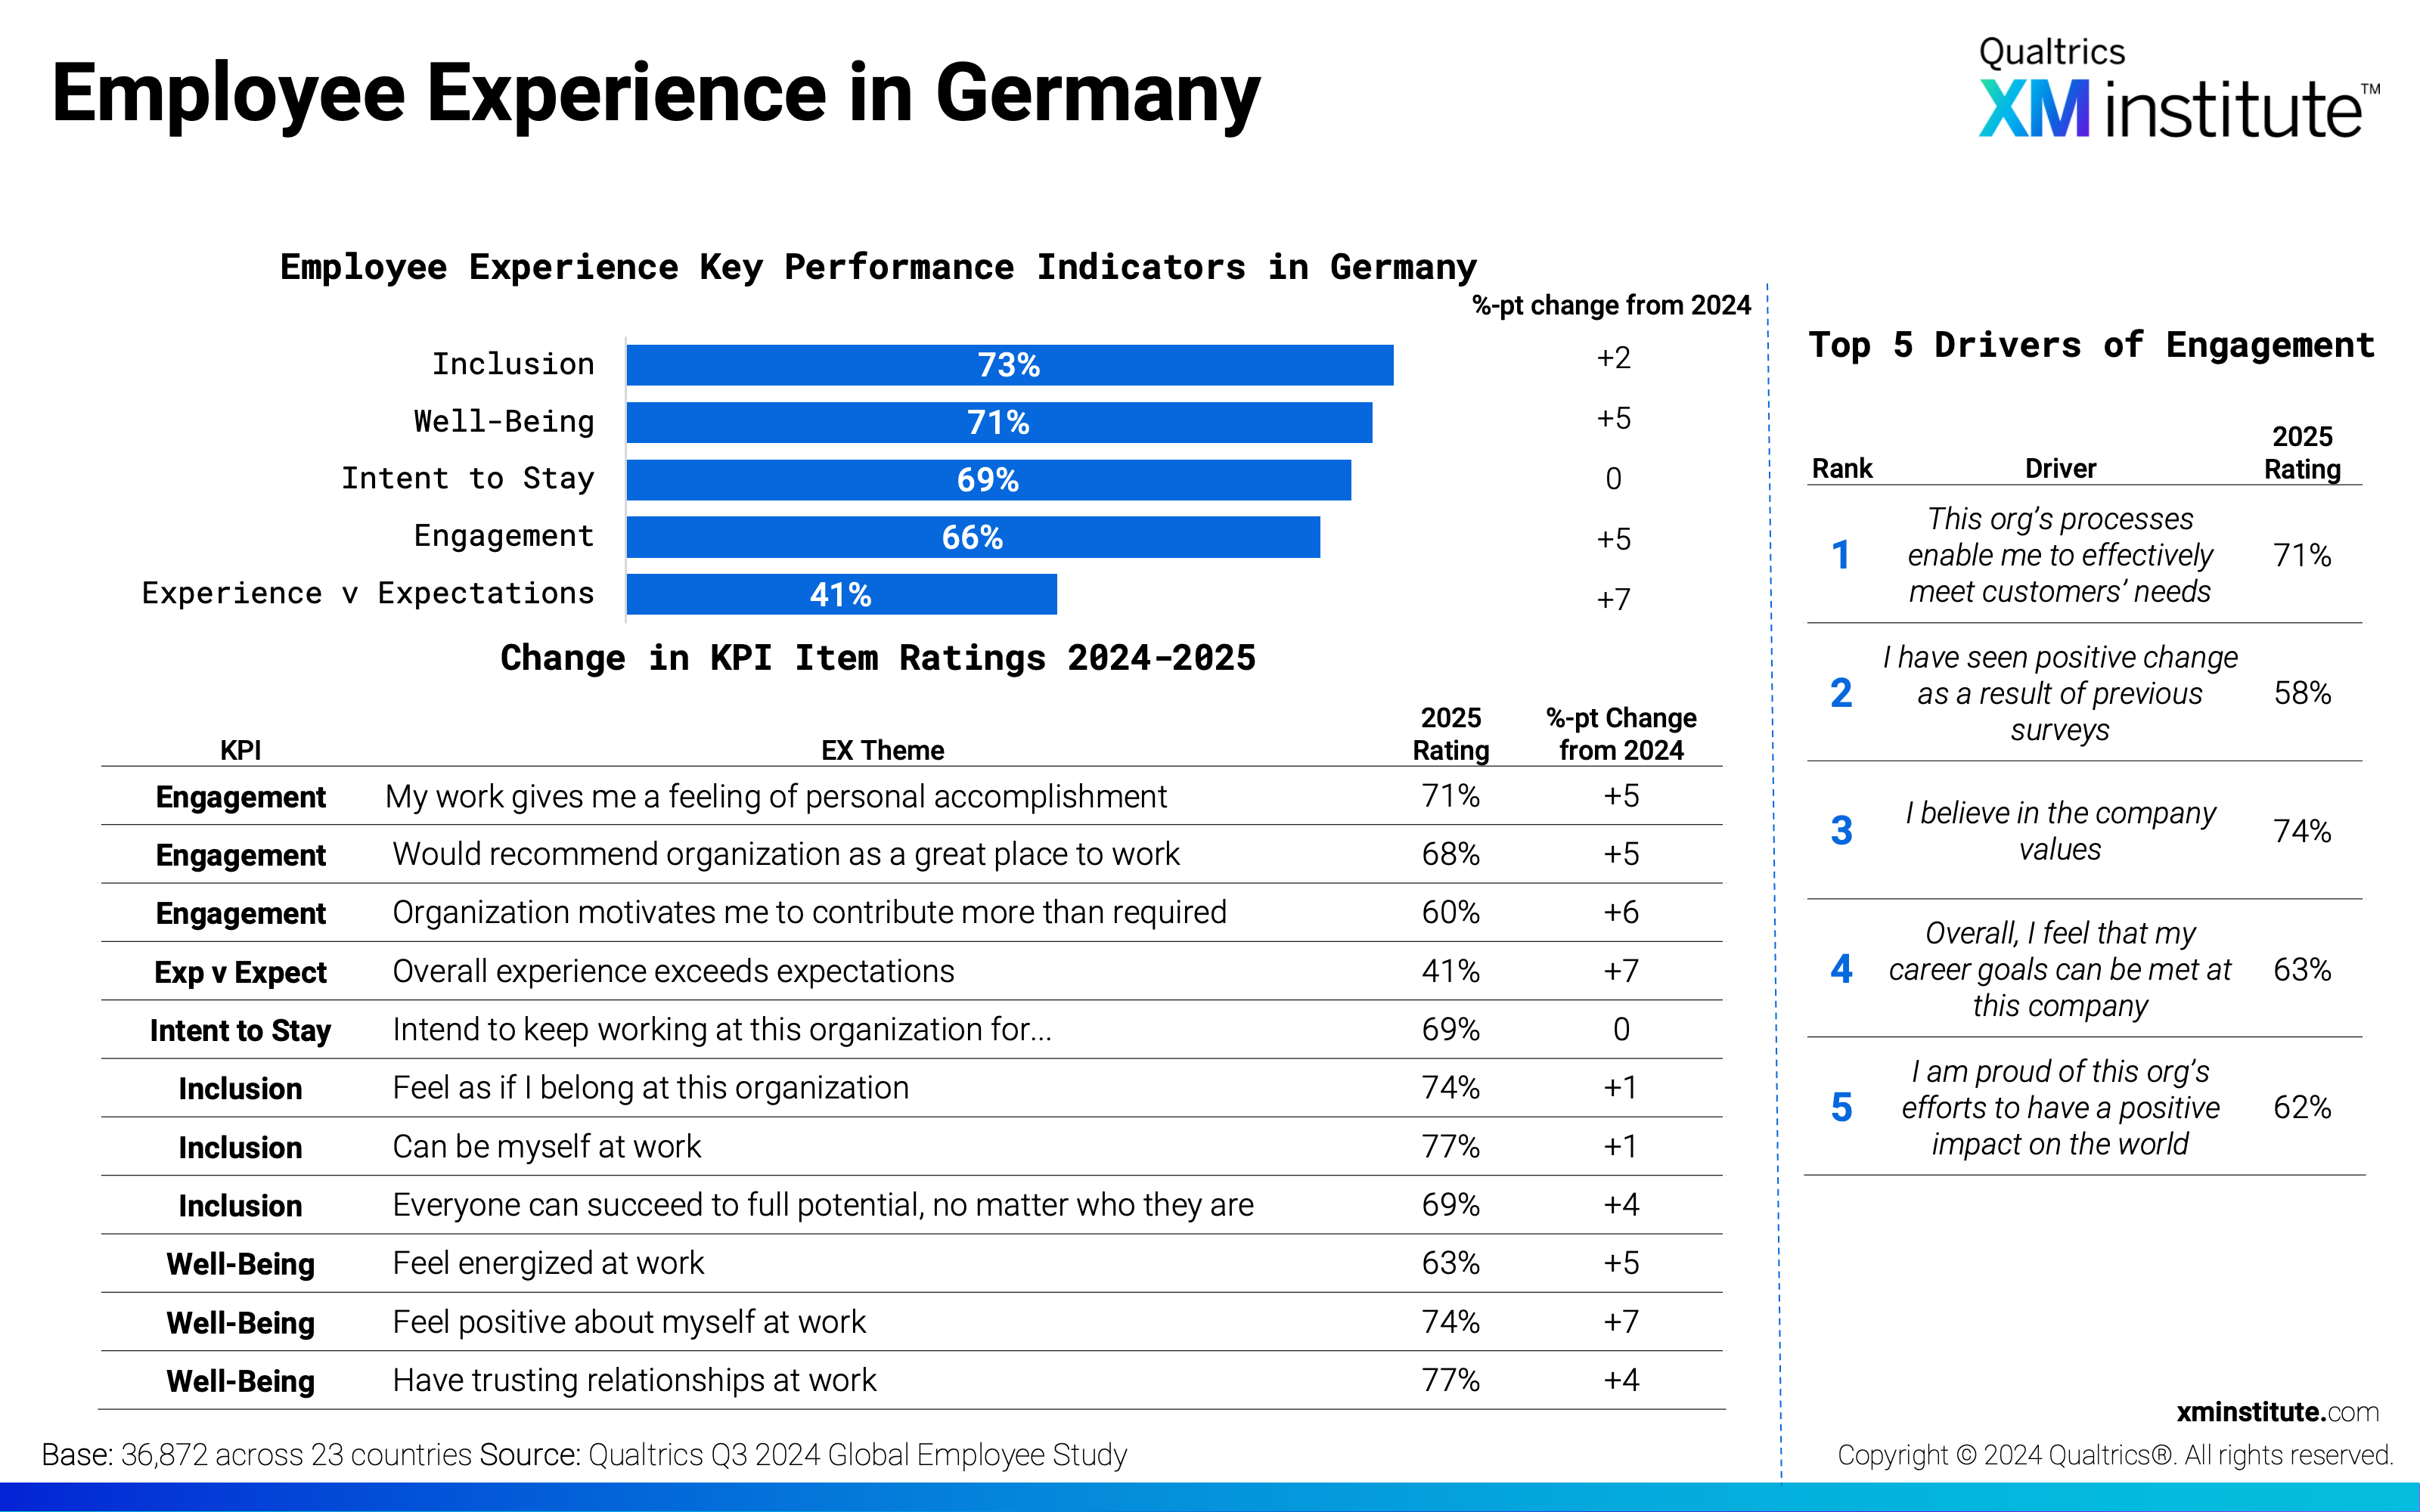
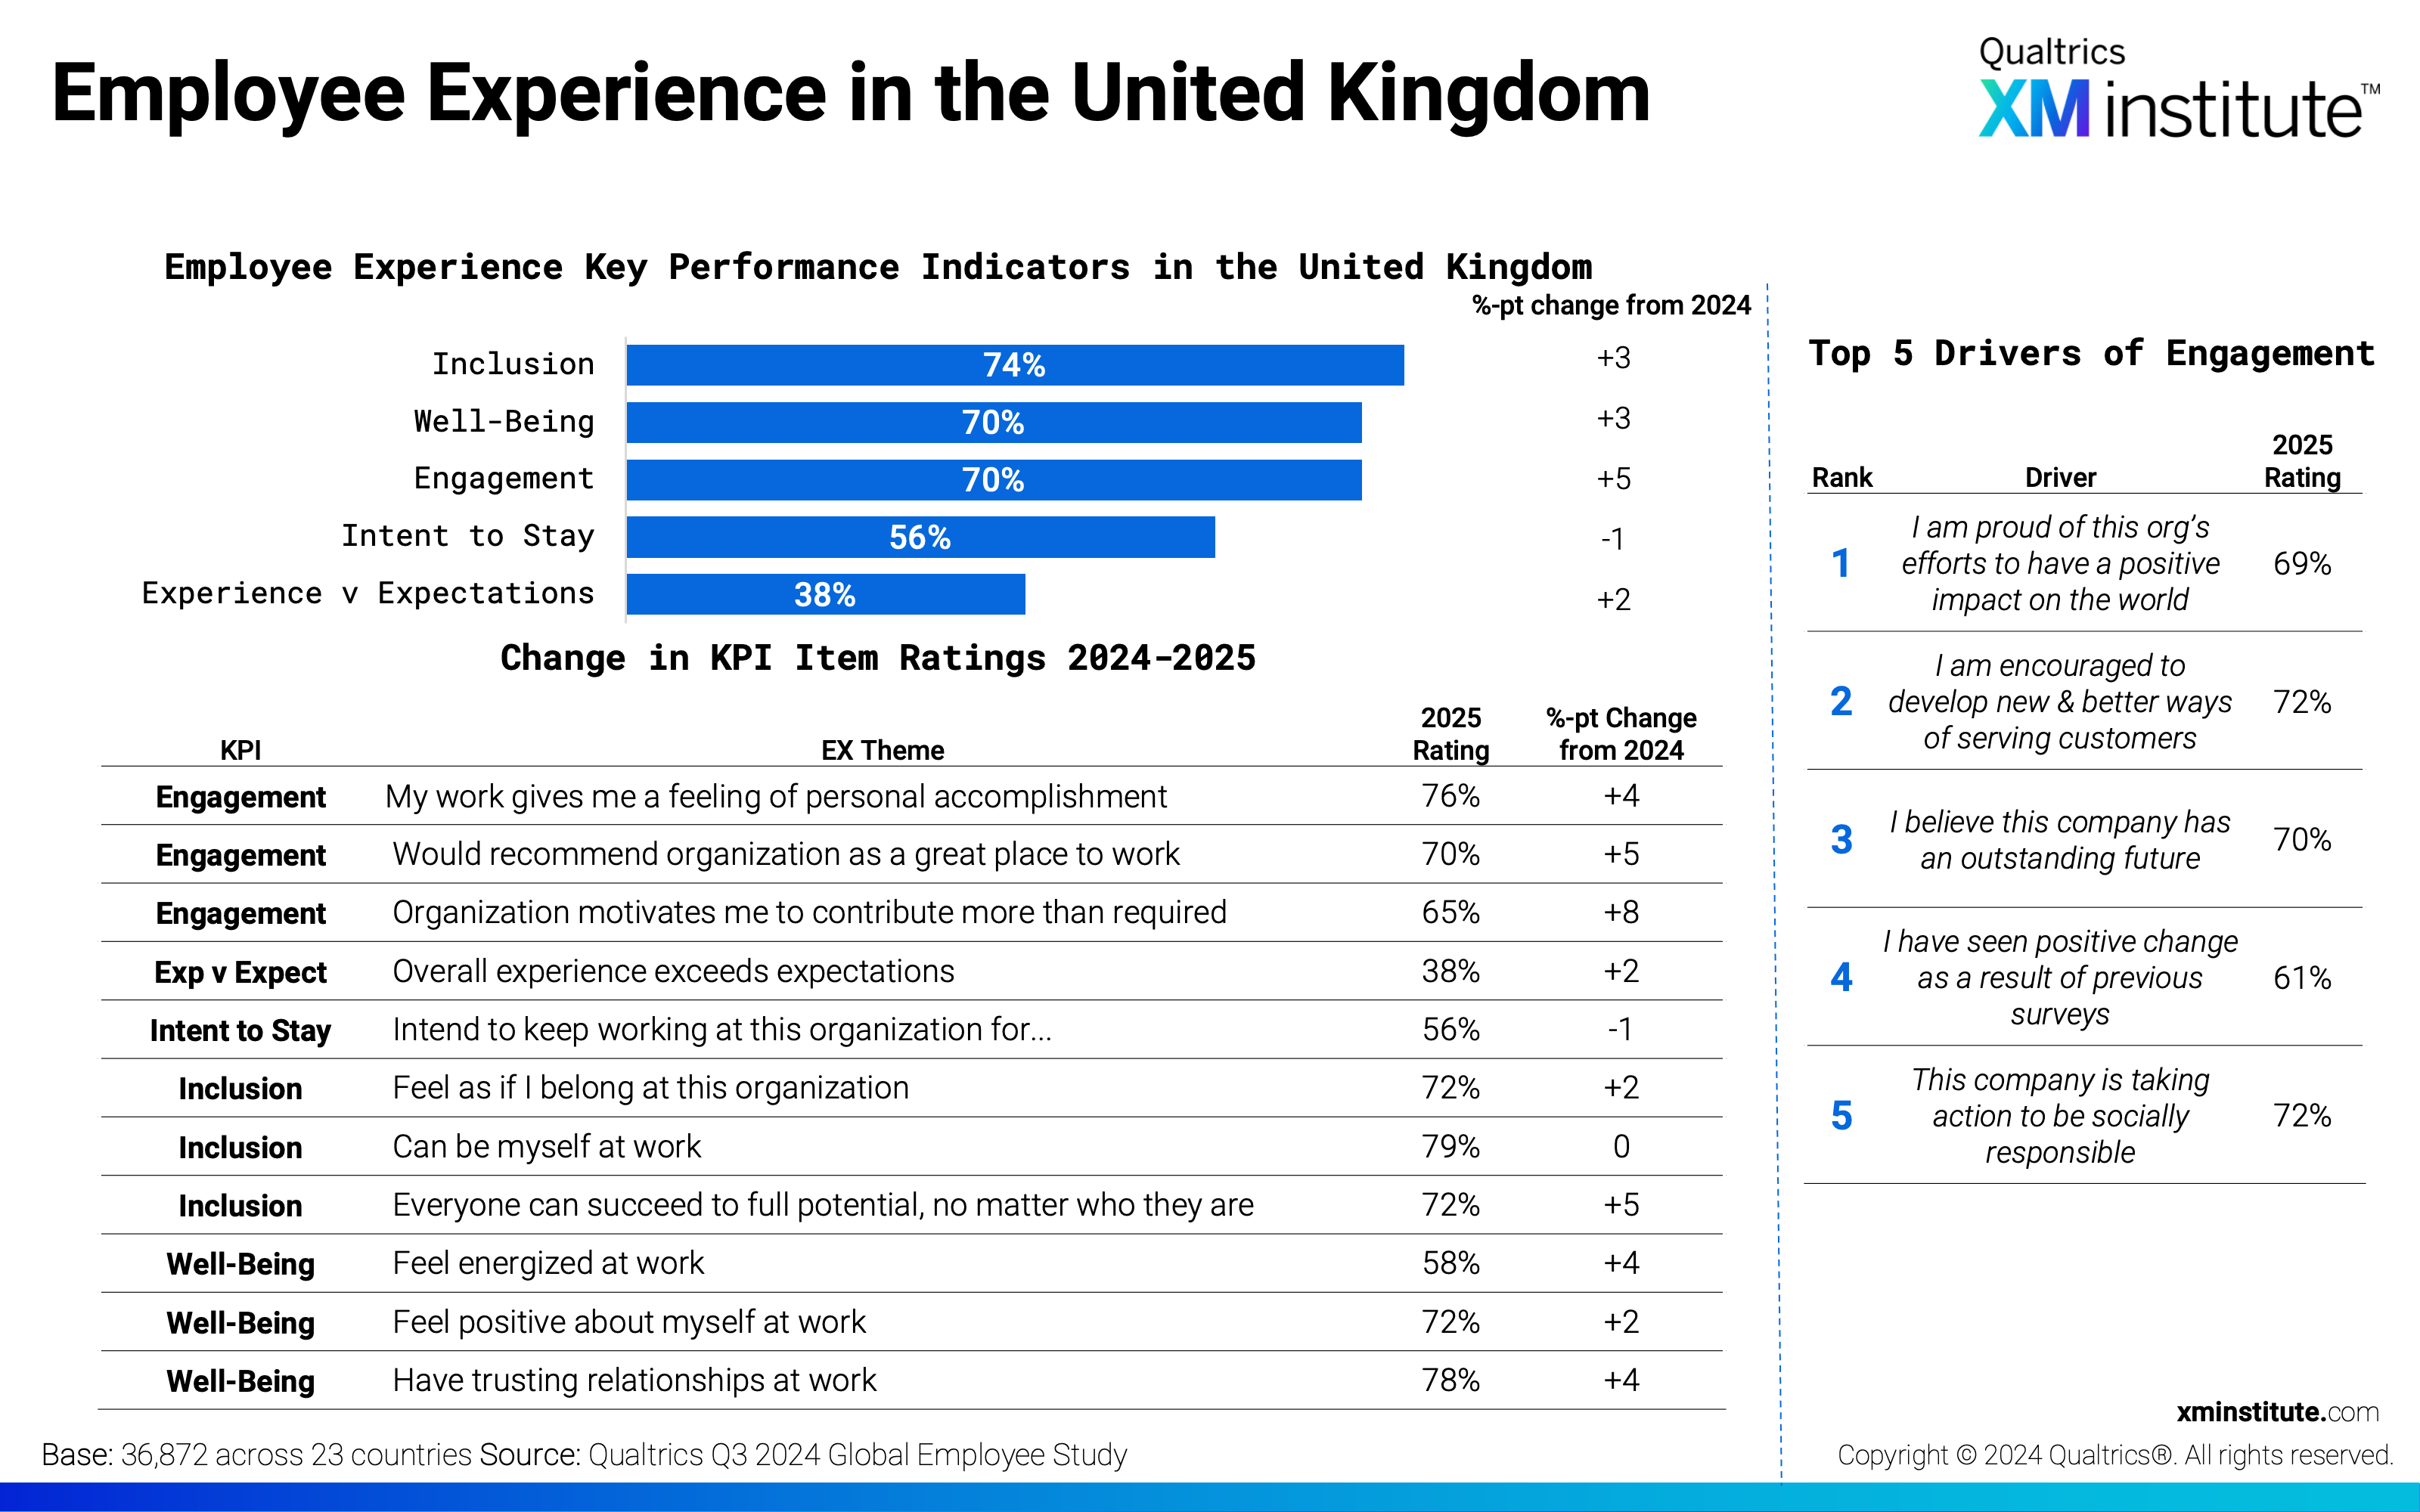
- German, UK, and French employees report the largest improvements in Engagement and Well-Being. Employee Engagement is up 5 points from 2024 in both the UK and Germany, and up 4 points in France. Employees in the UK also report the greatest increase in Well-Being (+5 pts), while employees in France (+4 pts) and Germany (+3 pts) follow.
Figures
Here are the figures in this Data Snapshot:
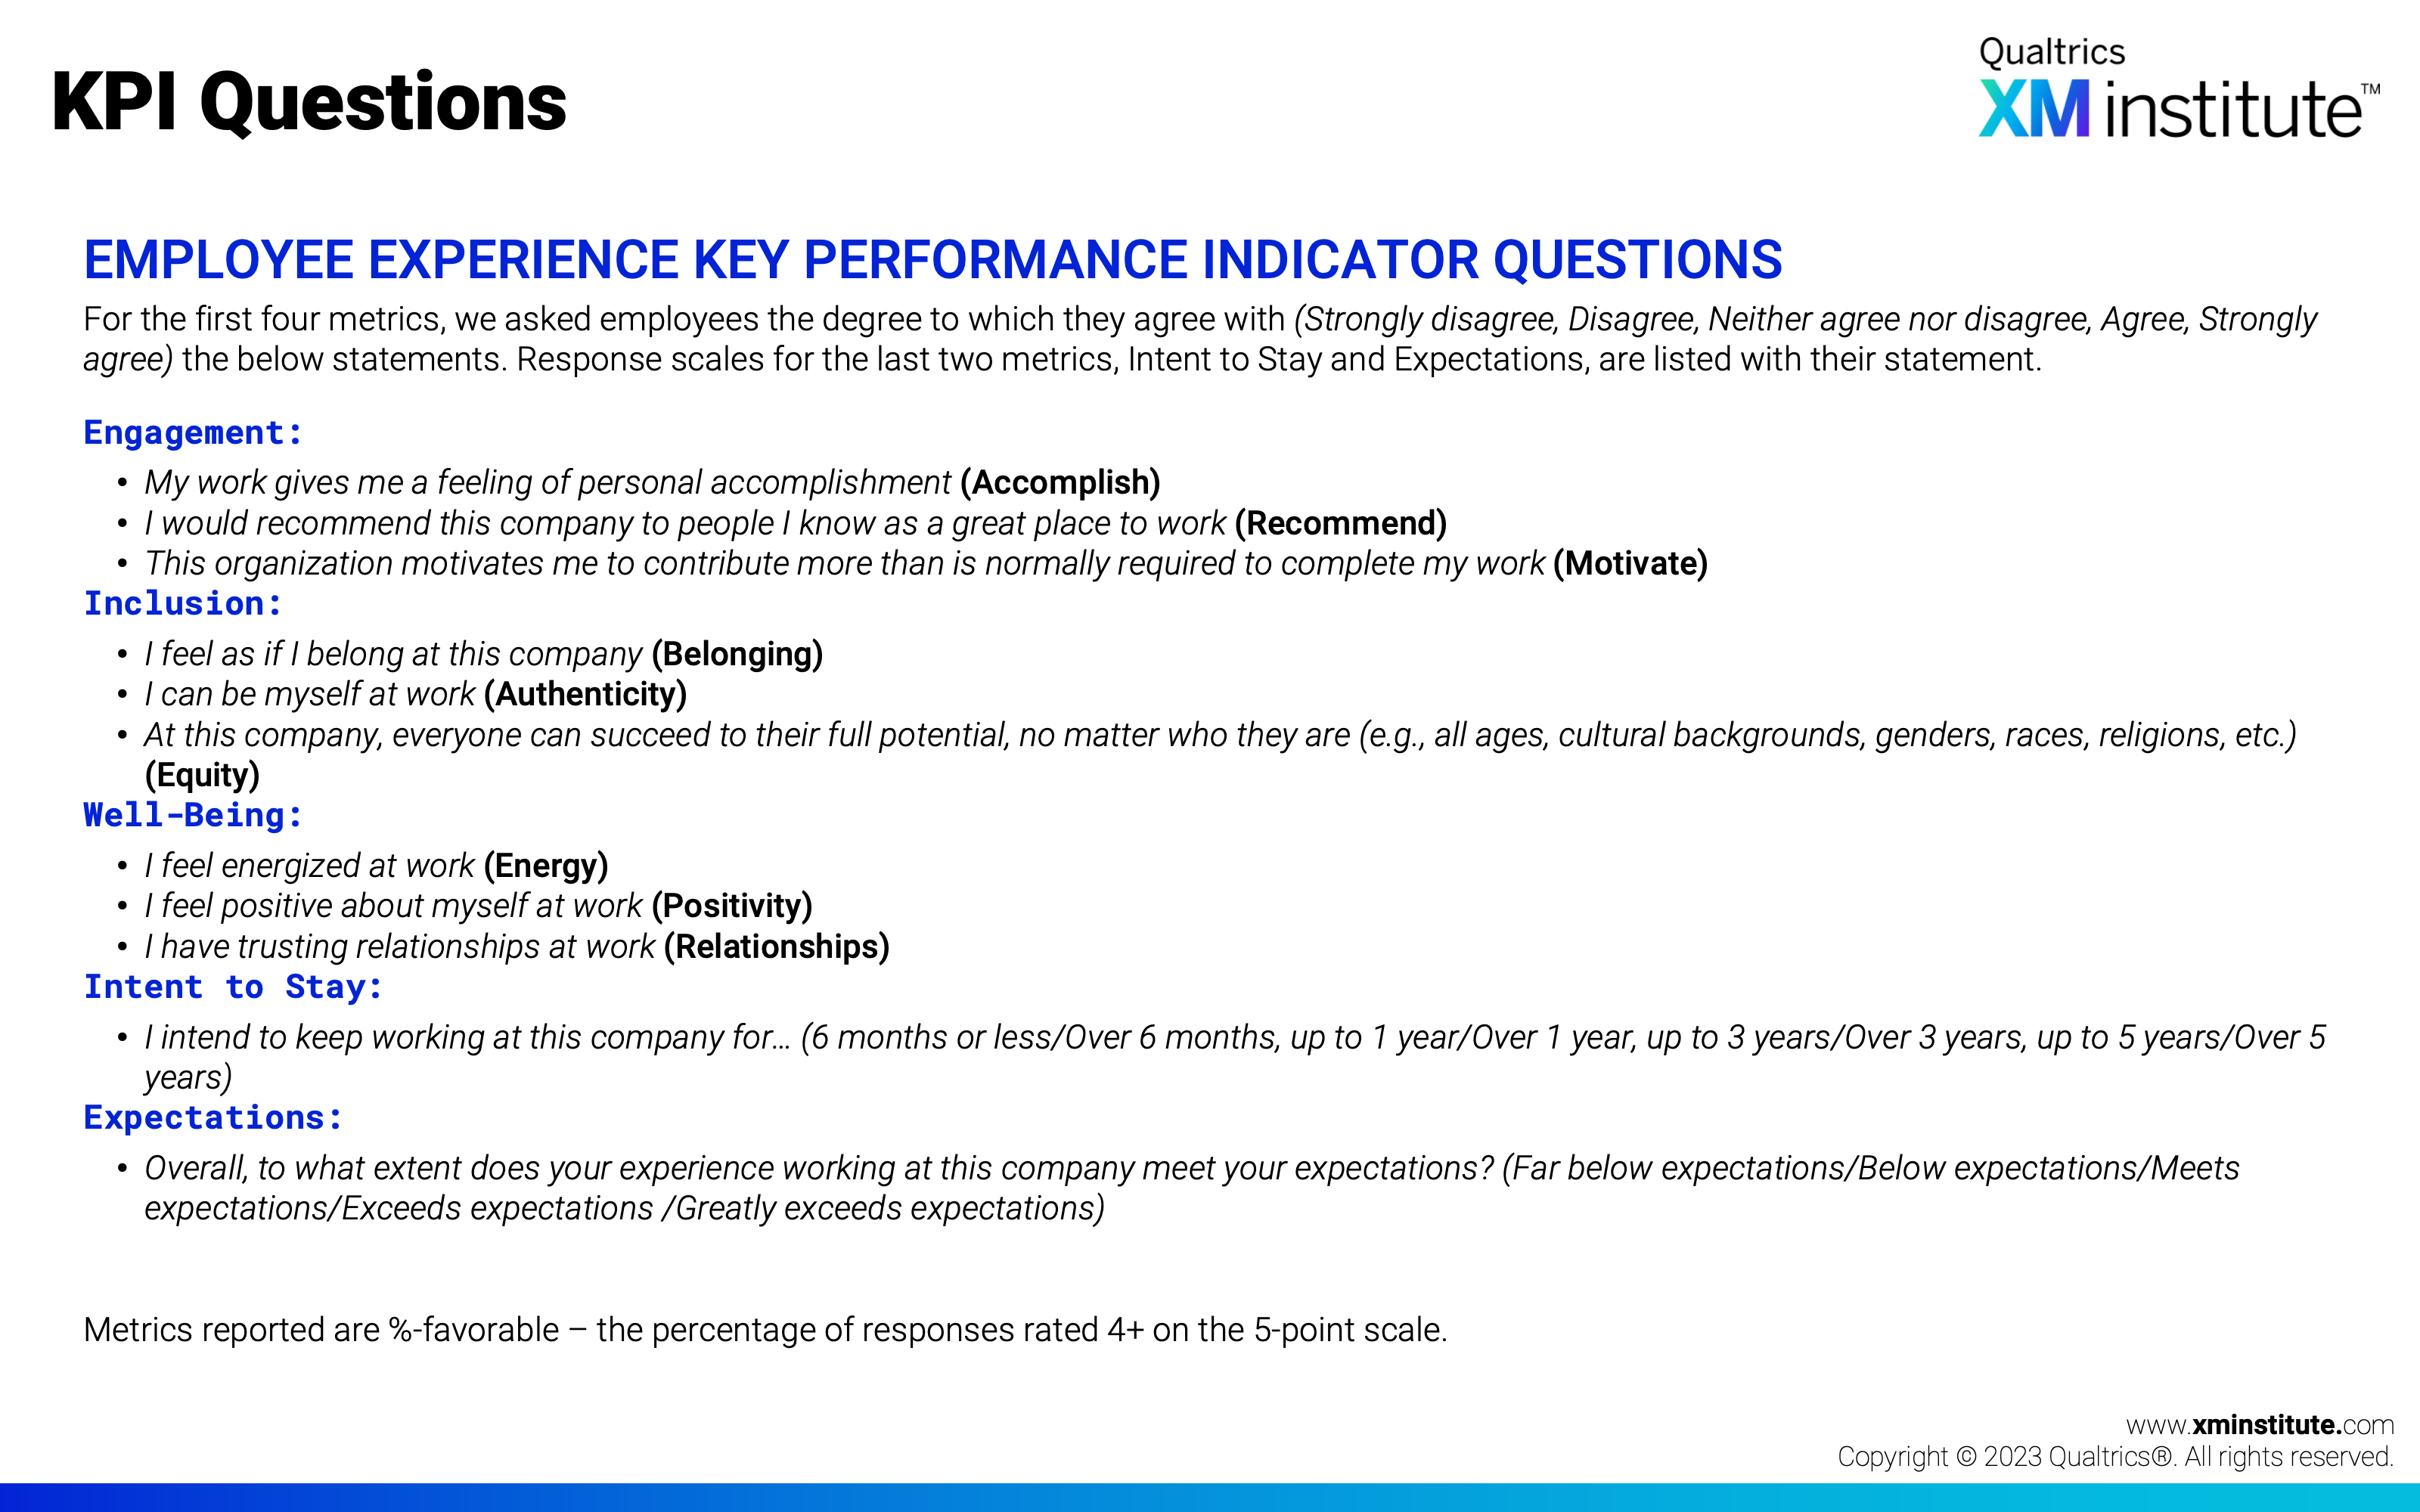
- KPI Questions (see Figure 1)
- Employee Experience Globally (see Figure 2)
- Employee Engagement by Country (see Figure 3)
- Employee Well-Being by Country (see Figure 4)
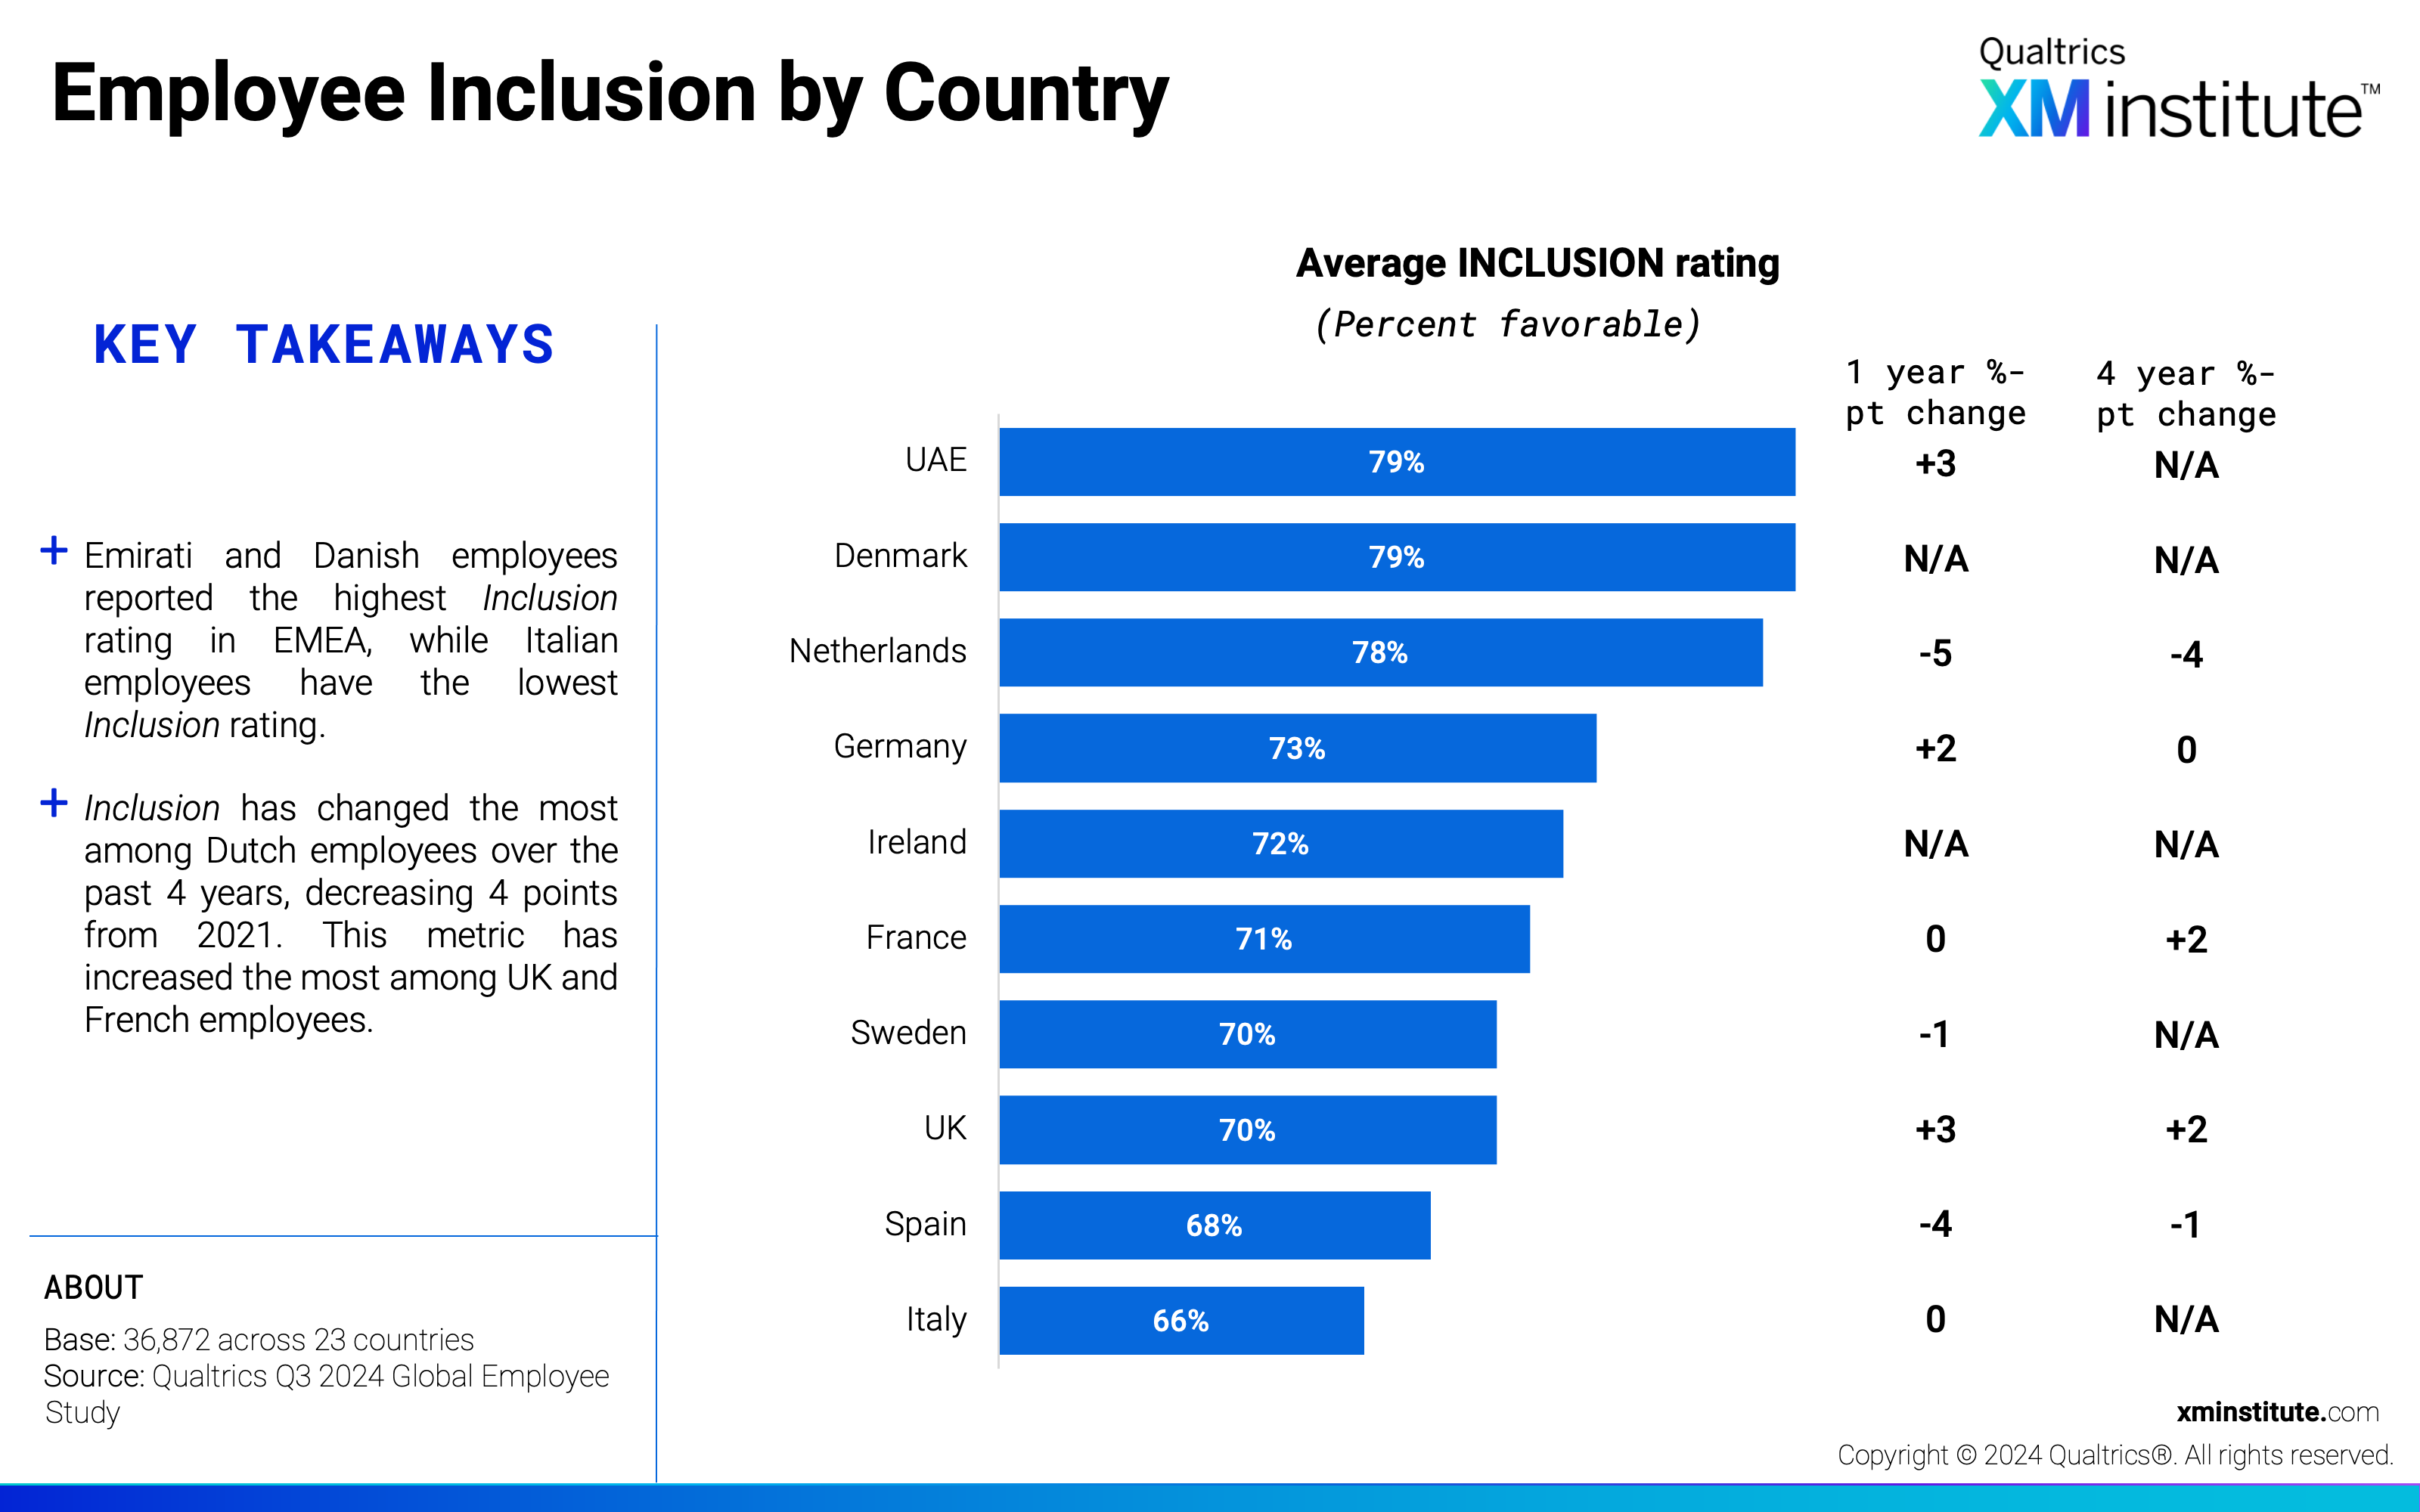
- Employee Inclusion by Country (see Figure 5)
- Employee Intent to Stay by Country (see Figure 6)
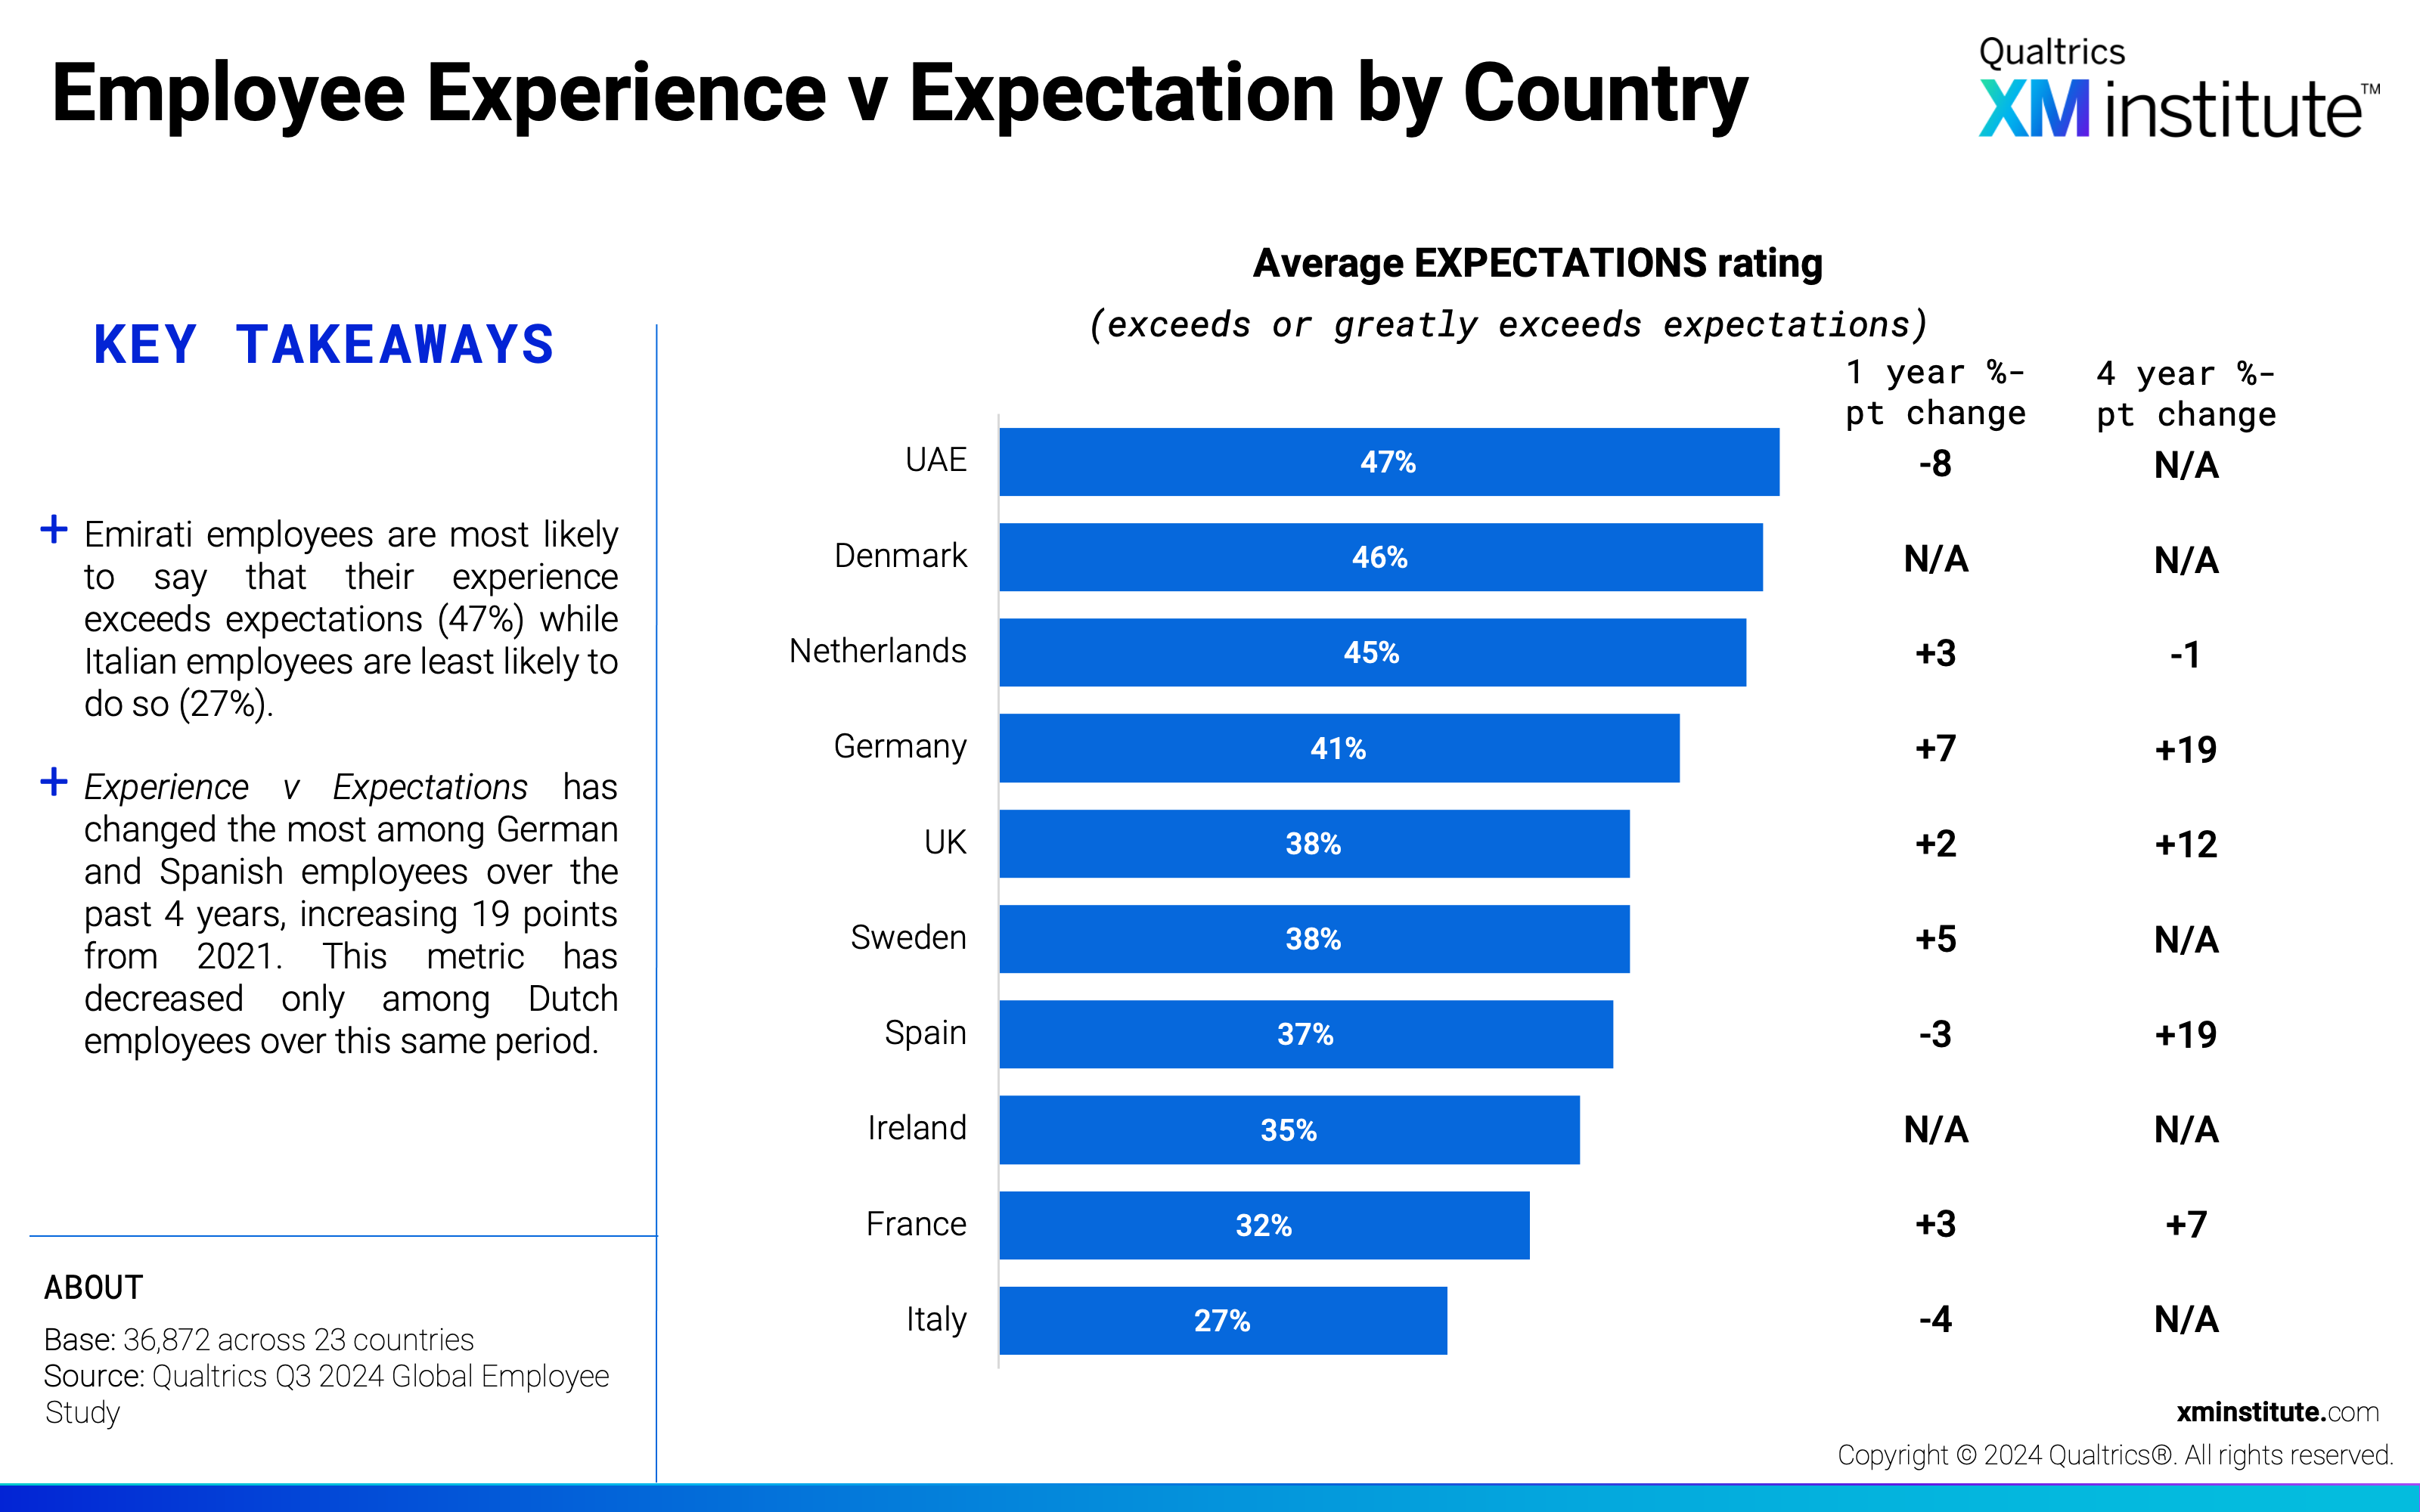
- Employee Experience v Expectations by Country (see Figure 7)
- Employee Experience in EMEA (see Figure 8)
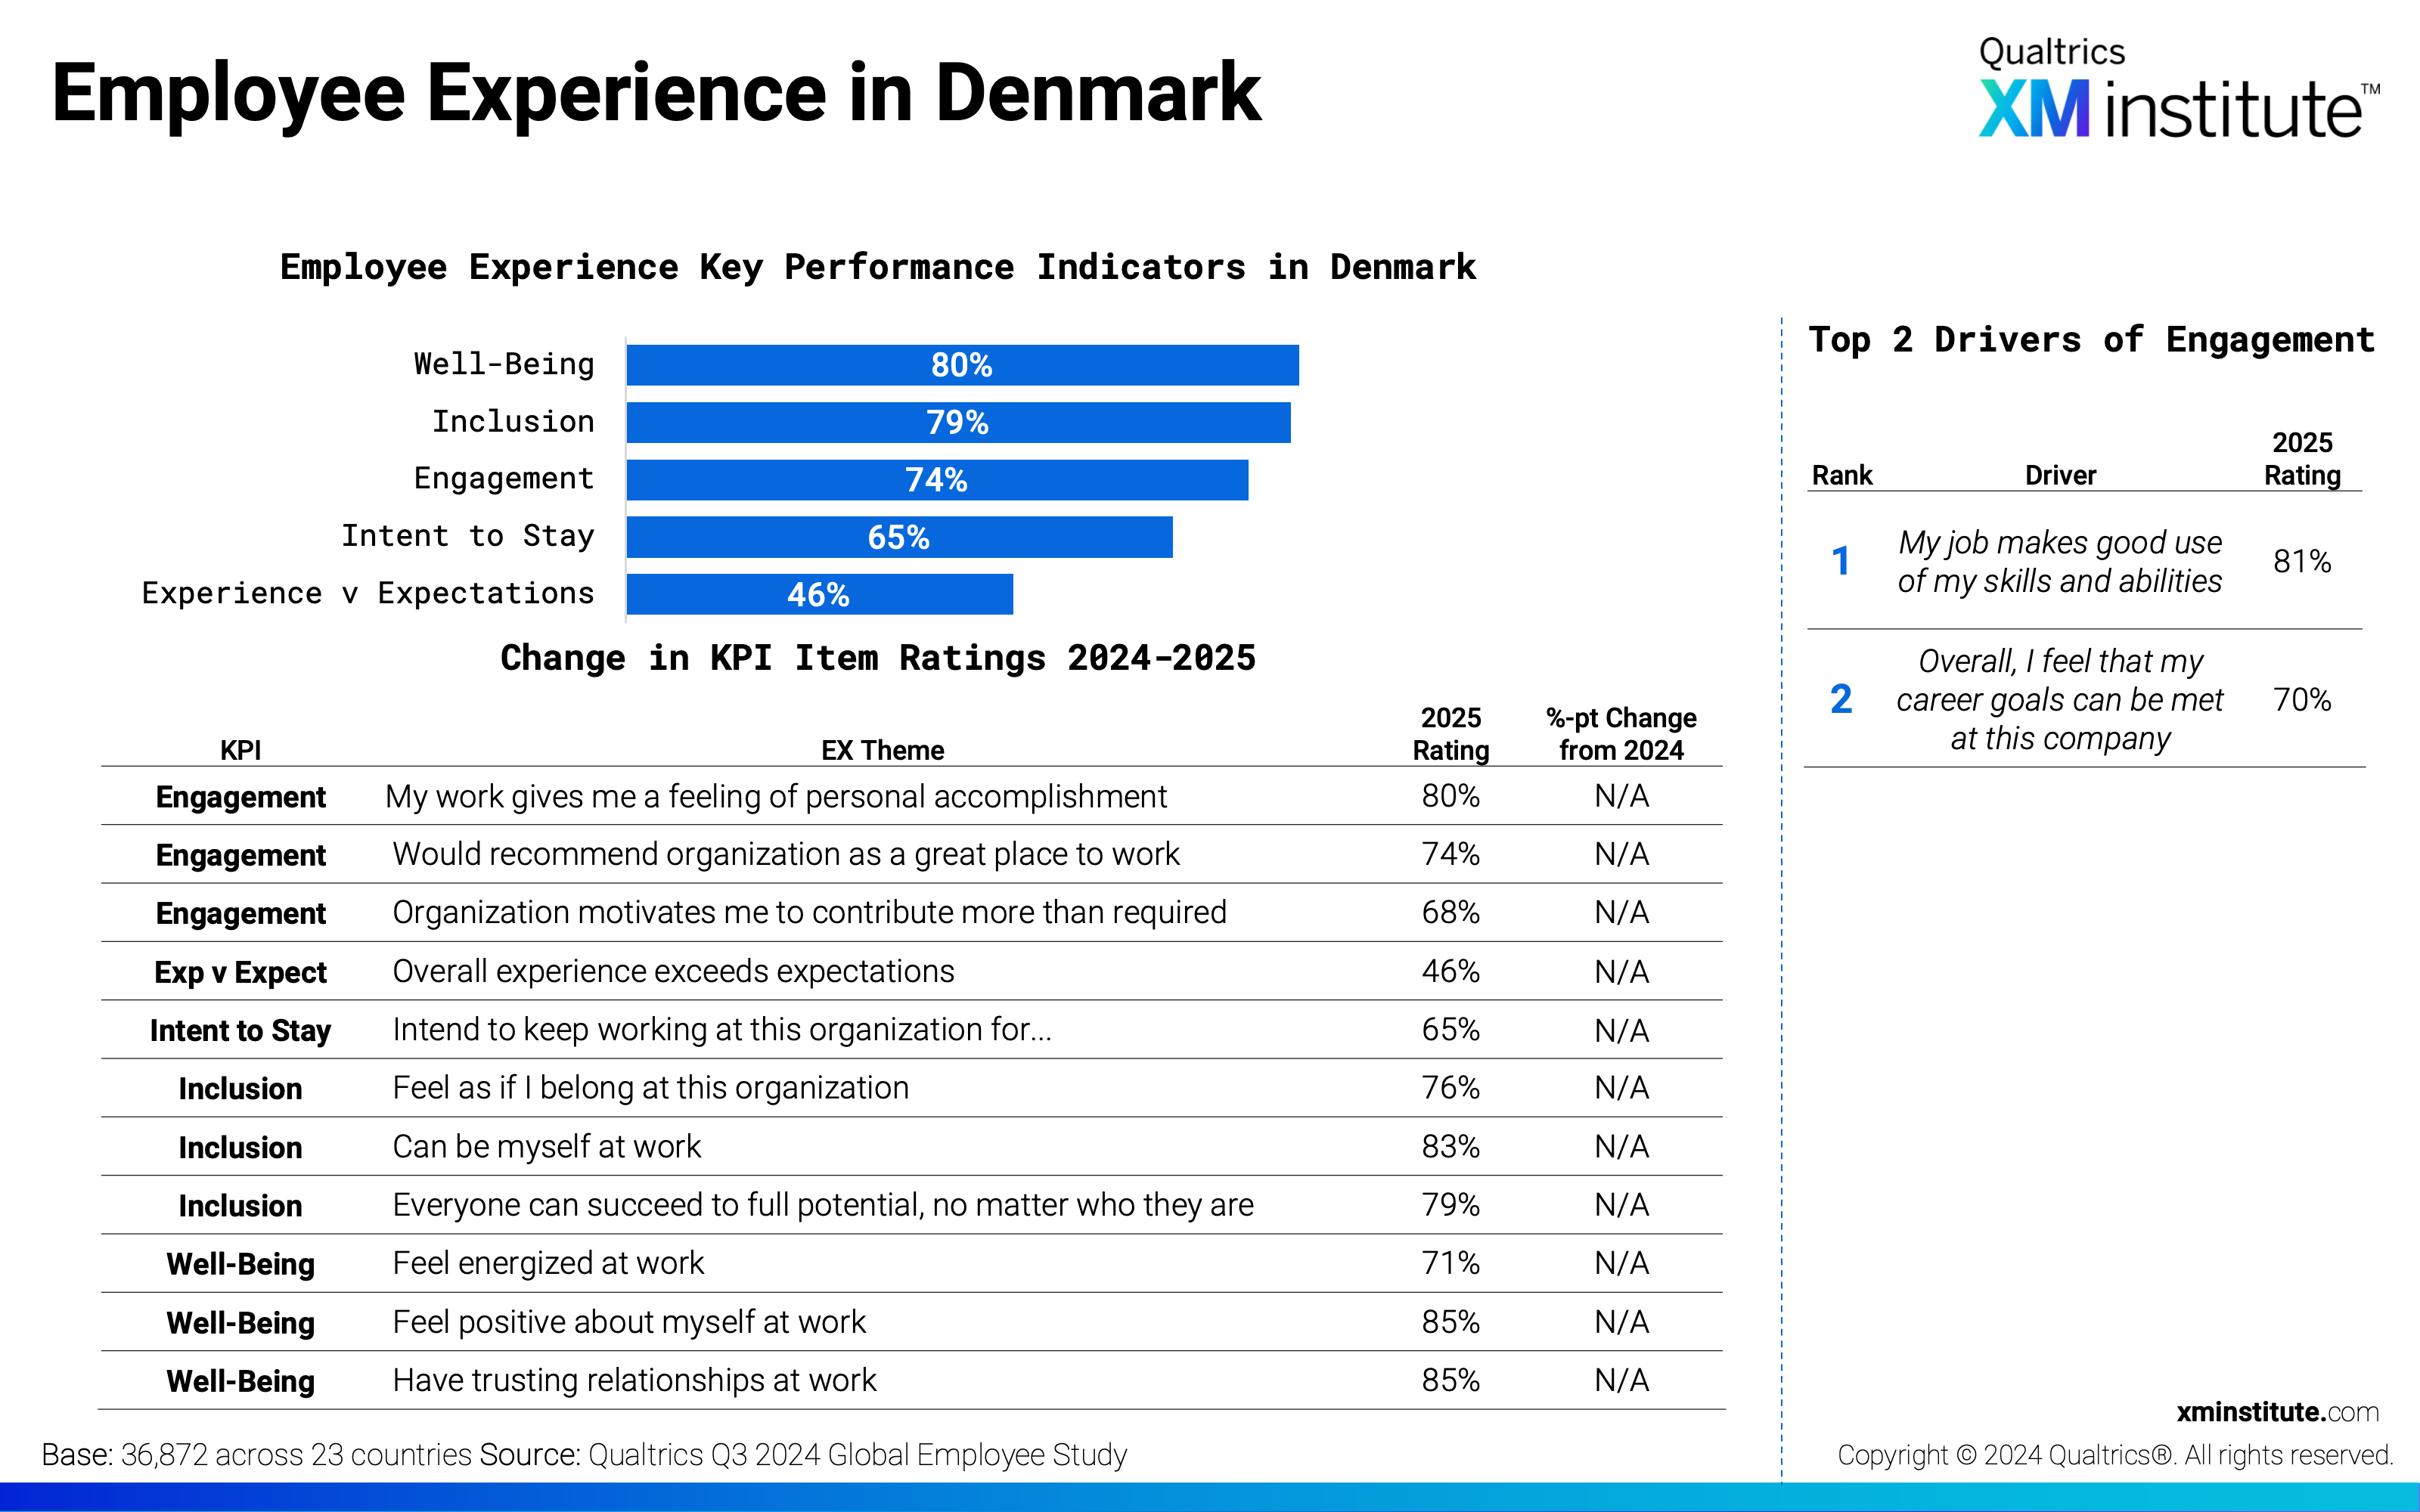
- Employee Experience in Denmark (see Figure 9)
- Employee Experience in France (see Figure 10)
- Employee Experience in Germany (see Figure 11)
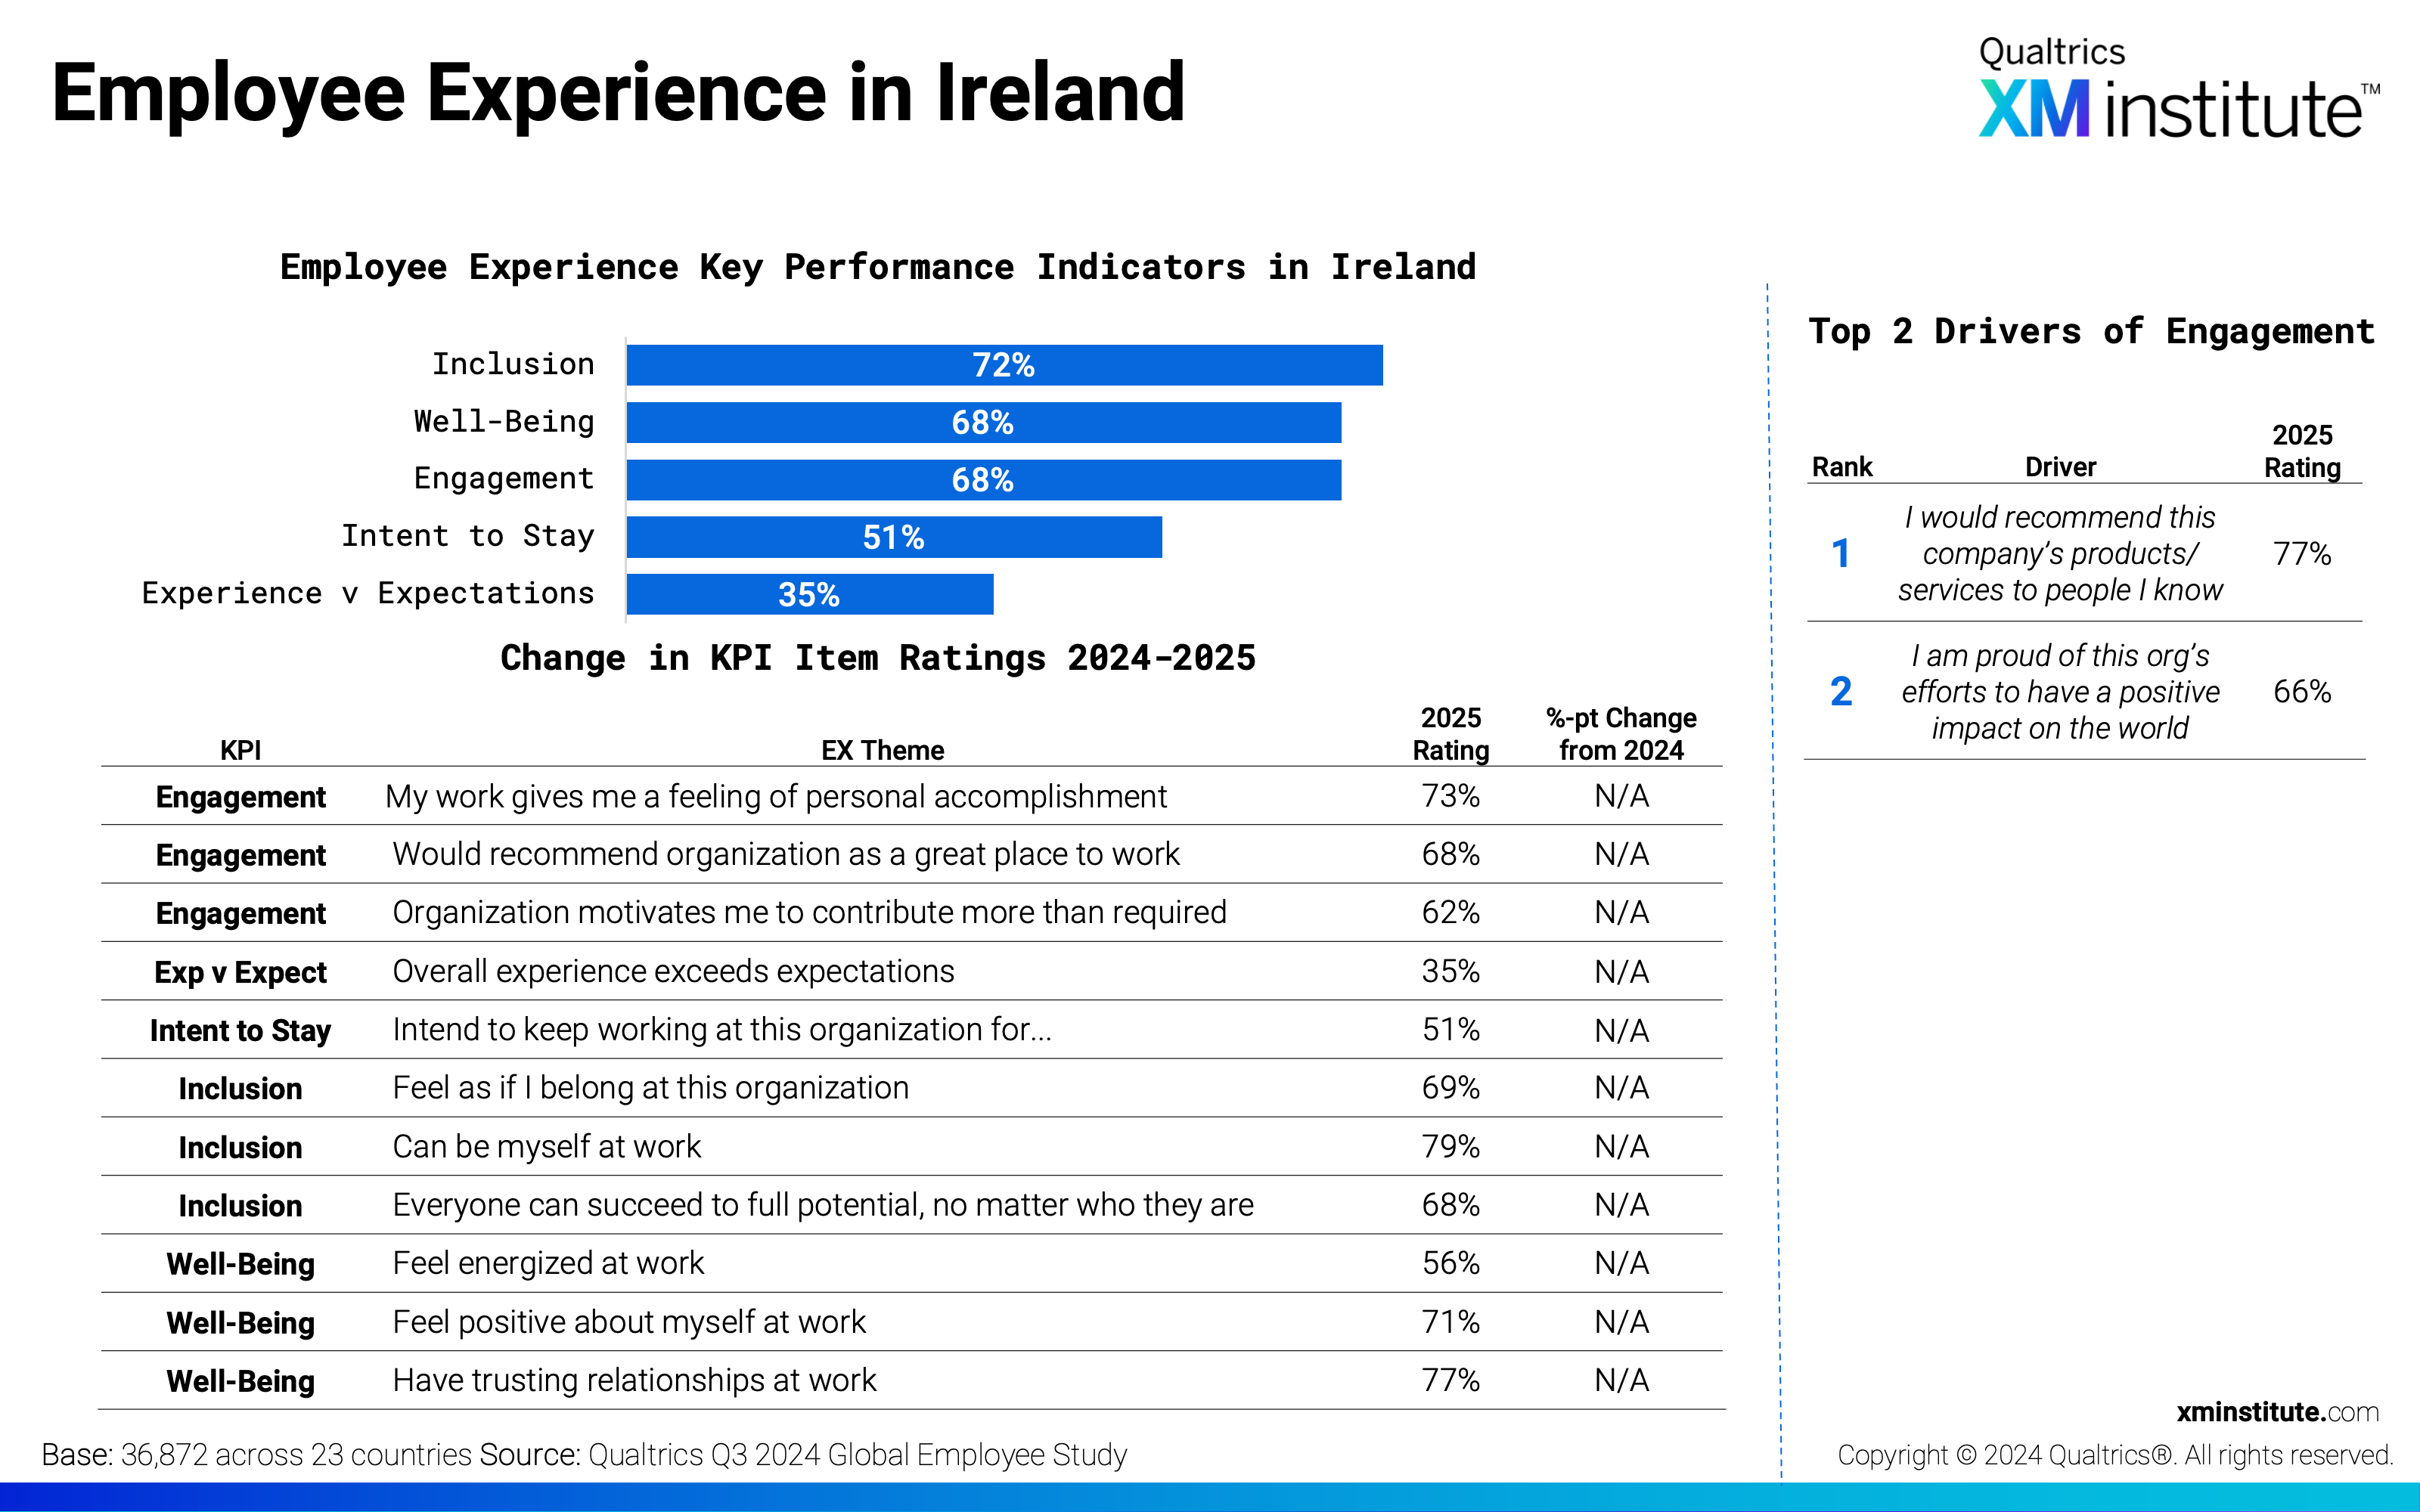
- Employee Experience in Ireland (see Figure 12)
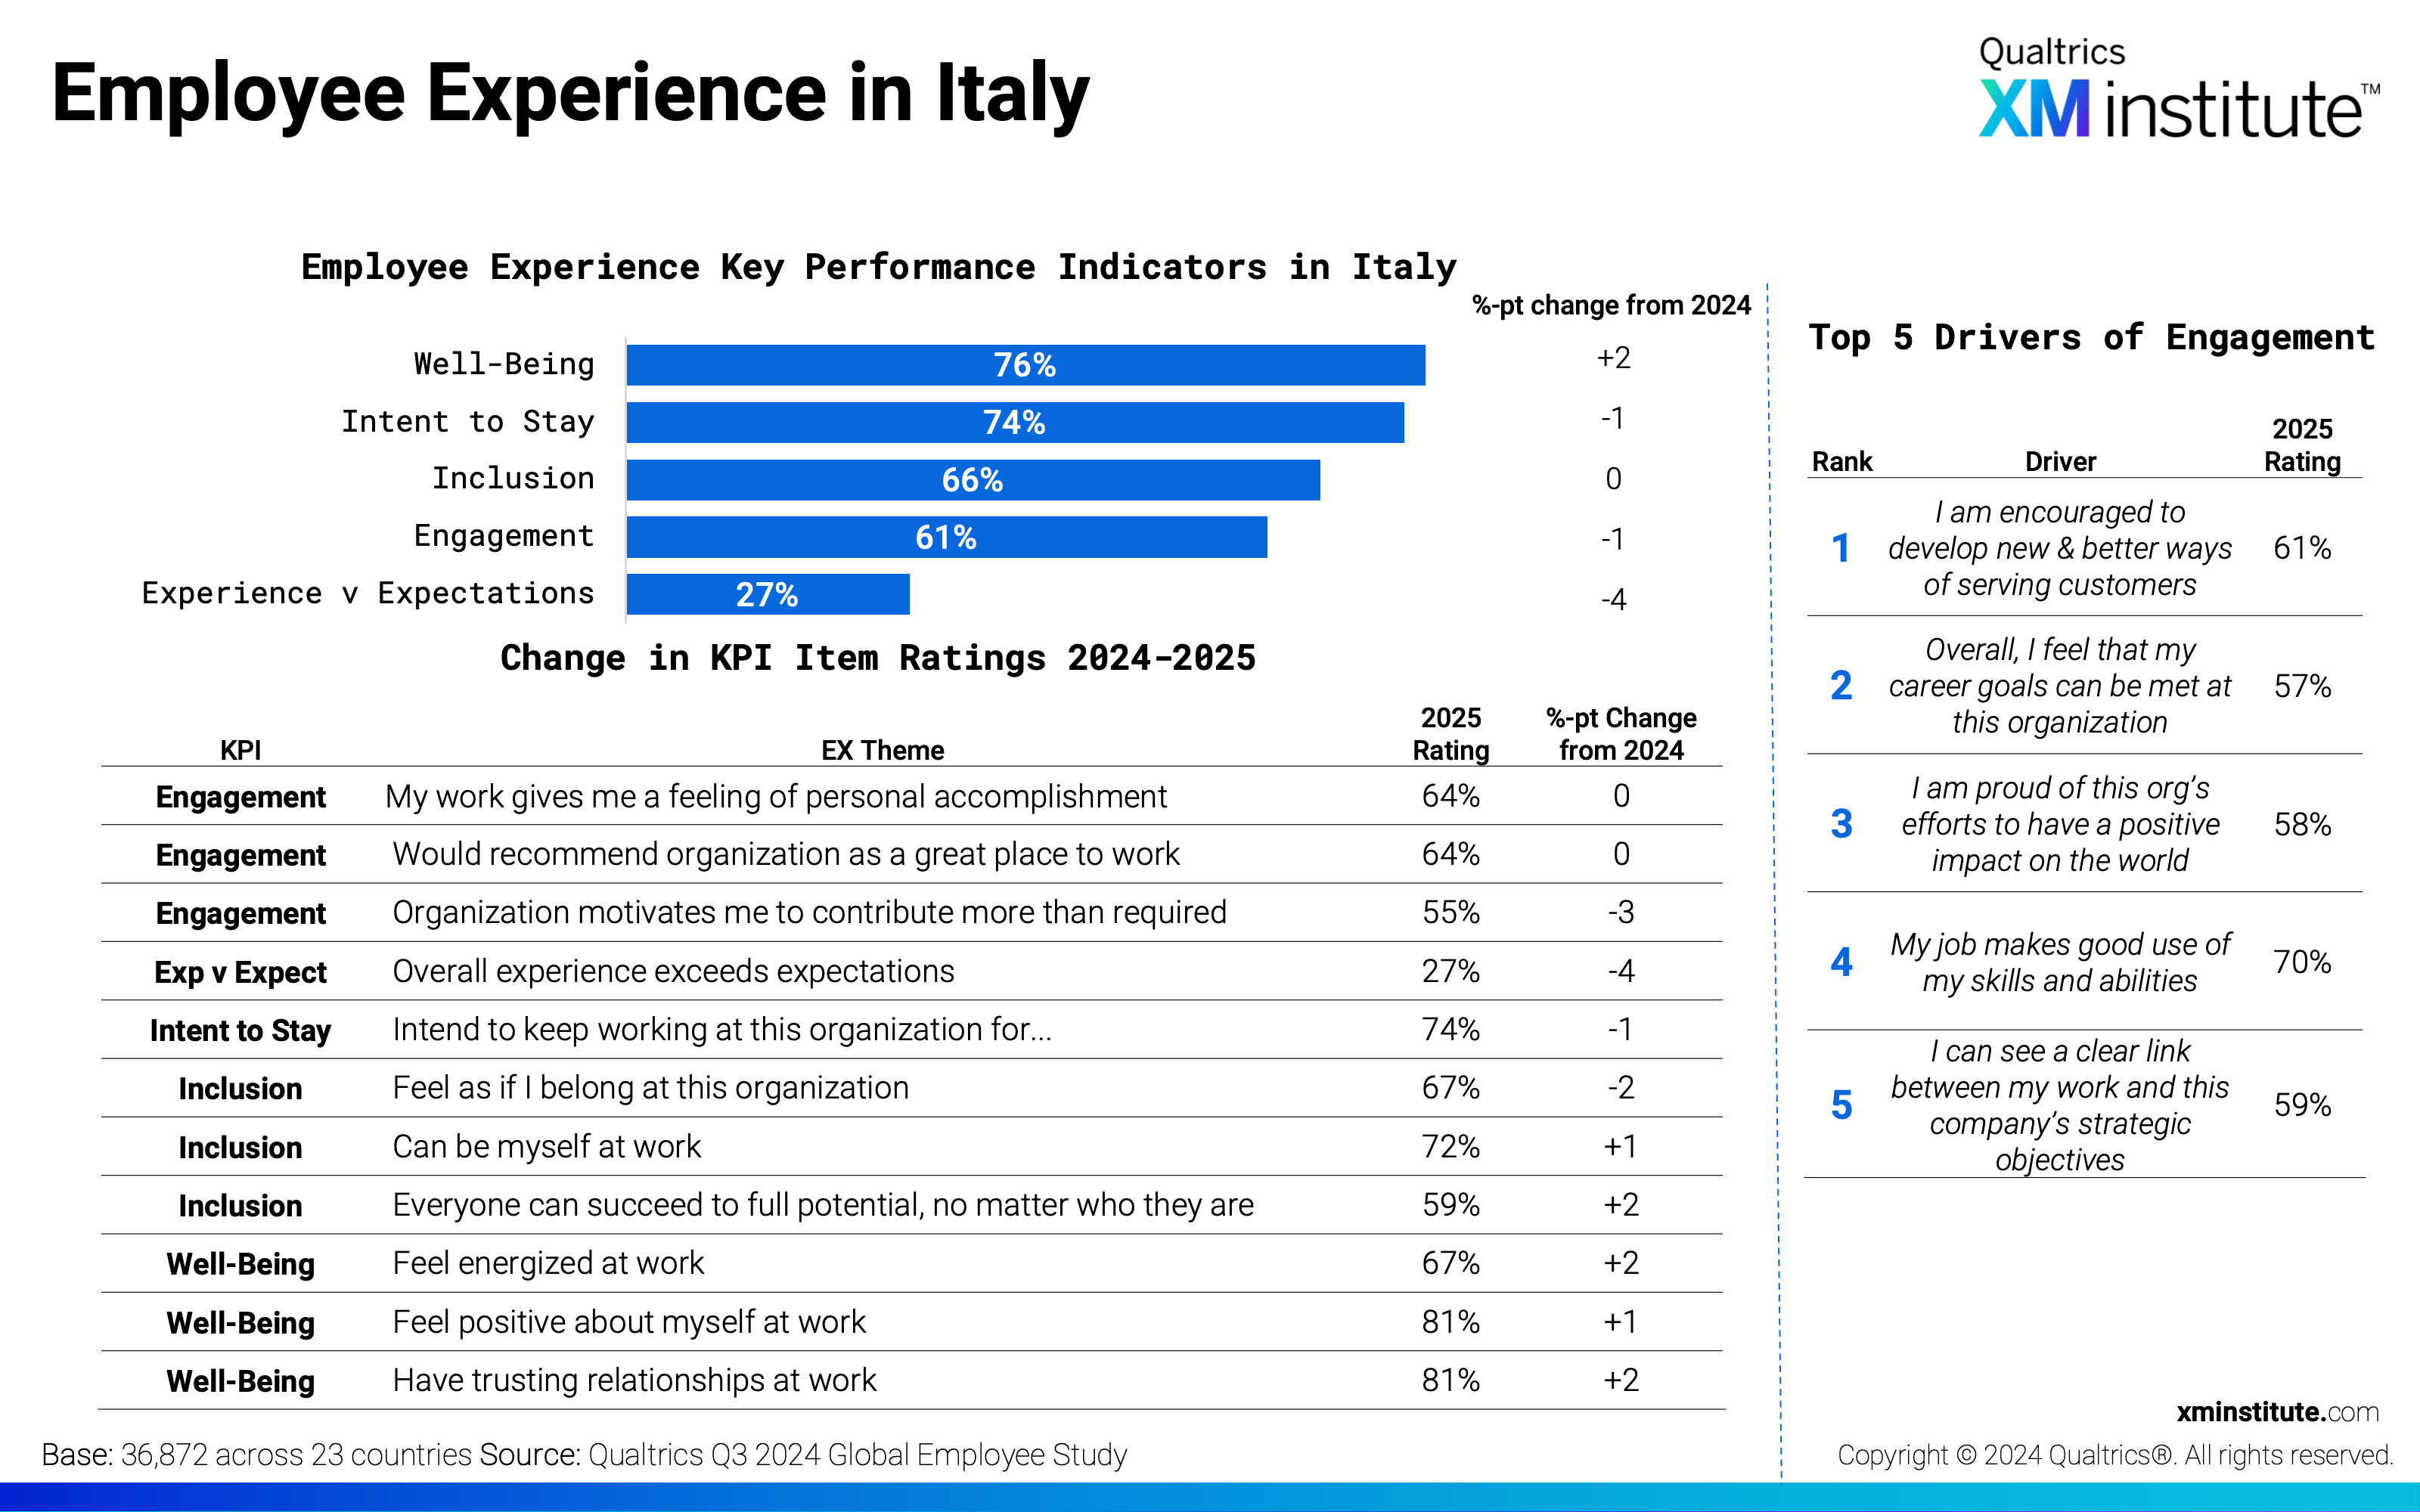
- Employee Experience in Italy (see Figure 13)
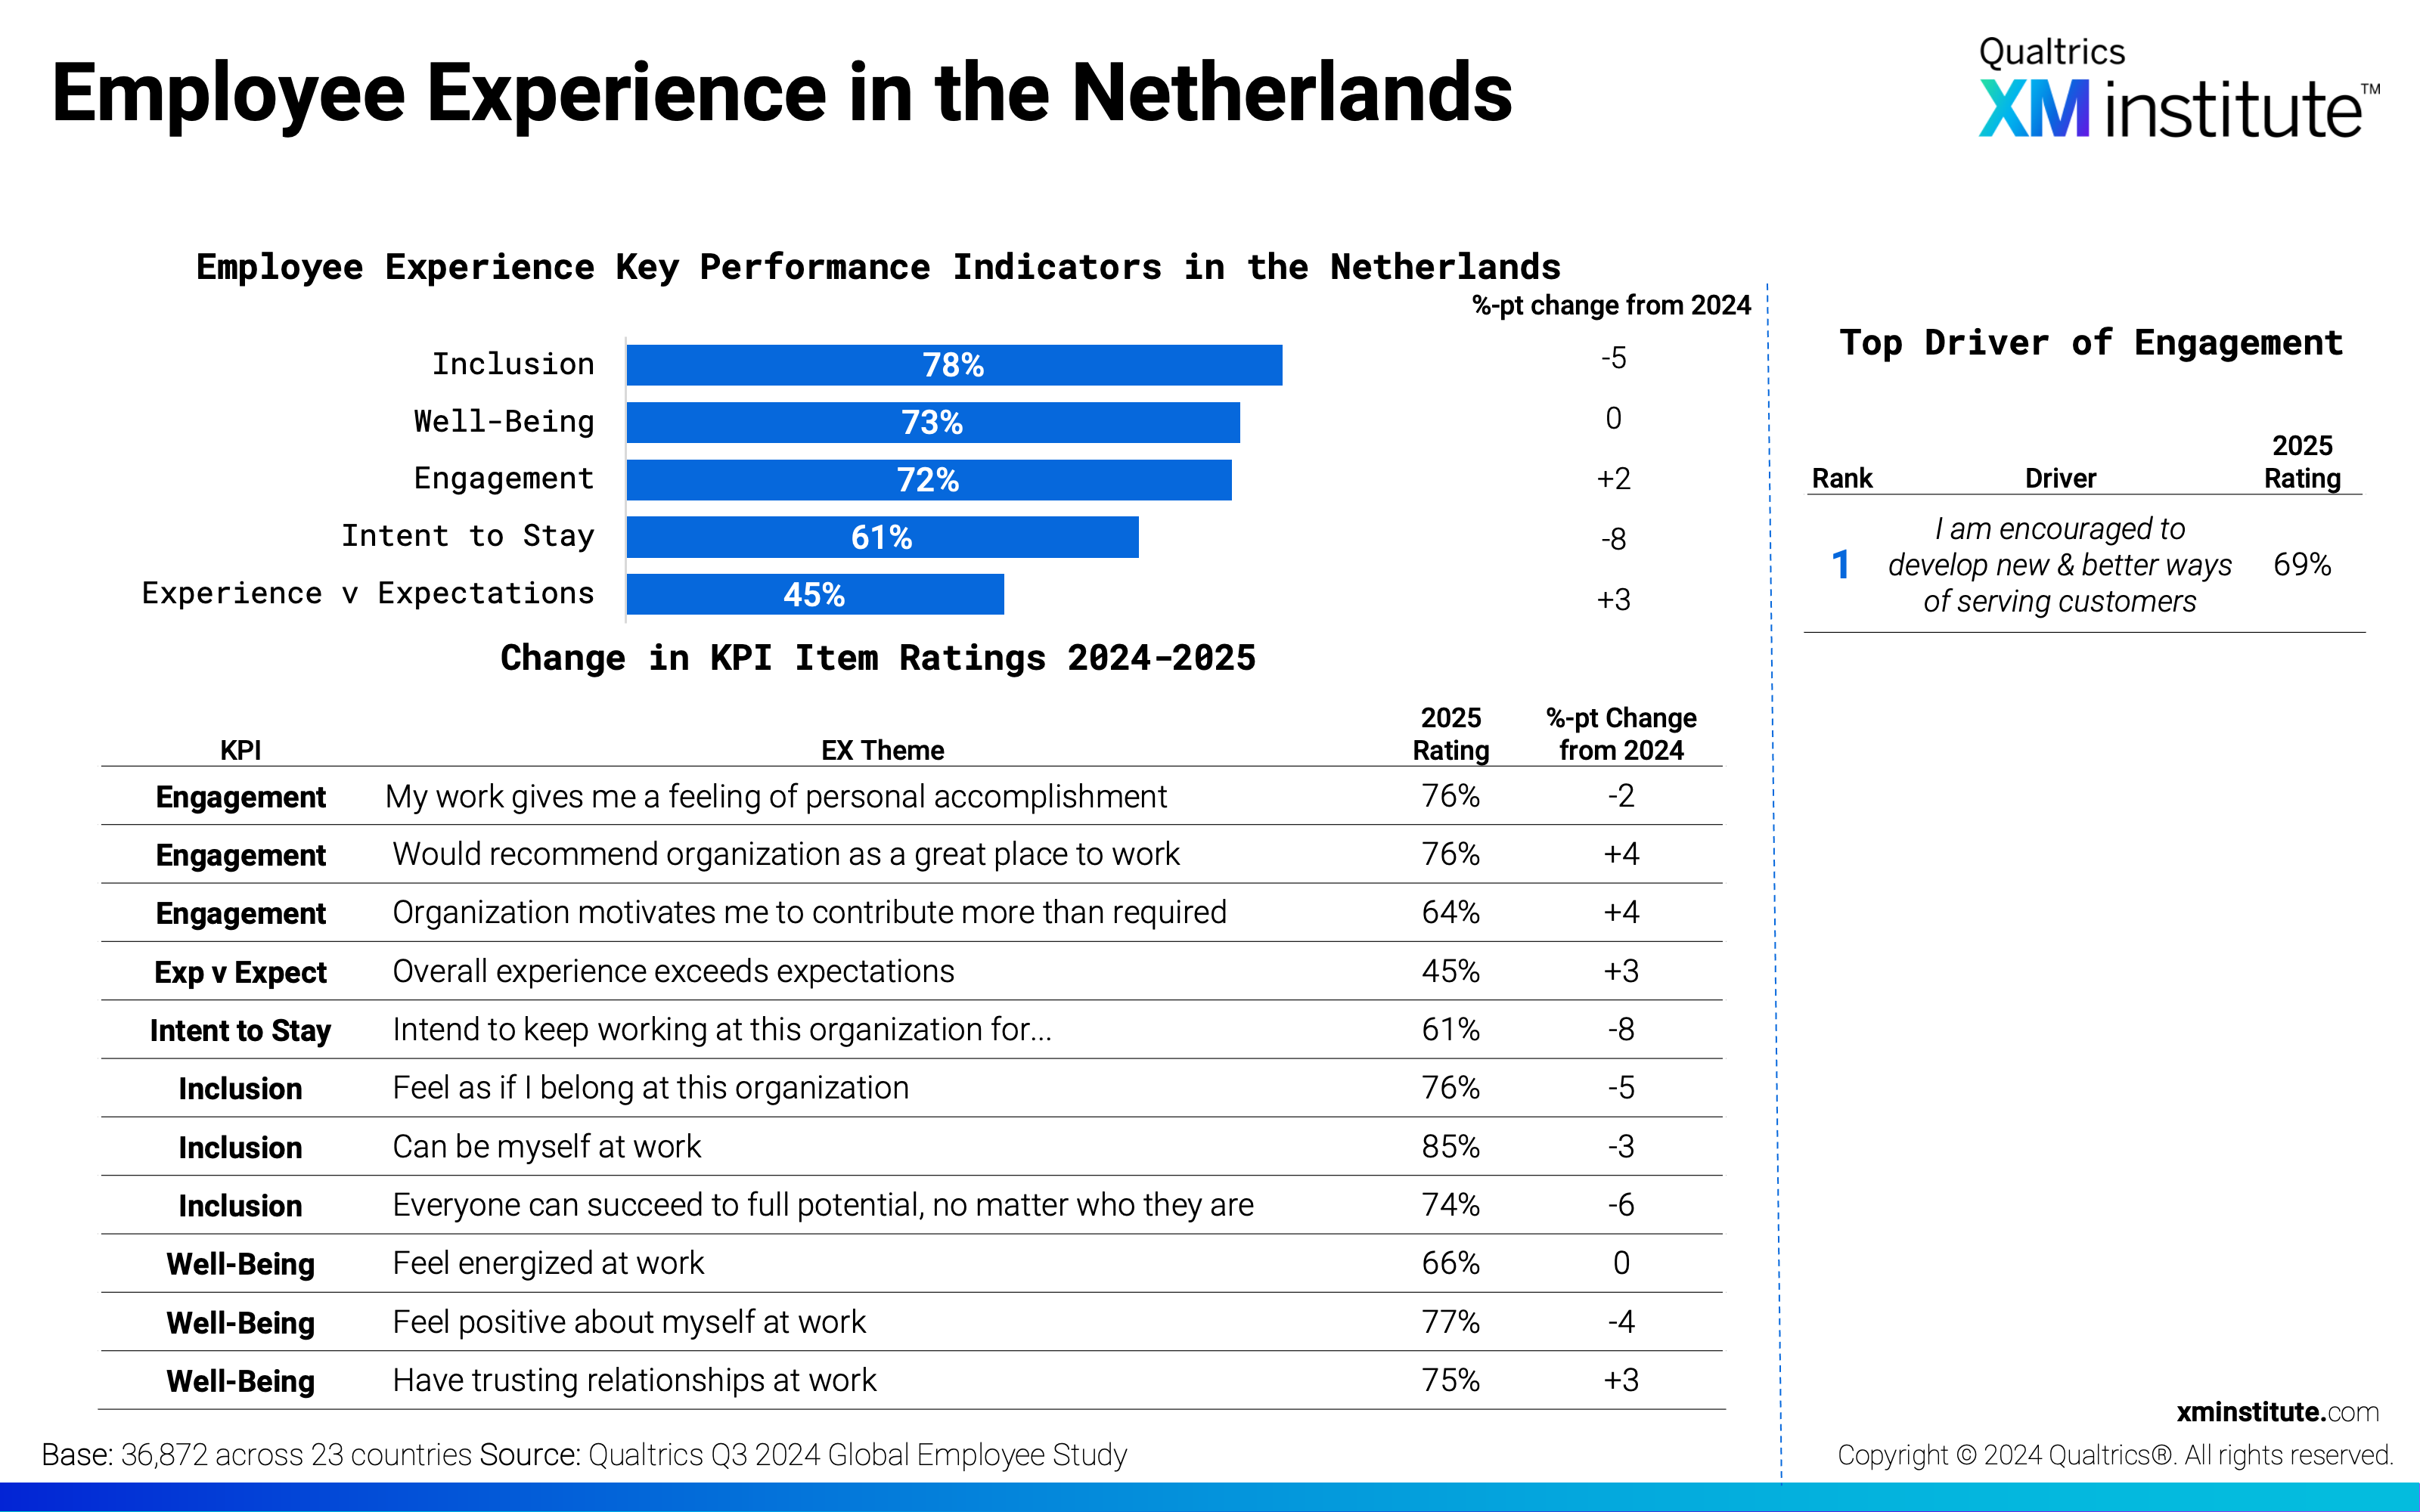
- Employee Experience in the Netherlands (see Figure 14)
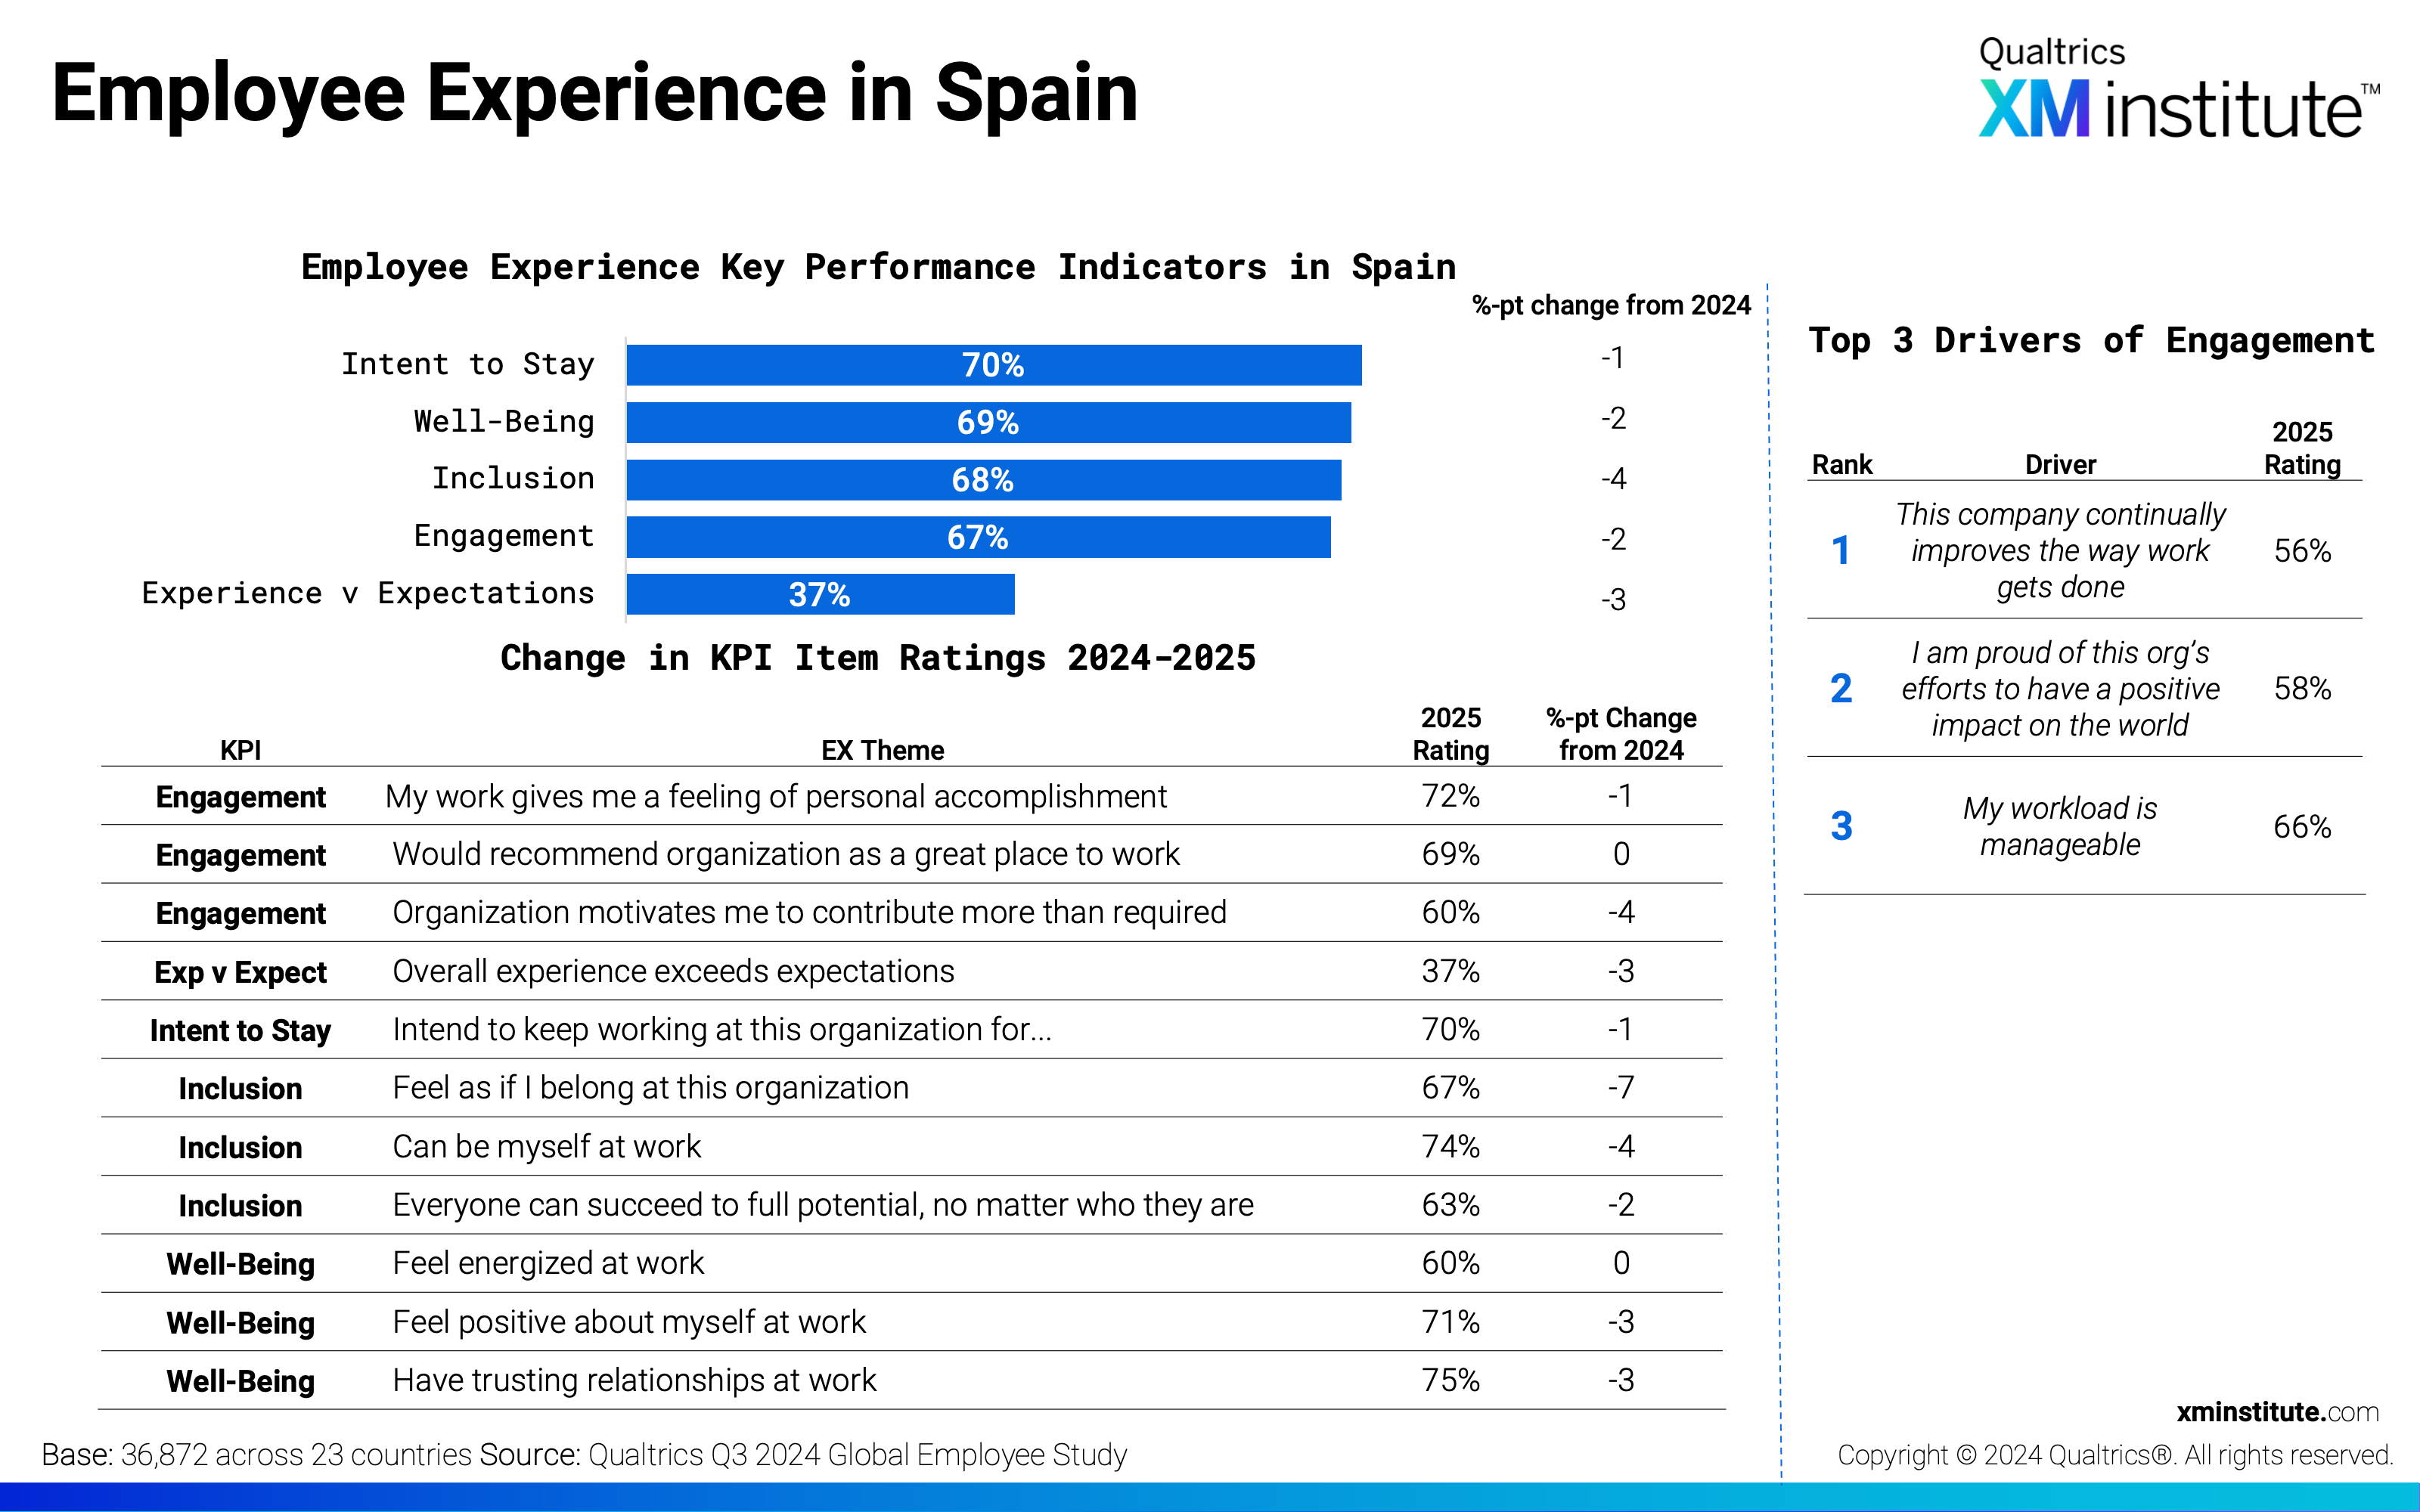
- Employee Experience in Spain (see Figure 15)
- Employee Experience in Sweden (see Figure 16)
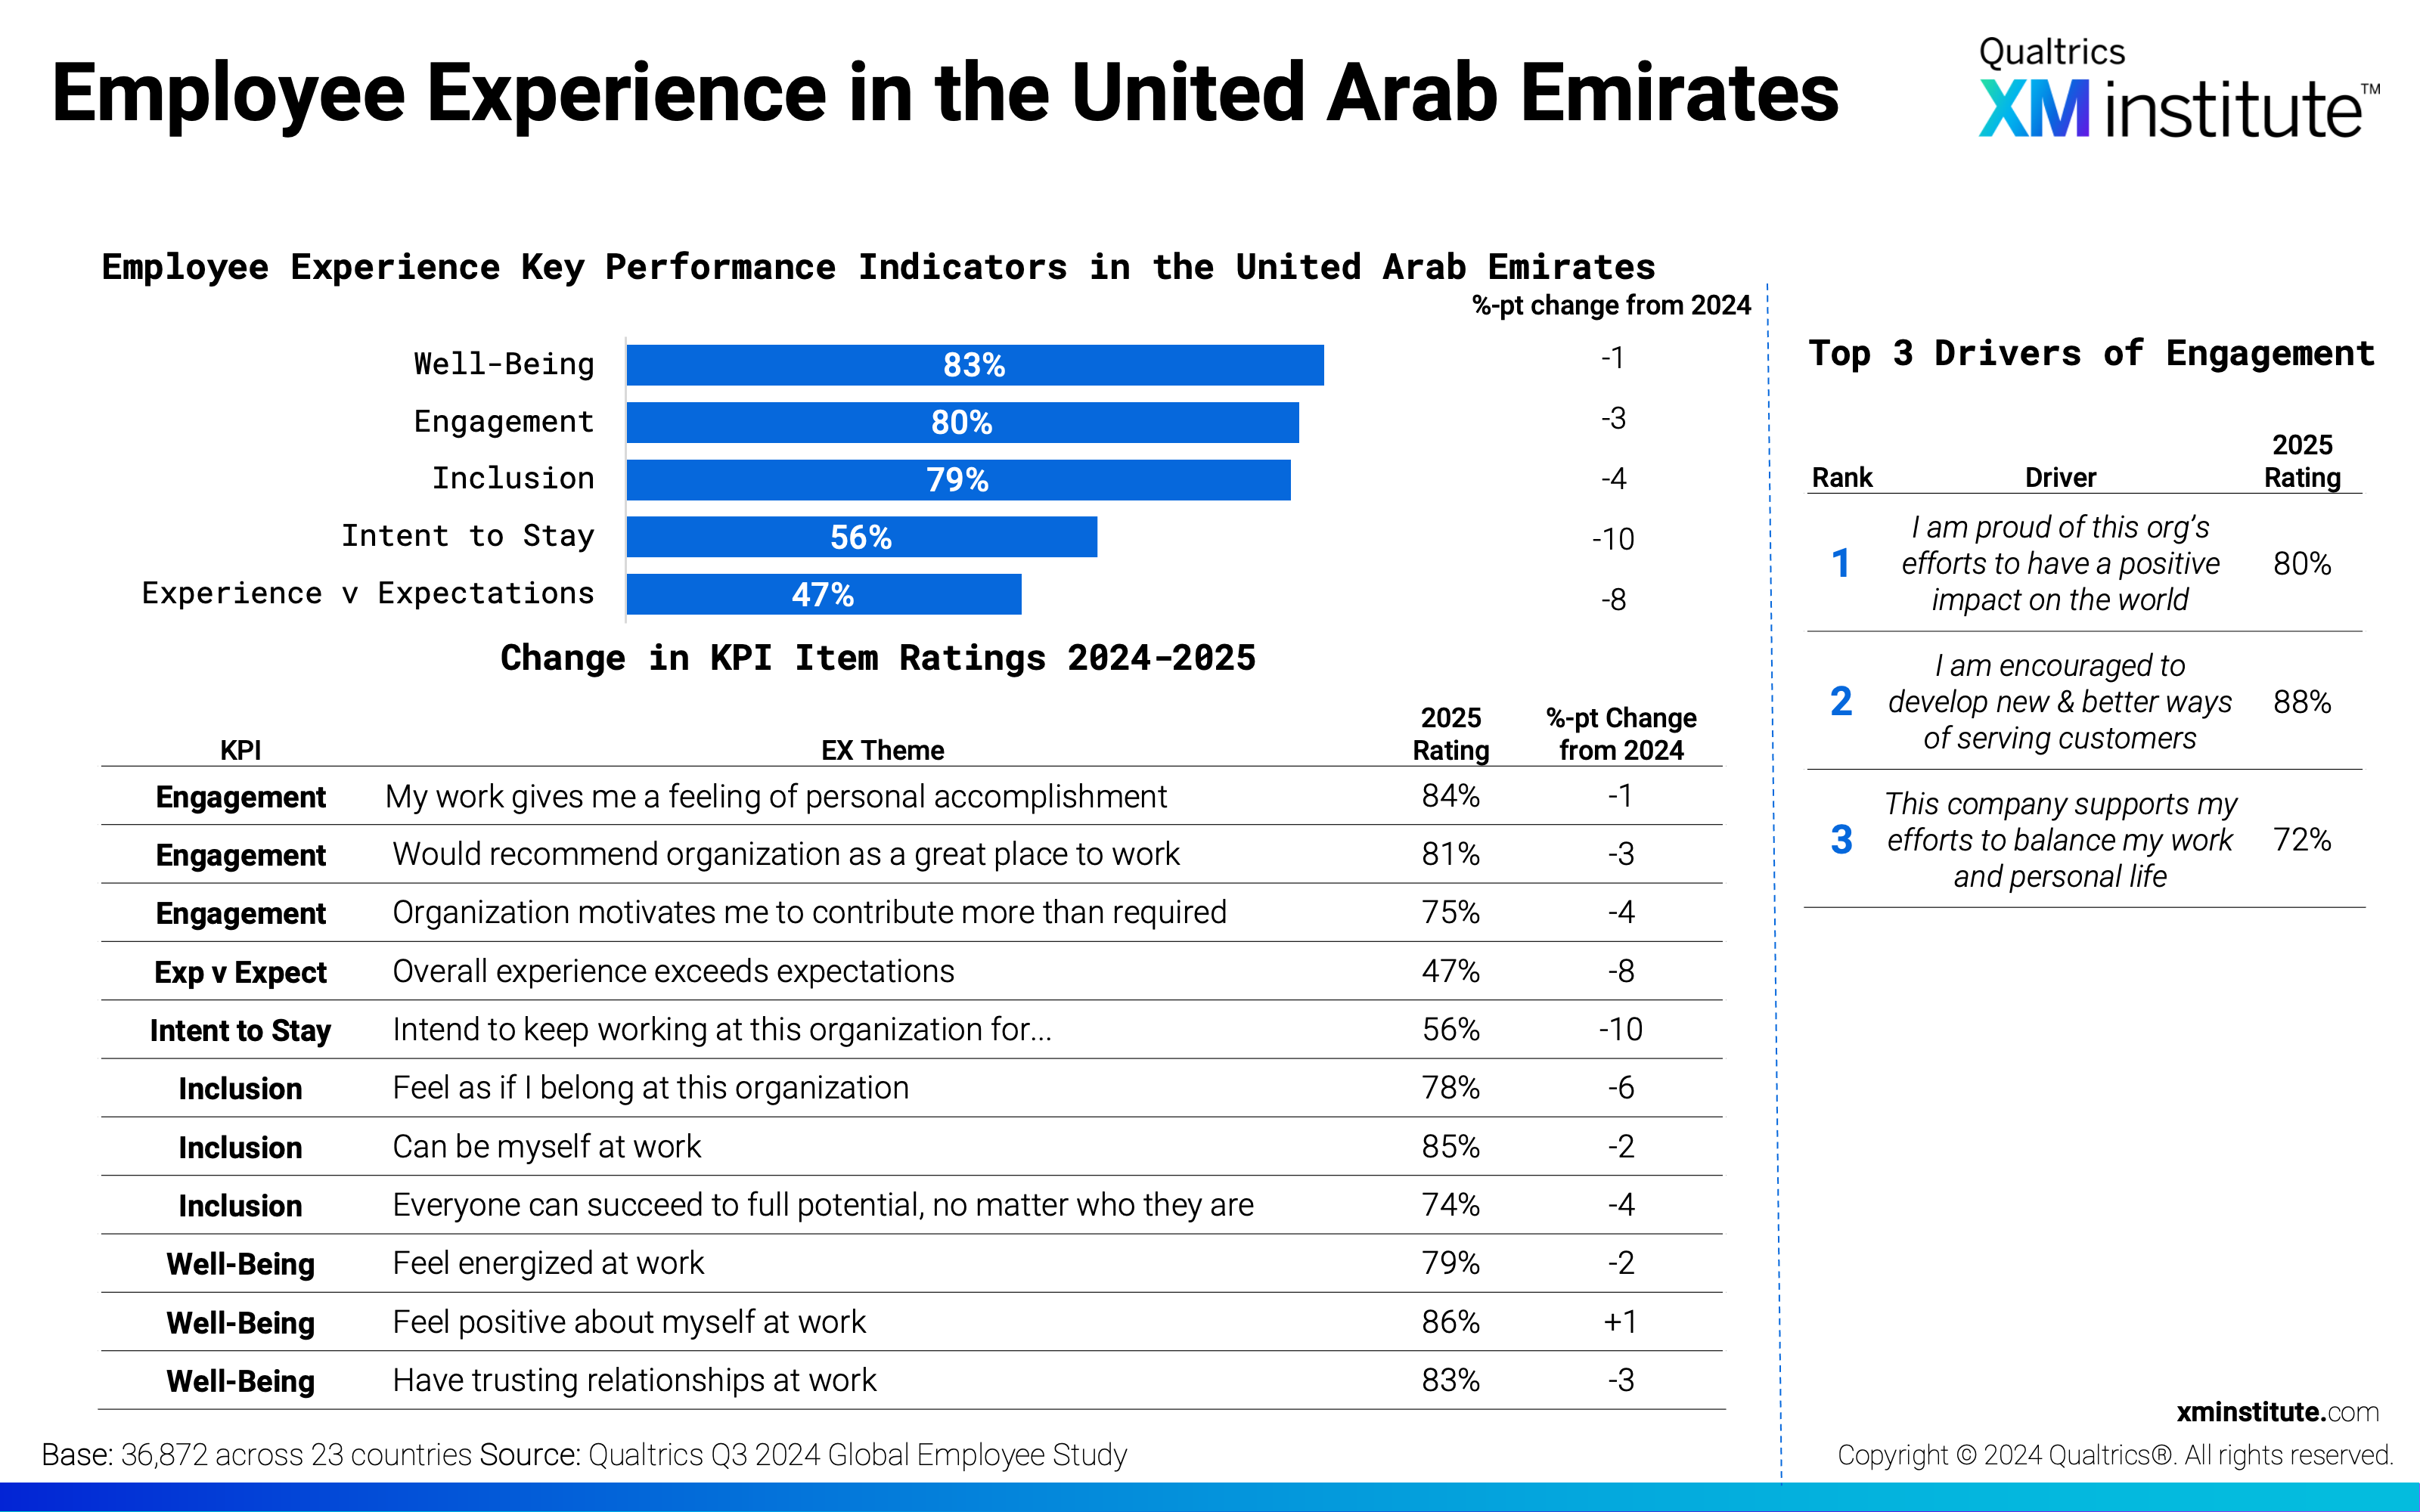
- Employee Experience in the United Arab Emirates (see Figure 17)
- Employee Experience in the United Kingdom (see Figure 18)
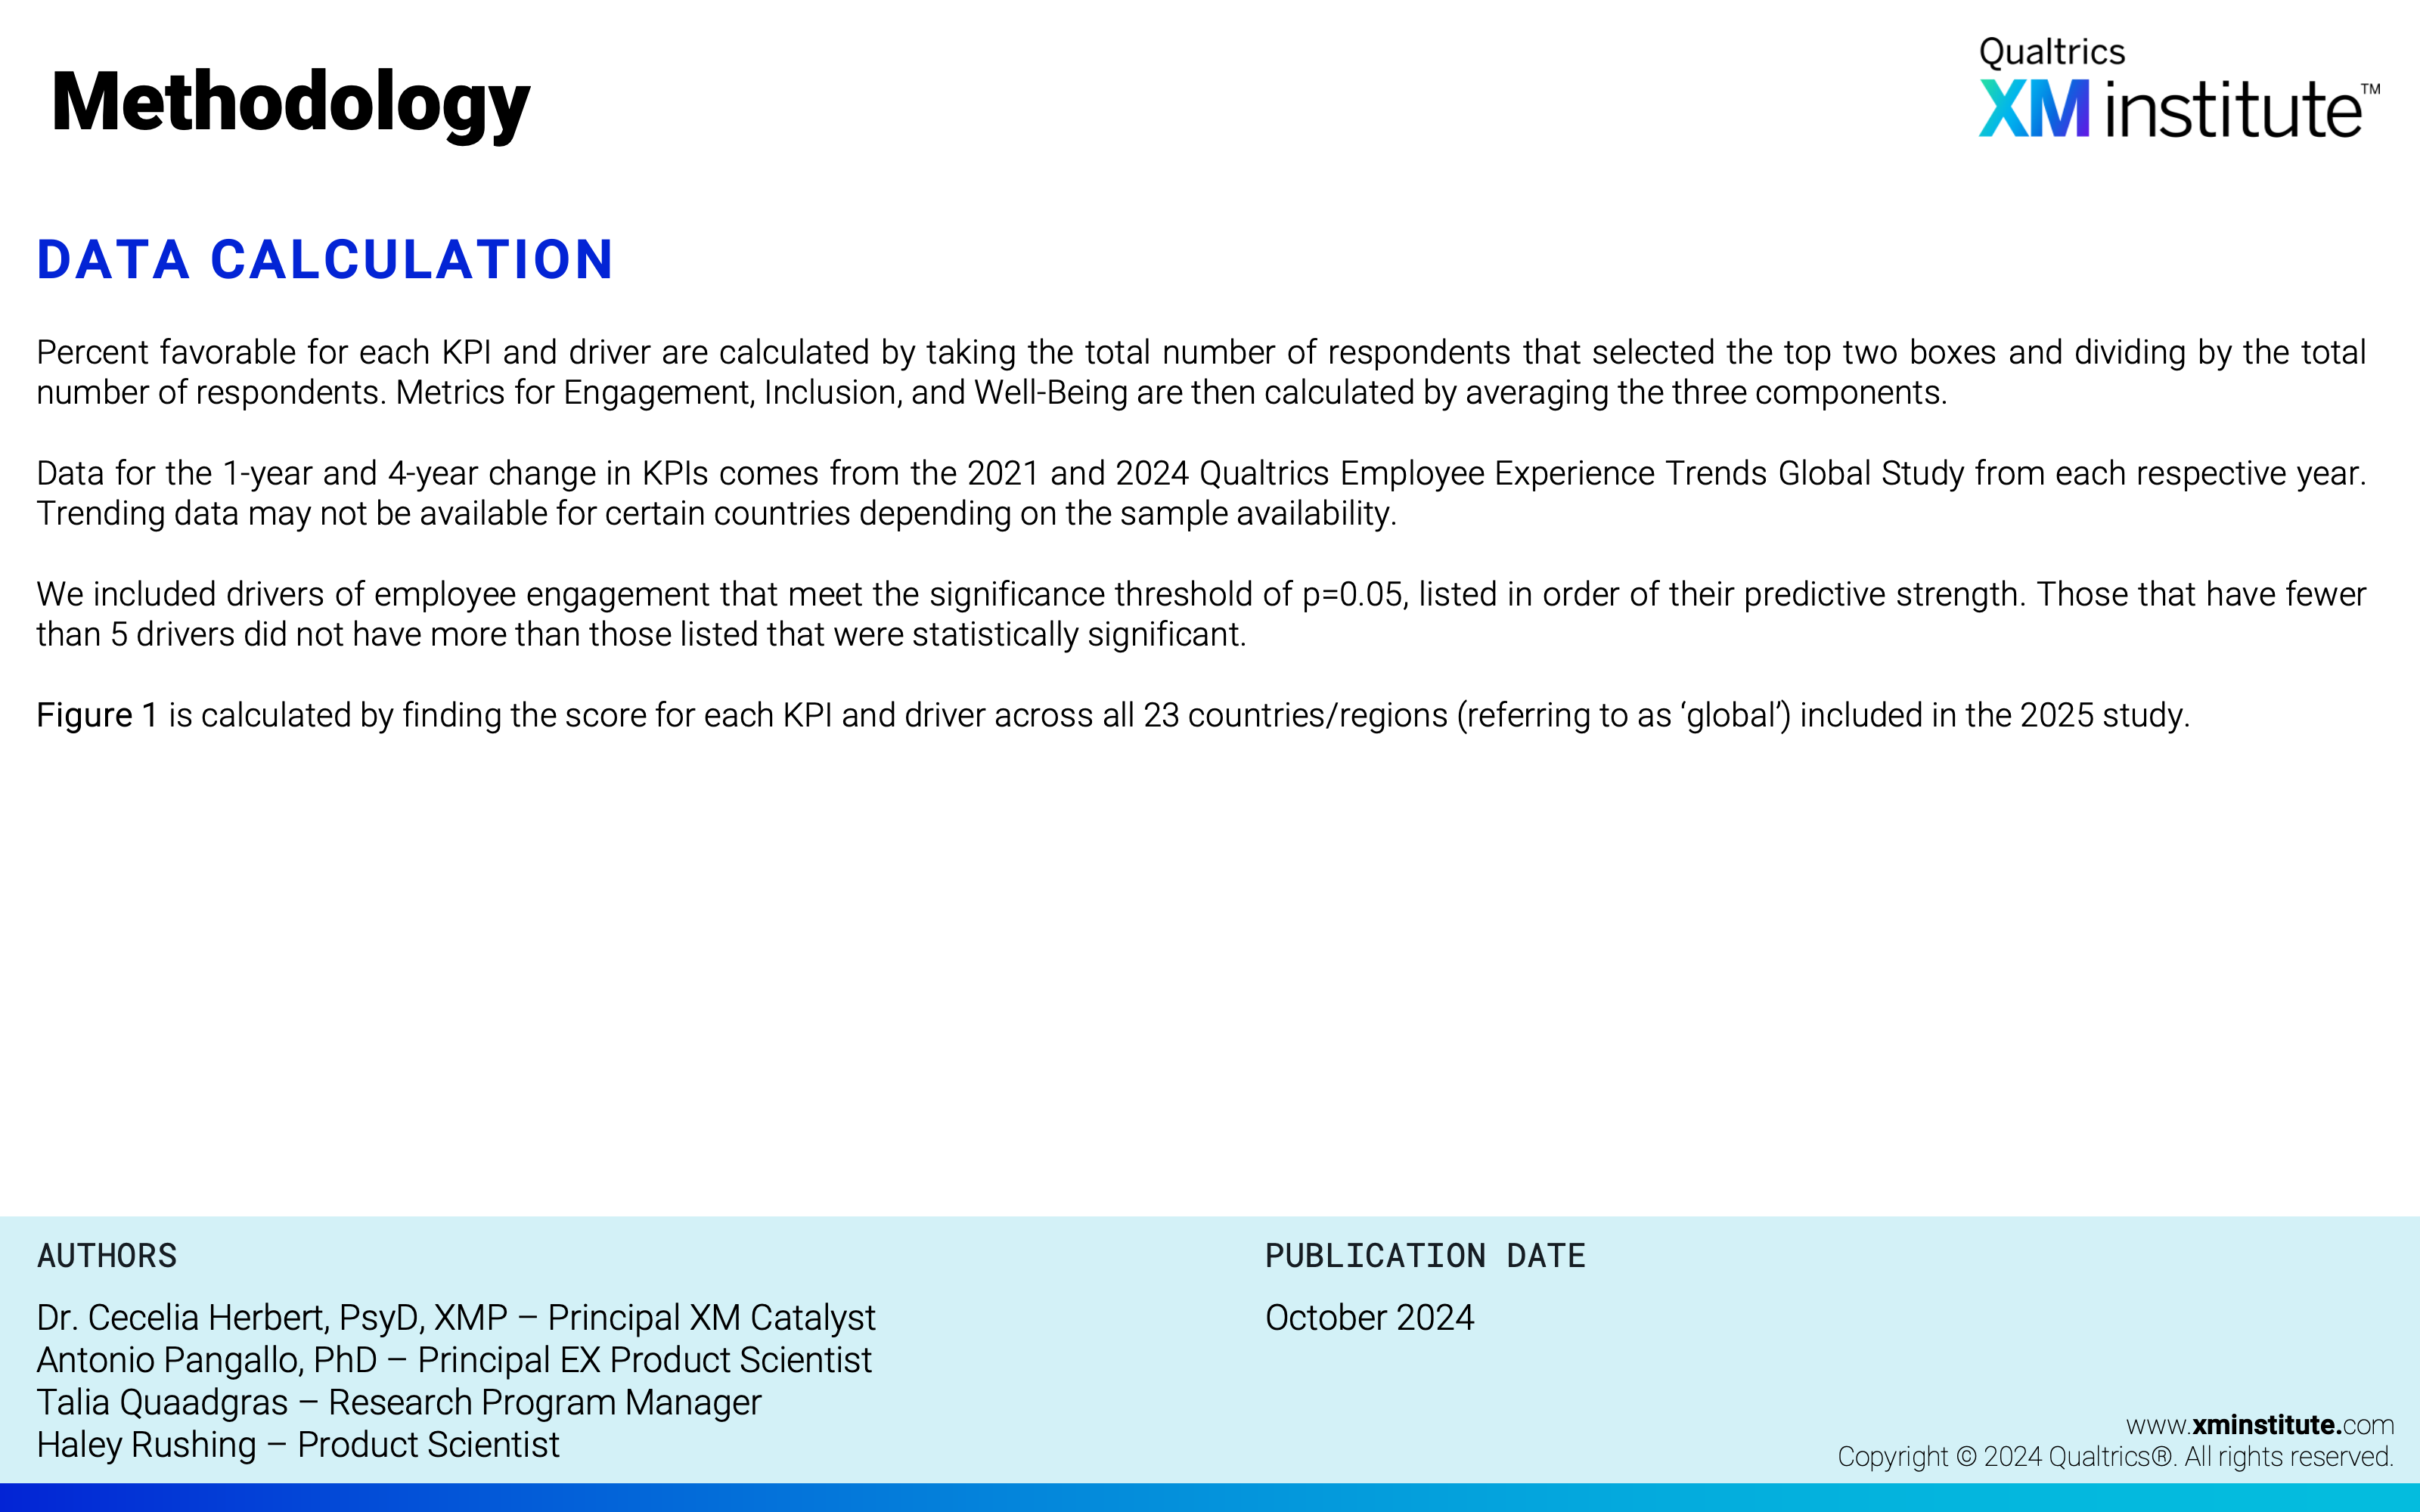
- Methodology (see Figure 19)