Key Findings
This study examined consumers’ poor experiences and associated spending changes across 17 industries and 18 countries. Key highlights include:
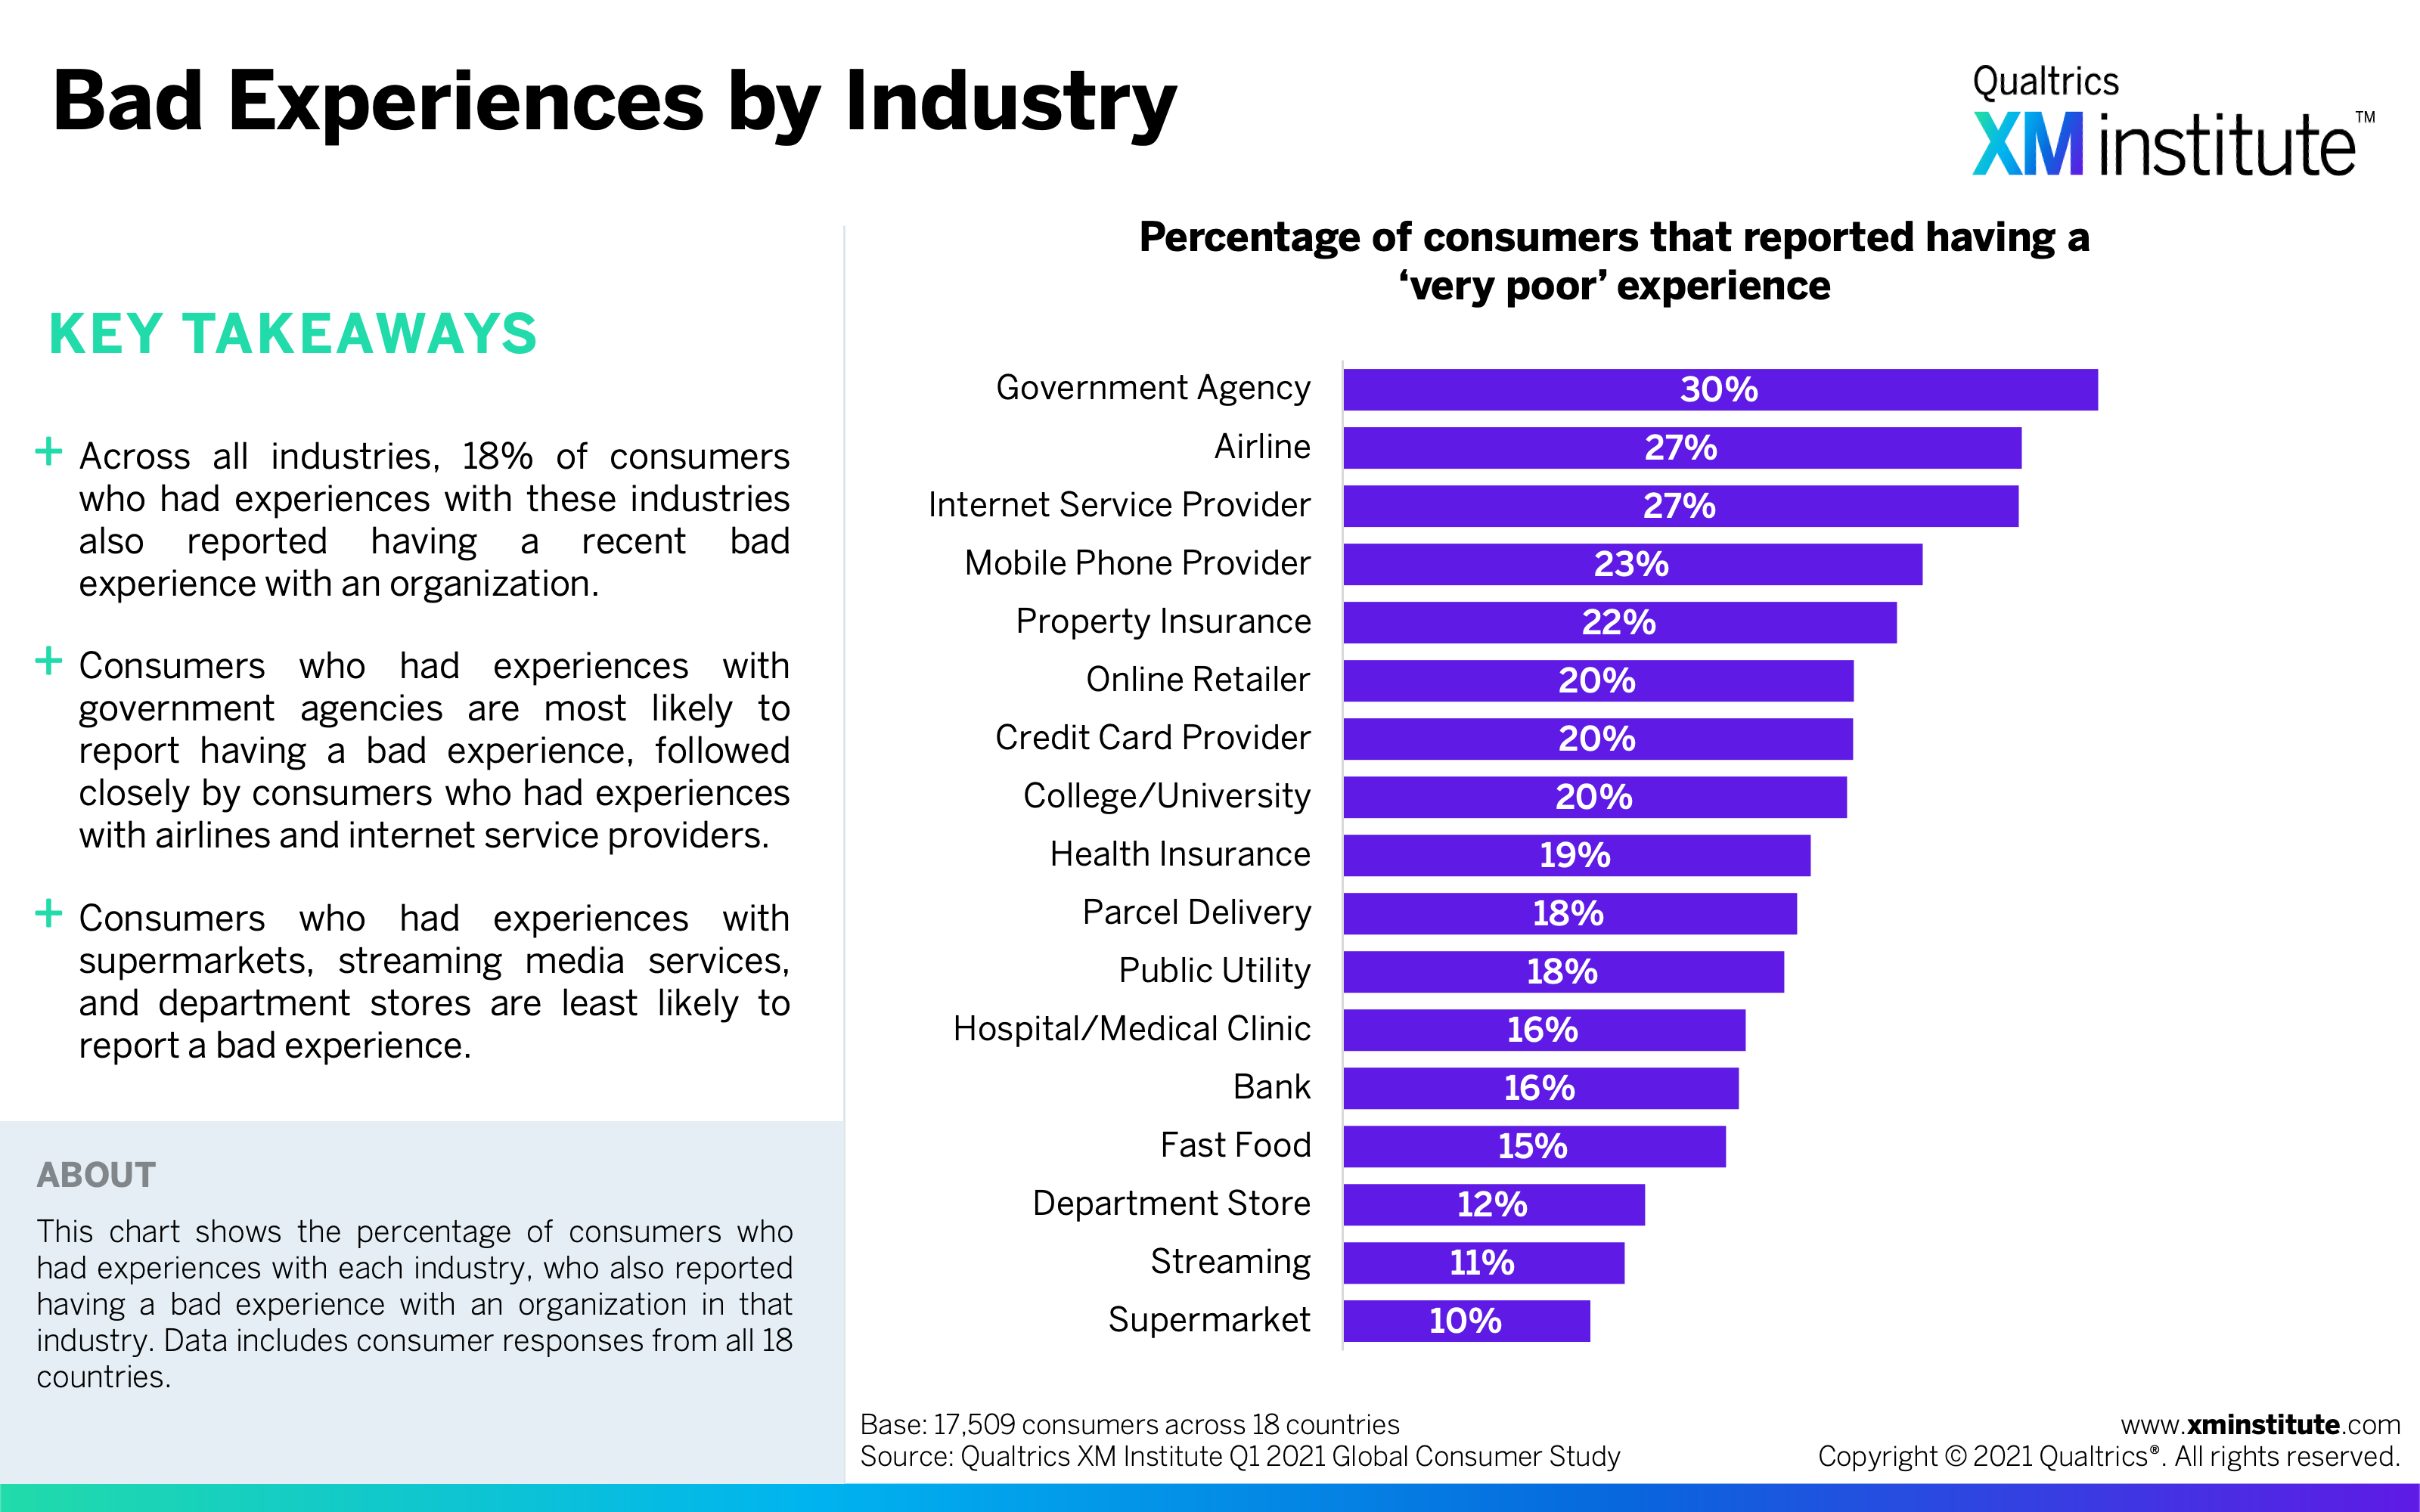
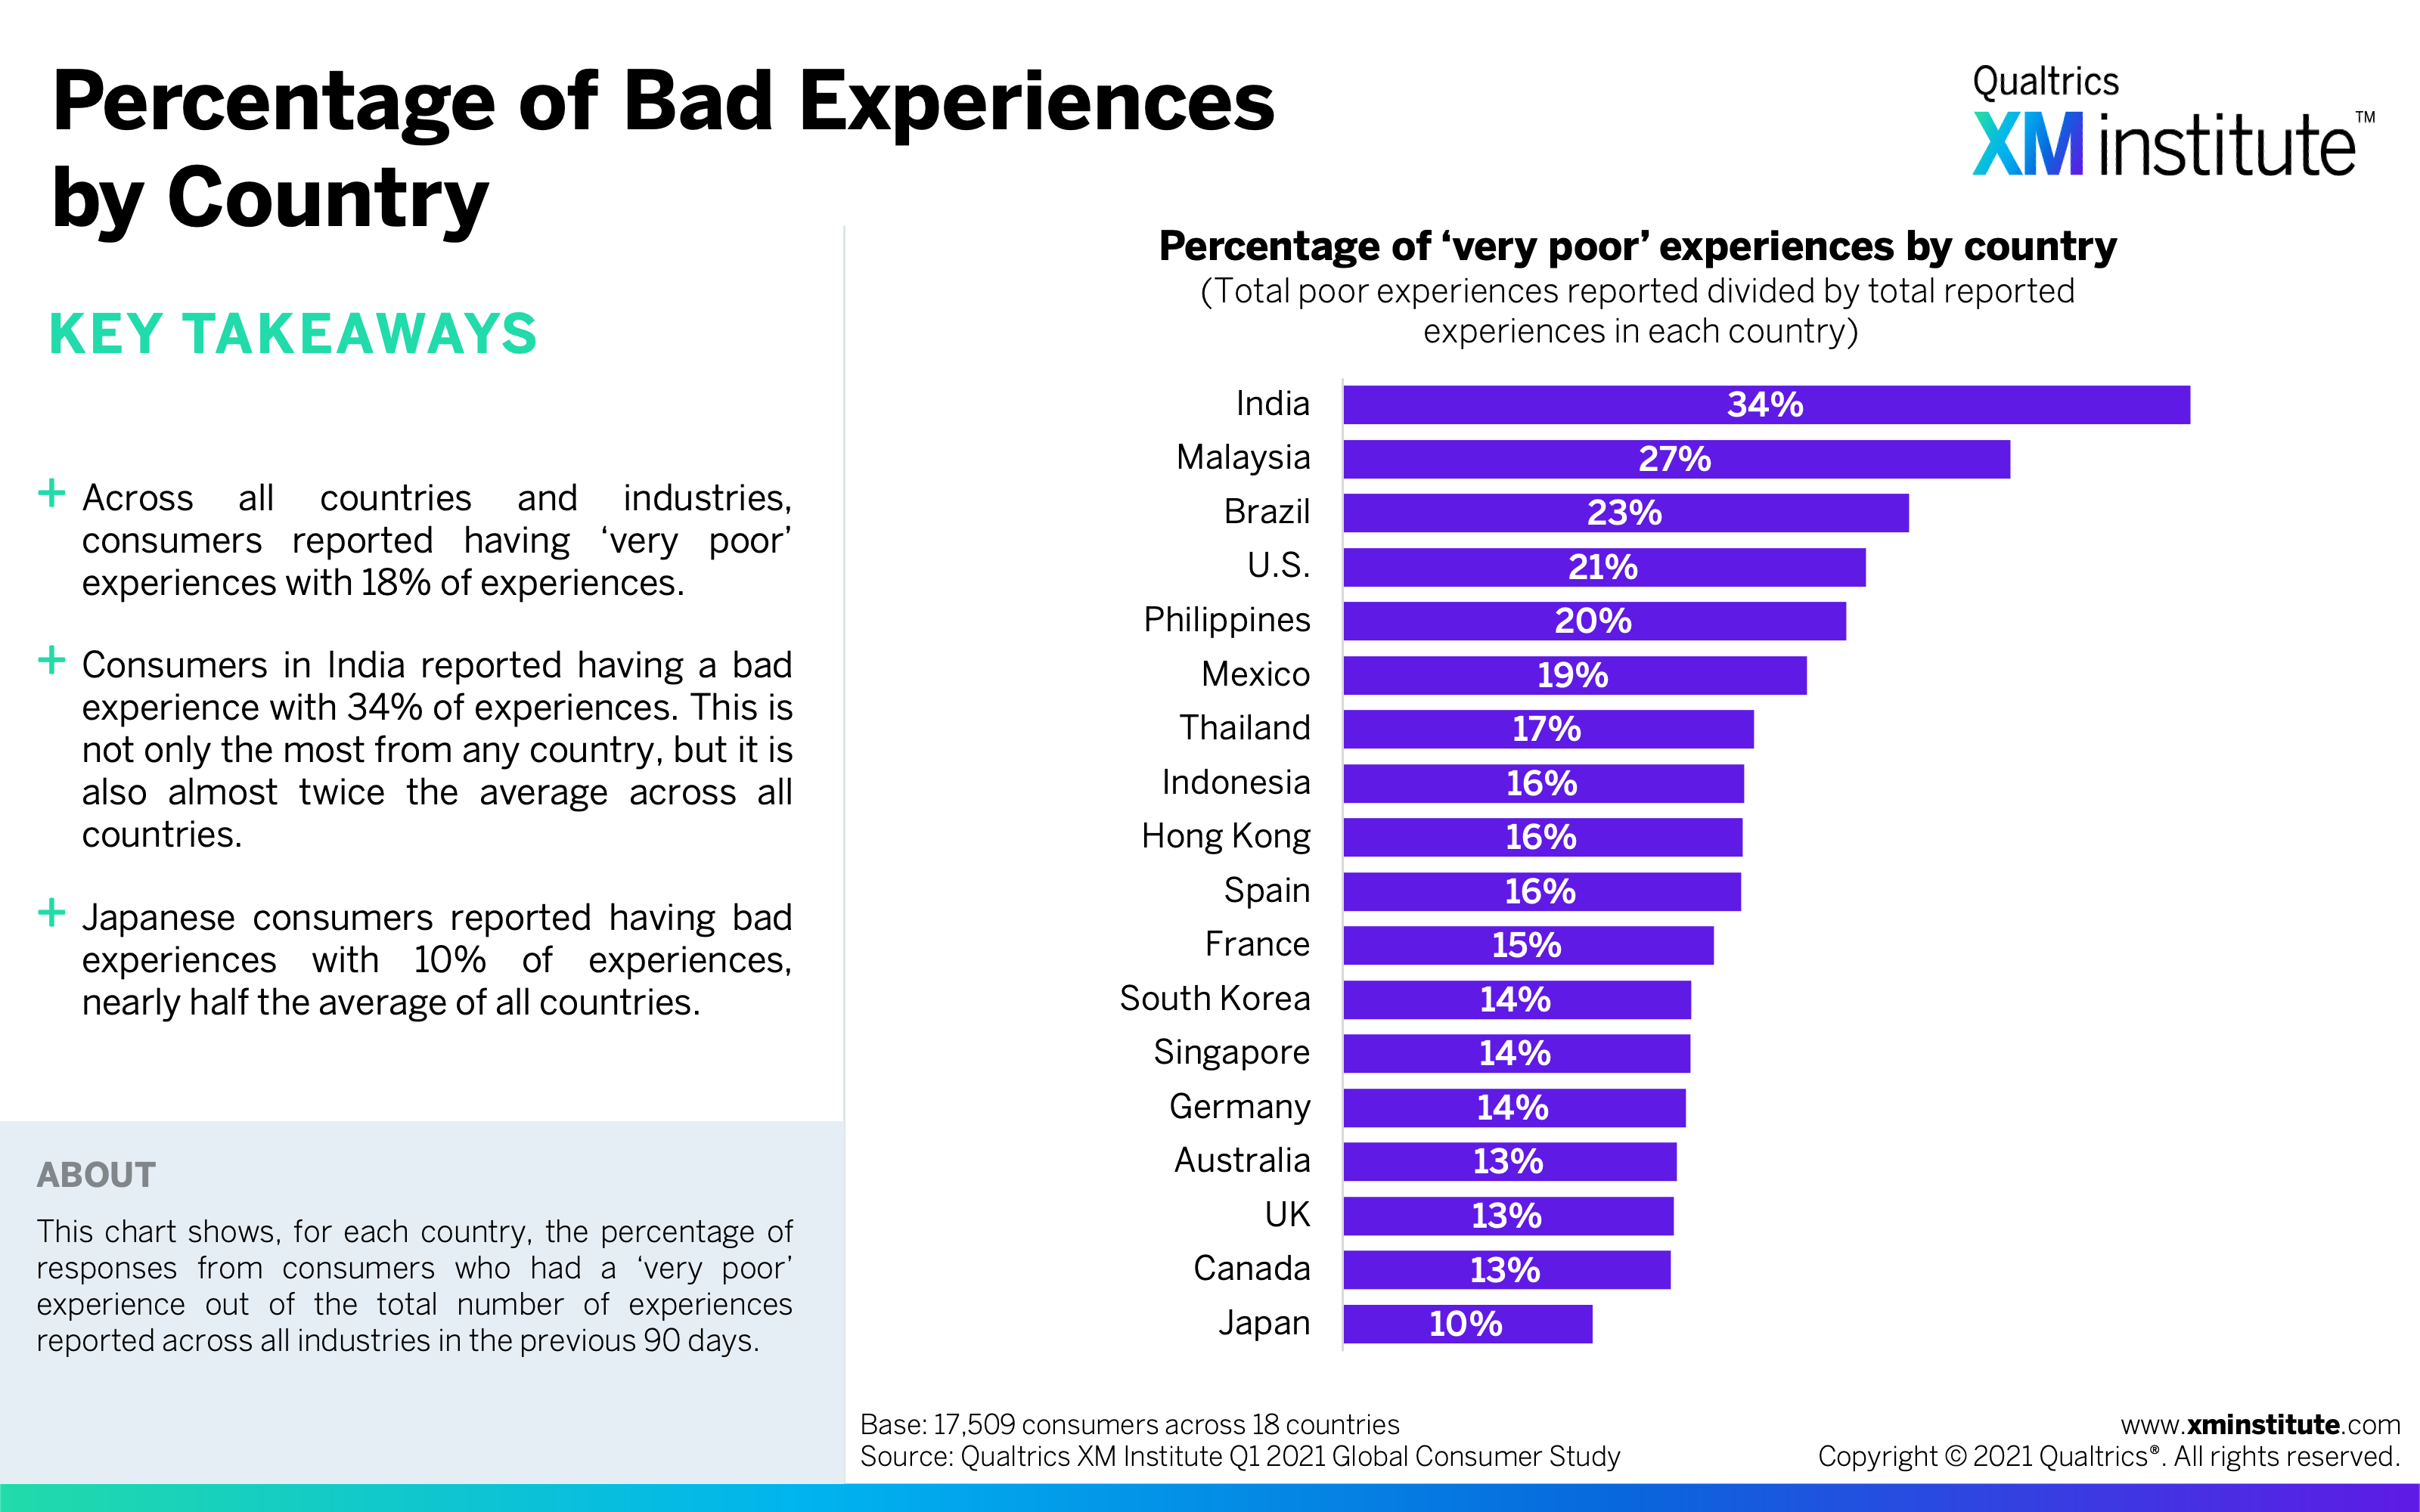
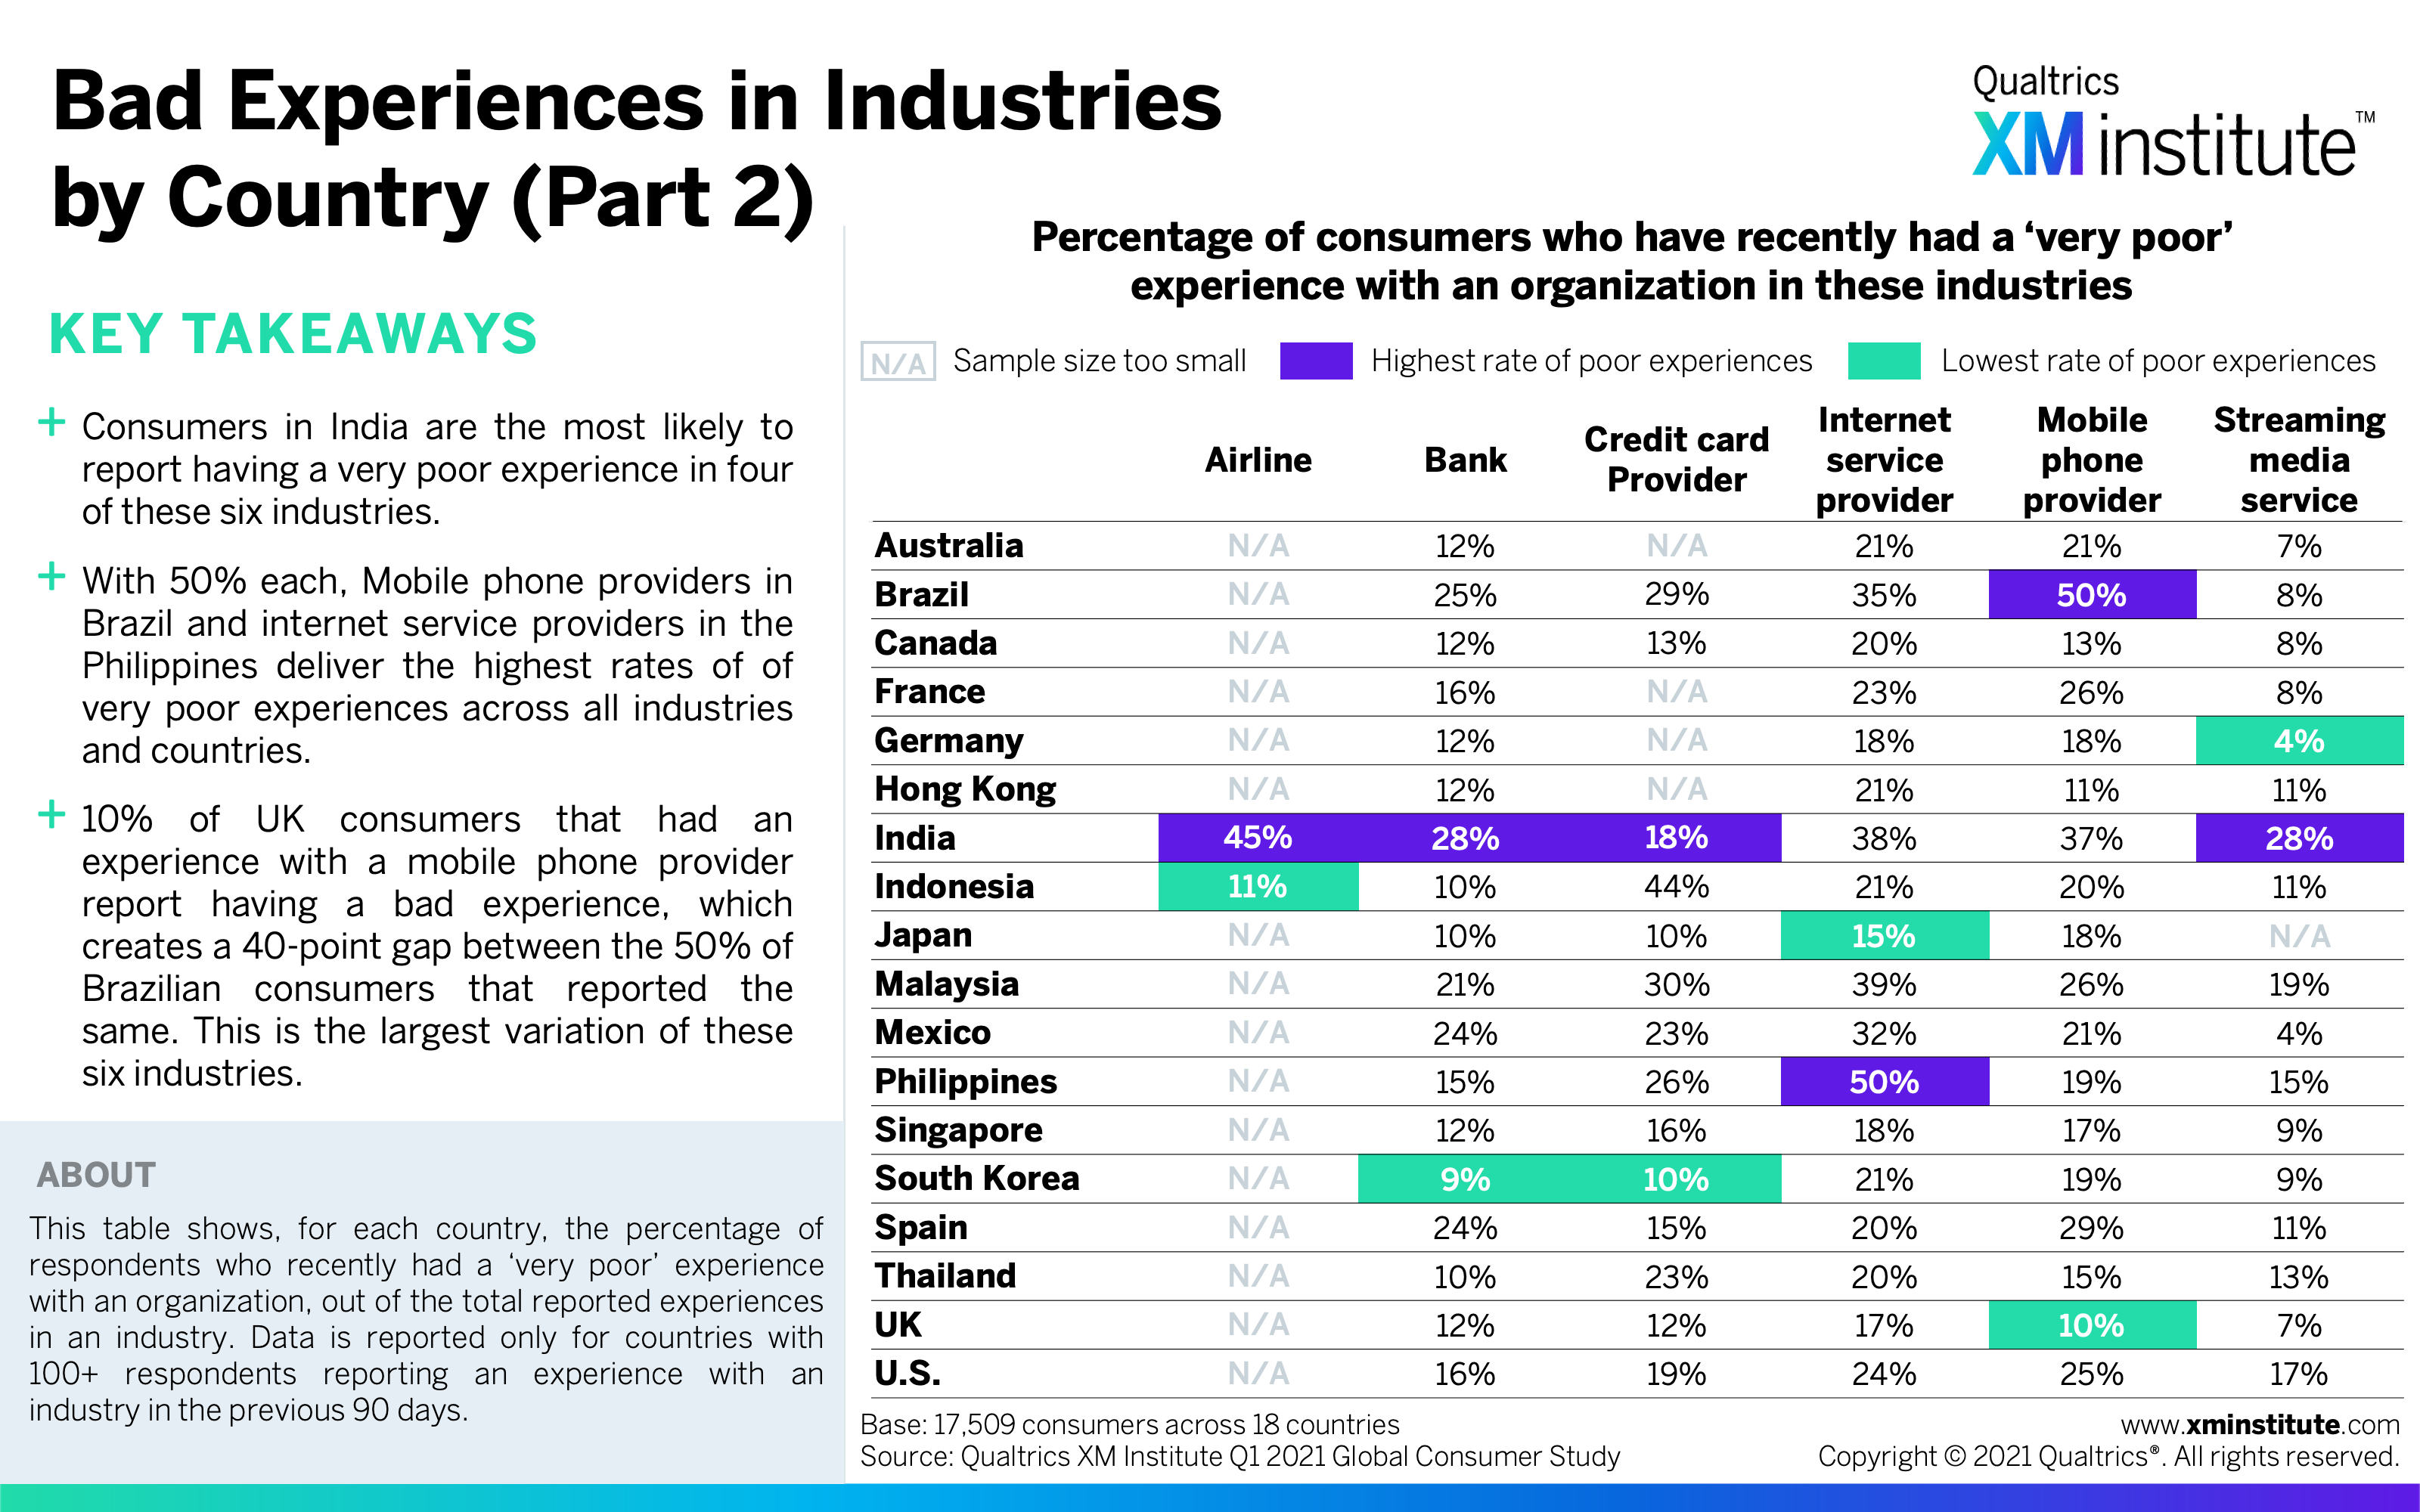
- Organizations disappoint in nearly 1 in 5 experiences. On average, consumers report having a bad experience with 18% of experiences, ranging from a high of 34% in India down to a low of 10% in Japan. Mobile phone providers in Brazil and internet service providers in the Philippines produce the highest rates of very poor experiences; fifty percent of people that had experiences in these industries reported having a bad experience.
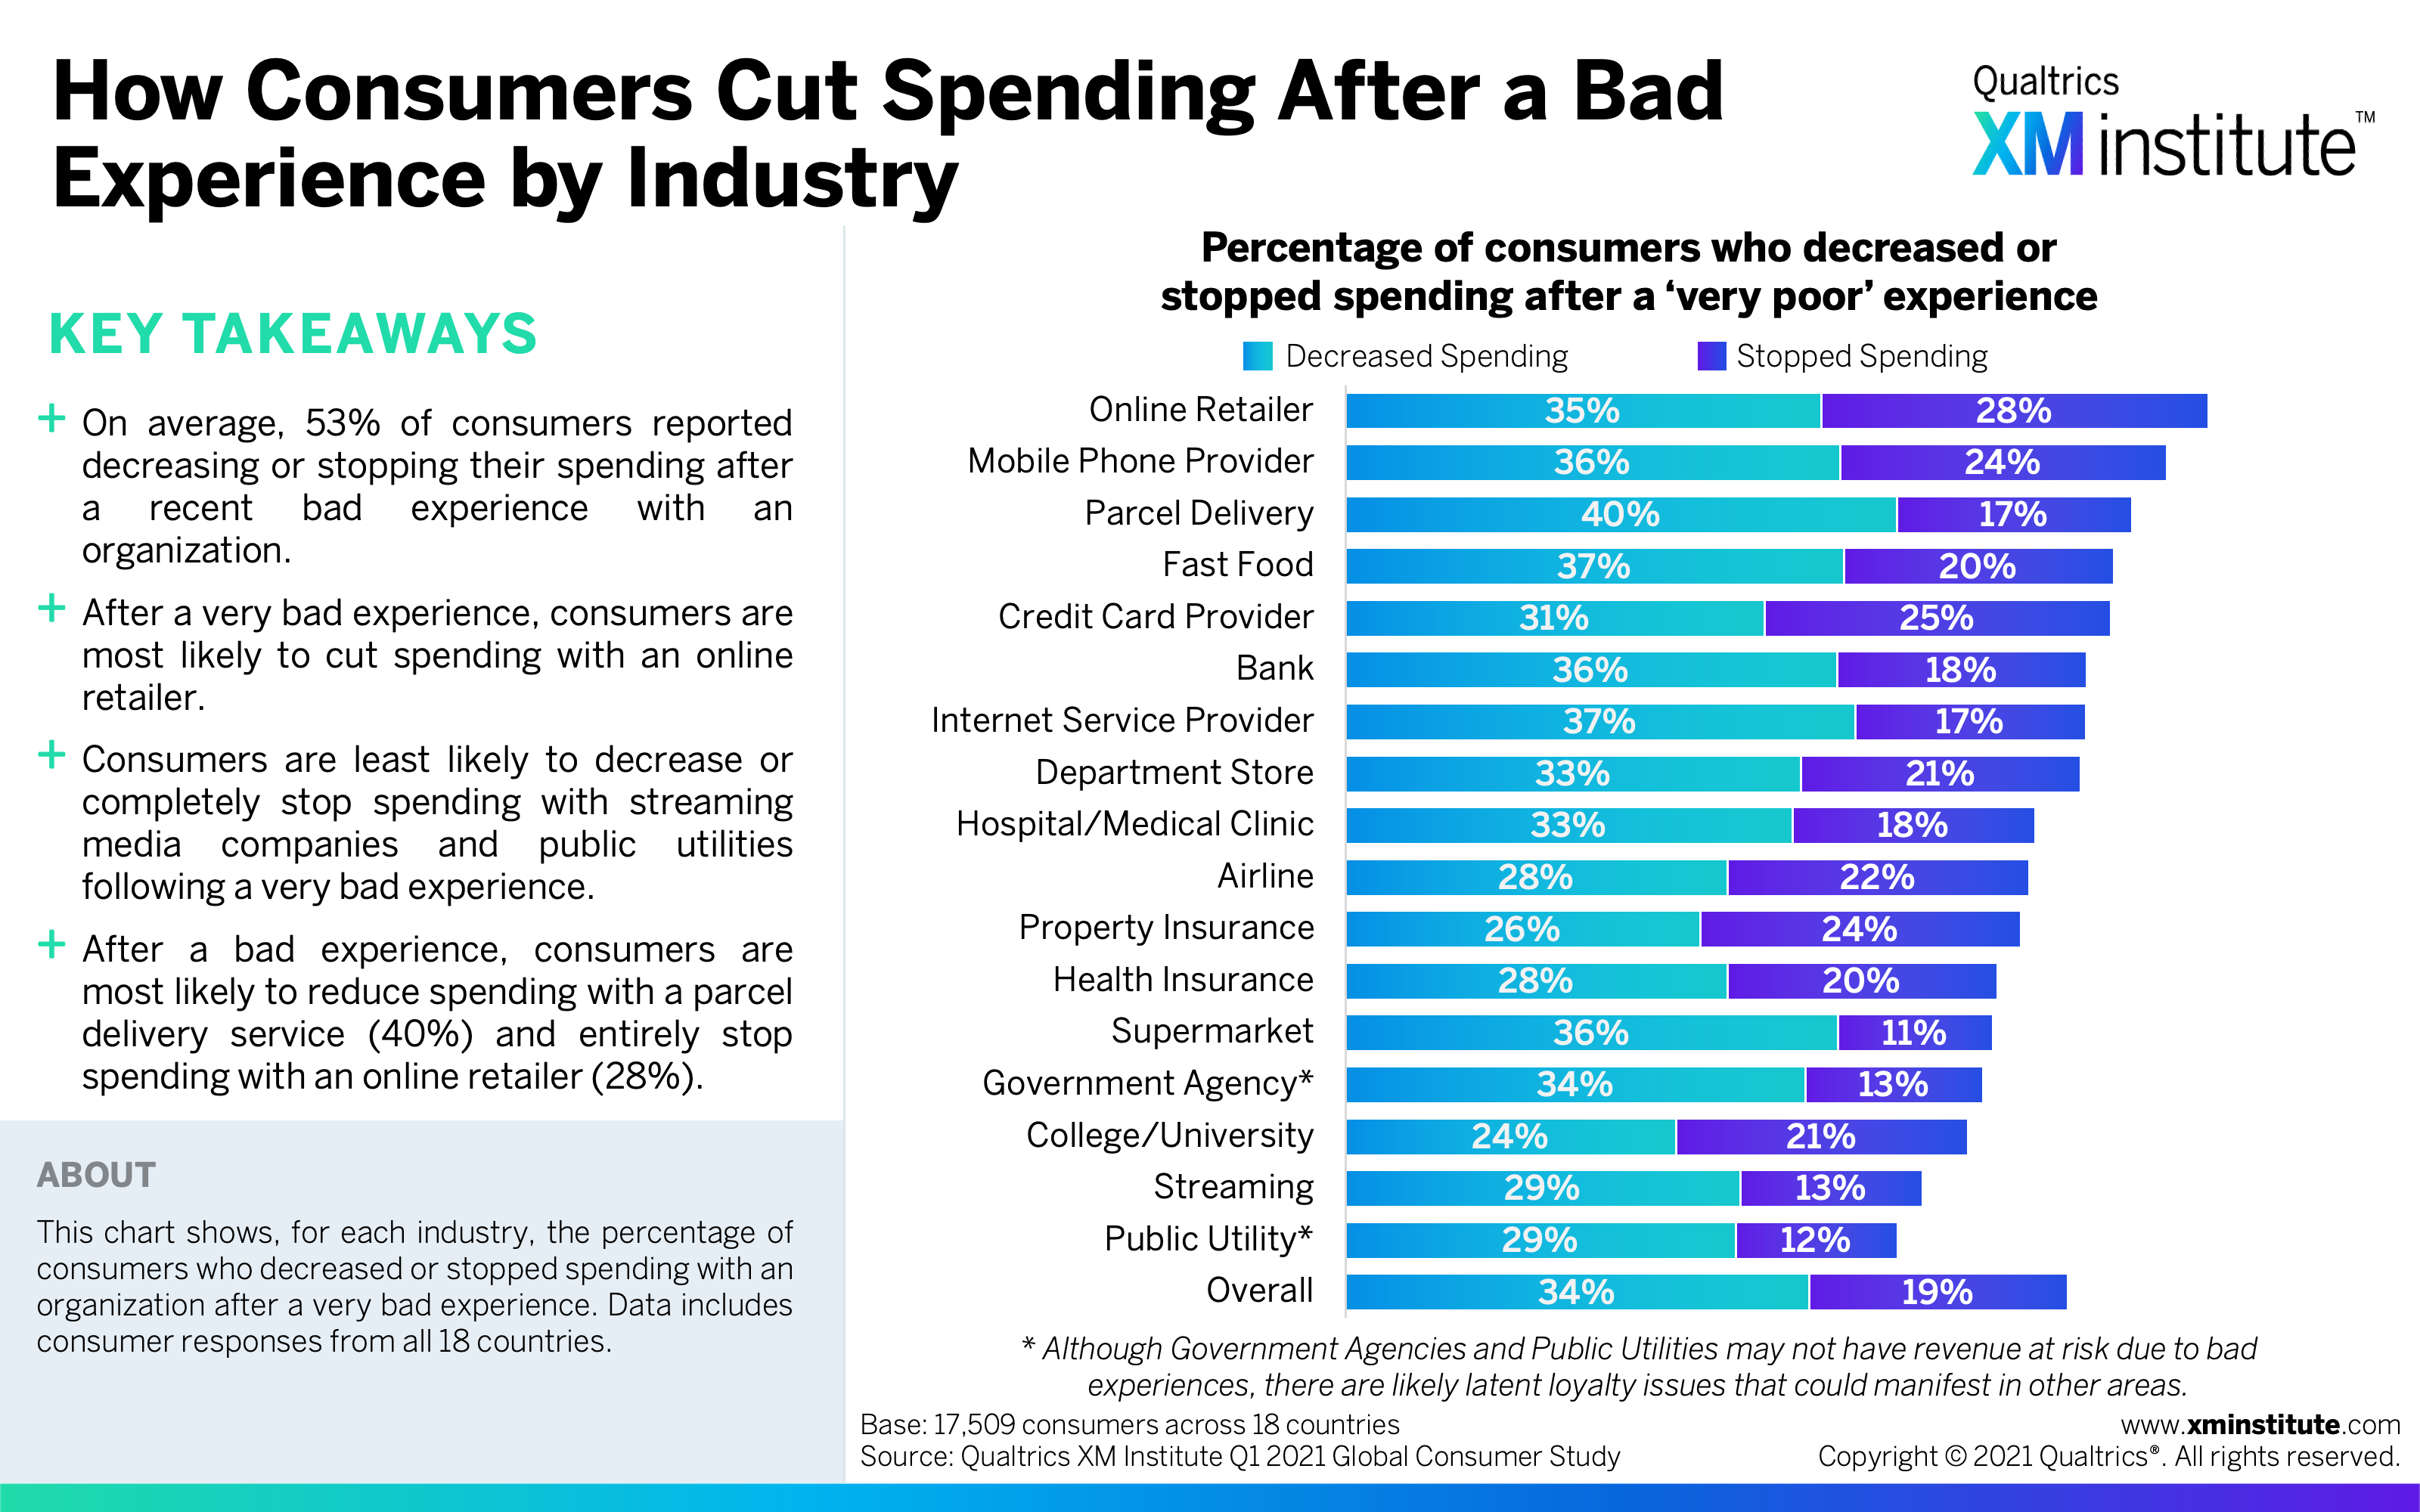
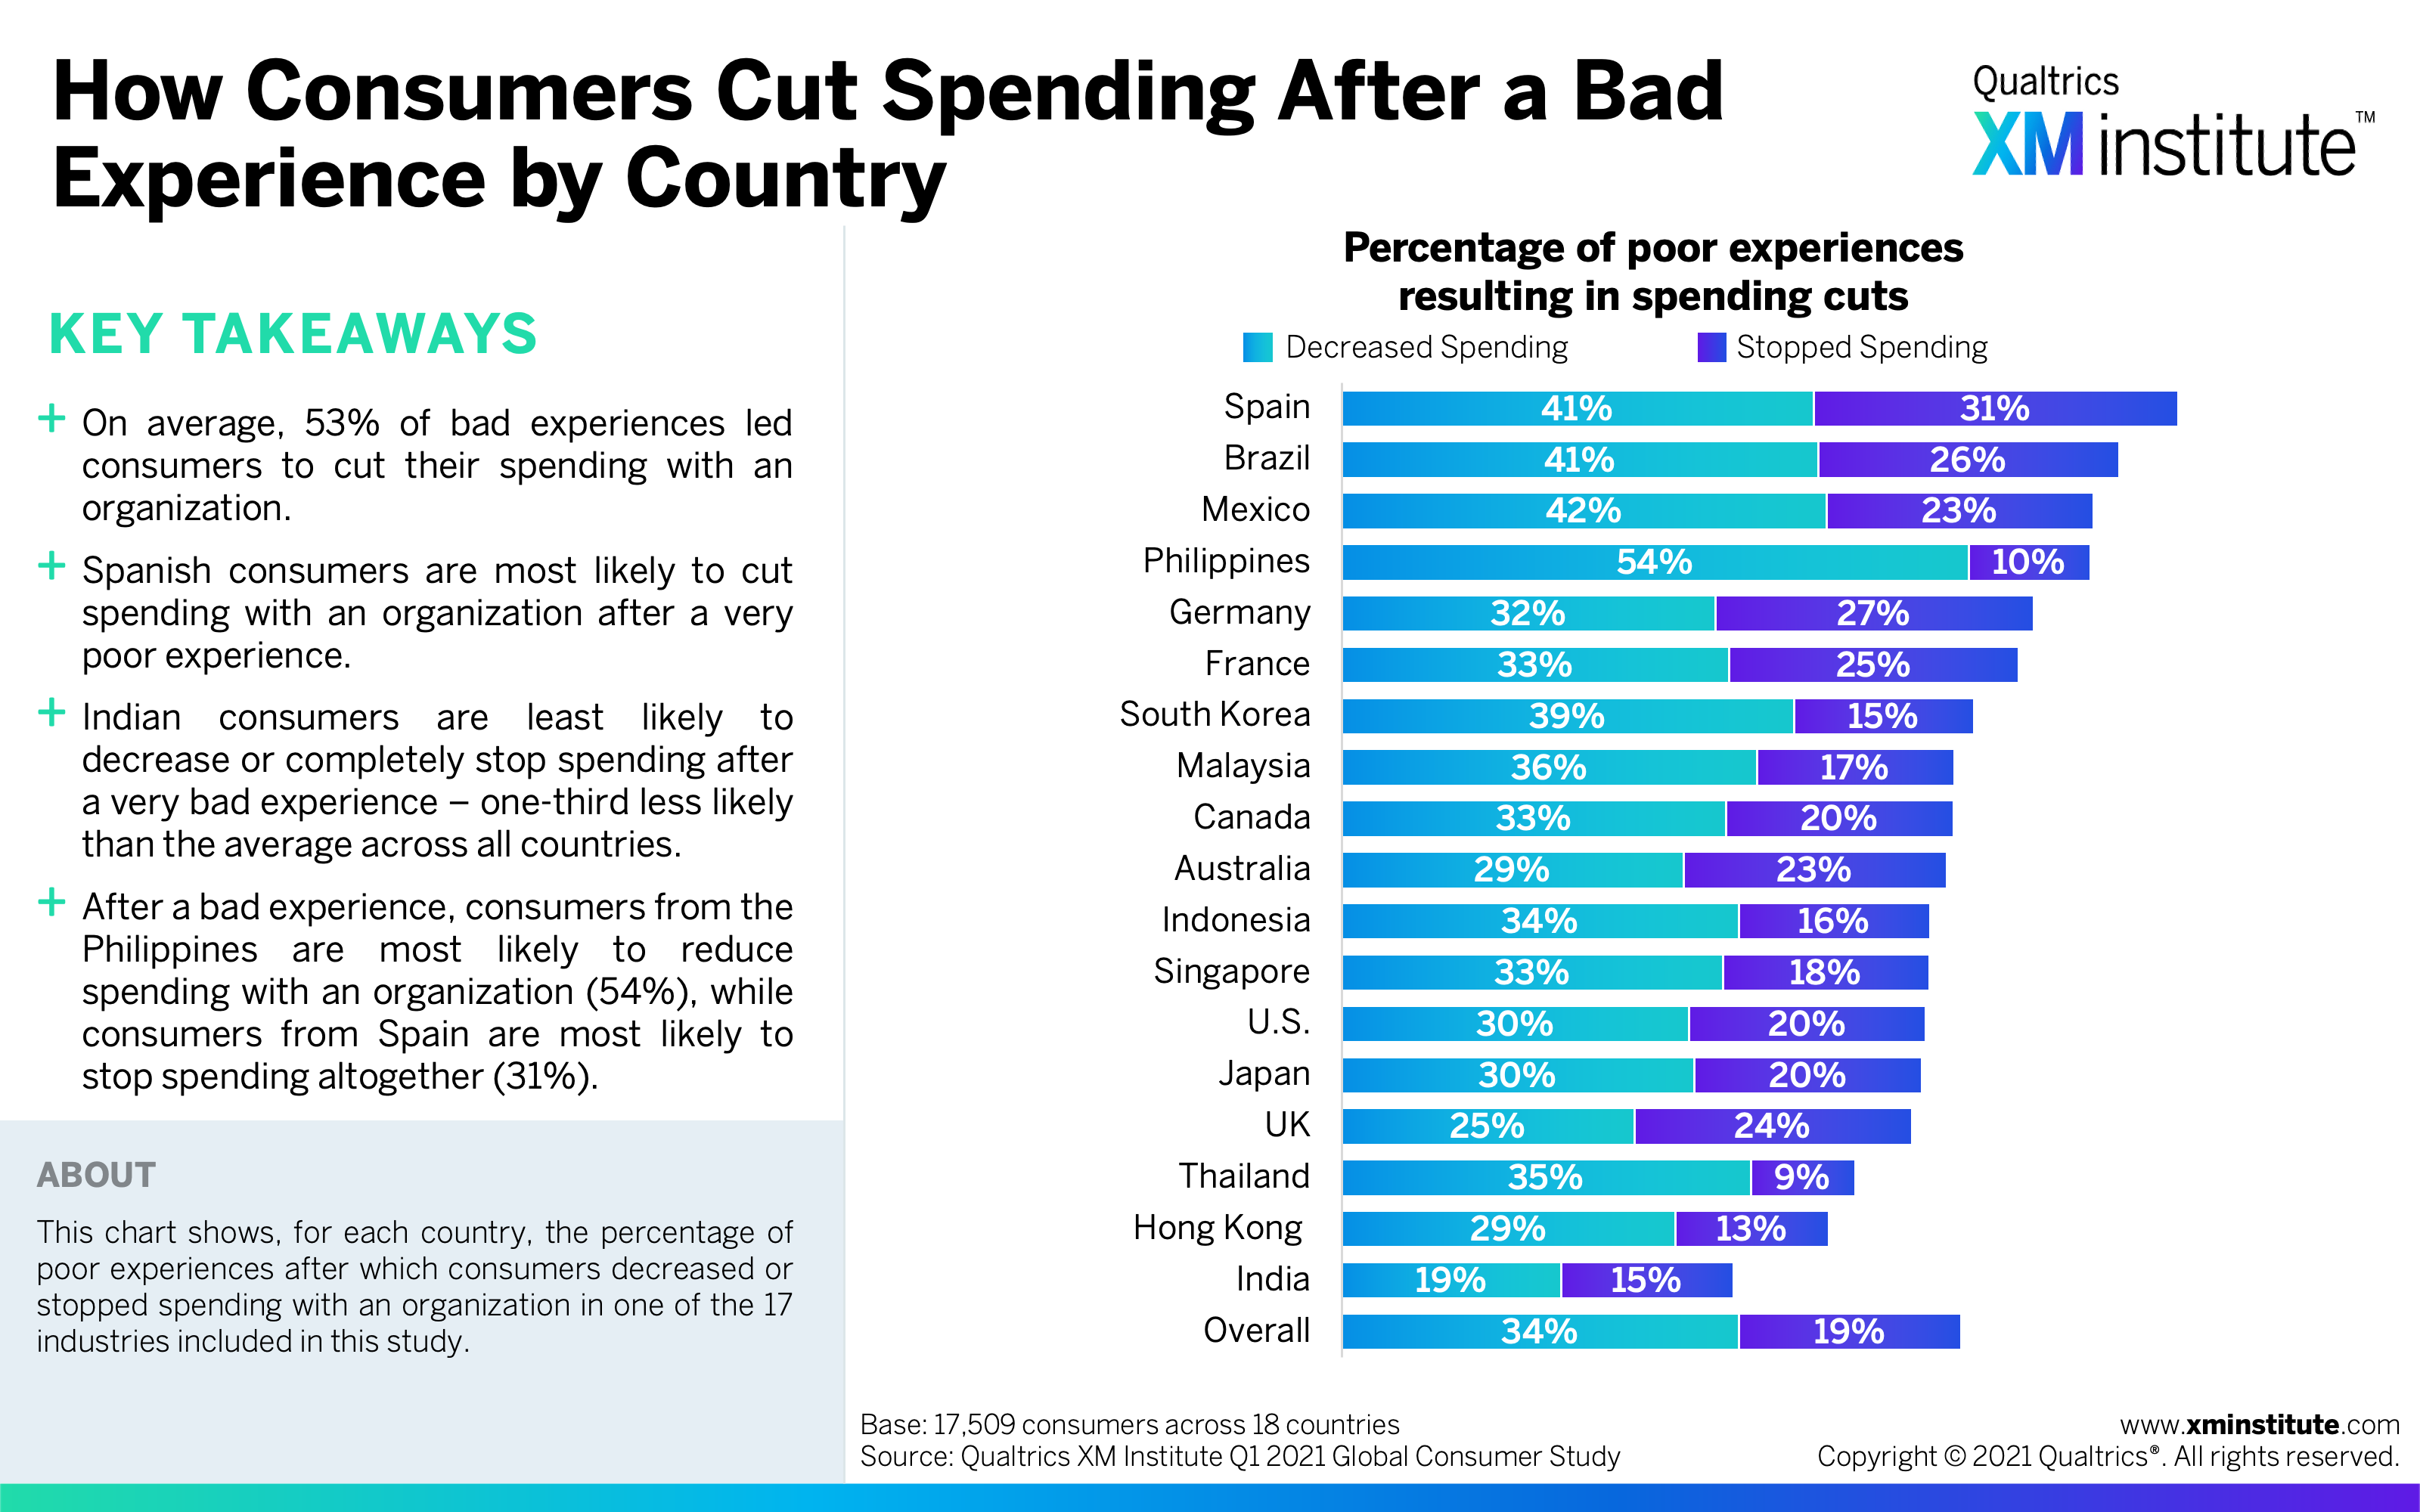
- Consumers cut spending after bad experiences. Across all industries and countries, slightly more than half of consumers said they either decreased or stopped spending with an organization after a recent bad experience. Spanish customers are the most likely to reduce or stop spending after a very poor experience, while Indian customers are the least likely.
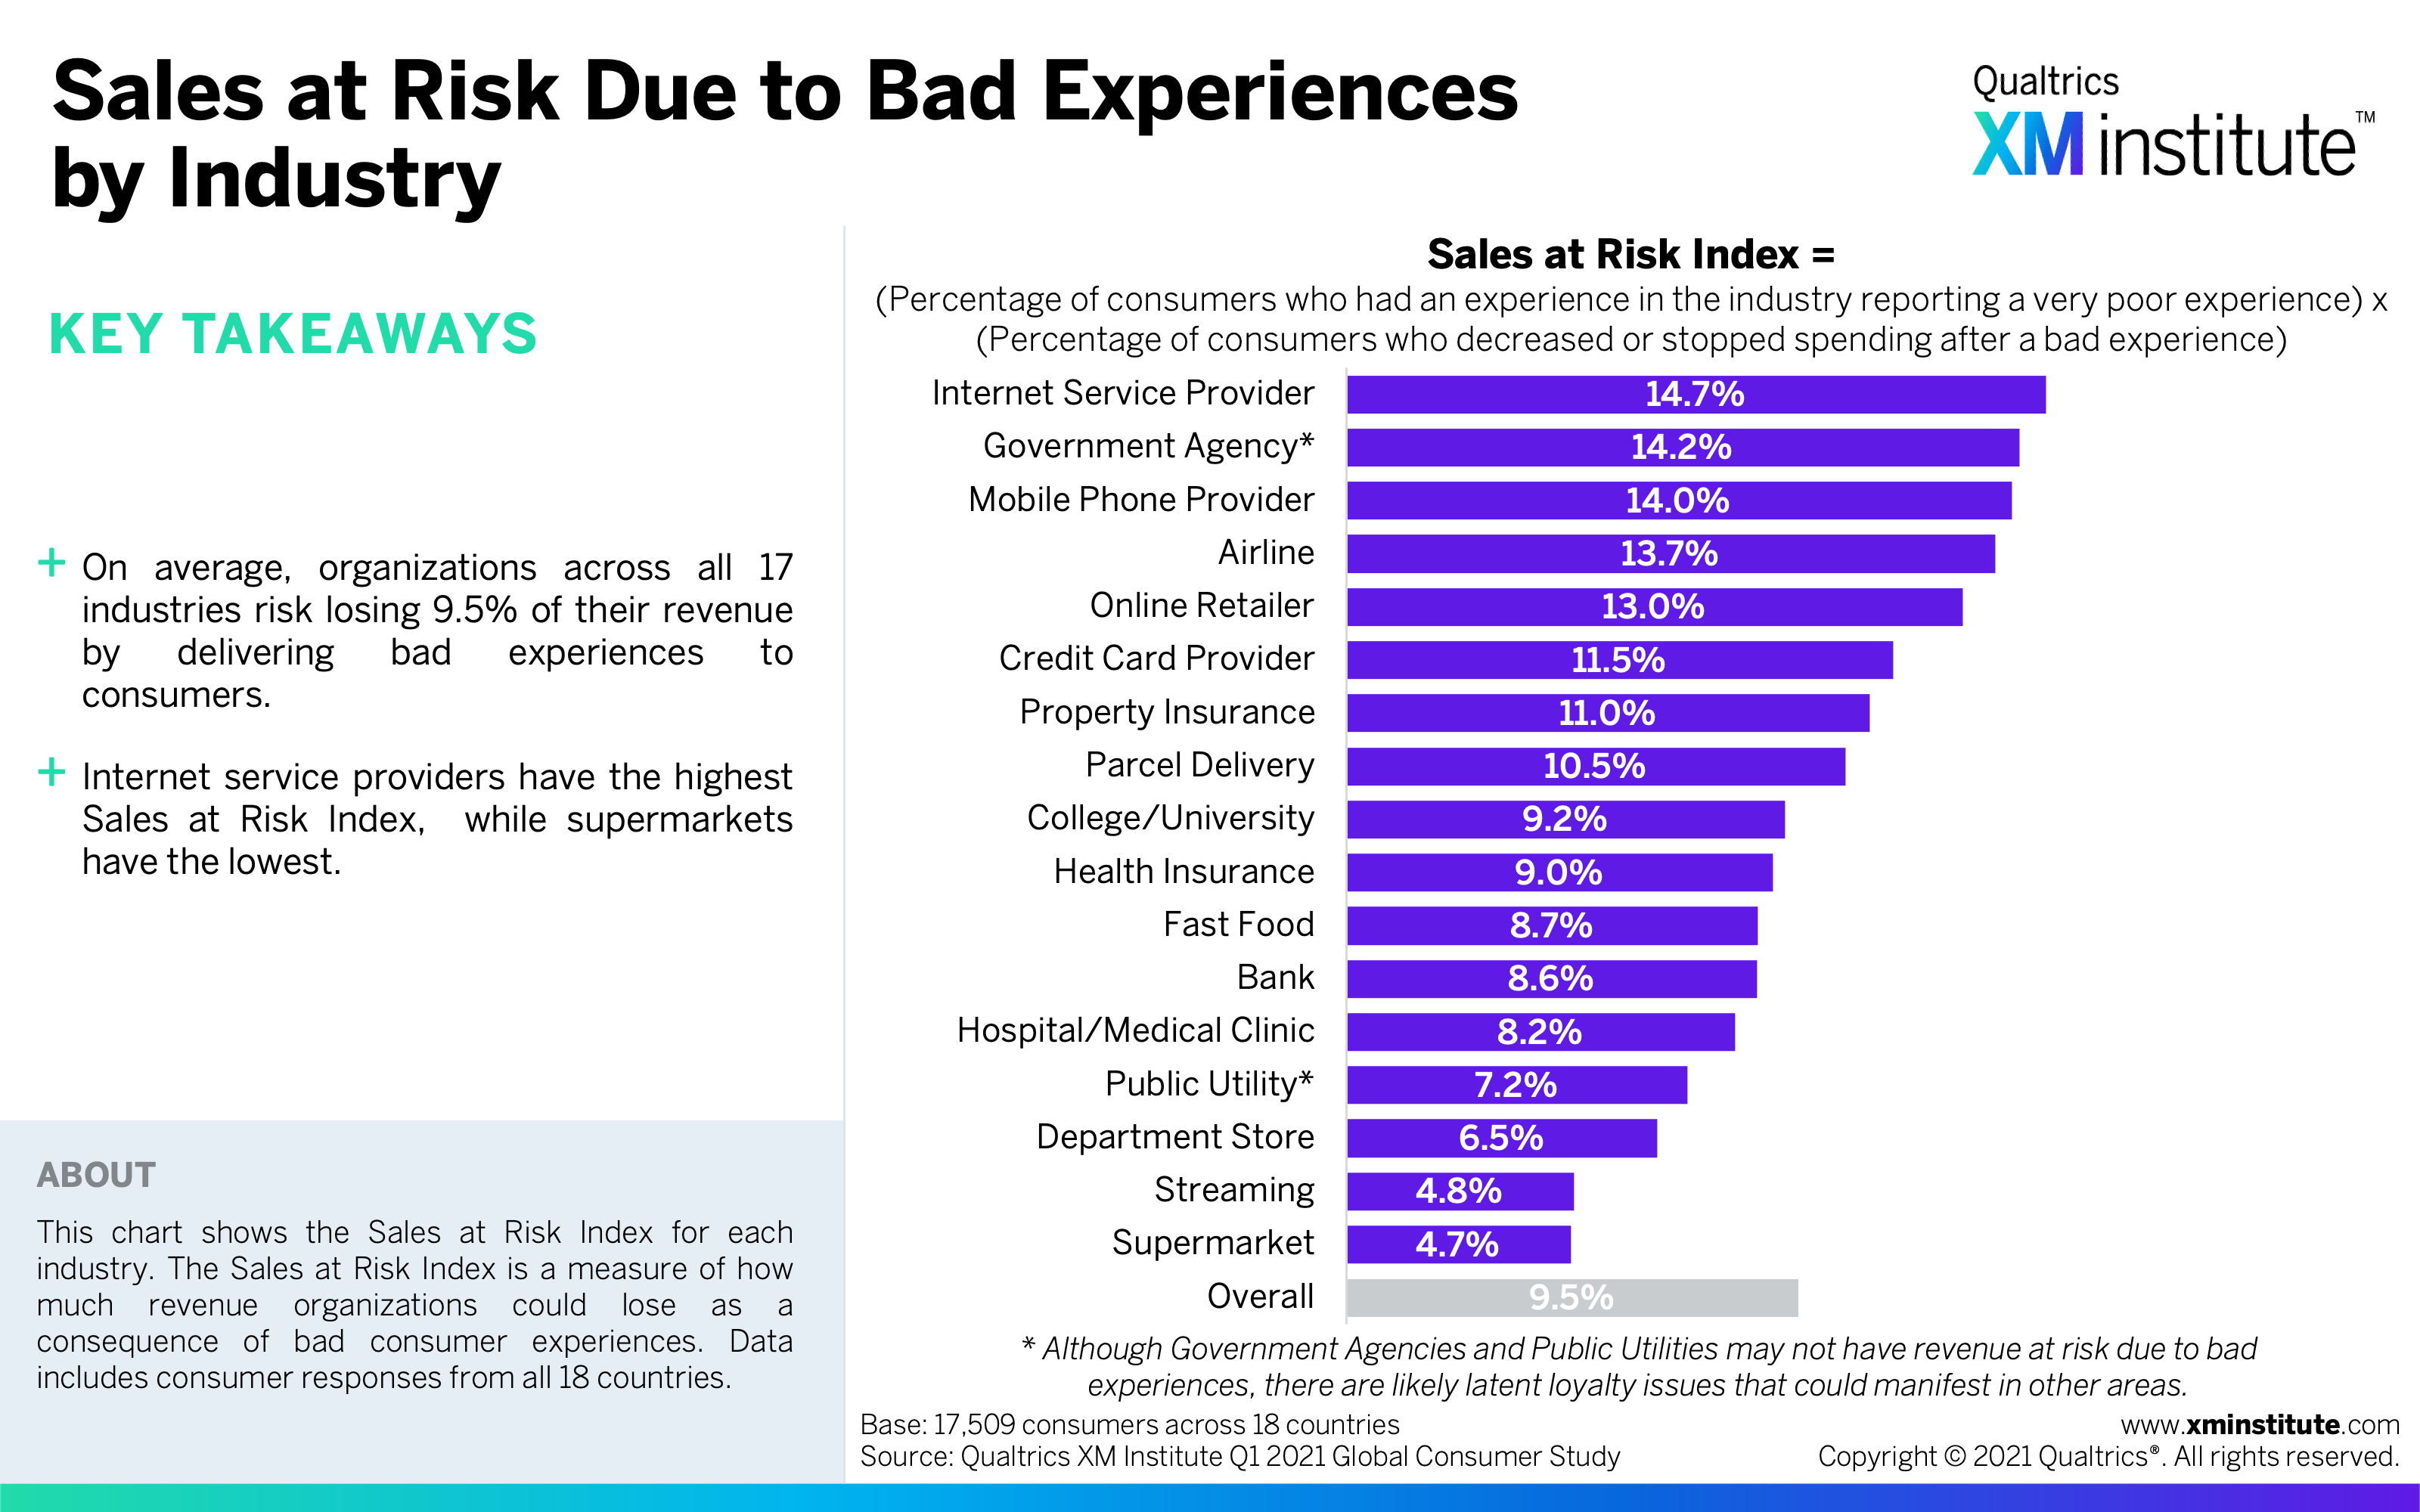
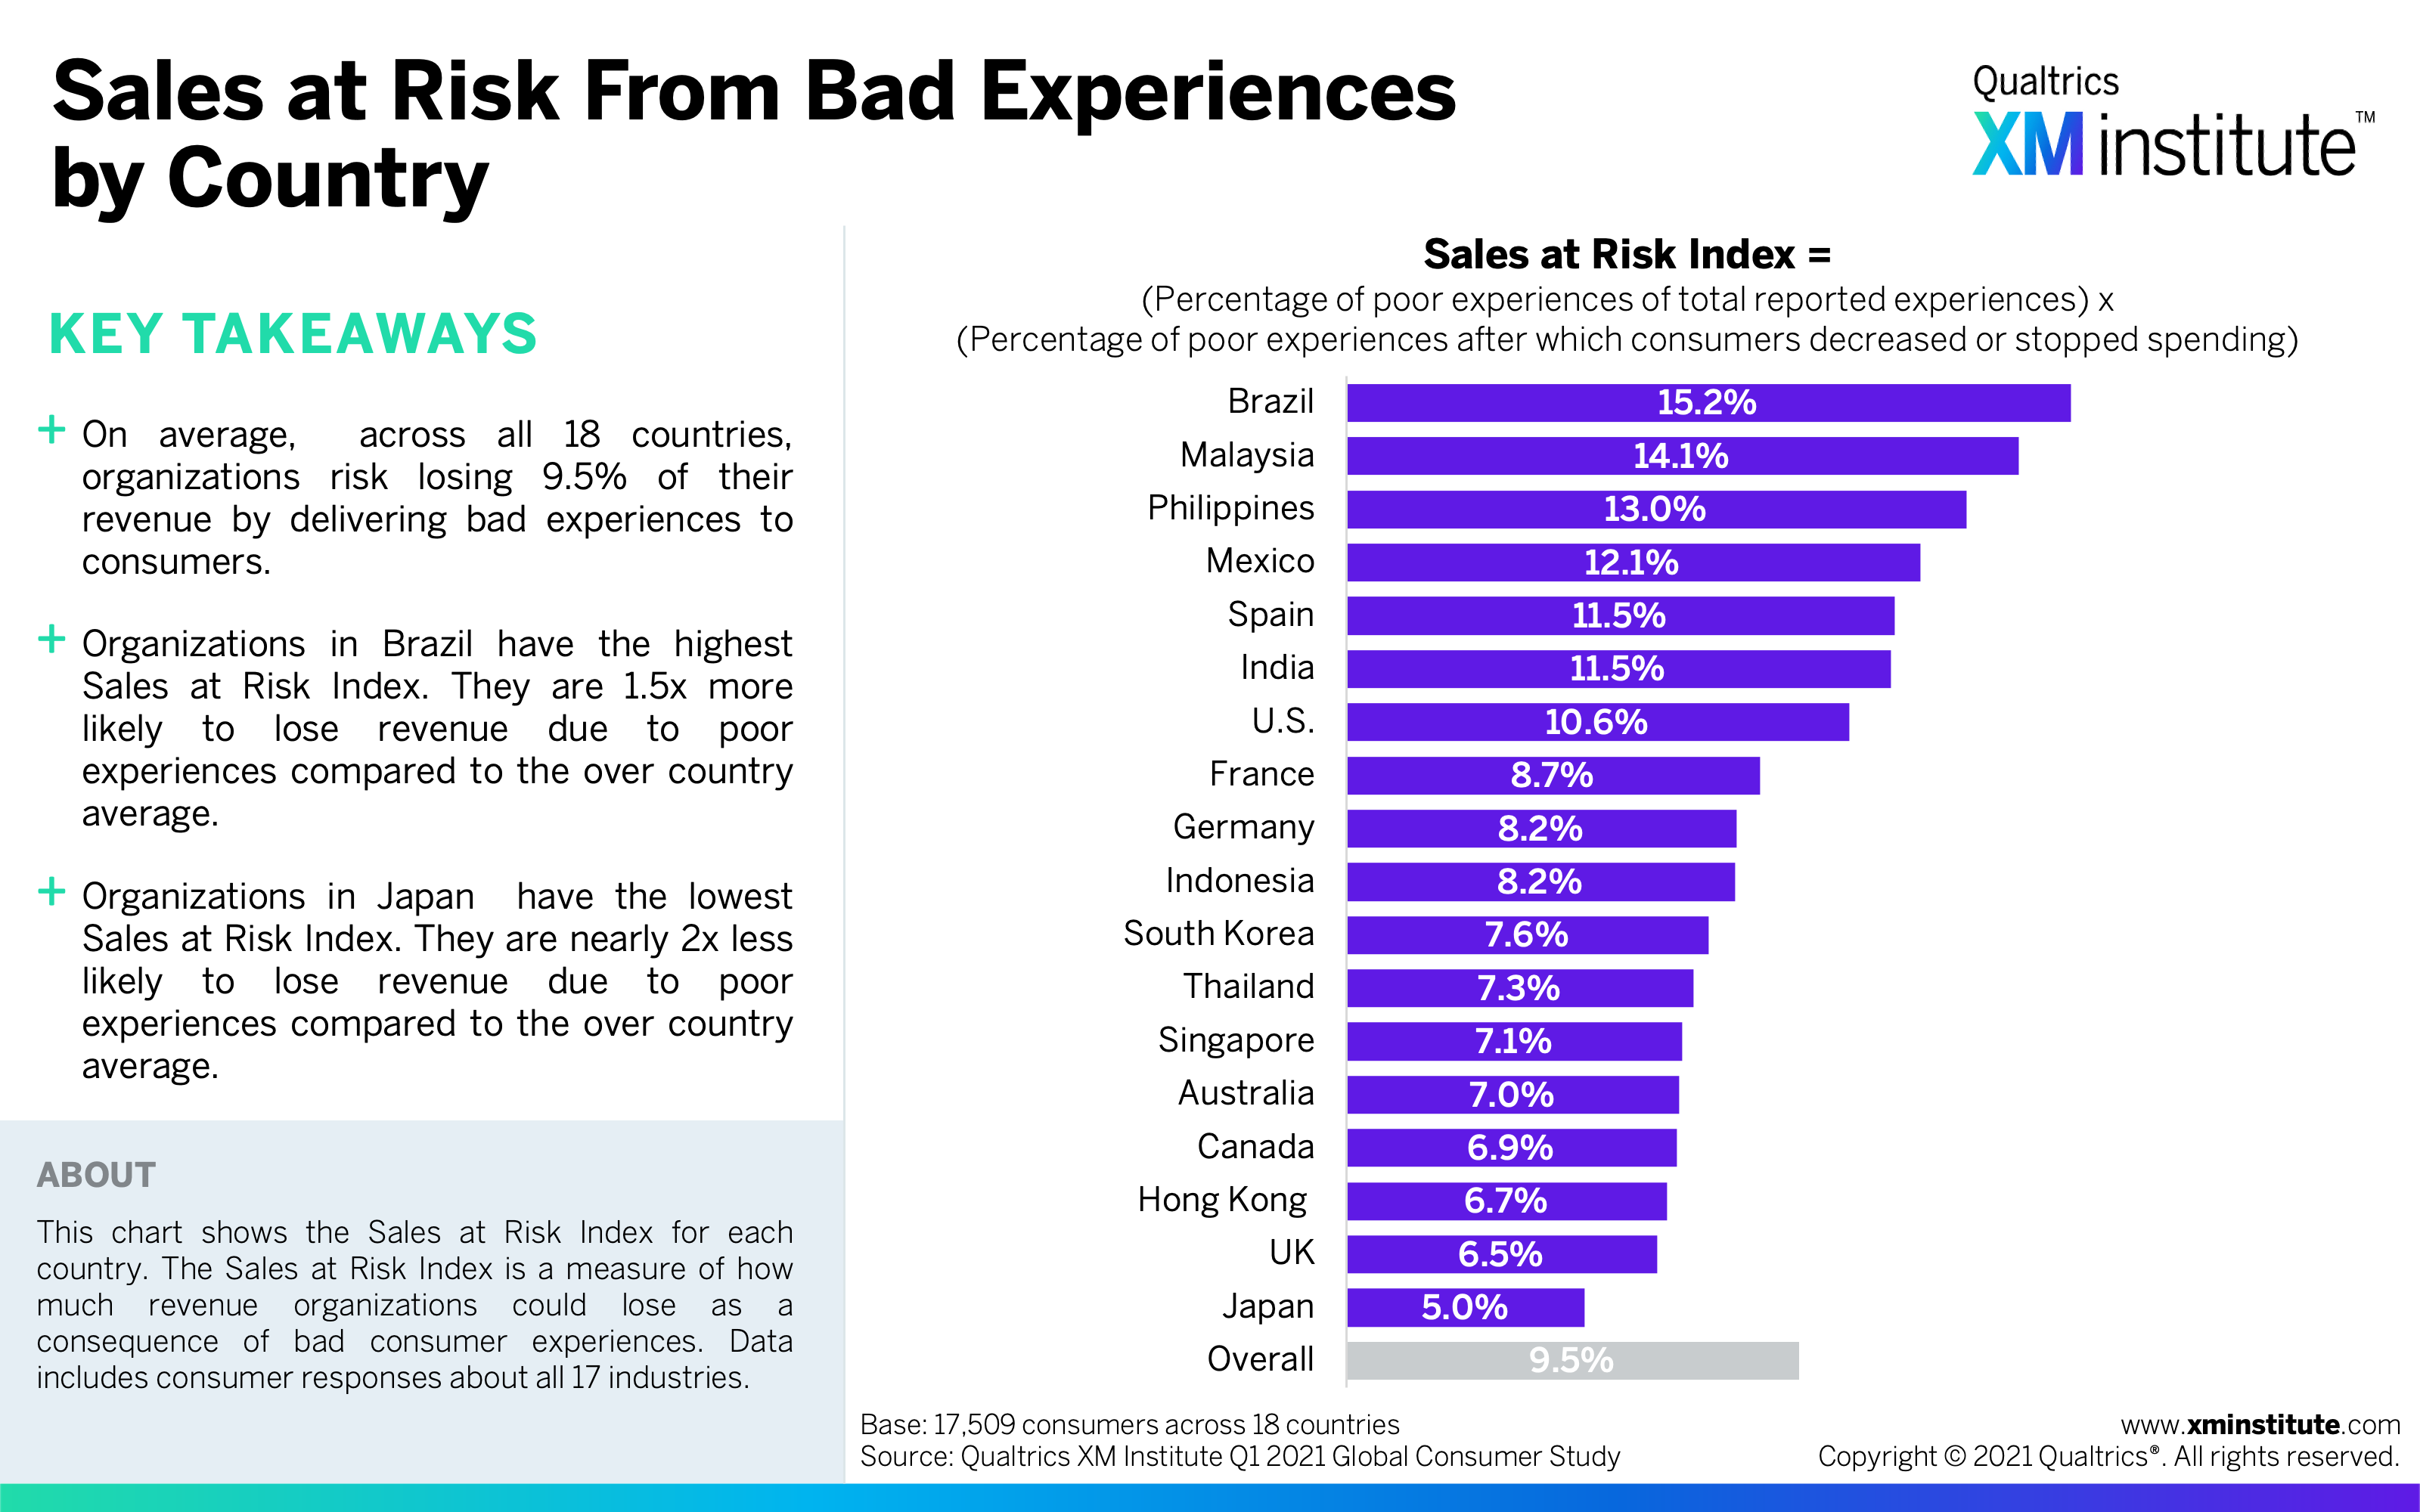
- Bad experiences put sales at risk. On average, organizations risk losing 9.5% of their revenue due to very poor experiences. Internet service providers have the highest percentage of sales at risk due to very poor experiences (14.7%), while supermarkets had the lowest (4.7%). The risk is highest for organizations in Brazil and the lowest for those in Japan.
Figures
Here are the figures for this Data Snapshot:
- Bad Experiences – by Industry
- How Consumers Cut Spending After a Bad Experience – by Industry
- Sales at Risk Due to Bad Experiences – by Industry
- Percentage of Bad Experiences – by Country
- How Consumers Cut Spending After a Bad Experience – by Country
- Sales at Risk From Bad Experiences – by Country
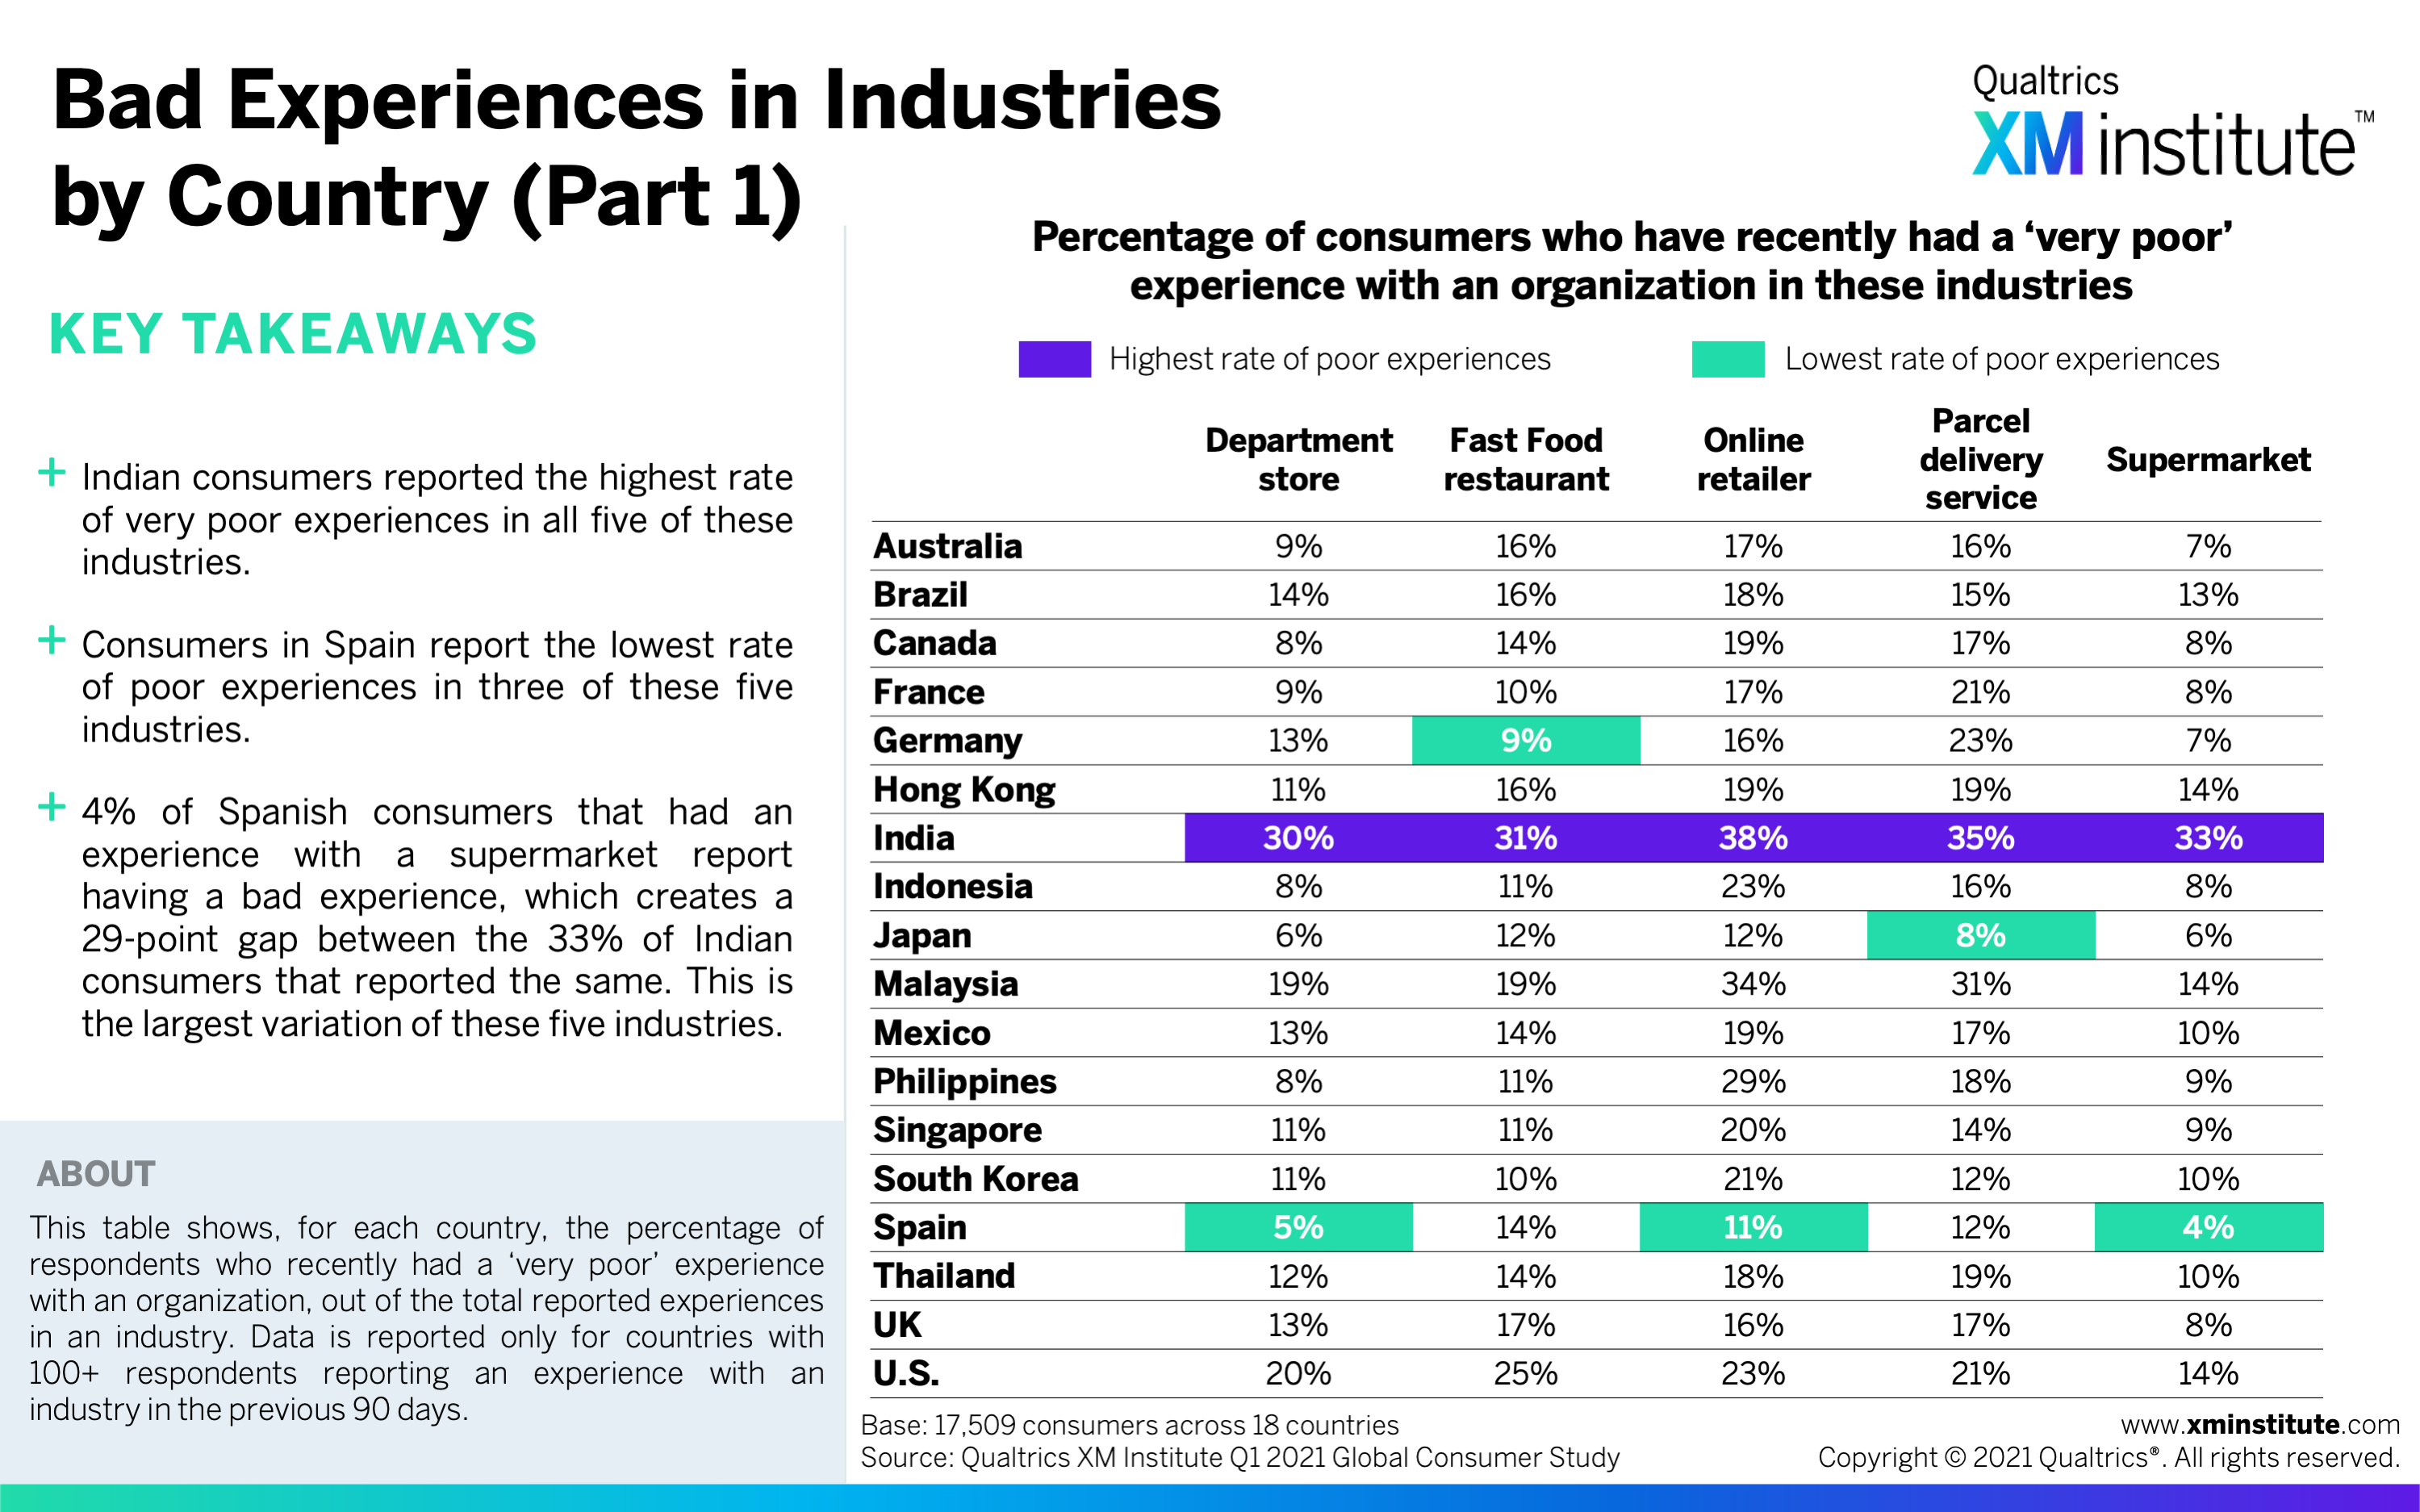
- Bad Experiences in Industries – by Country (Part 1)
- Bad Experiences in Industries – by Country (Part 2)
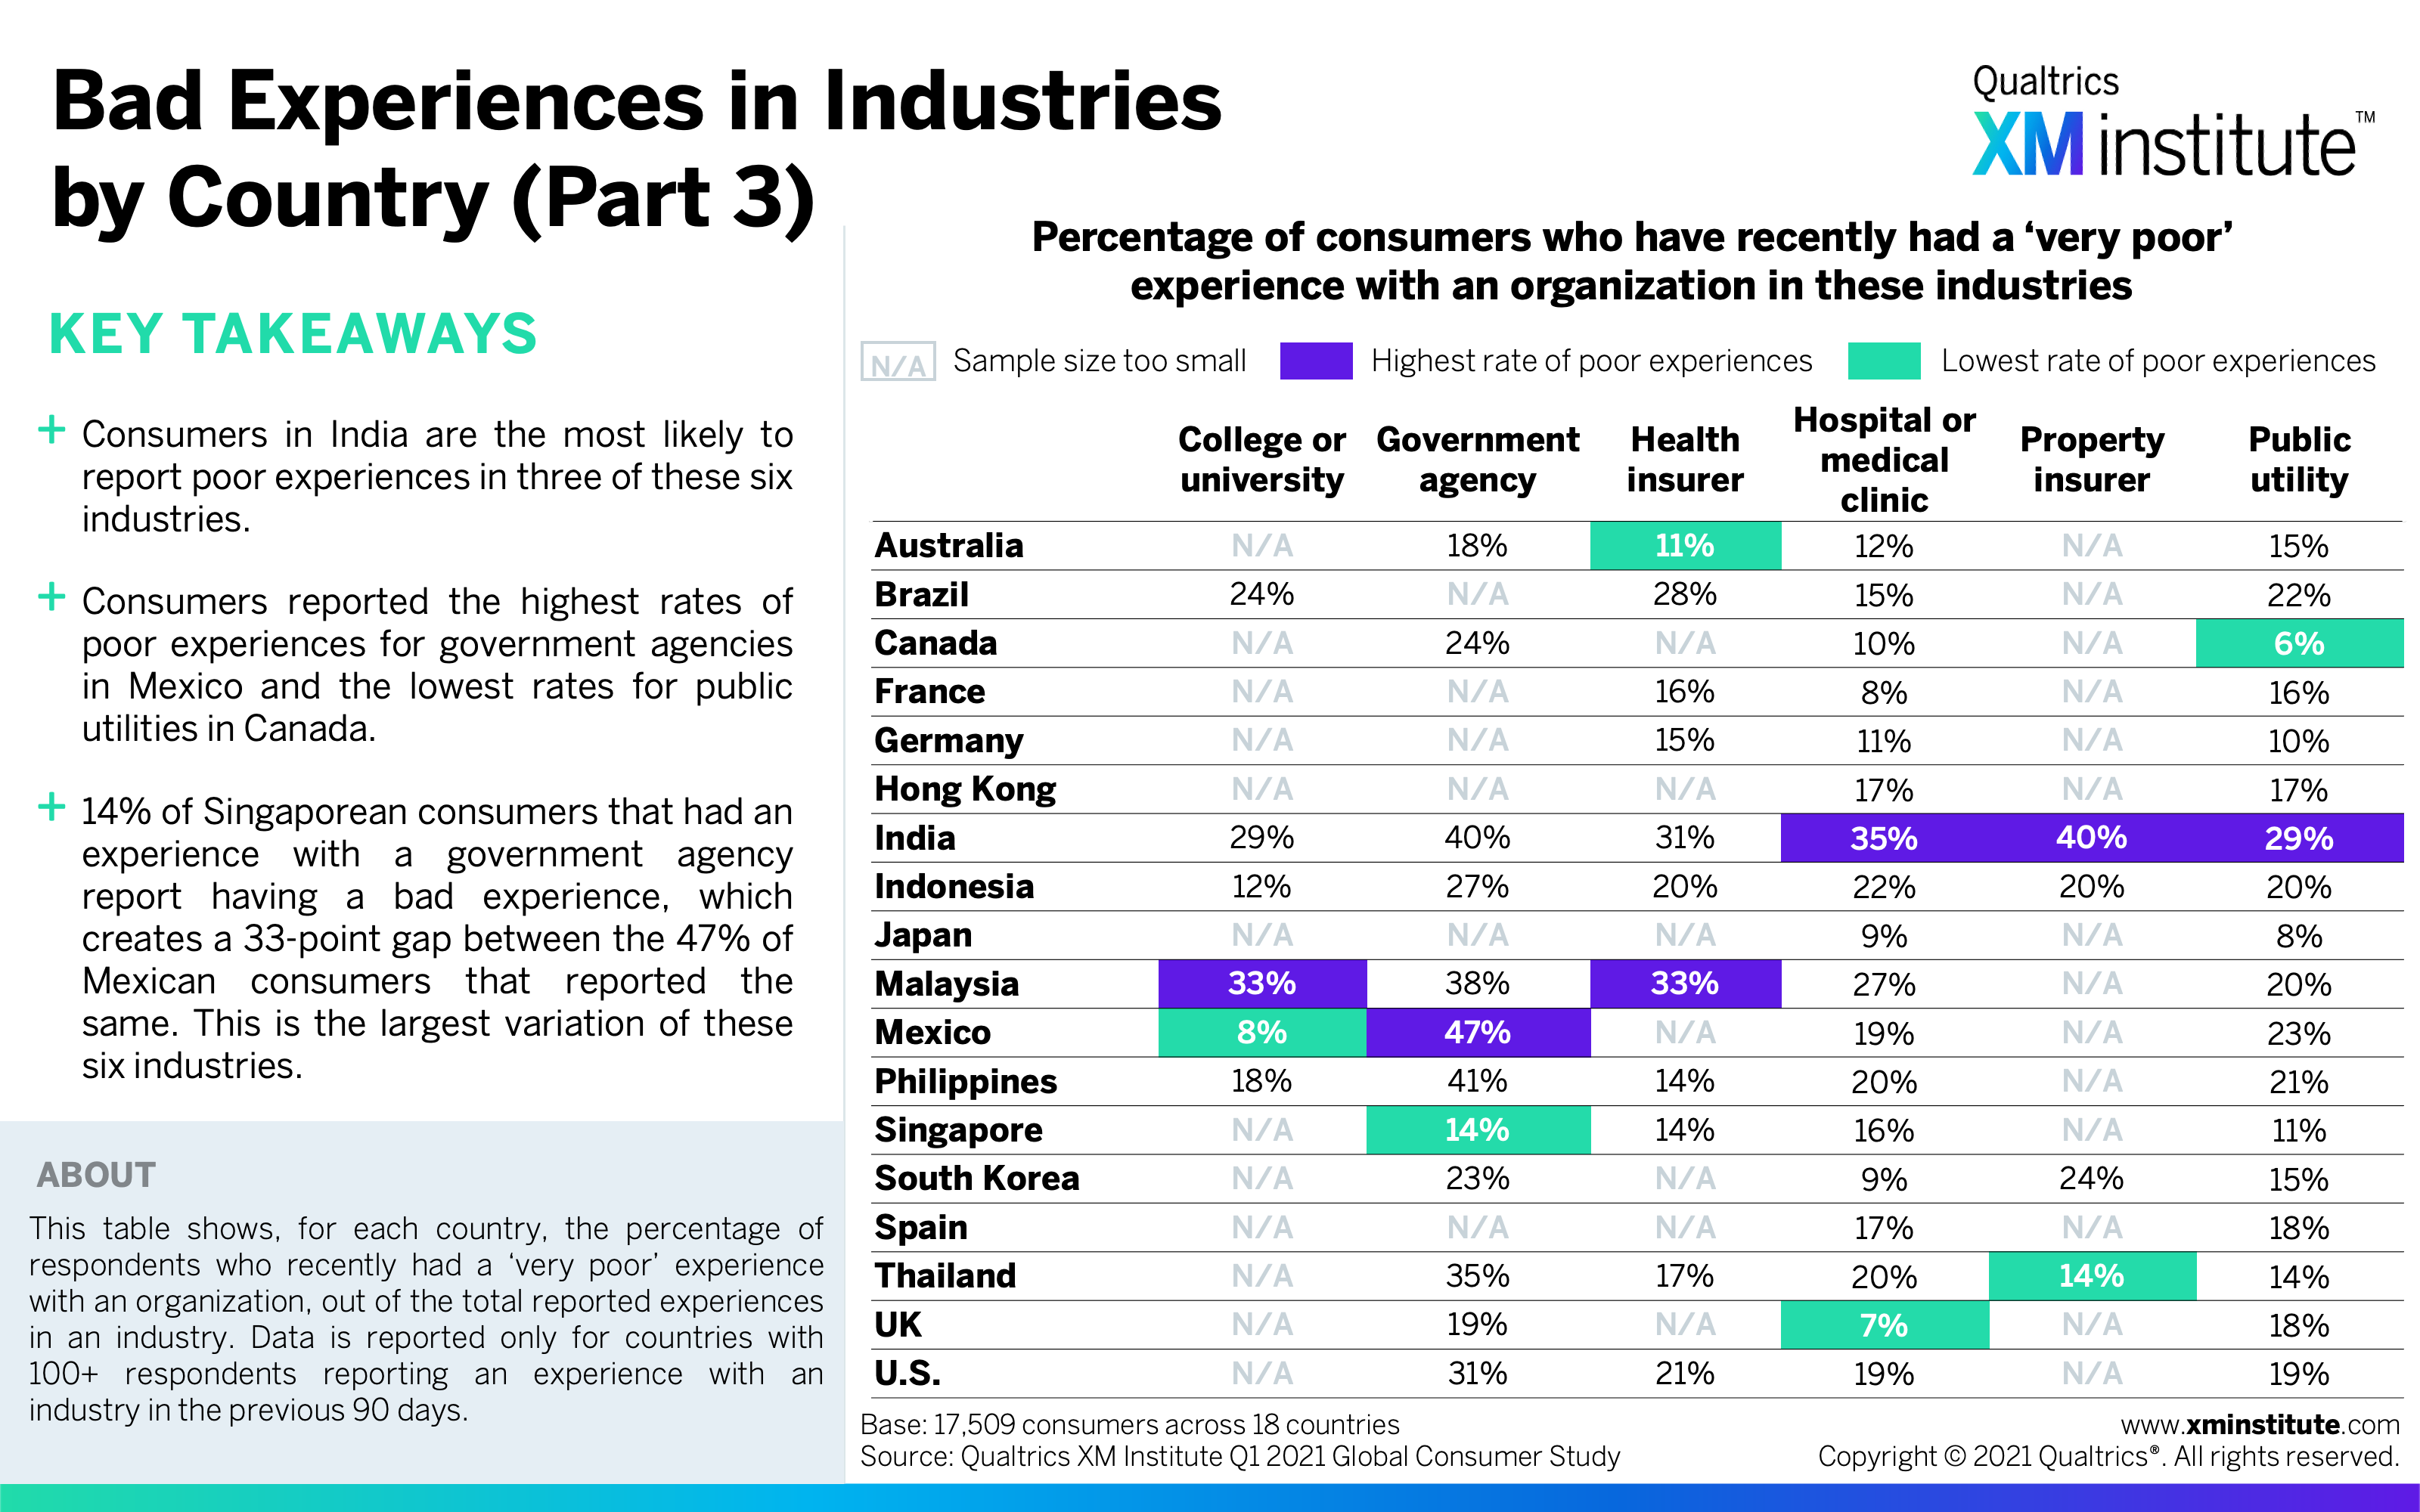
- Bad Experiences in Industries – by Country (Part 3)
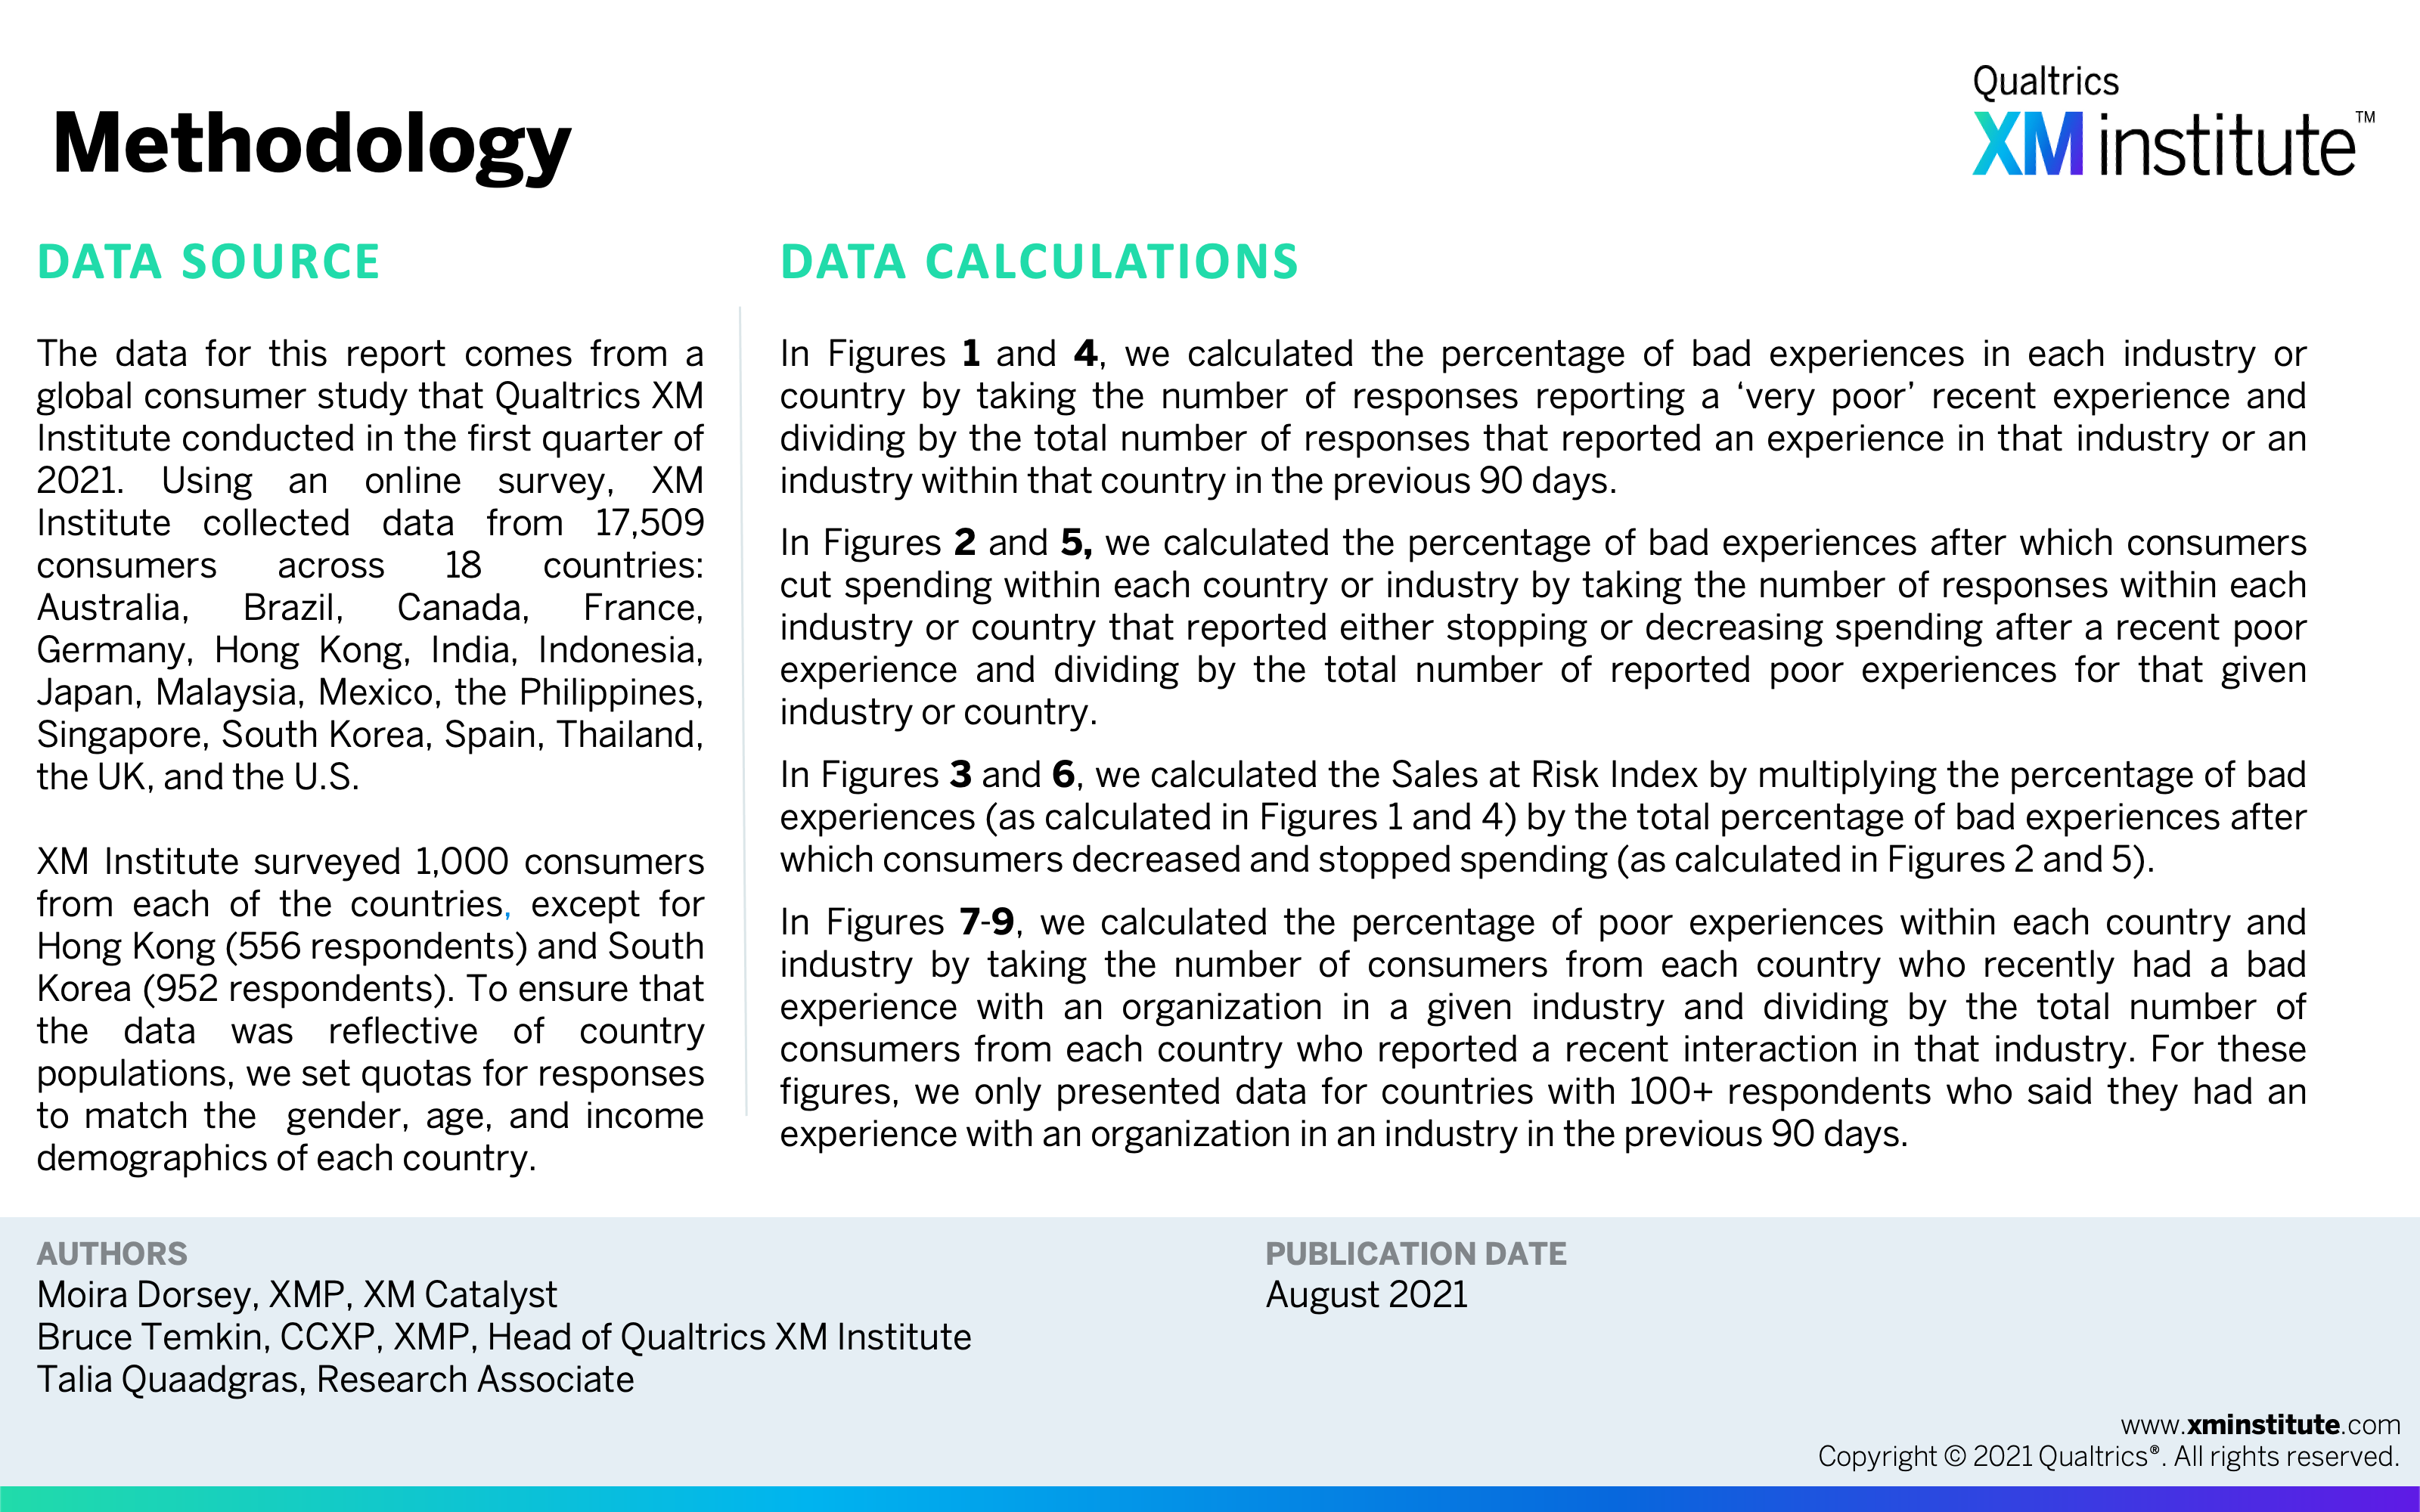
- Methodology