Key Findings
As part of our latest global consumer study, consumers from 29 countries told us whether they recently had a ‘very poor experience’ with an organization in any of the 20 industries surveyed, and how they changed their spending with the organization after that very poor experience. We also calculated a Sales at Risk Index to understand the percentage of sales at risk due to decreased spending after poor experiences. We found that:
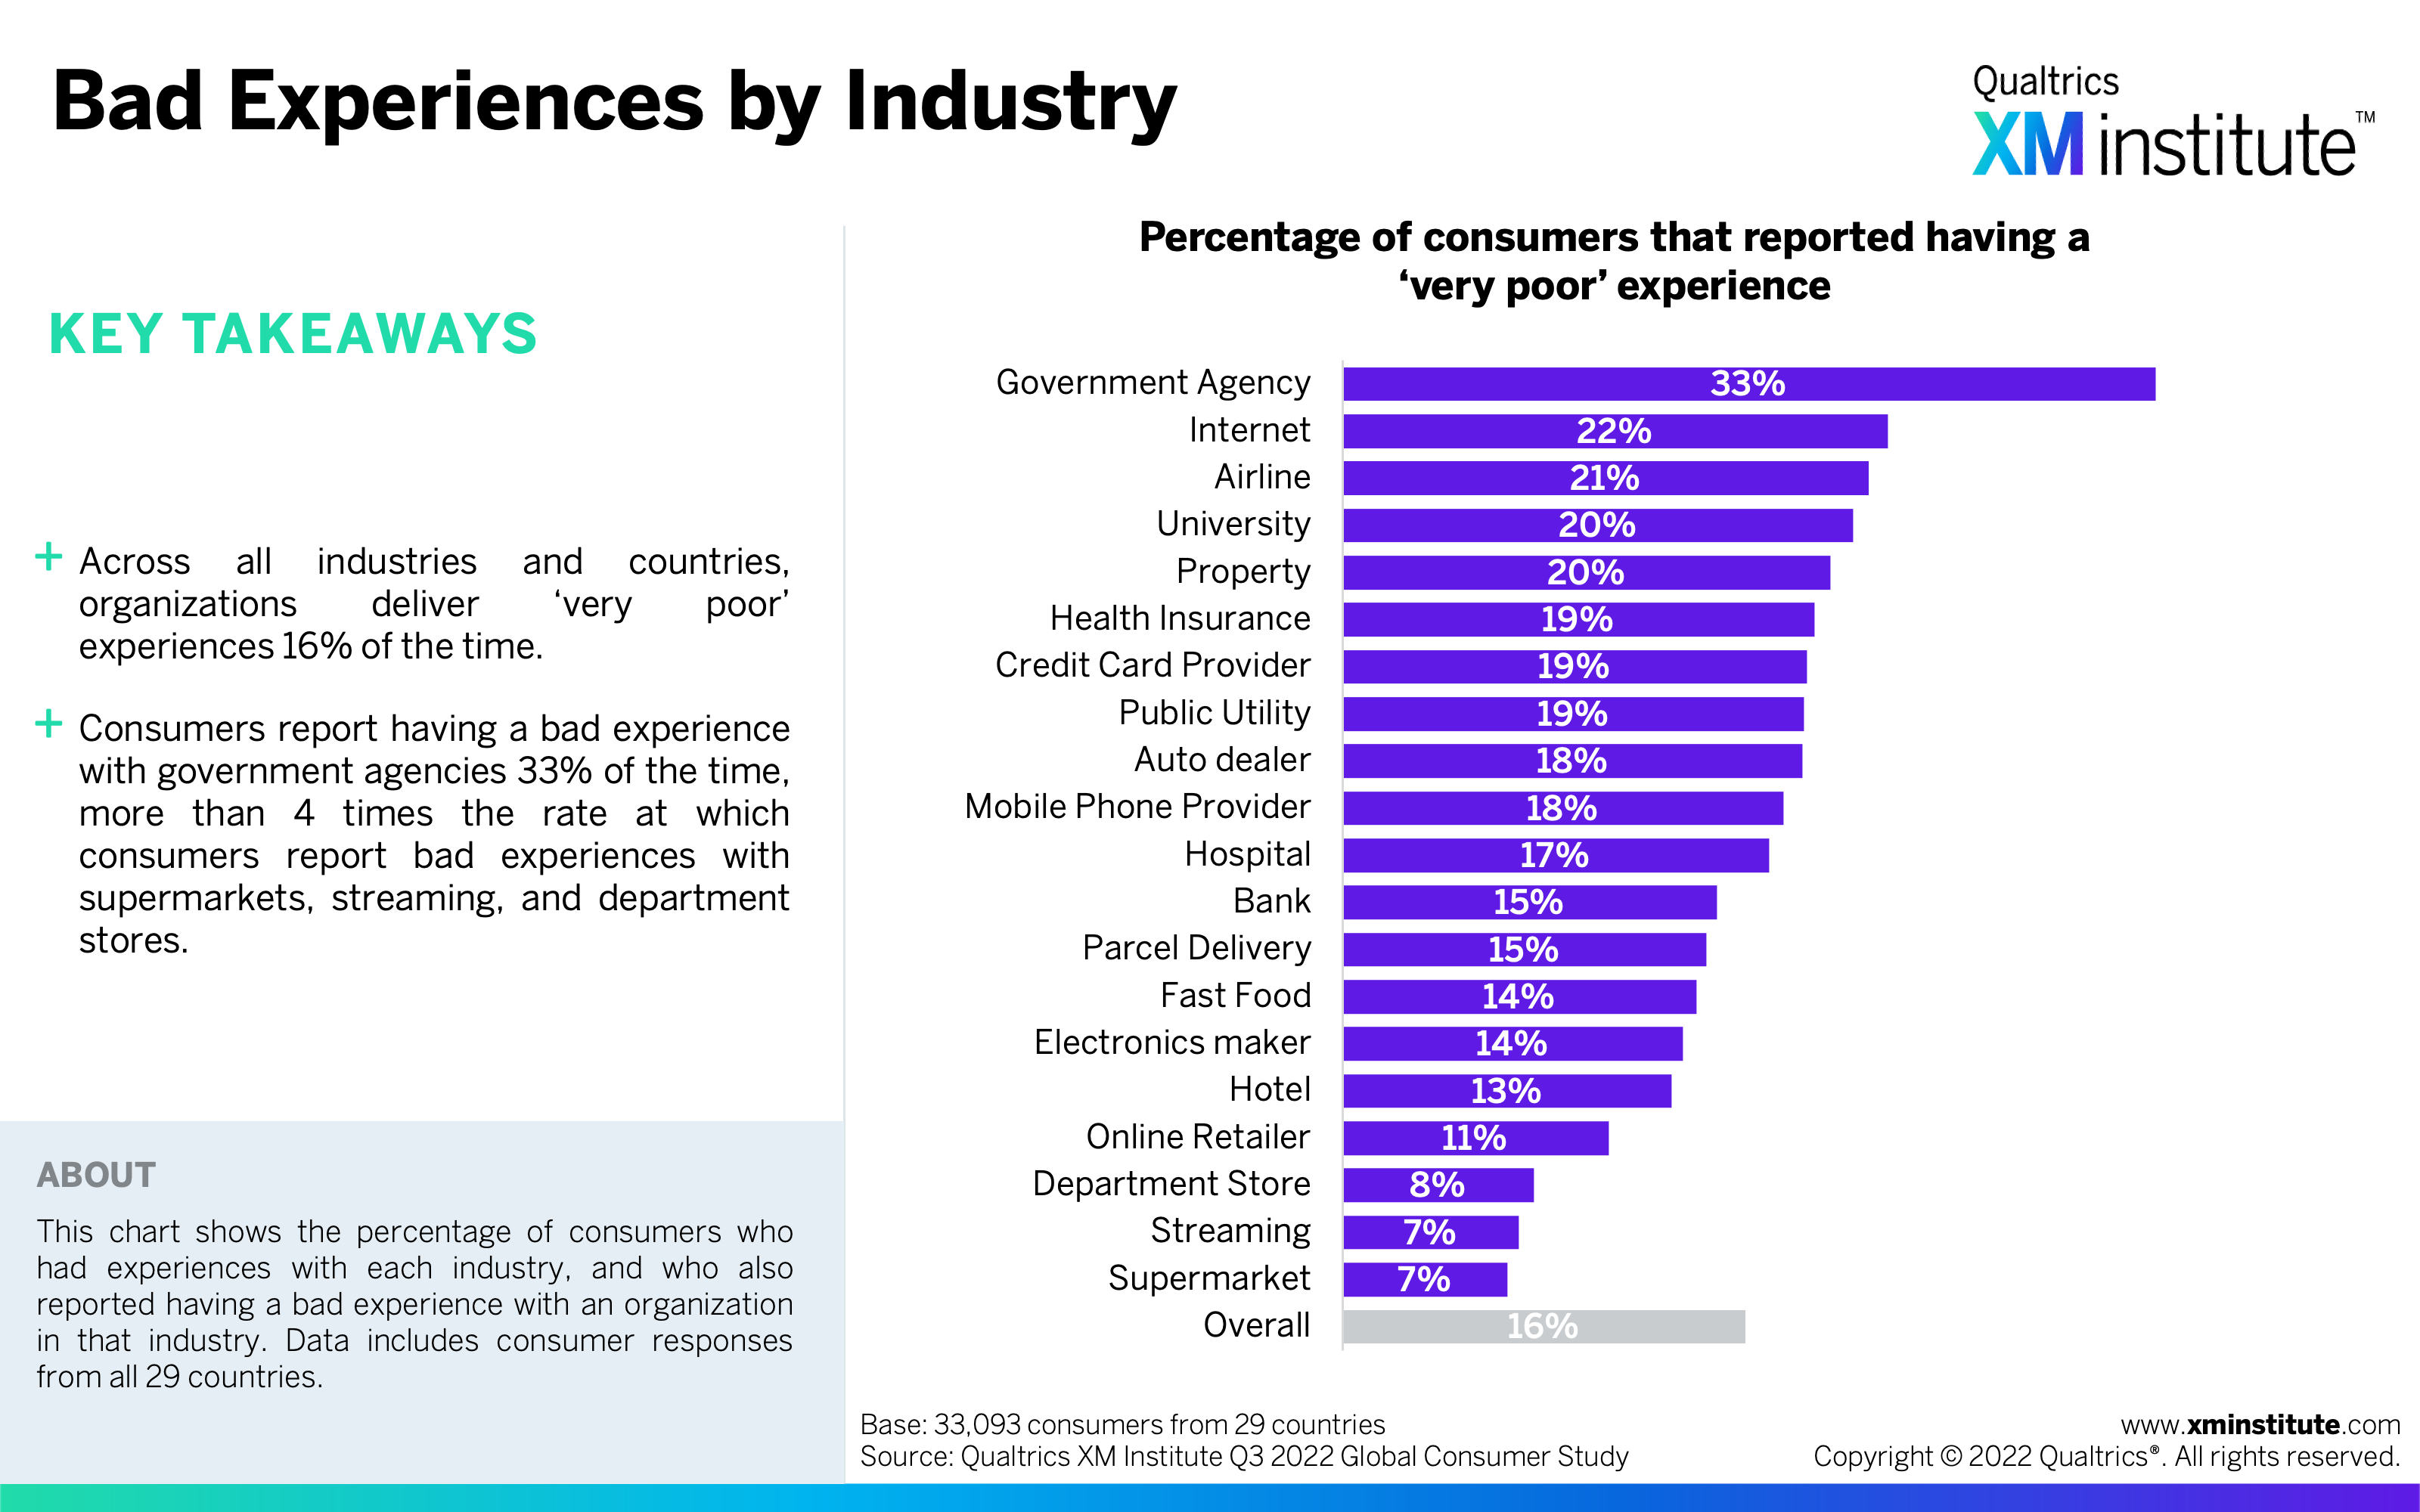
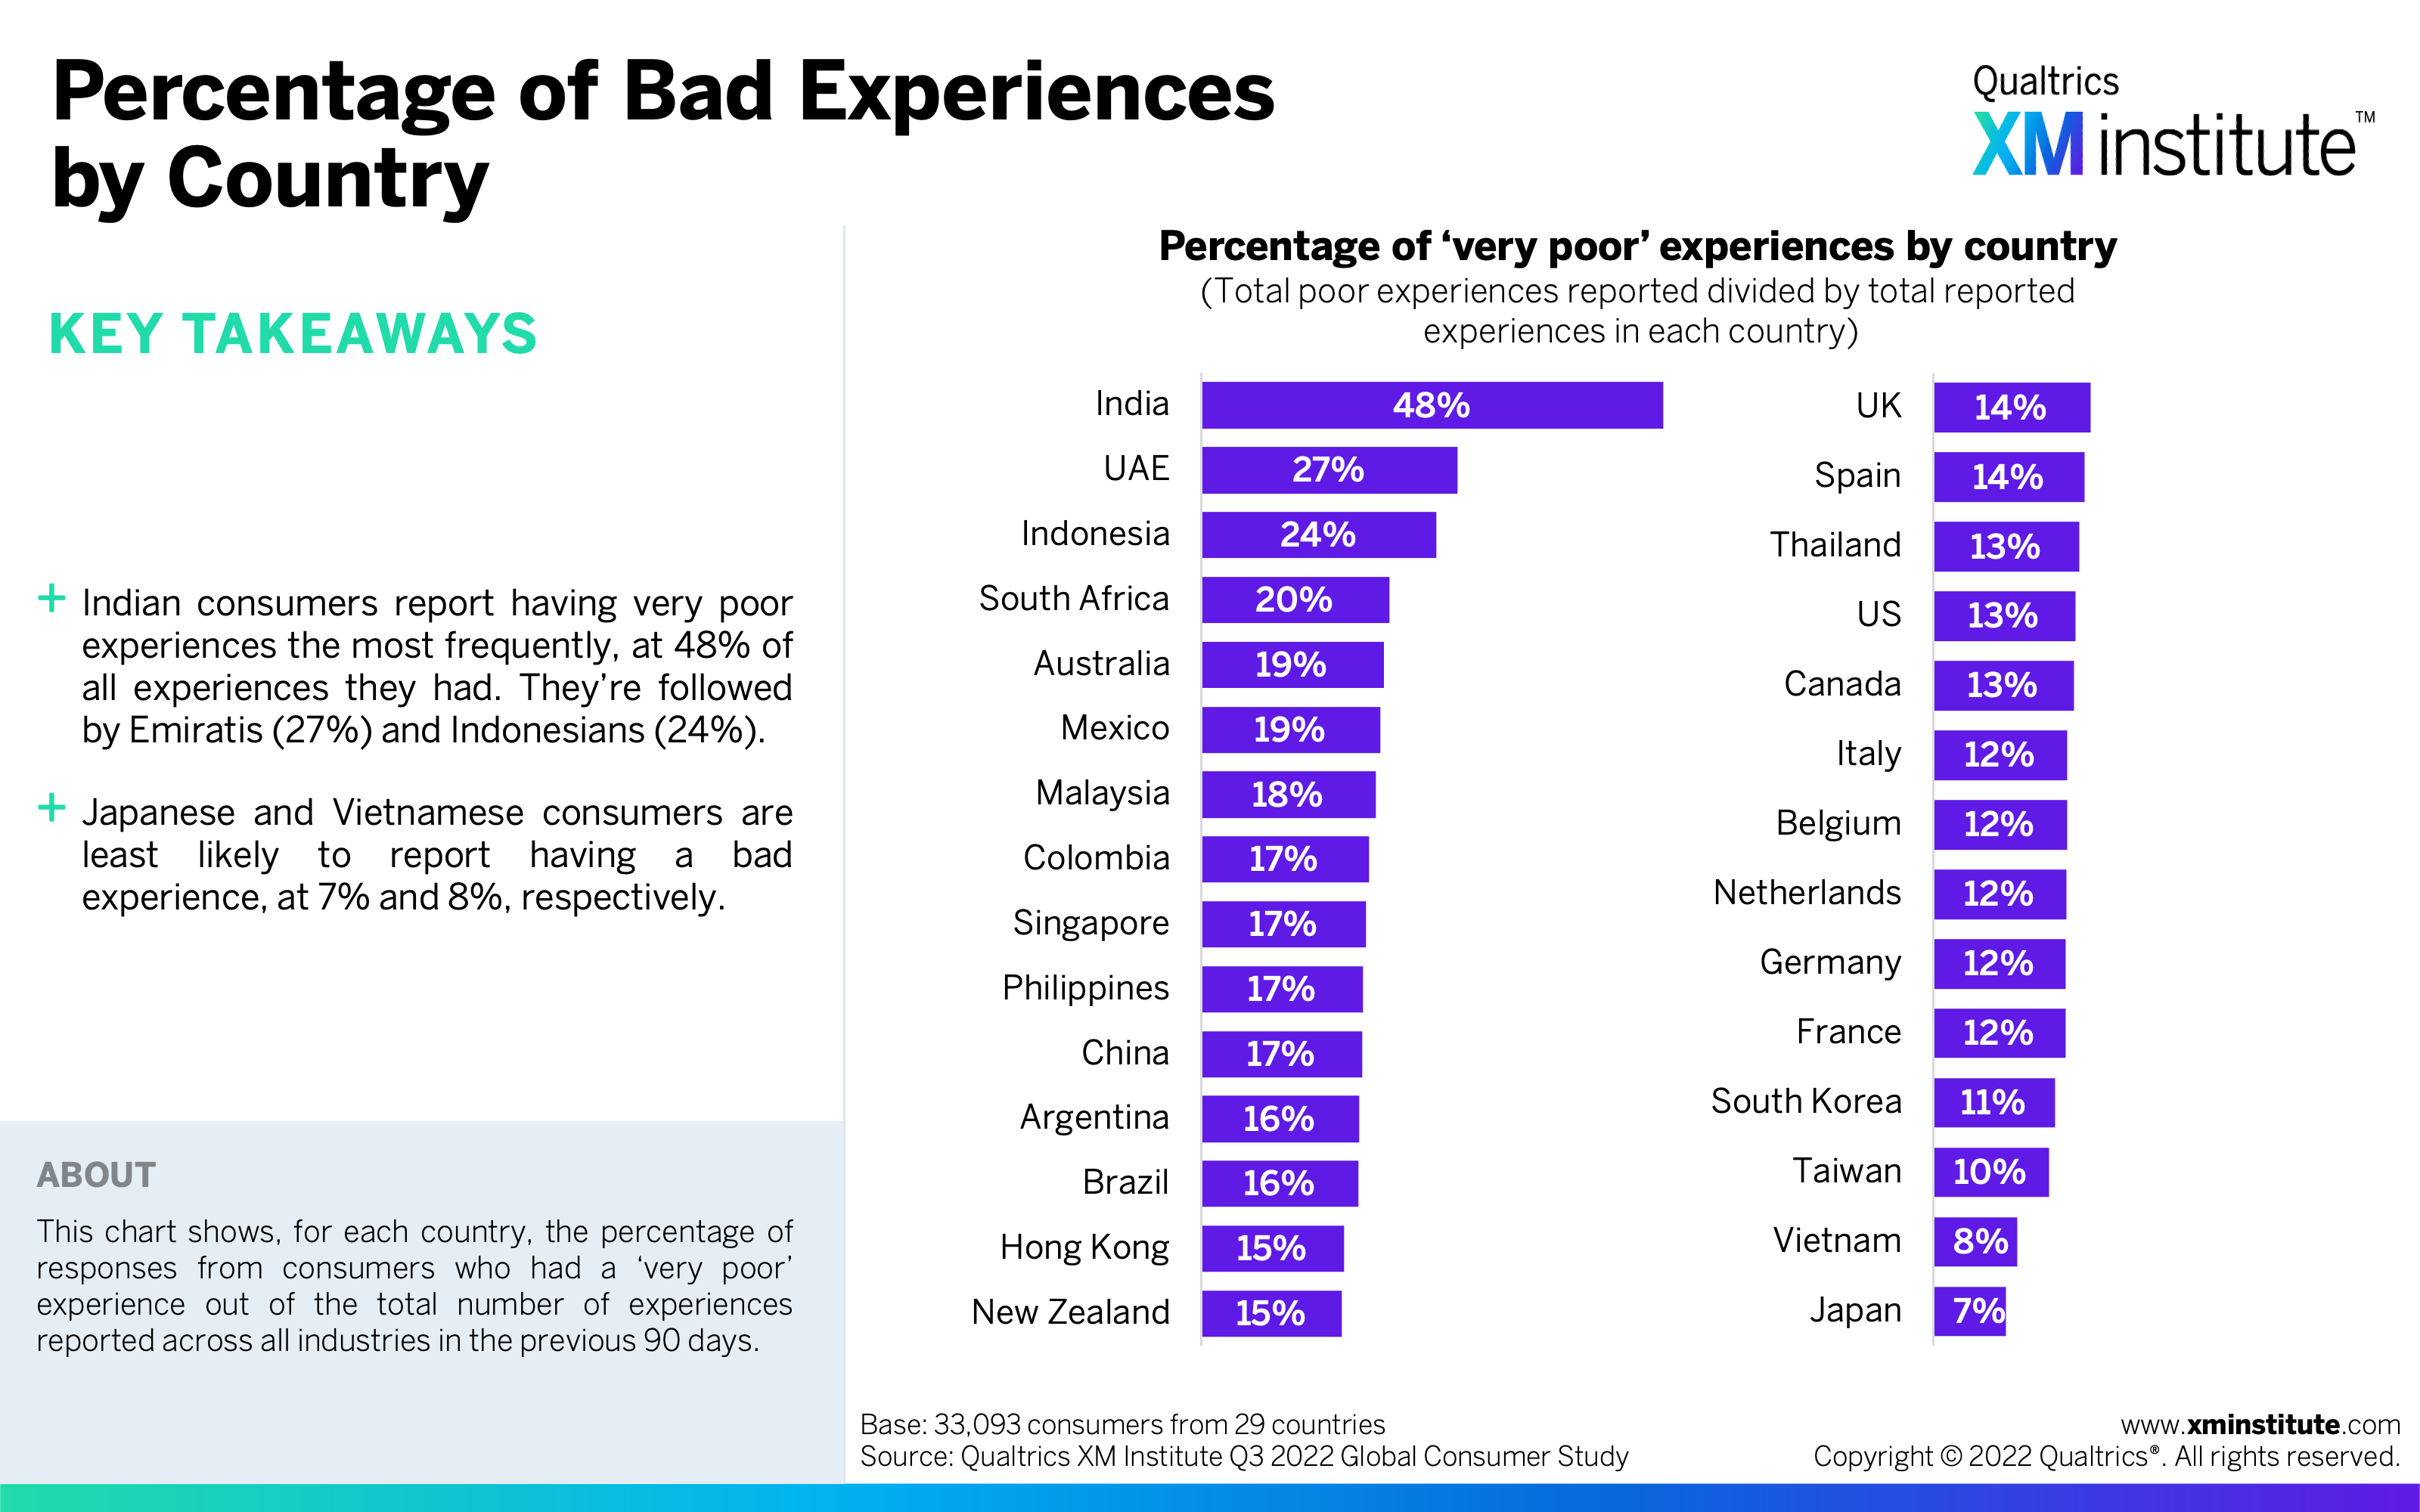
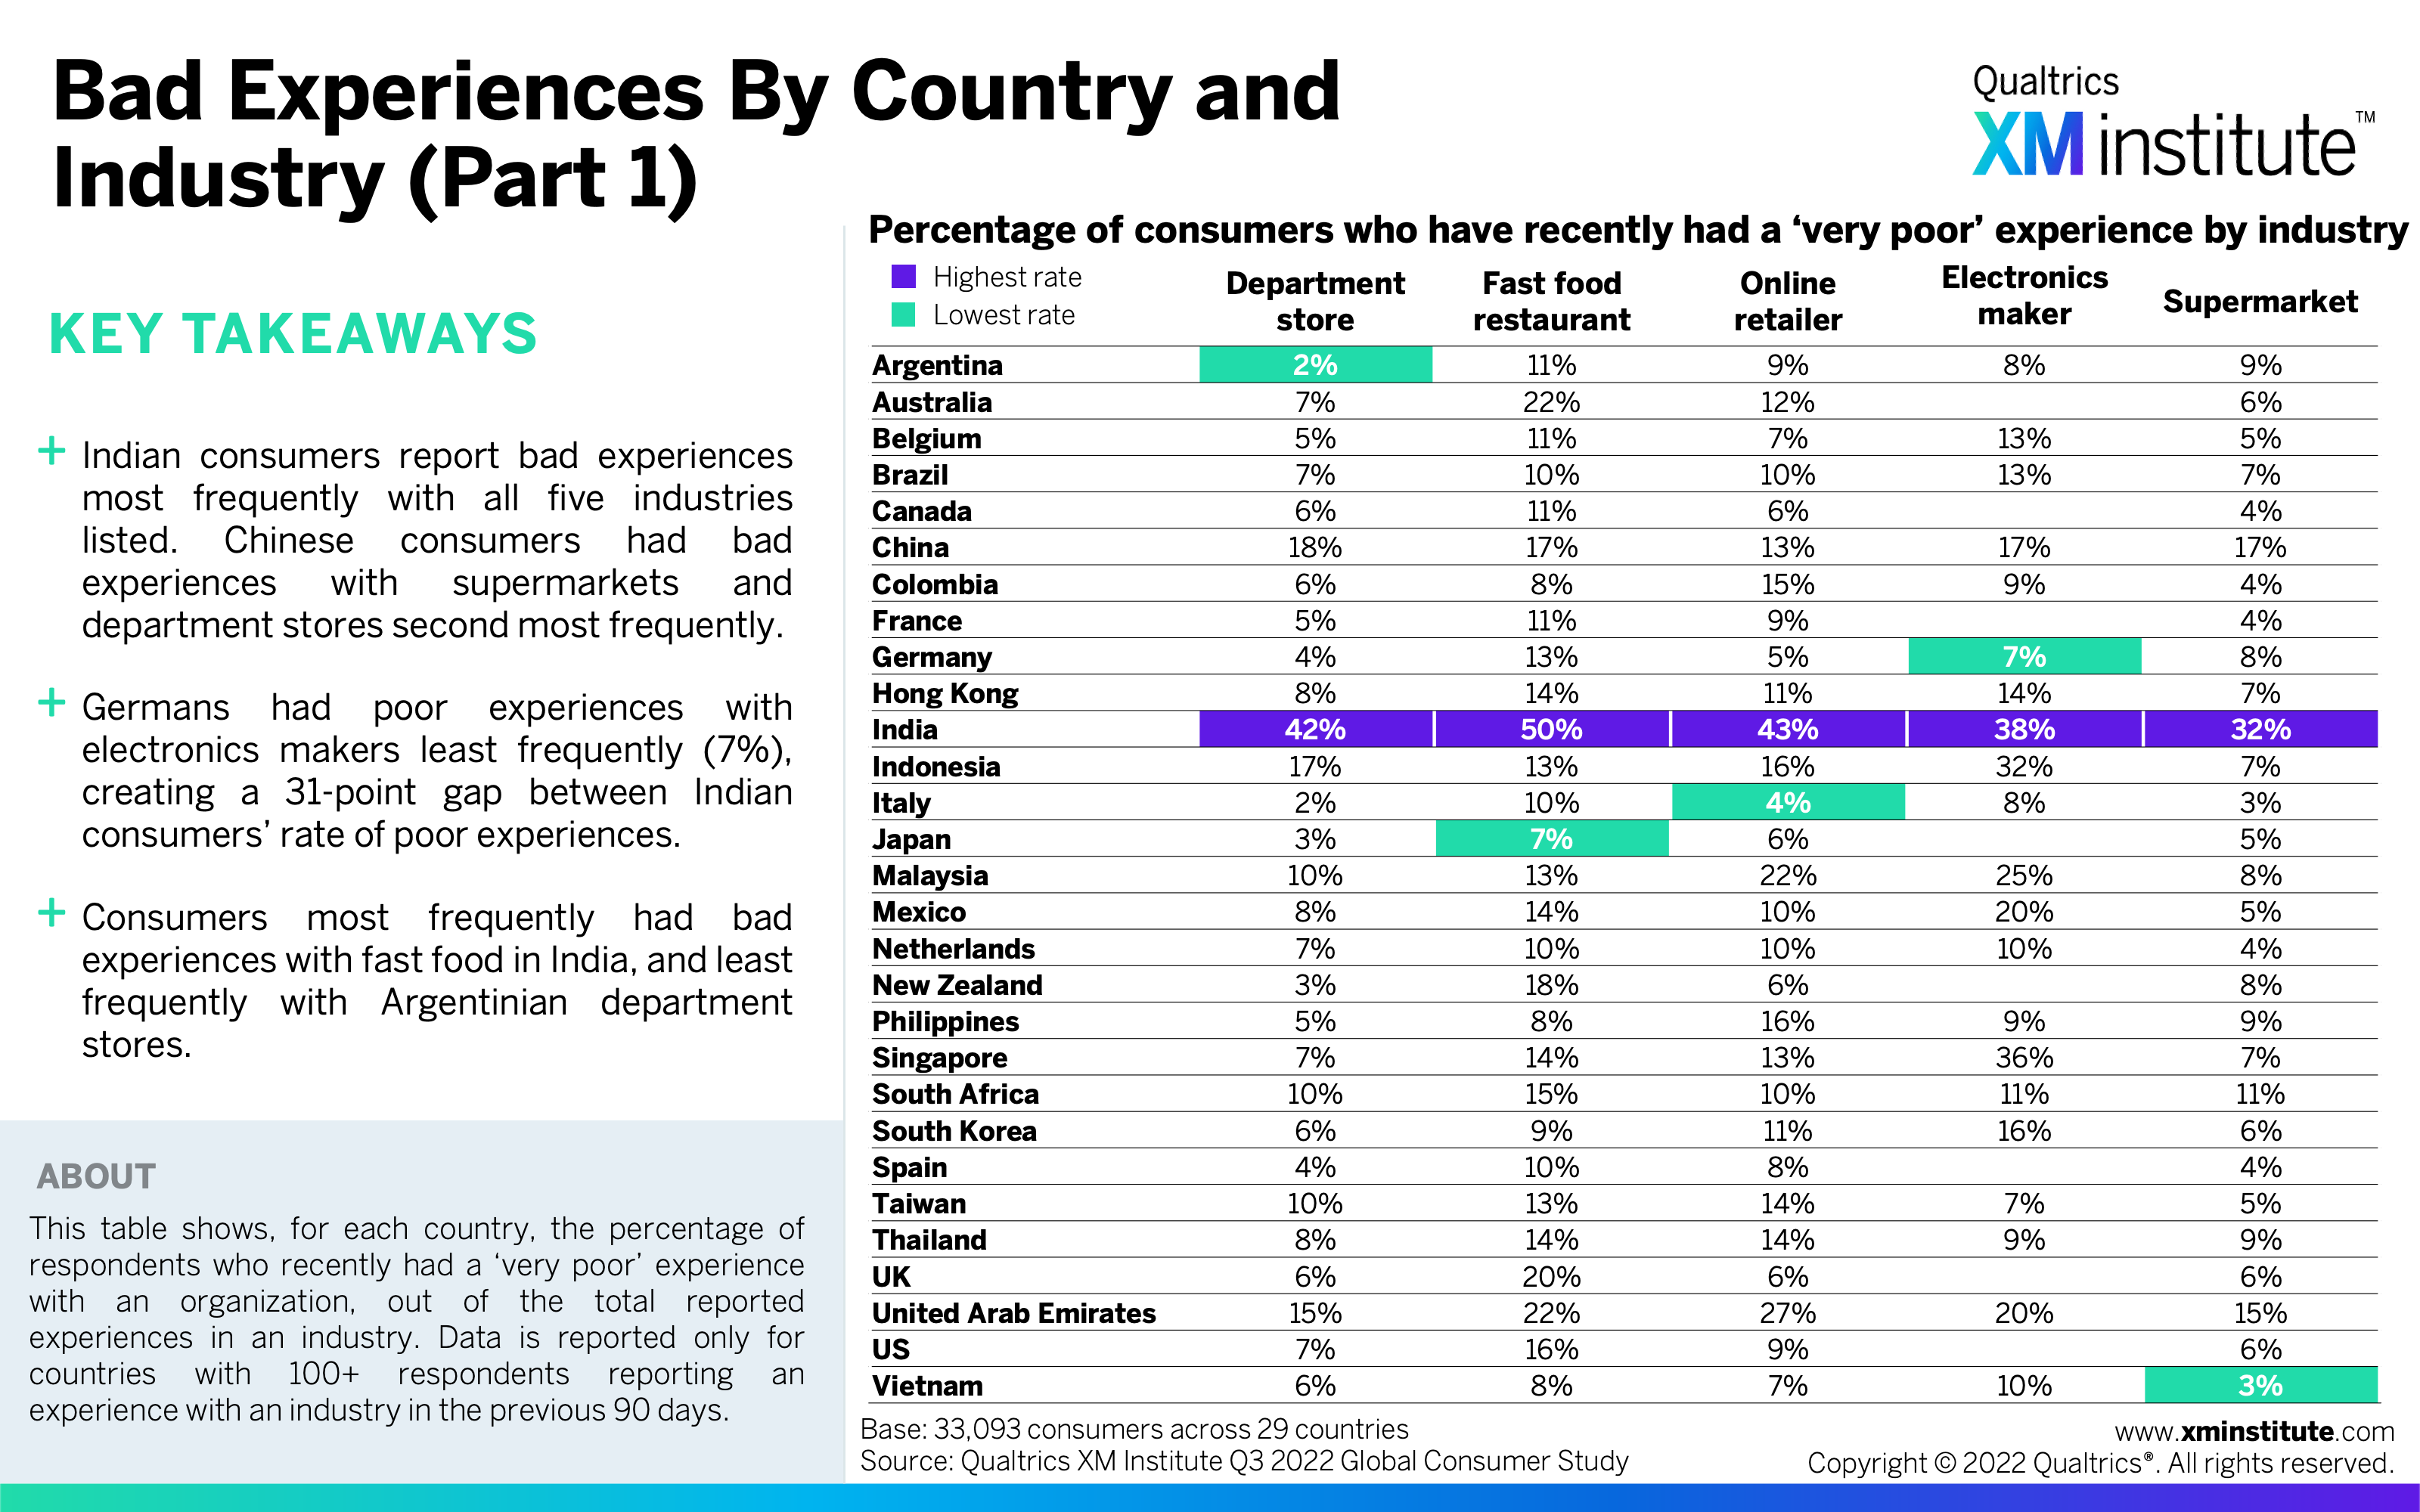
- Organizations disappoint in more than 1 in 10 experiences. On average, consumers report that 16% of their recent experiences were ‘very poor,’ ranging from 48% in India to 7% in Japan. Government agencies in South Africa provided the highest rate of poor experiences; 69% of people who had an experience in this industry reported having a ‘very poor’ experience.
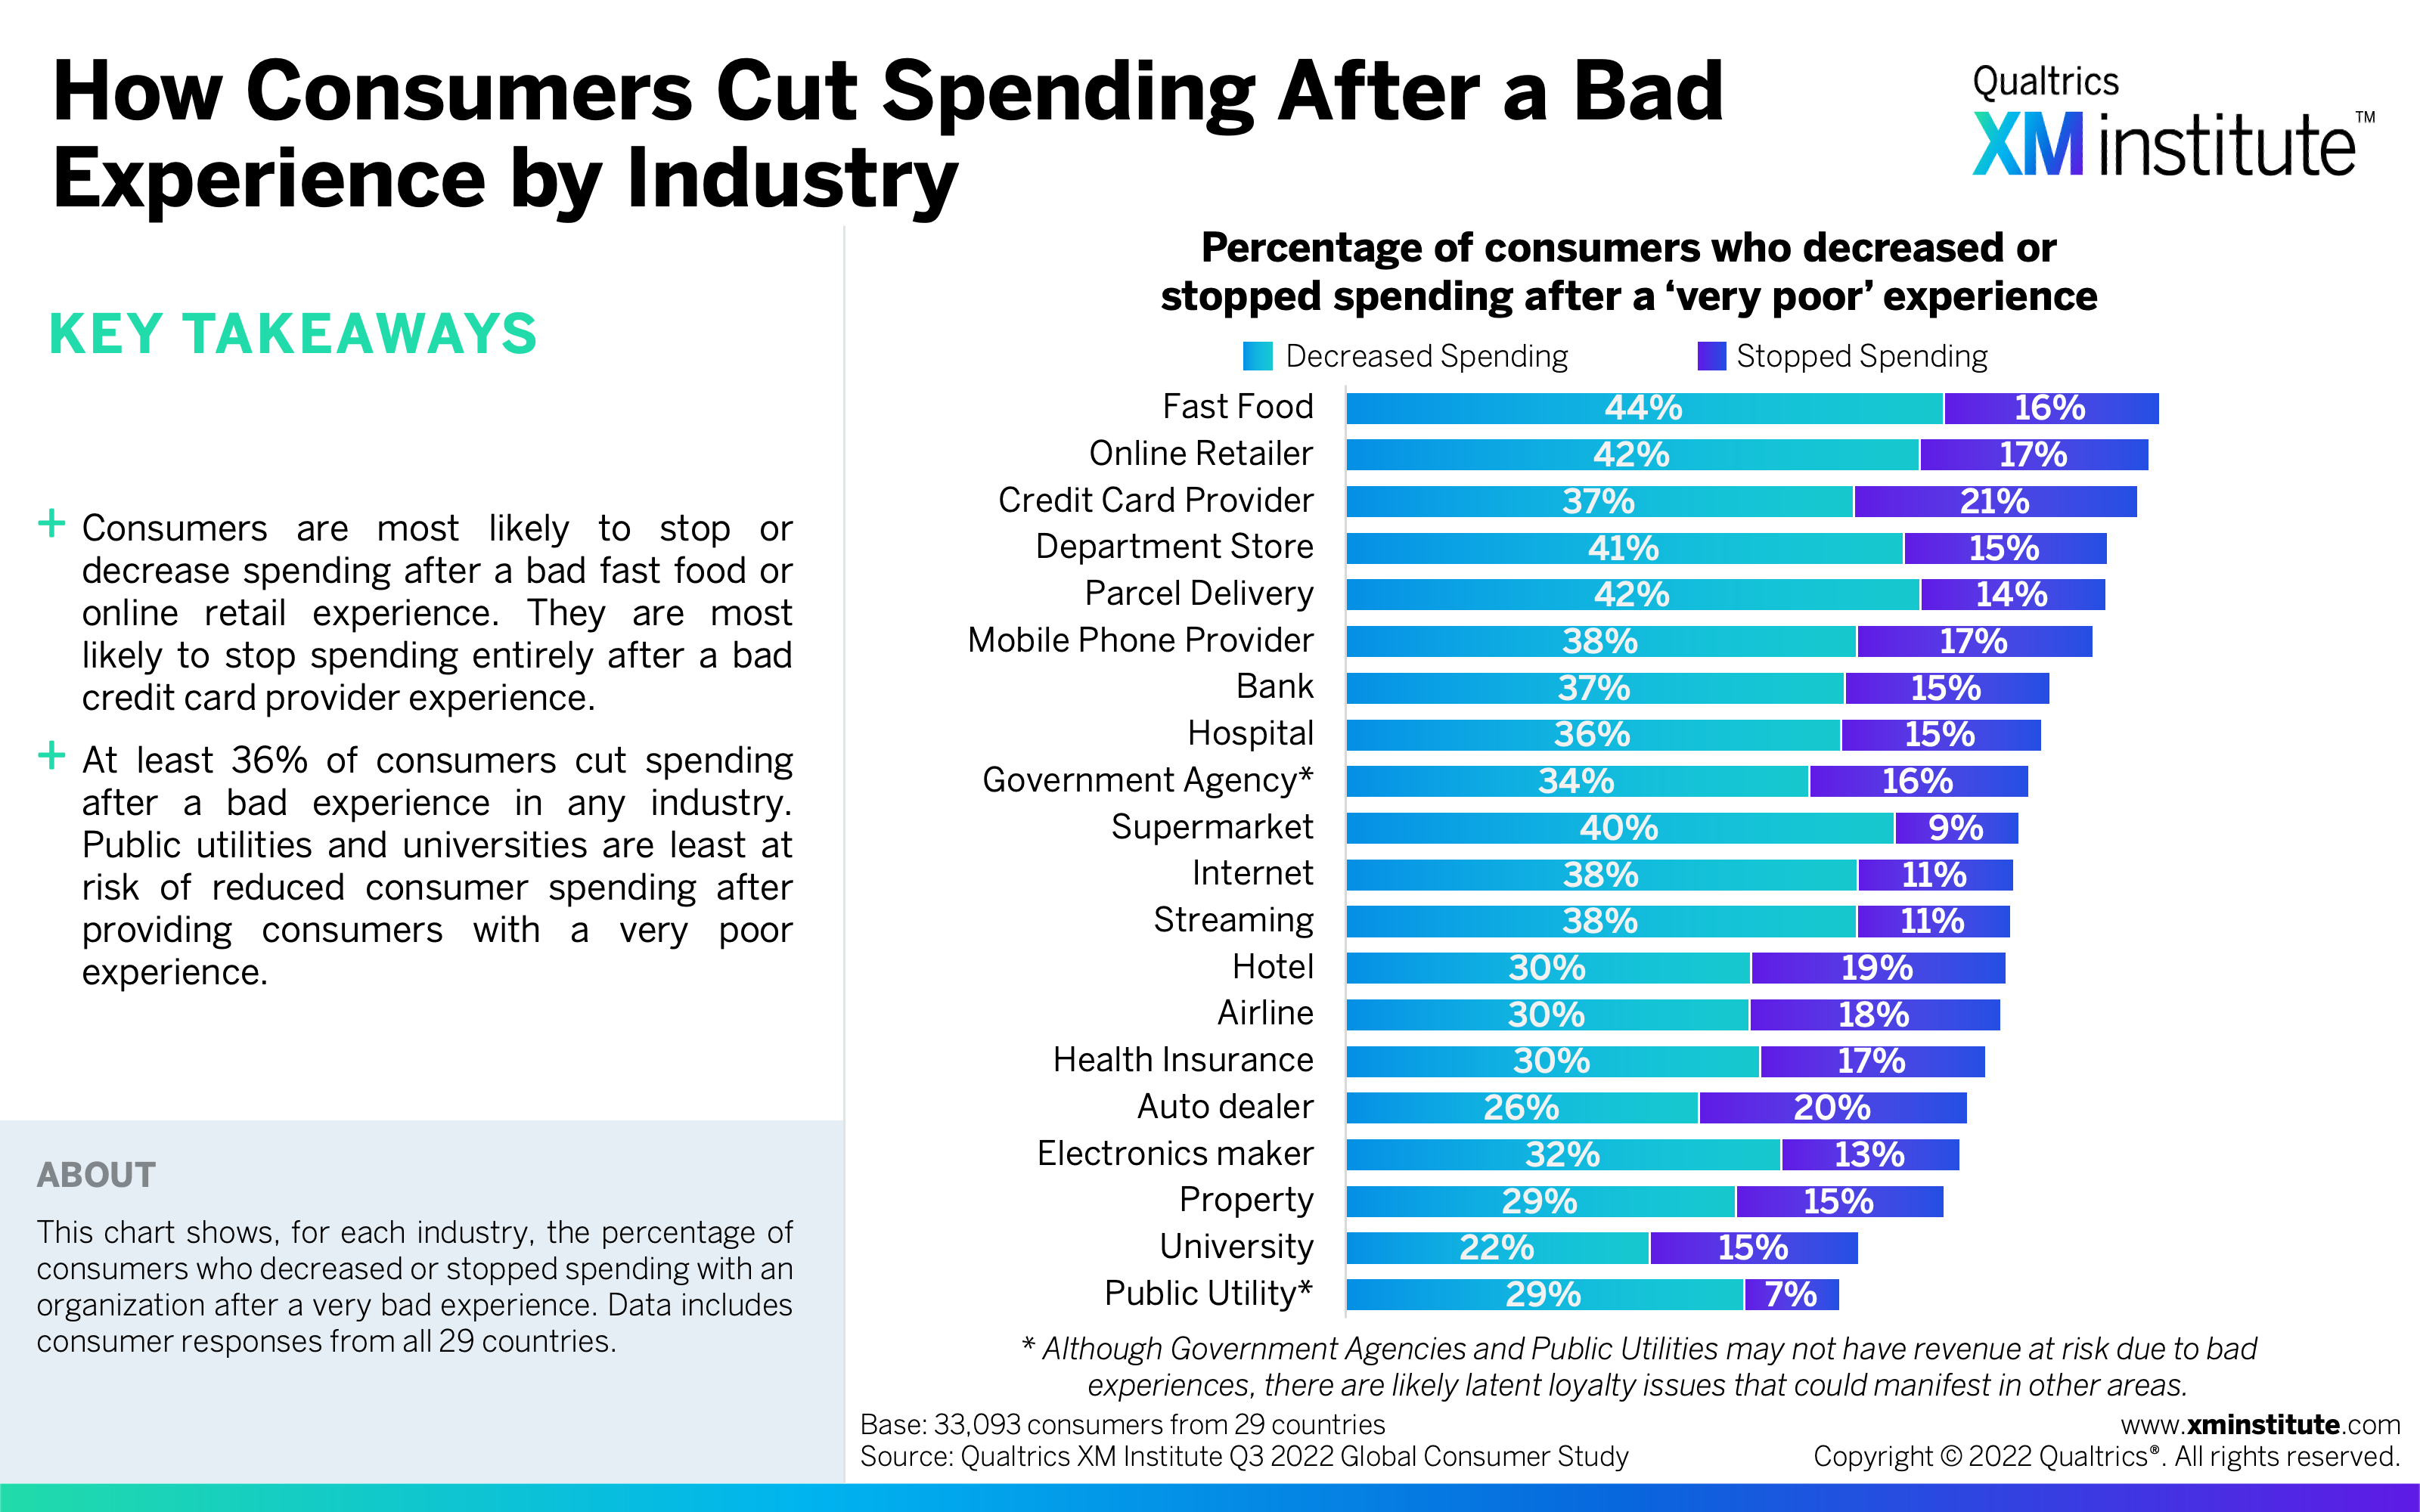
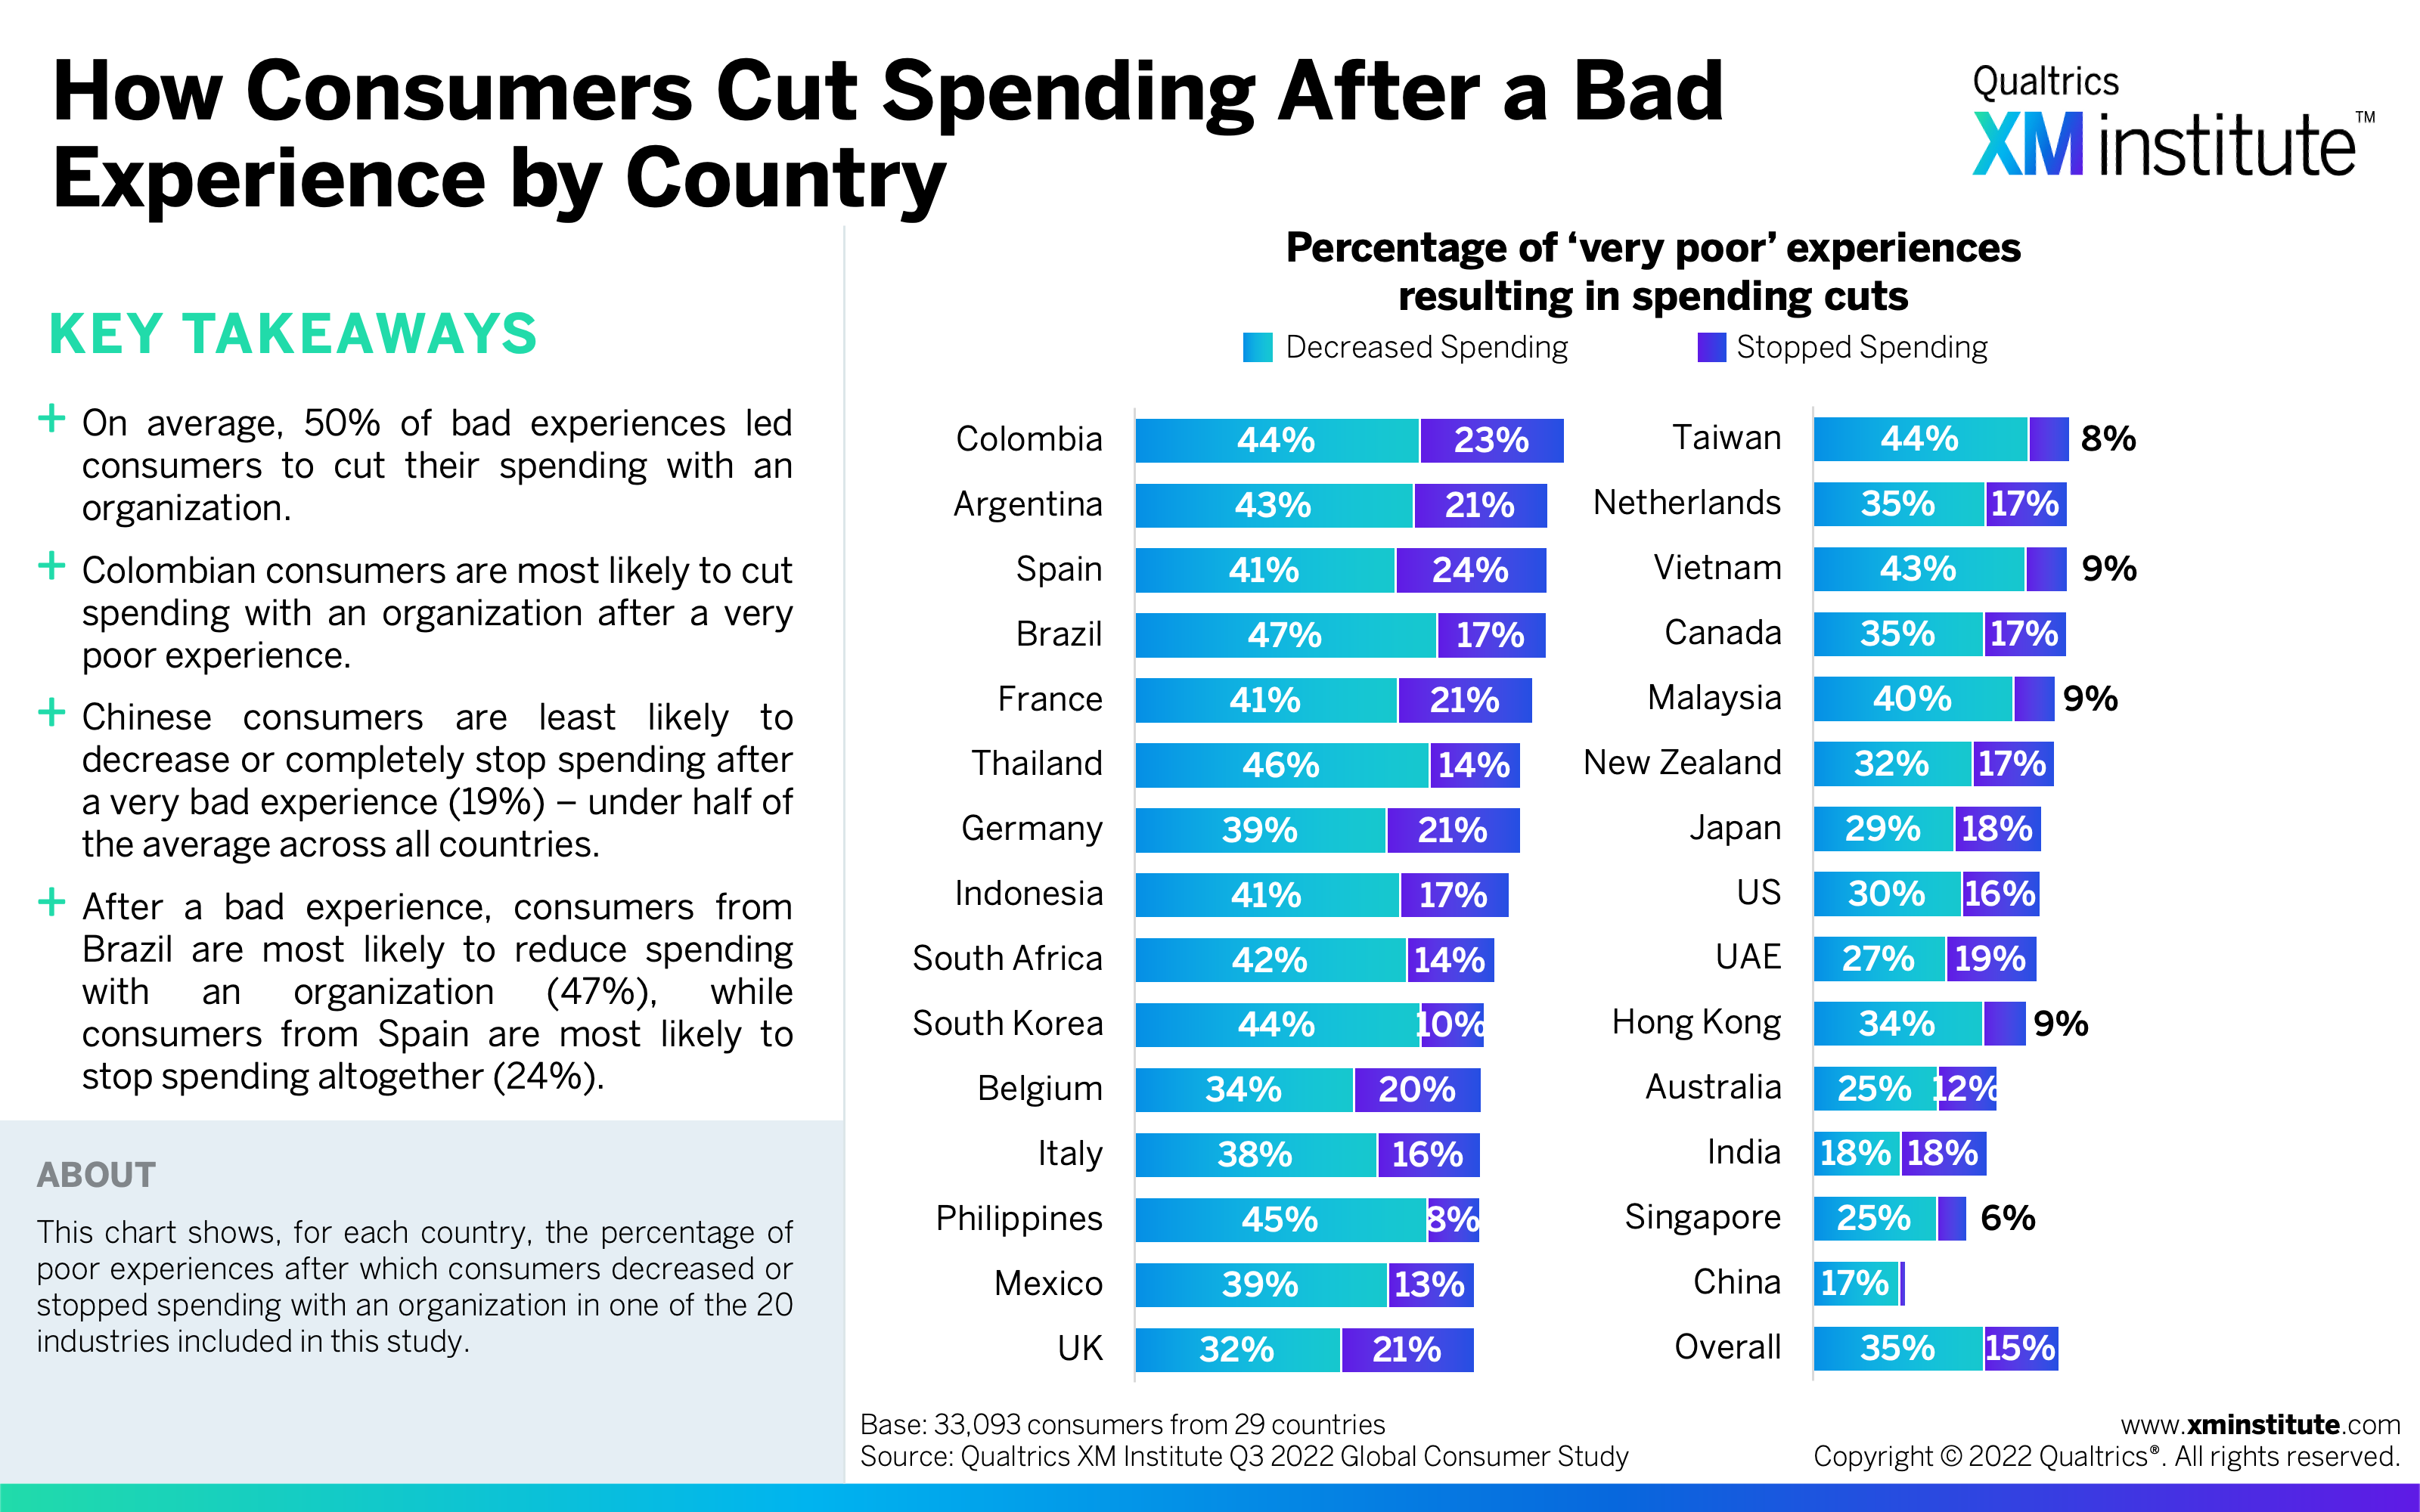
- Consumers cut spending after bad experiences. At least one-third of consumers reduced their spending after a bad experience with an organization, ranging from 36% of consumers cutting their spending after a bad public utility experience to 60% of consumers reducing their spending after a bad fast food experience. Chinese consumers have the least propensity to reduce their spending, while Colombian consumers are most likely to do so.
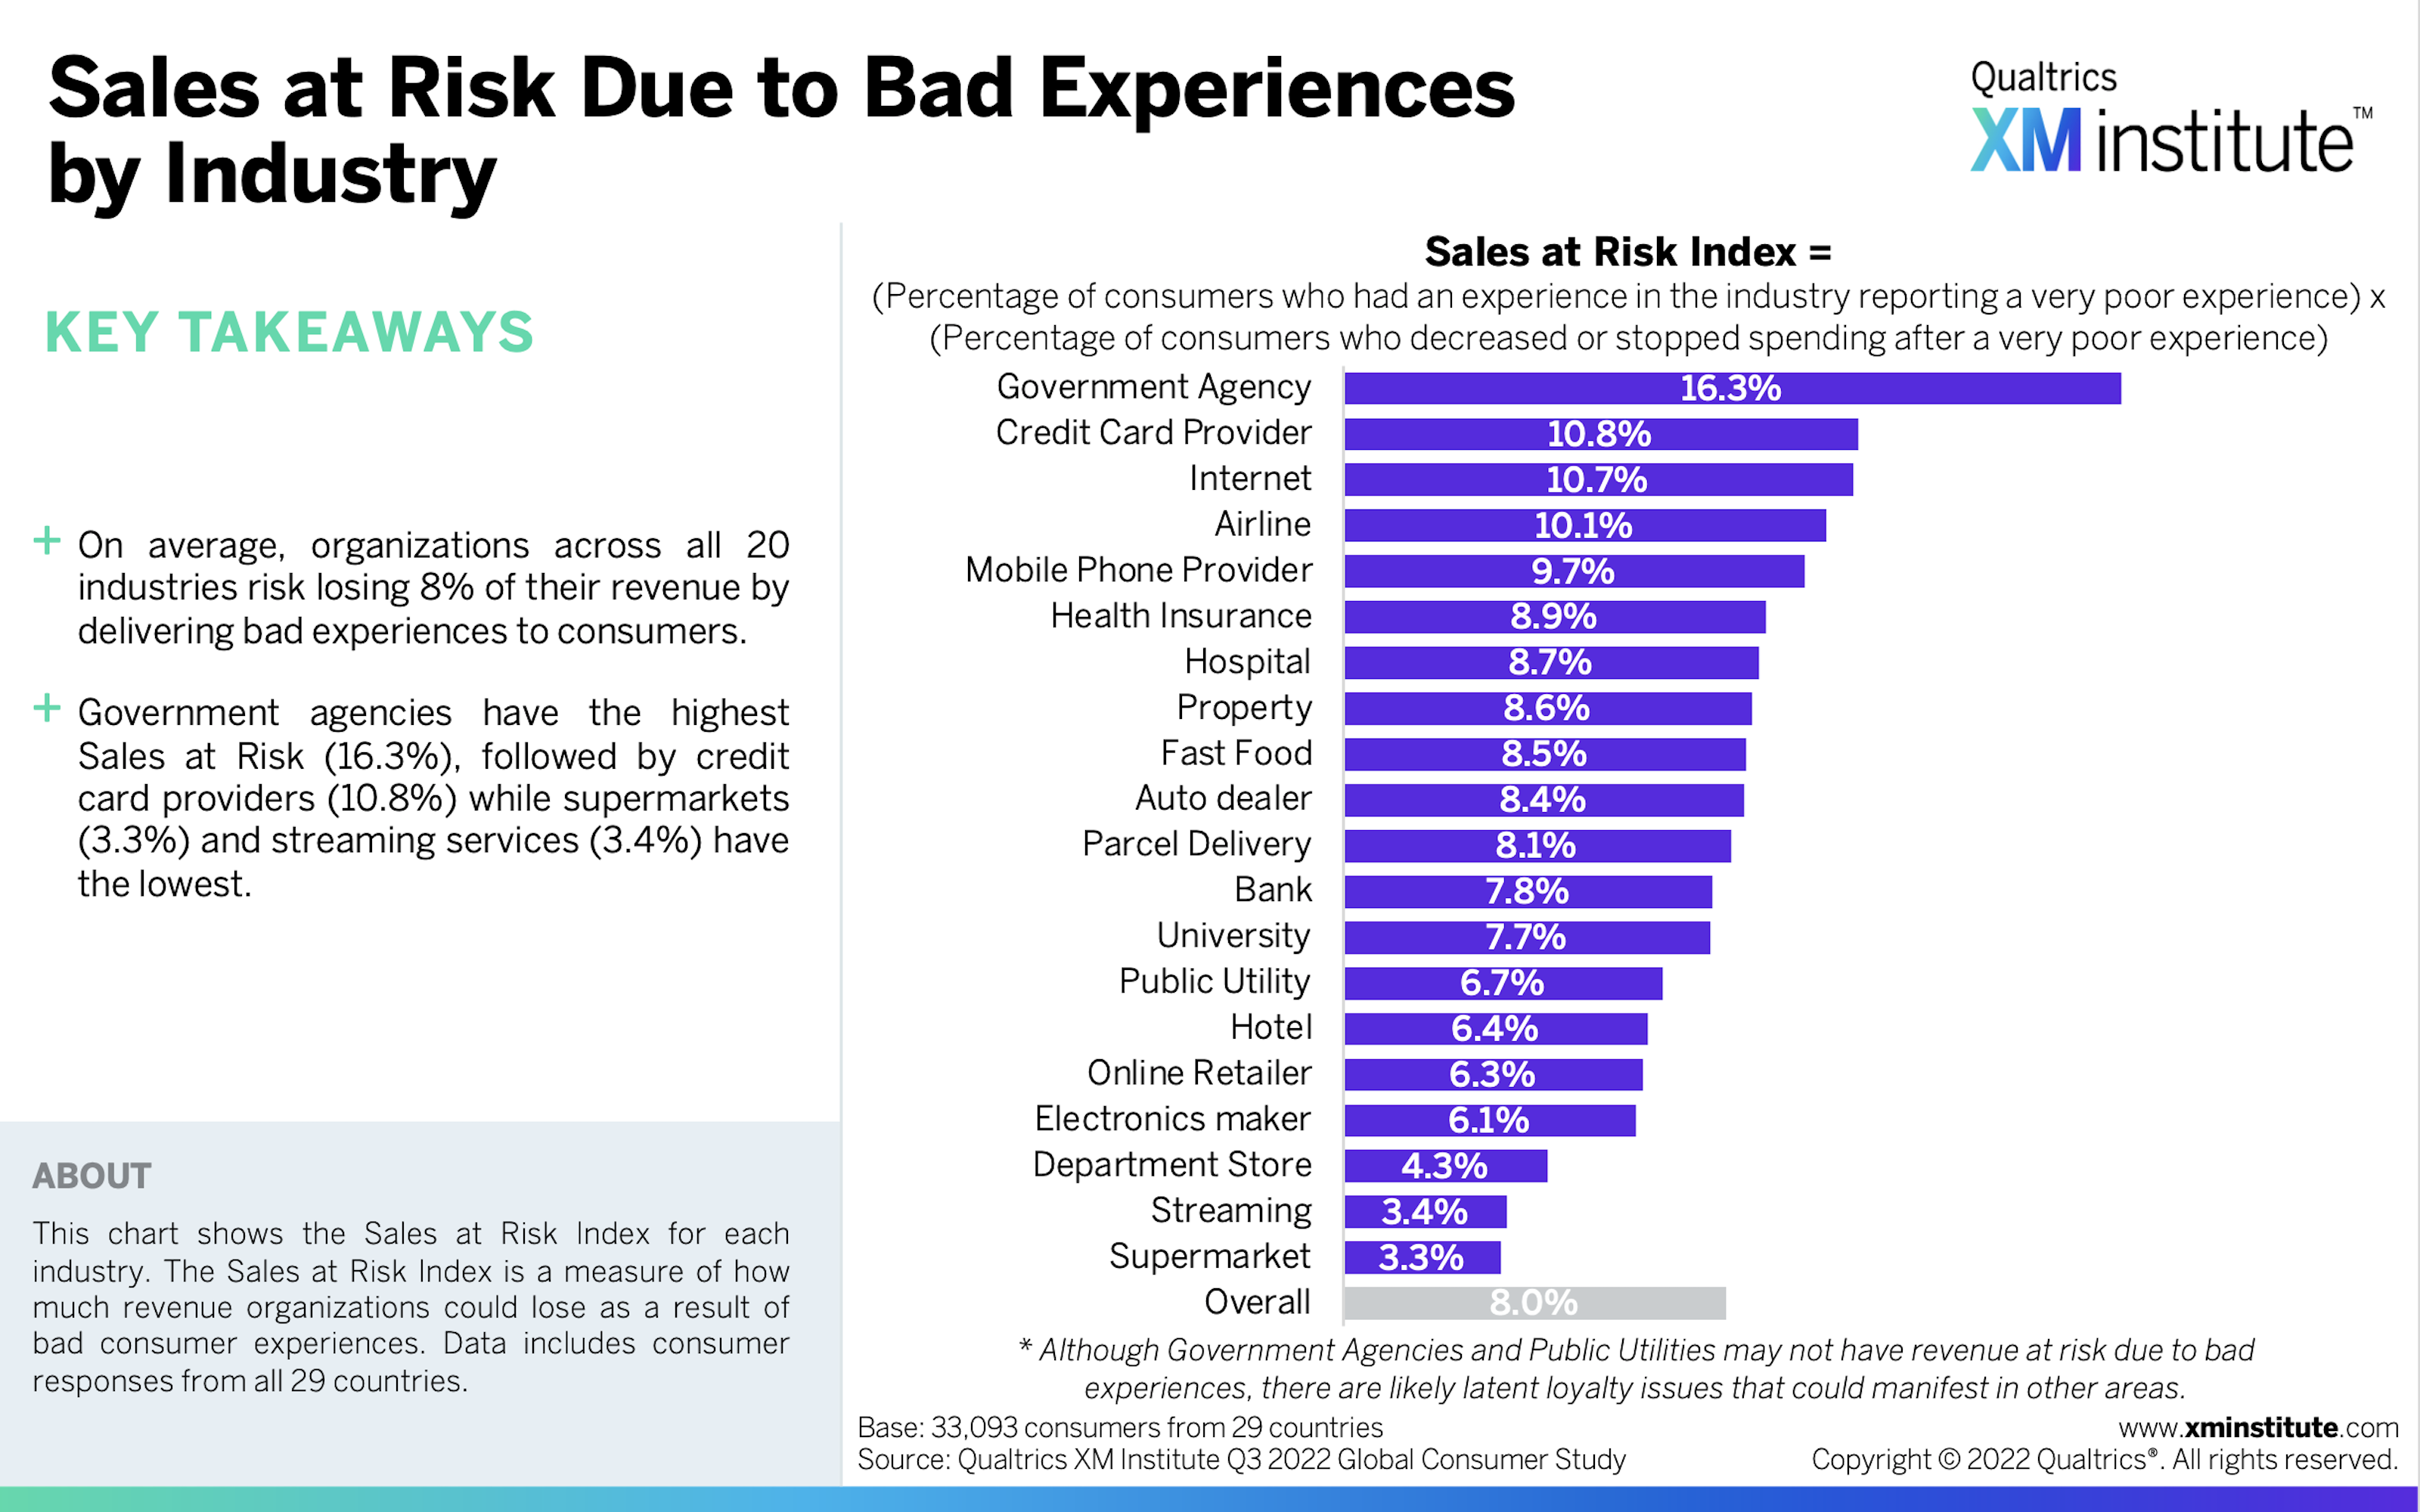
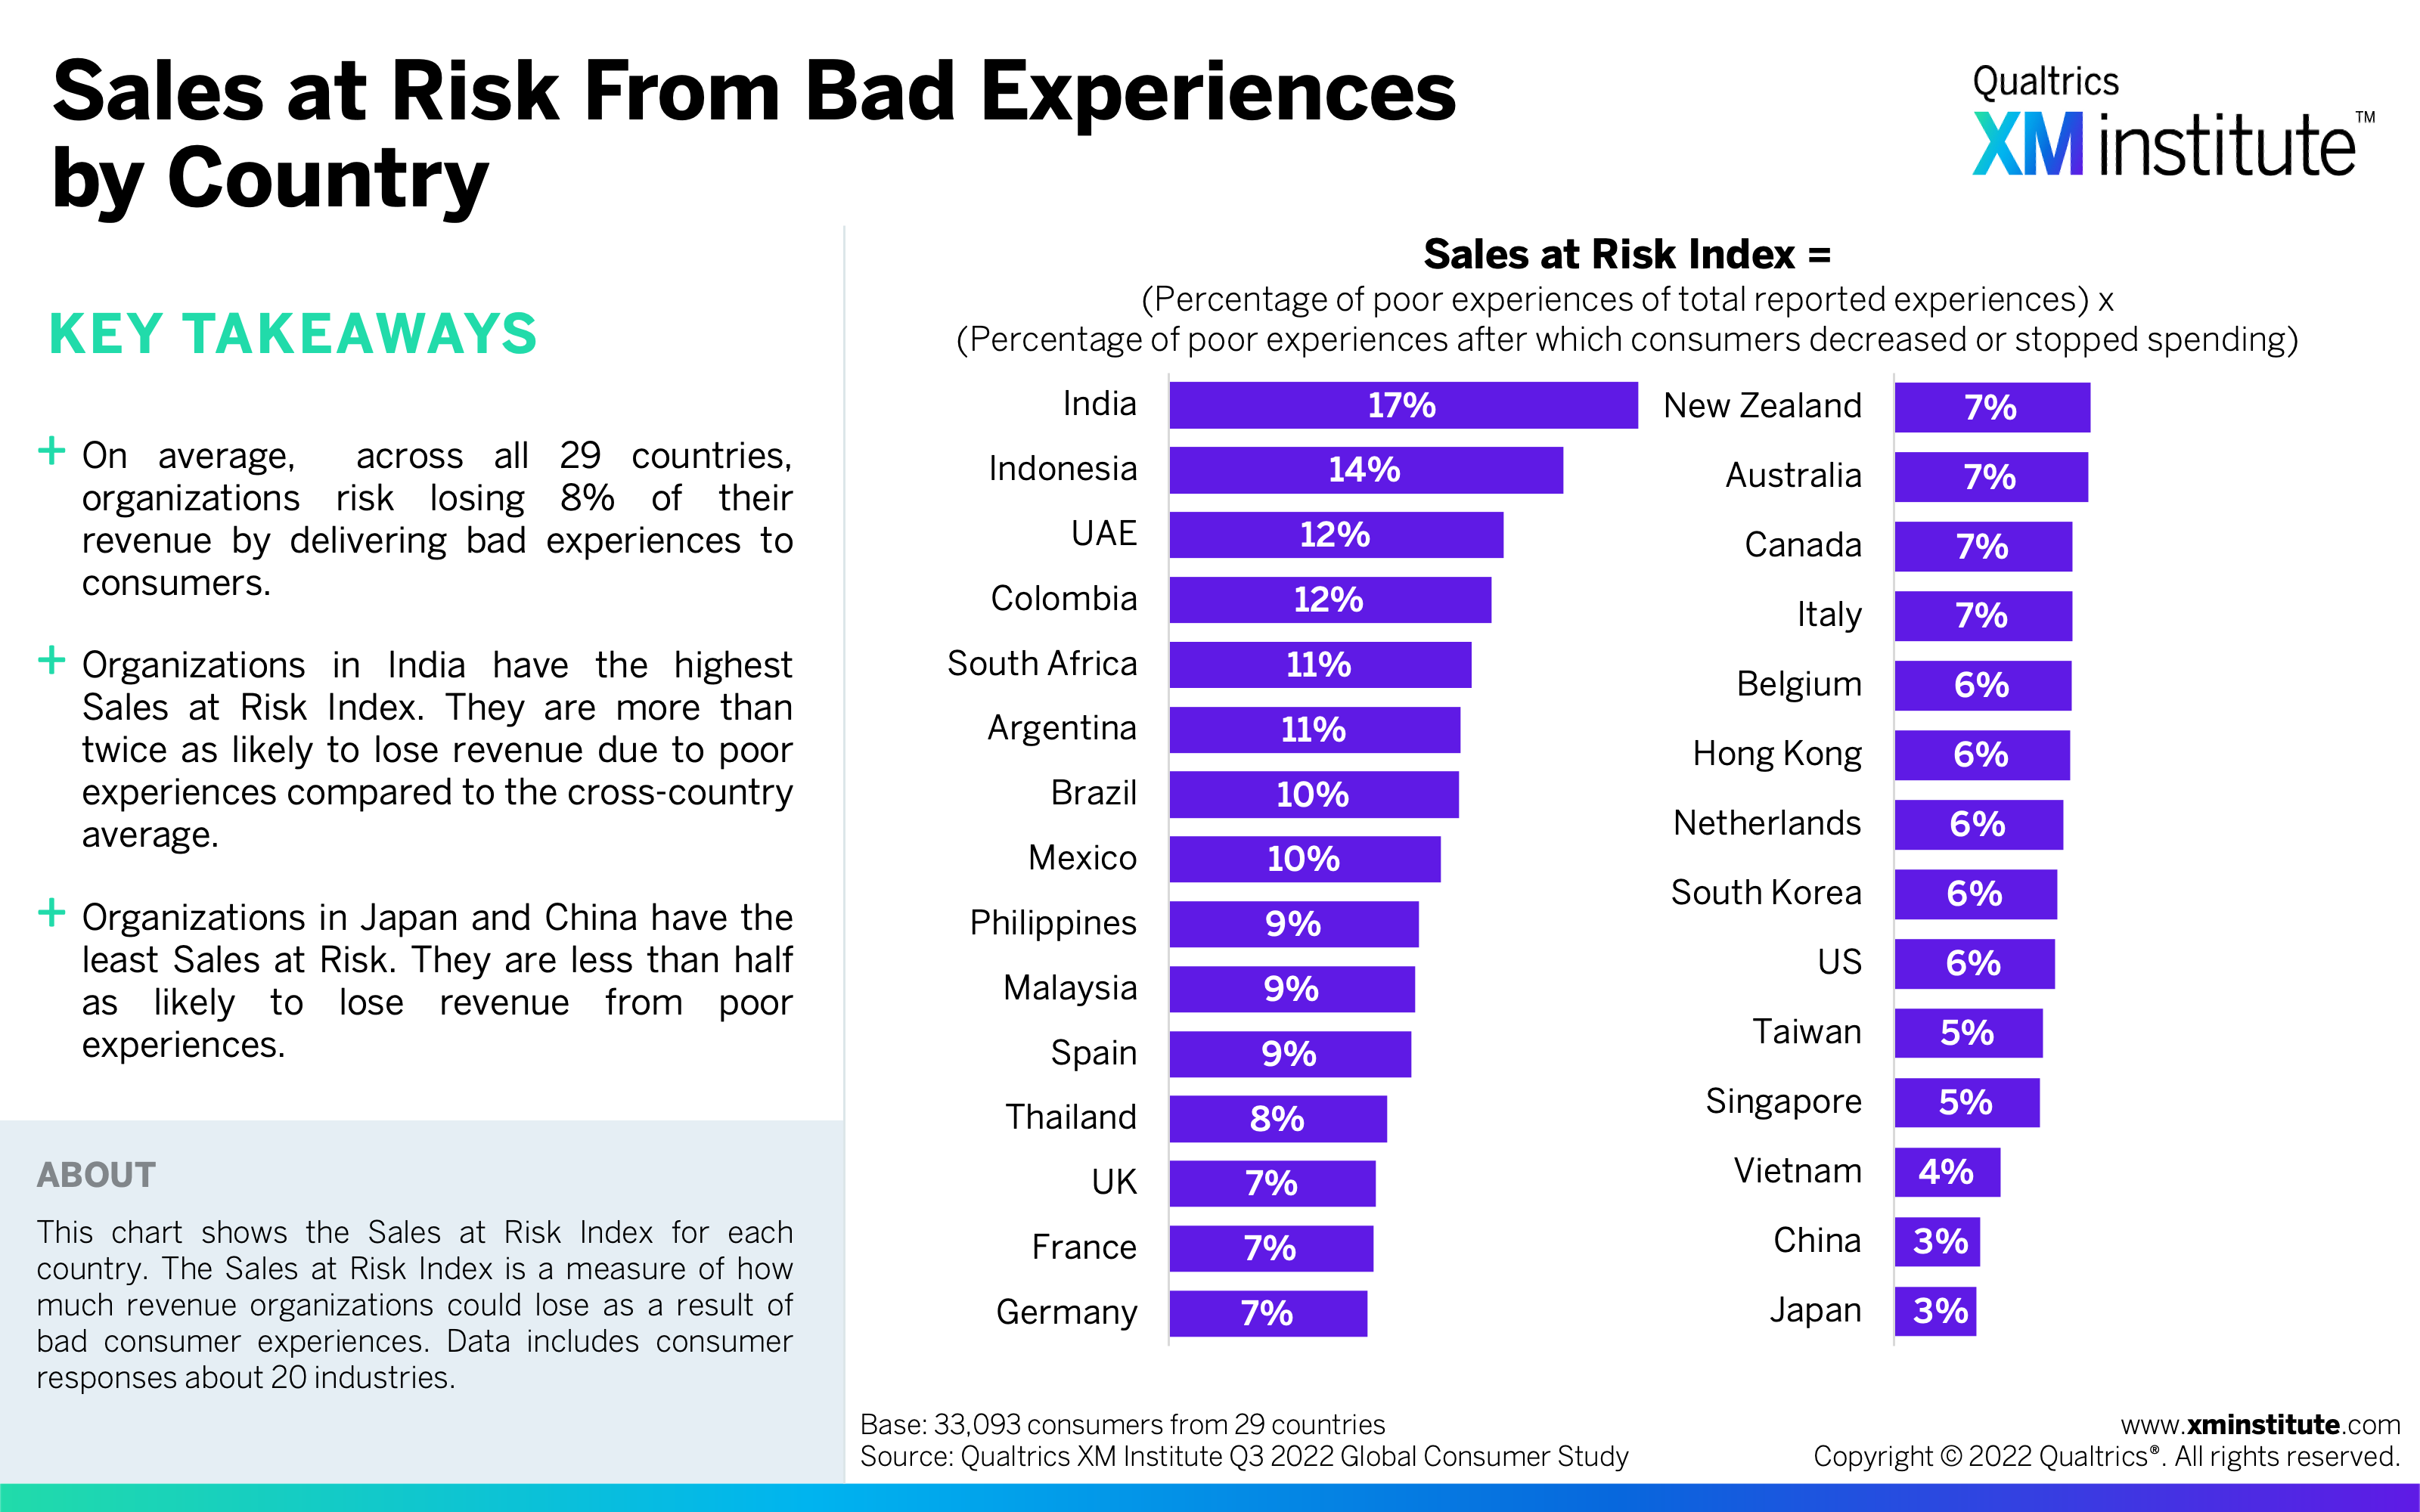
- Bad experiences put sales at risk. On average, organizations risk losing 8% of their revenue due to very poor experiences. After government agencies, credit card providers have the highest percentage of sales at risk (10.8%), while supermarkets have the least sales at risk (3.3%). The risk is highest for Indian organizations and lowest for those in Japan.
Figures
Here are the figures in this Data Snapshot:
- Bad Experiences by Industry (see Figure 1)
- How Consumers Cut Spending After a Bad Experience by Industry (see Figure 2)
- Sales at Risk Due to Bad Experiences by Industry (see Figure 3)
- Percentage of Bad Experiences by Country (see Figure 4)
- How Consumers Cut Spending After a Bad Experience by Country (see Figure 5)
- Sales at Risk from Bad Experiences by Country (see Figure 6)
- Bad Experiences by Country and Industry (Part 1) (see Figure 7)
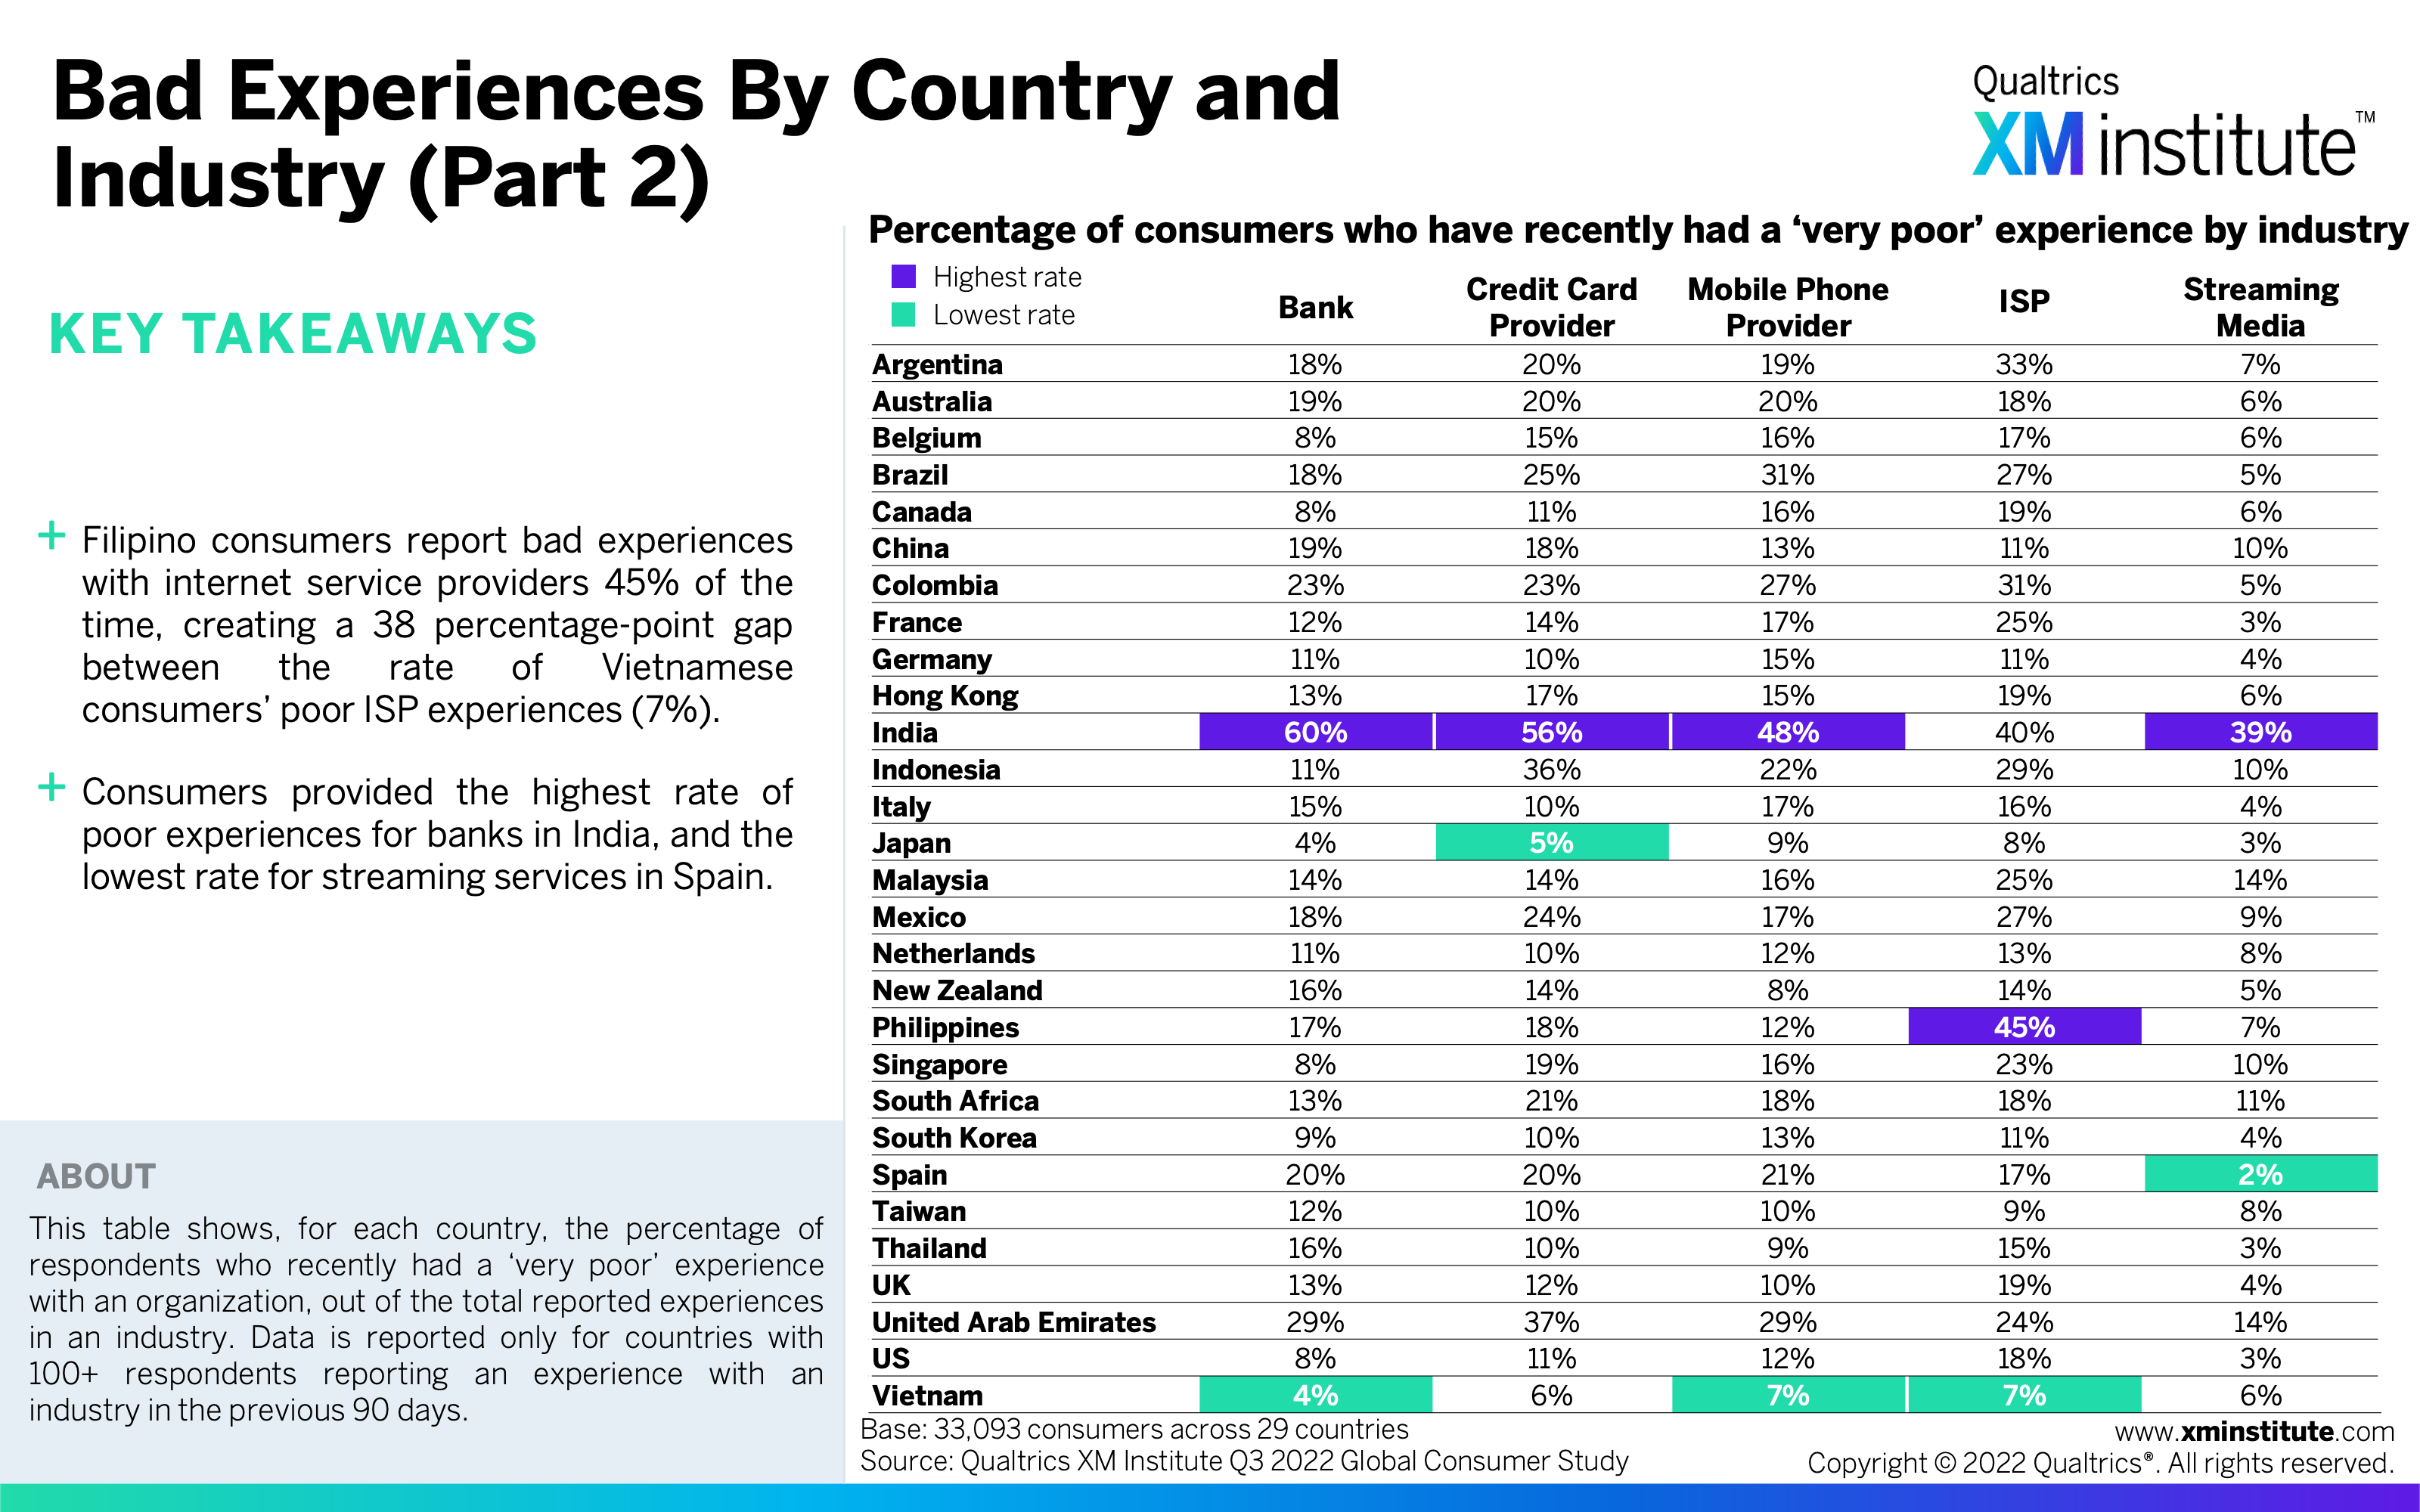
- Bad Experiences by Country and Industry (Part 2) (see Figure 8)
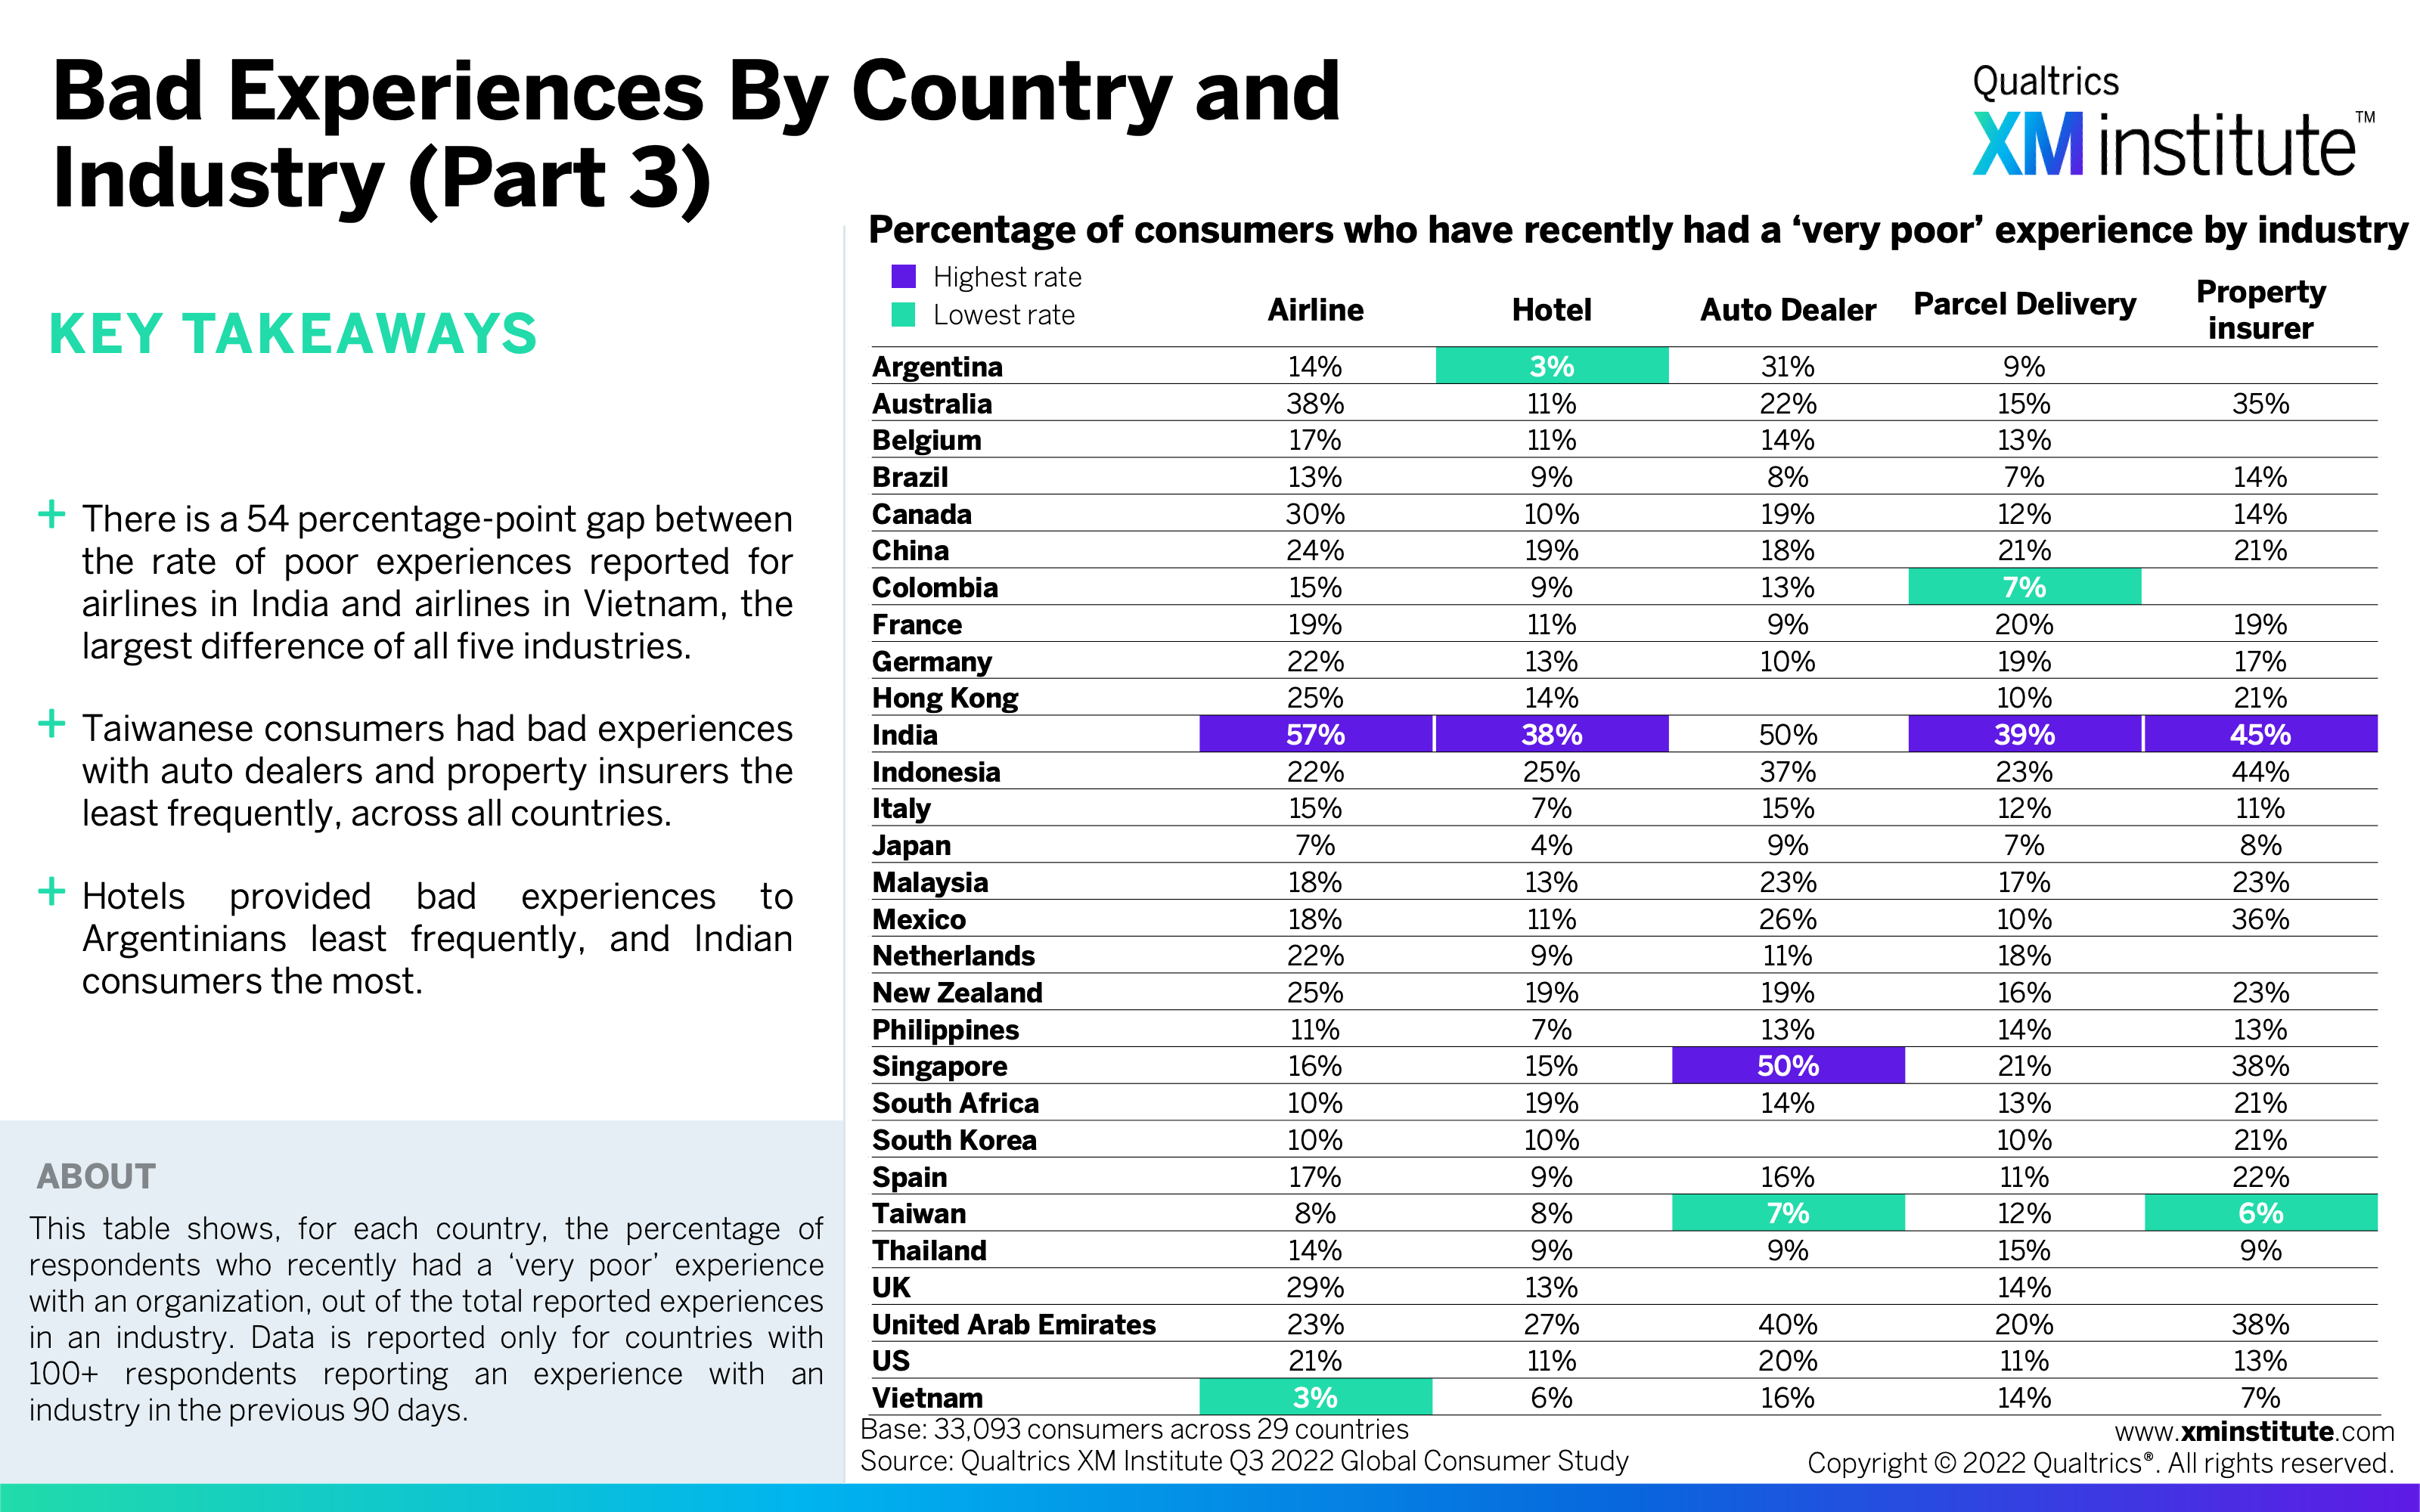
- Bad Experiences by Country and Industry (Part 3) (see Figure 9)
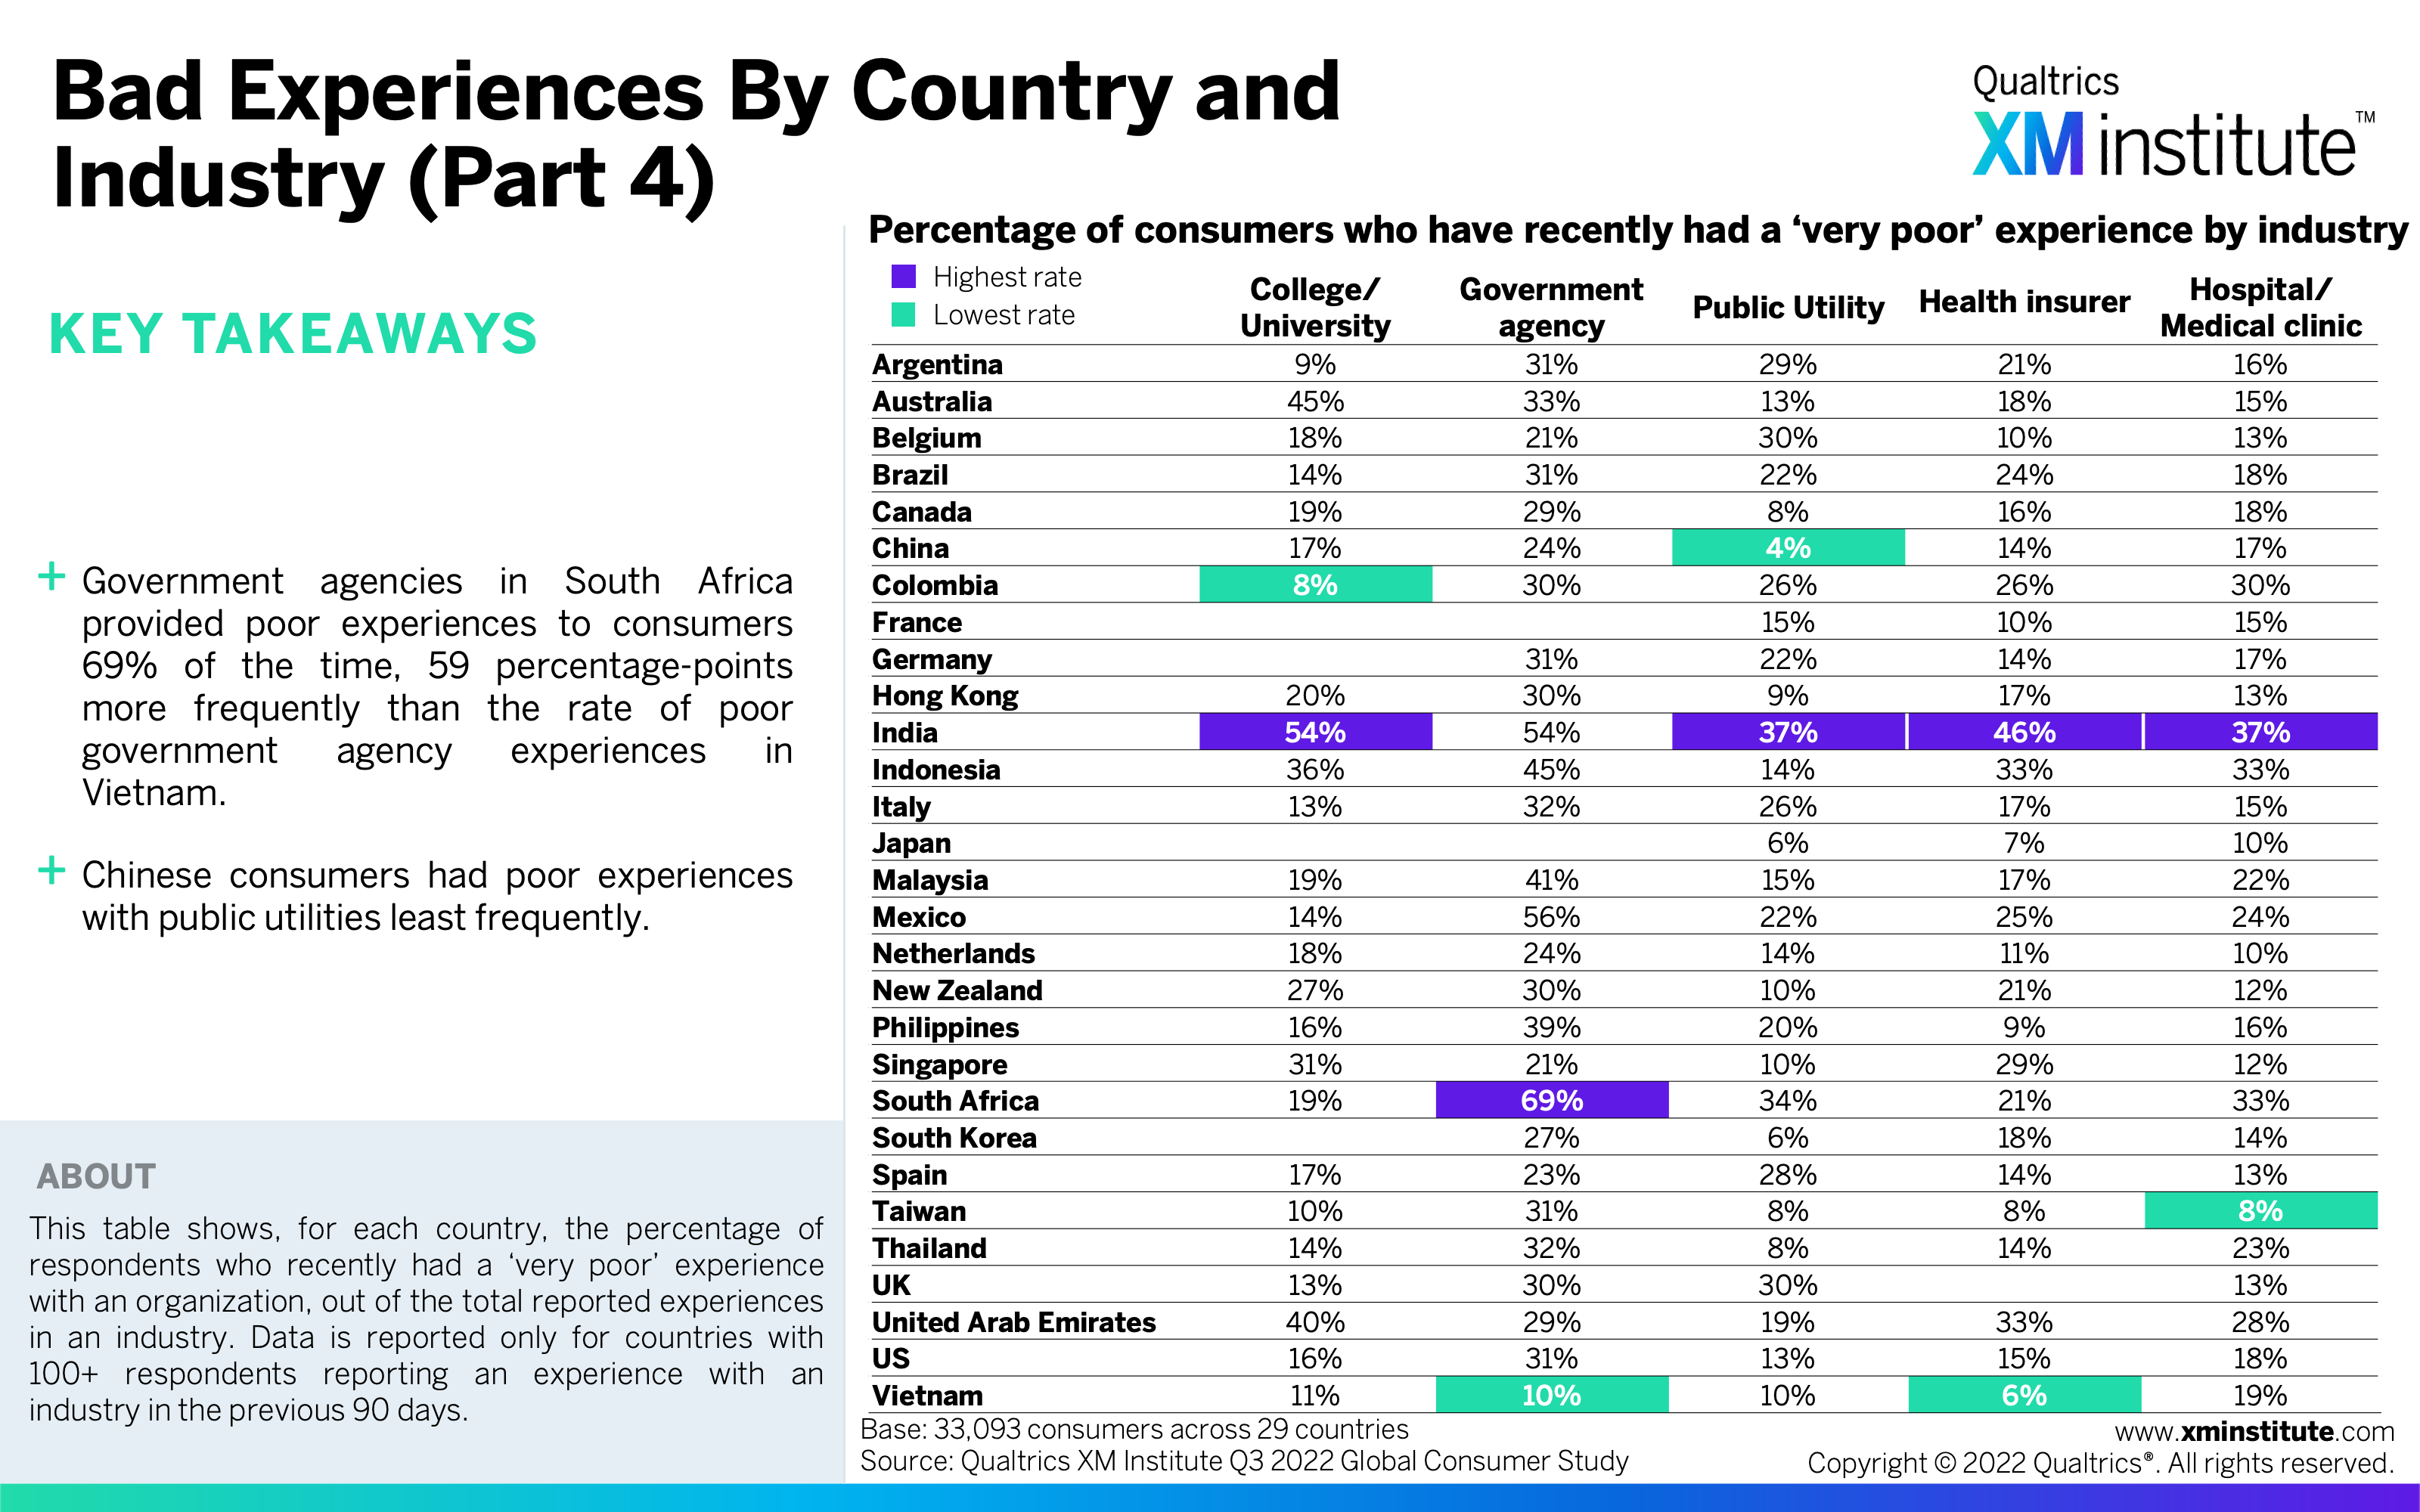
- Bad Experiences by Country and Industry (Part 4) (see Figure 10)
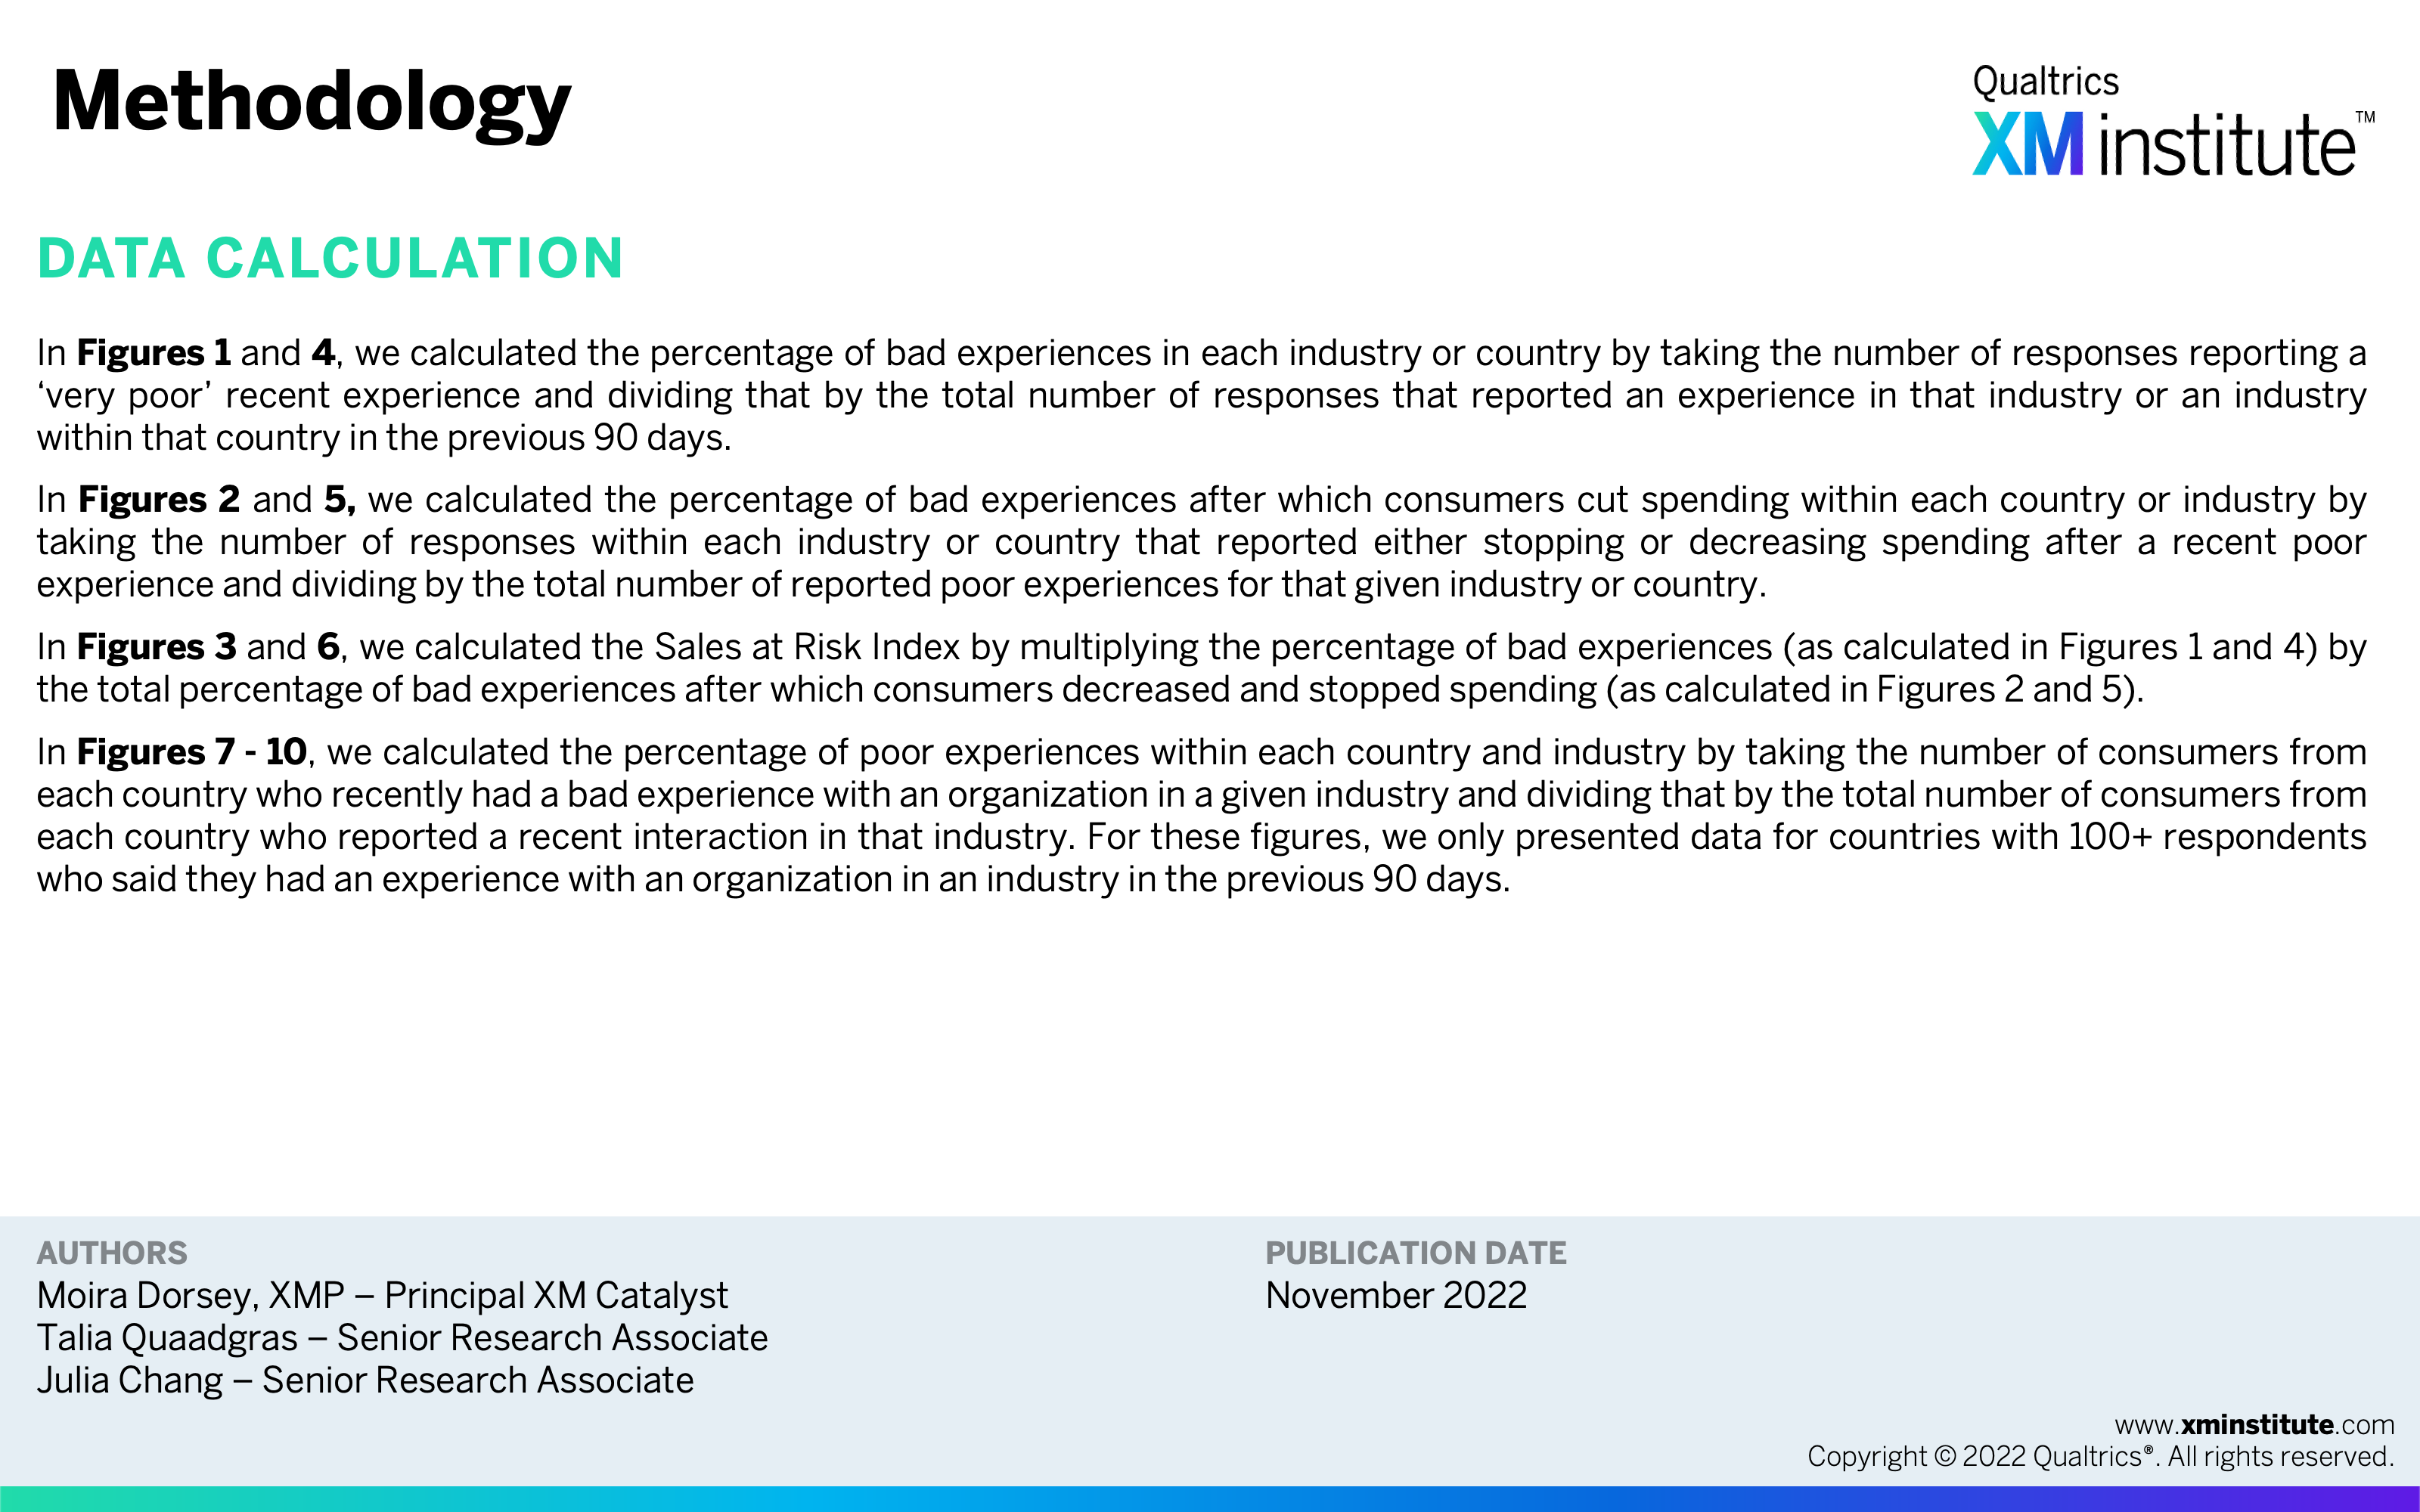
- Methodology (see Figure 11)