Key Findings
As part of our latest global consumer study, 33,093 consumers from 29 countries were asked to choose which of the following five channels they would prefer to use to complete nine common interactions: self-service on their computer, self-service on their mobile phone, chat with a person on their computer, talk with someone on the phone, or meet with someone in person. From our analysis, we found that:
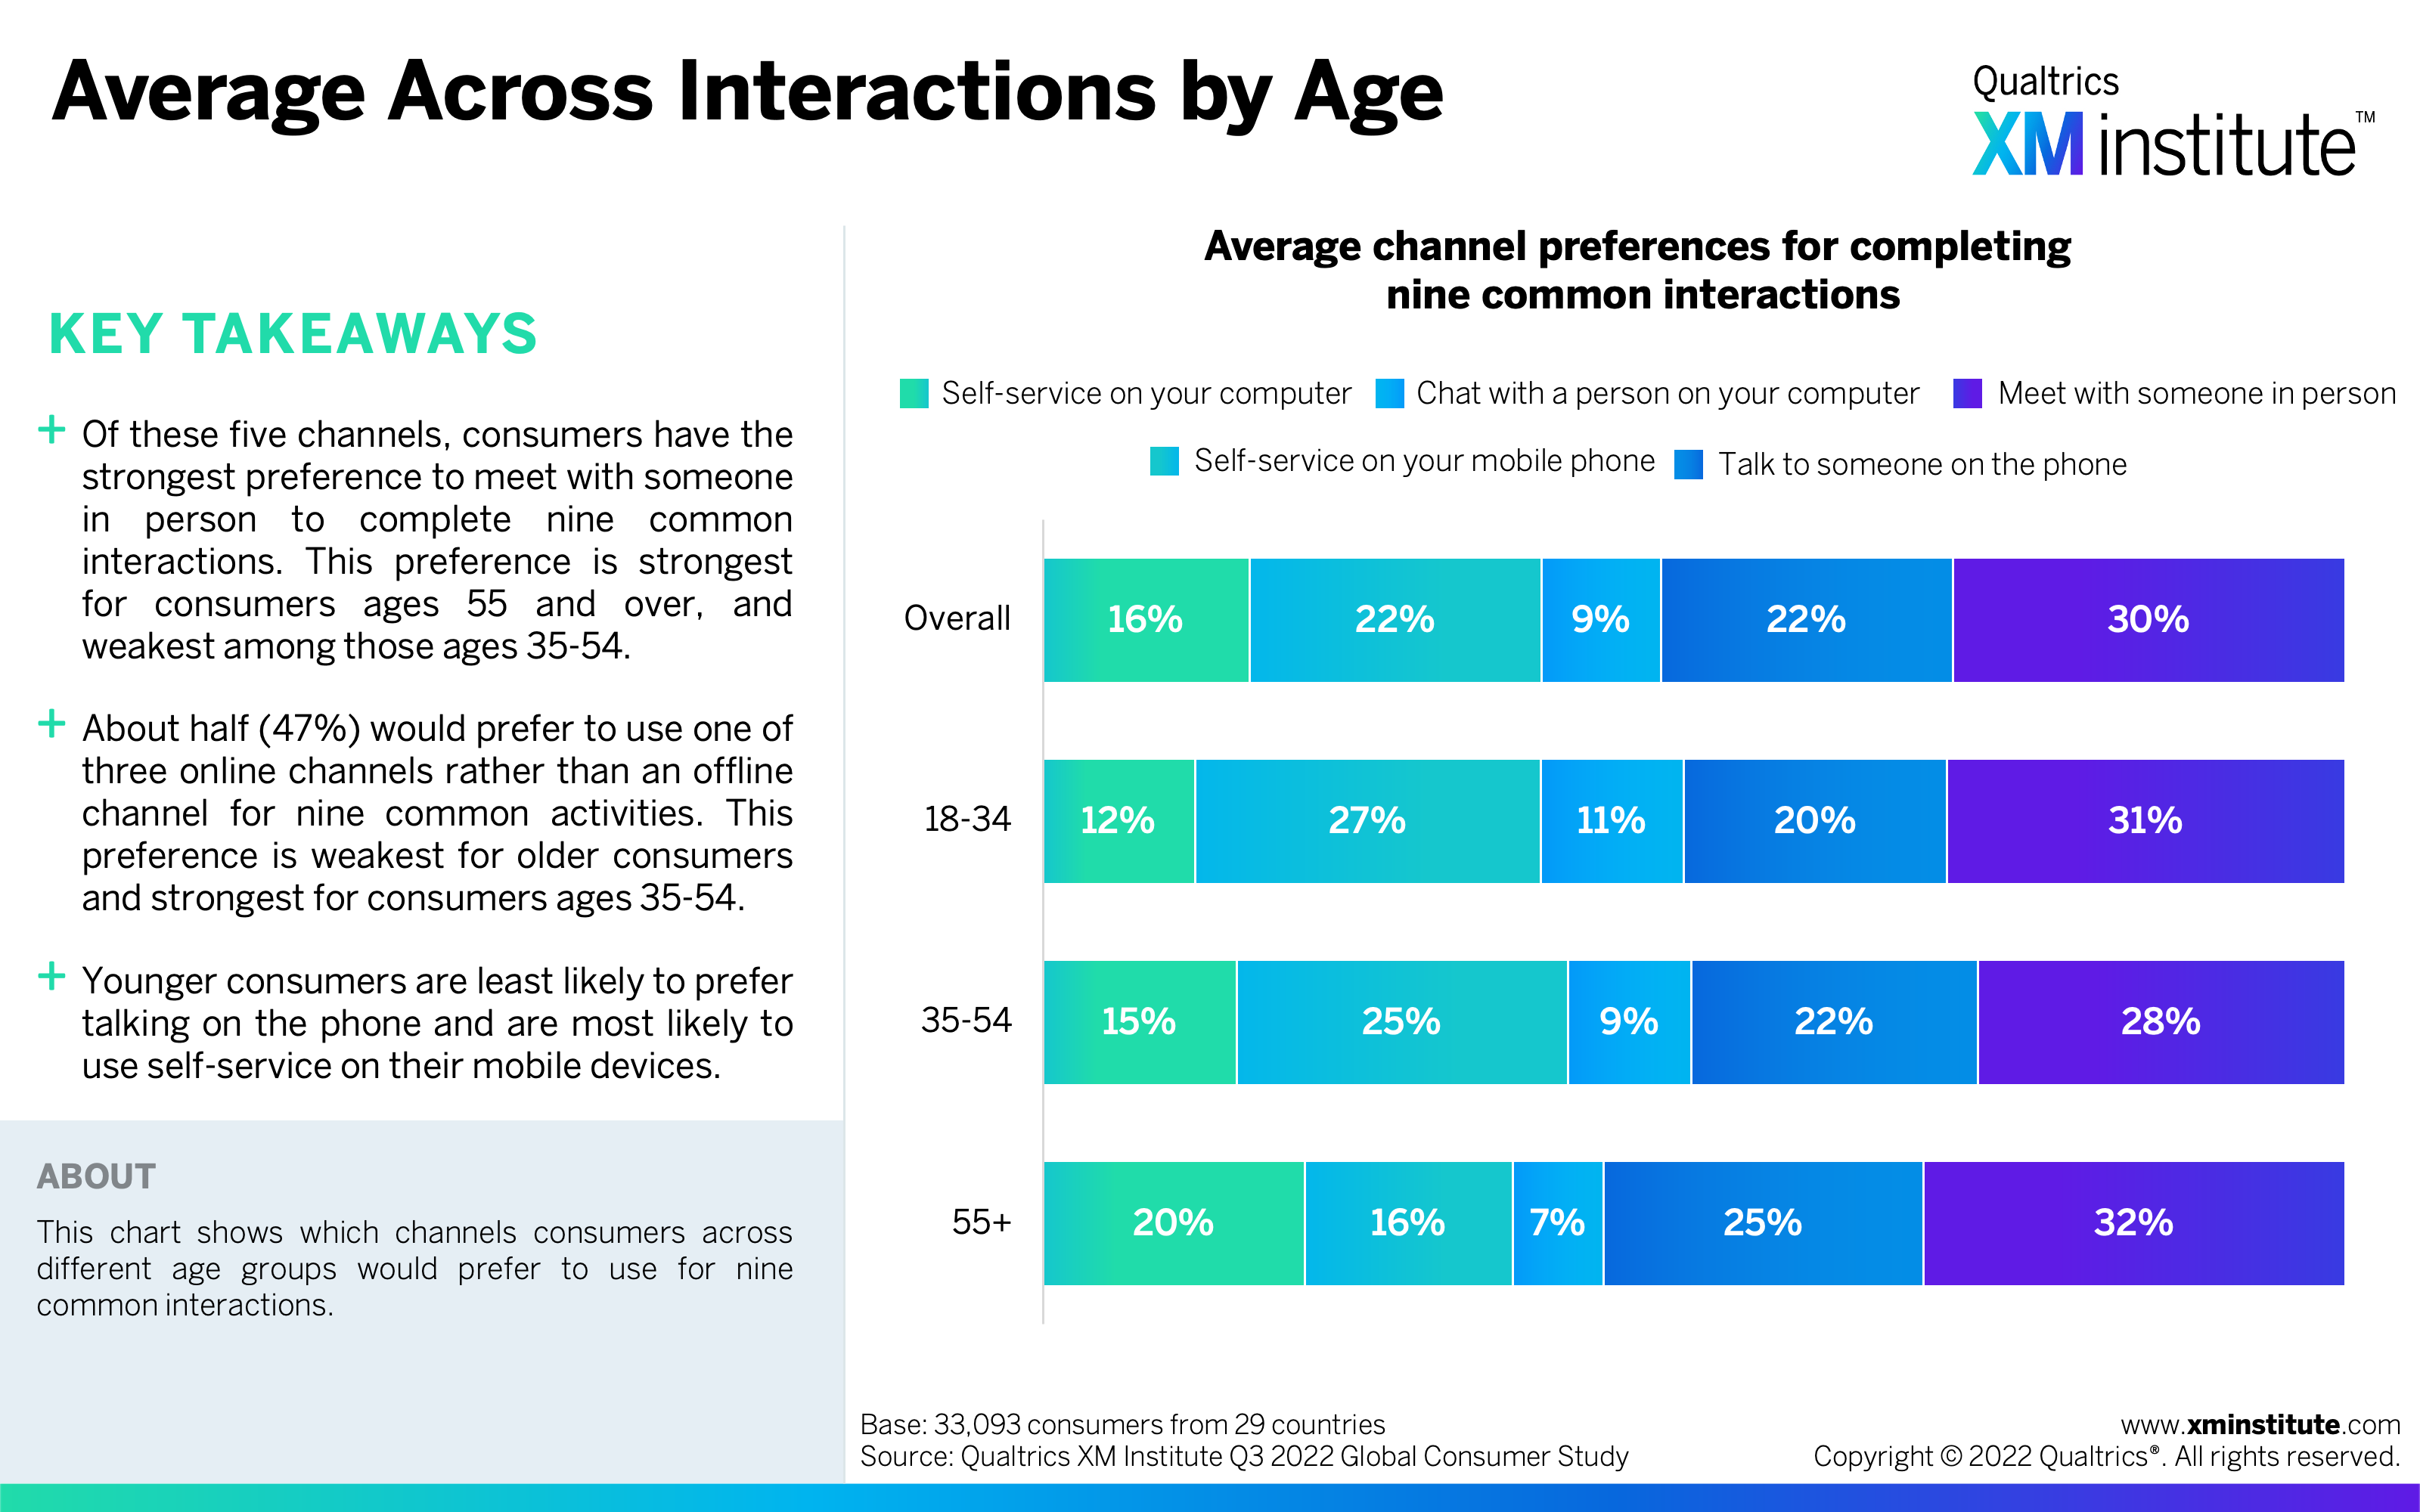
- Consumers slightly prefer offline channels. Overall, 53% of consumers prefer to either talk on the phone or meet with someone in person rather than one of three online channels (self-service on their computer, self-service on their mobile phone, or chat on a computer) to complete the nine common interactions we asked about.
- Chat is the least popular channel. Across all age groups and countries, consumers would prefer to use chat on their computer to complete an interaction just 9% of the time, the least of any channel. Meeting in person is the most popular channel preference, with consumers choosing this option 30% of the time on average.
- Younger consumers are the least likely to prefer self-service through a computer. Compared to the other two age groups, these consumers are the least likely to choose to complete activities through self-service on their computers. Instead, they are the most likely to use self-service on their mobile phone and chat on their computer.
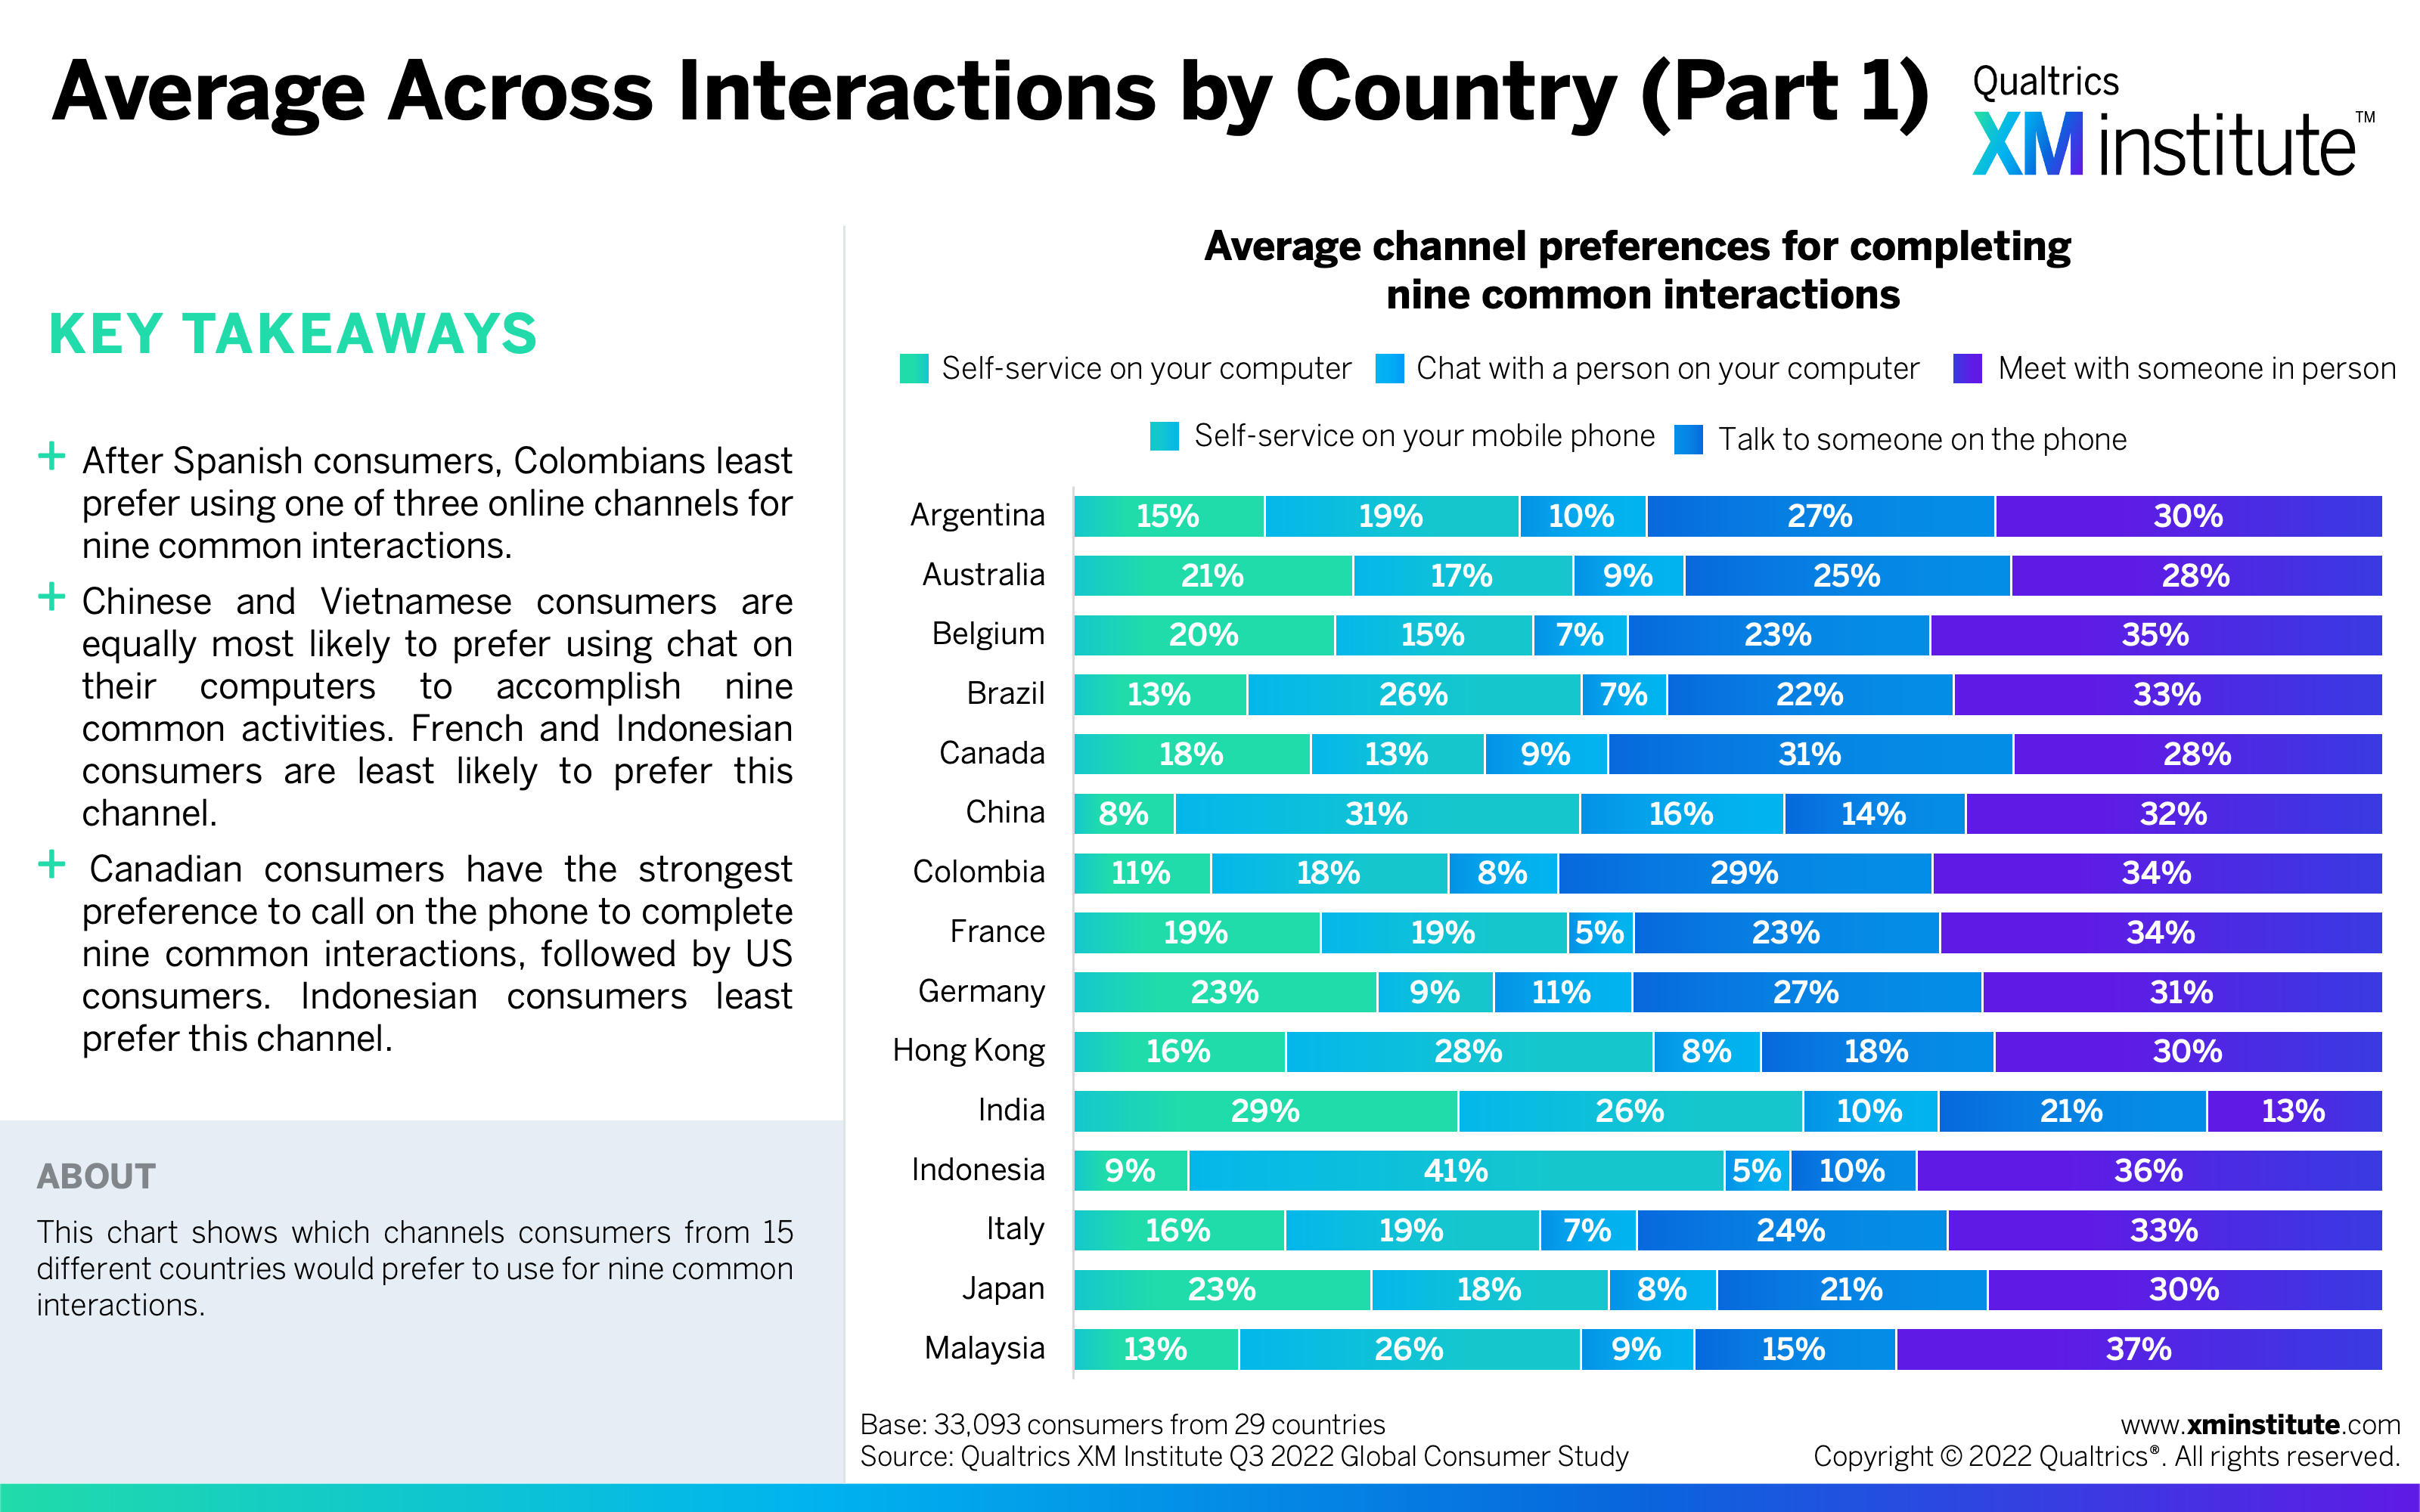
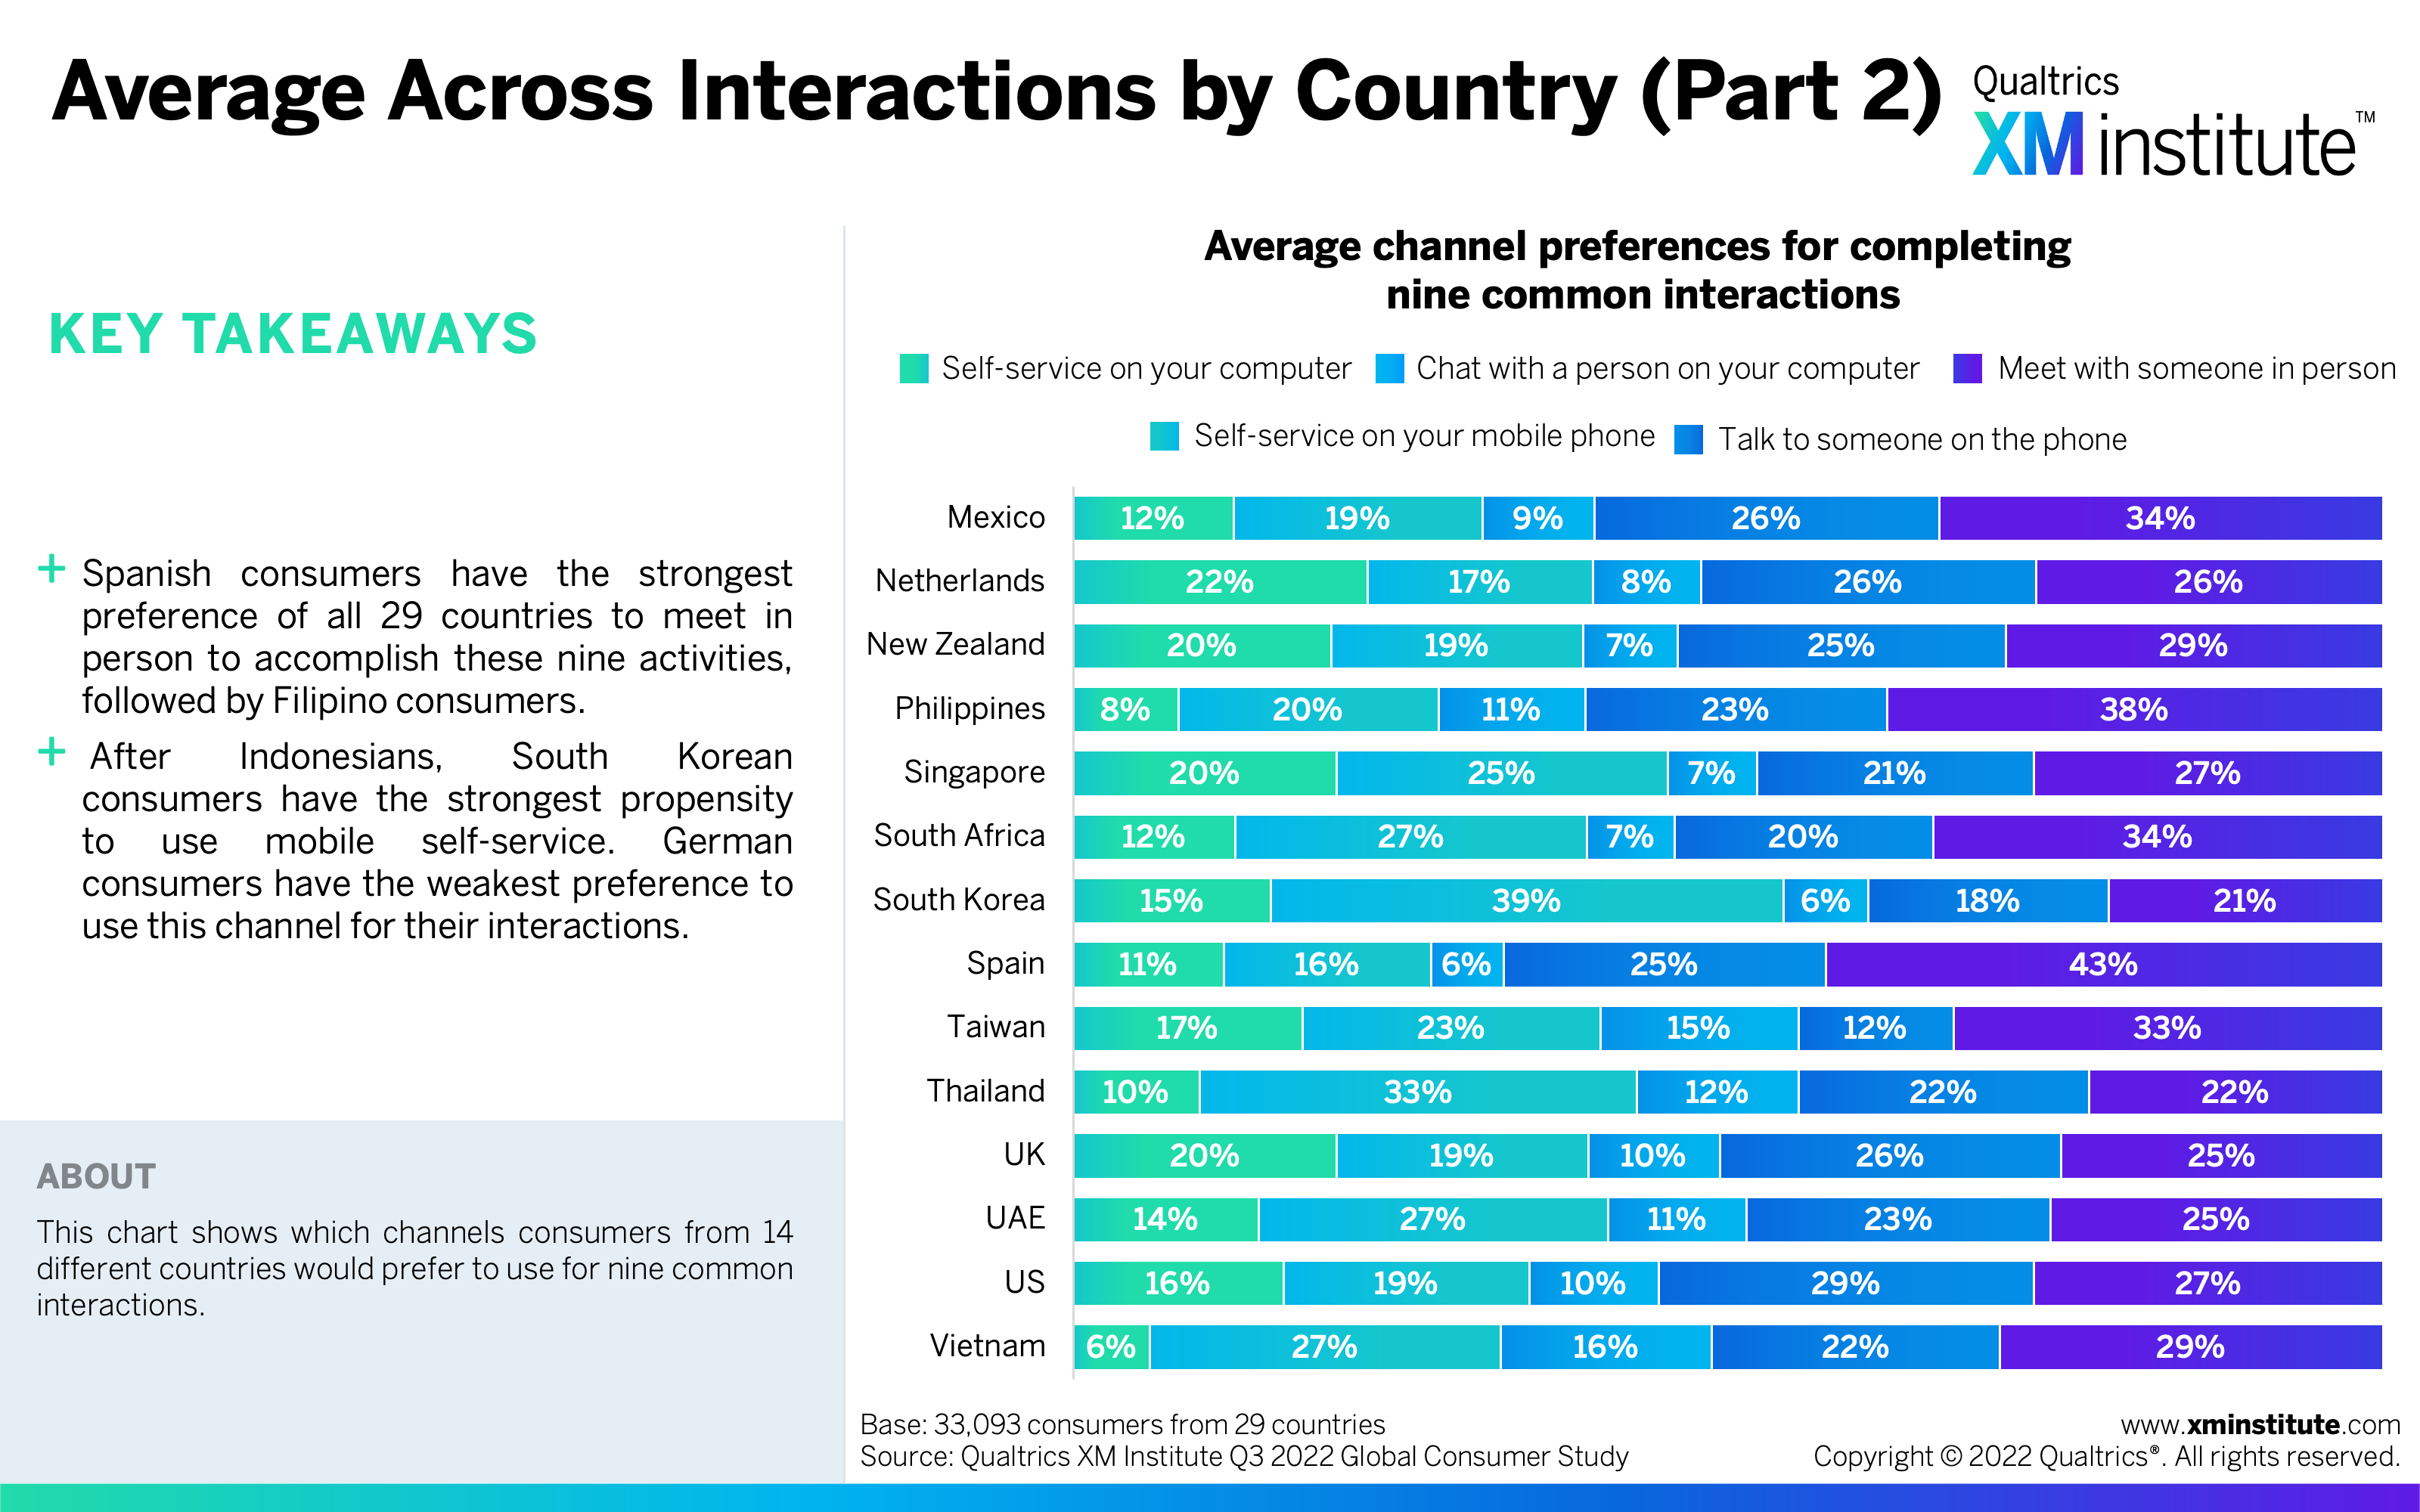
- Spanish consumers have the least preference for online channels. Spanish consumers would prefer to use one of three online channels just 33% of the time, the least of all countries. Indian consumers prefer to use online channels at double this rate, 66%— the strongest preference for online channels across all countries.
- Indonesian consumers prefer to use self-service on their phones the most. On average, 41% of Indonesians said they prefer to use self-service on their mobile device. South Korean consumers have the second-strongest preference for this channel, at 39%.
Figures
Here are the figures in this Data Snapshot:
- Average across Interactions by Age (see Figure 1)
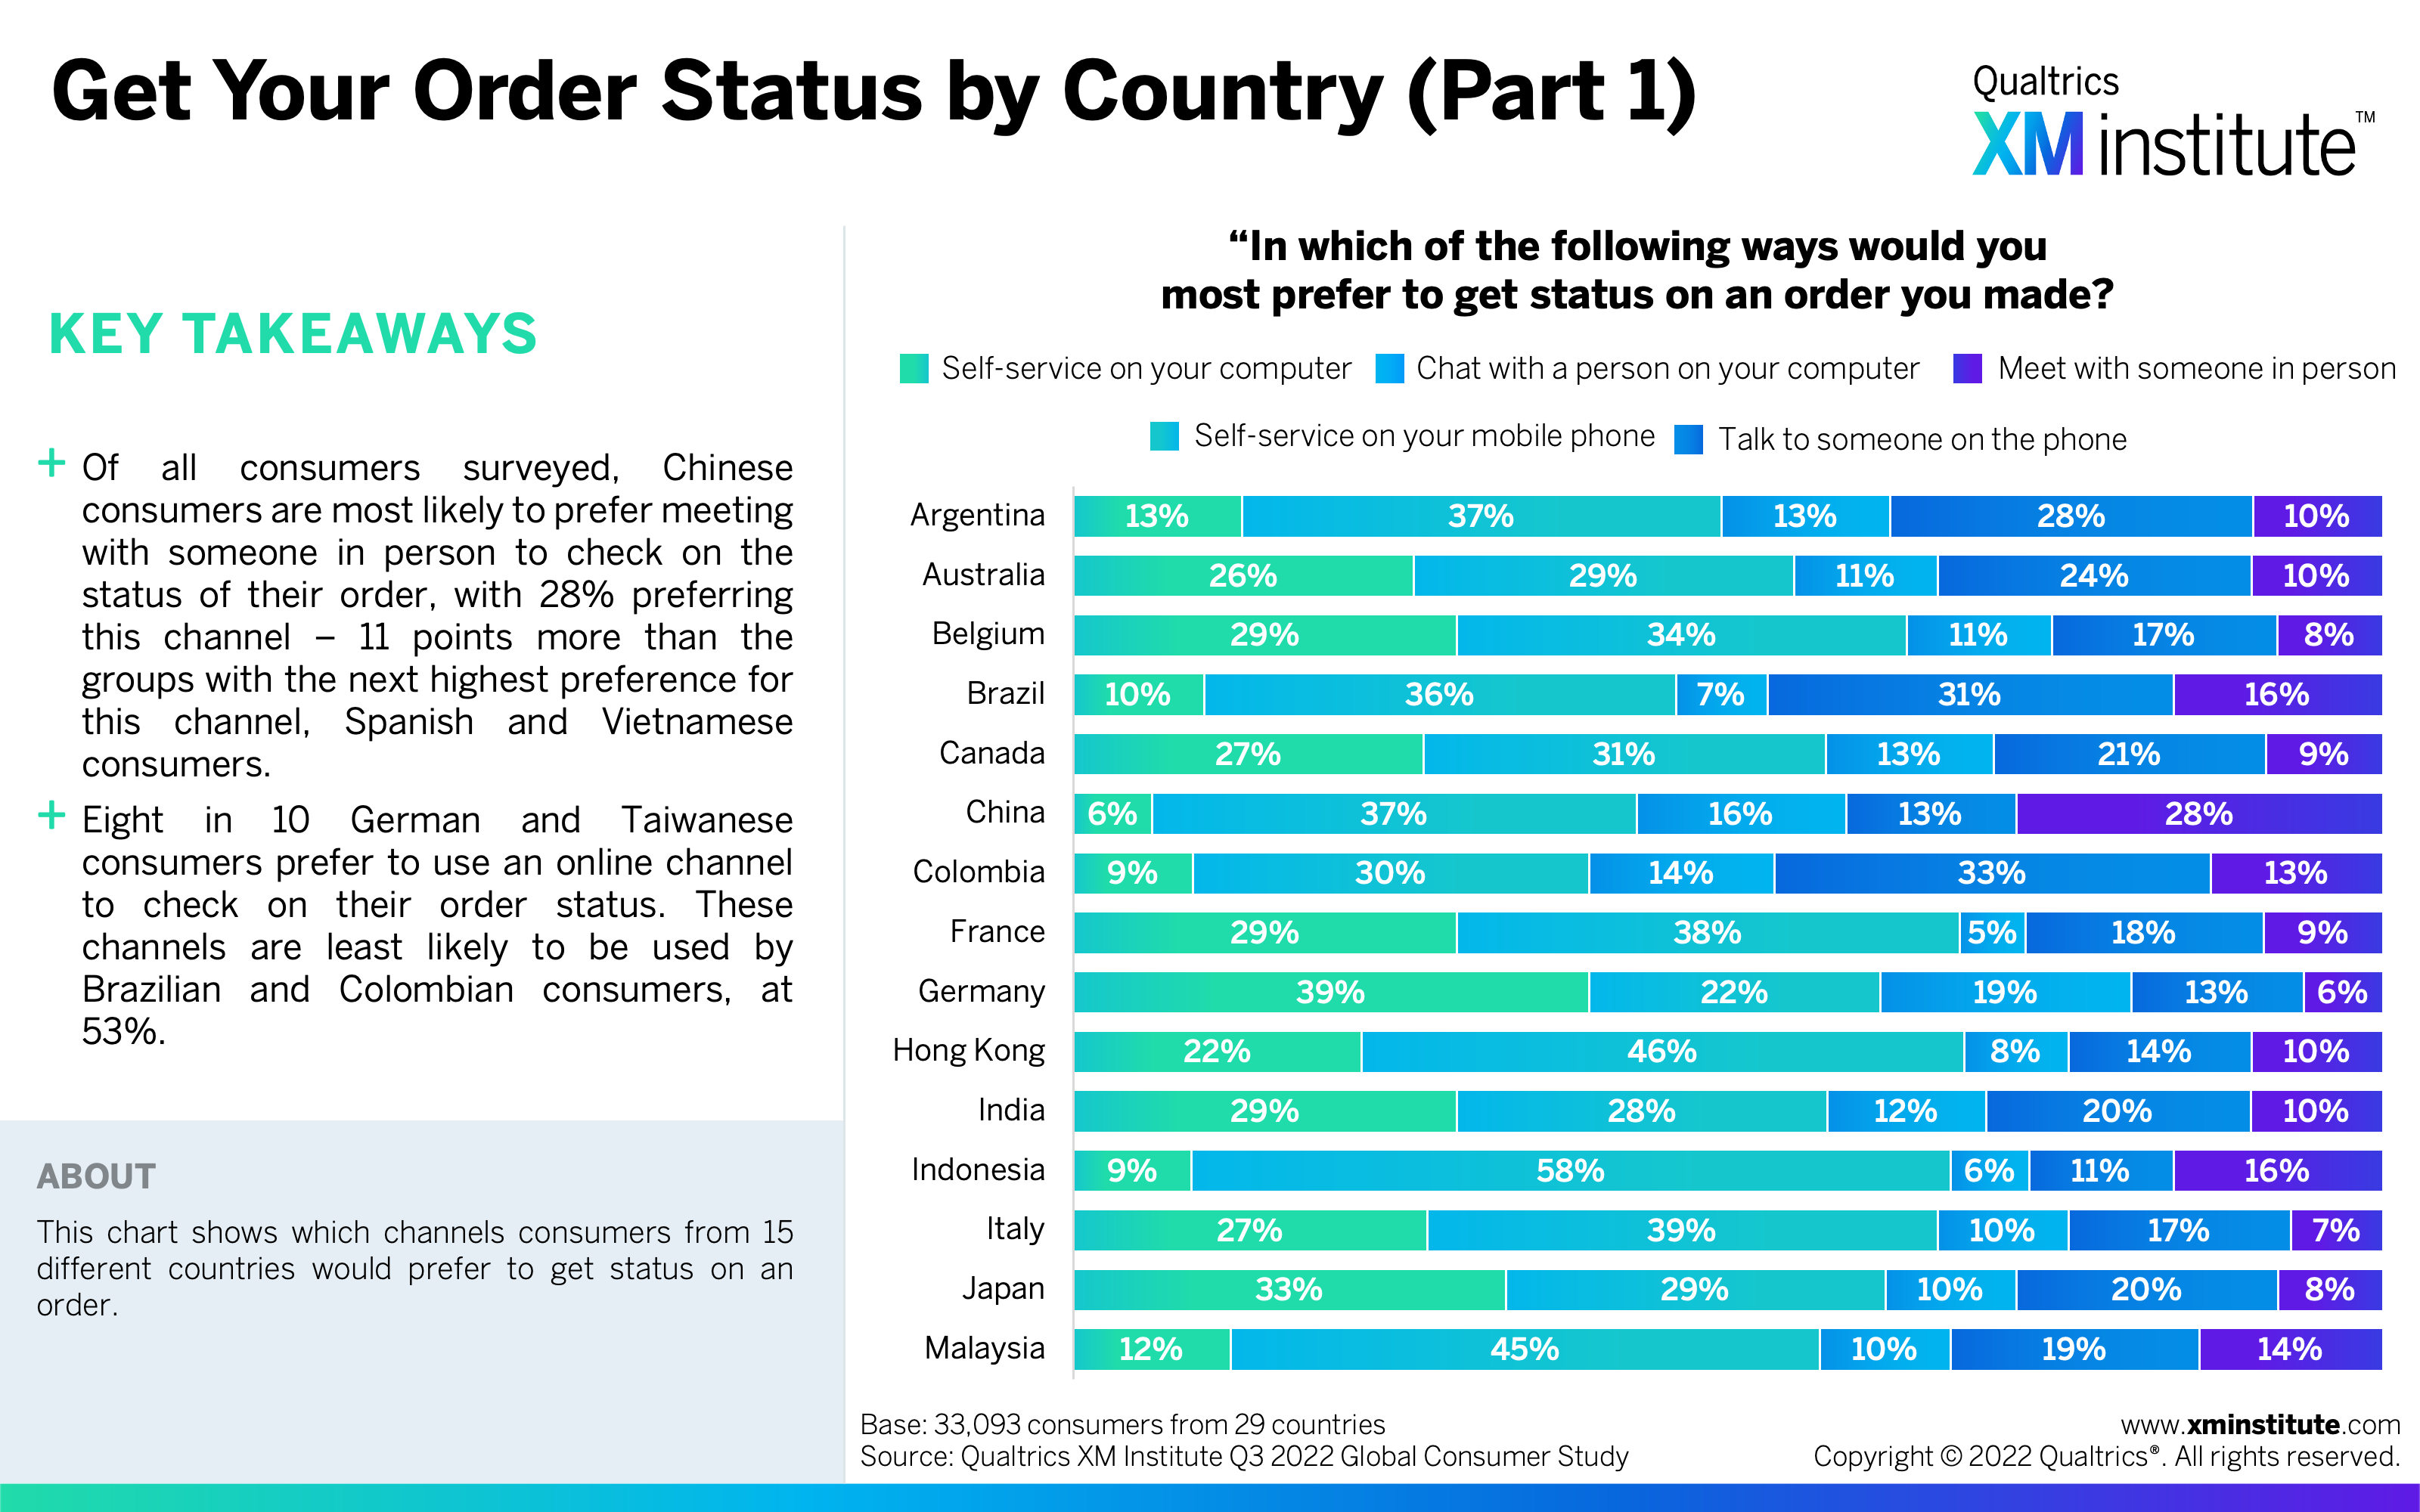
- Average across Interactions by Country (Part 1) (see Figure 2)
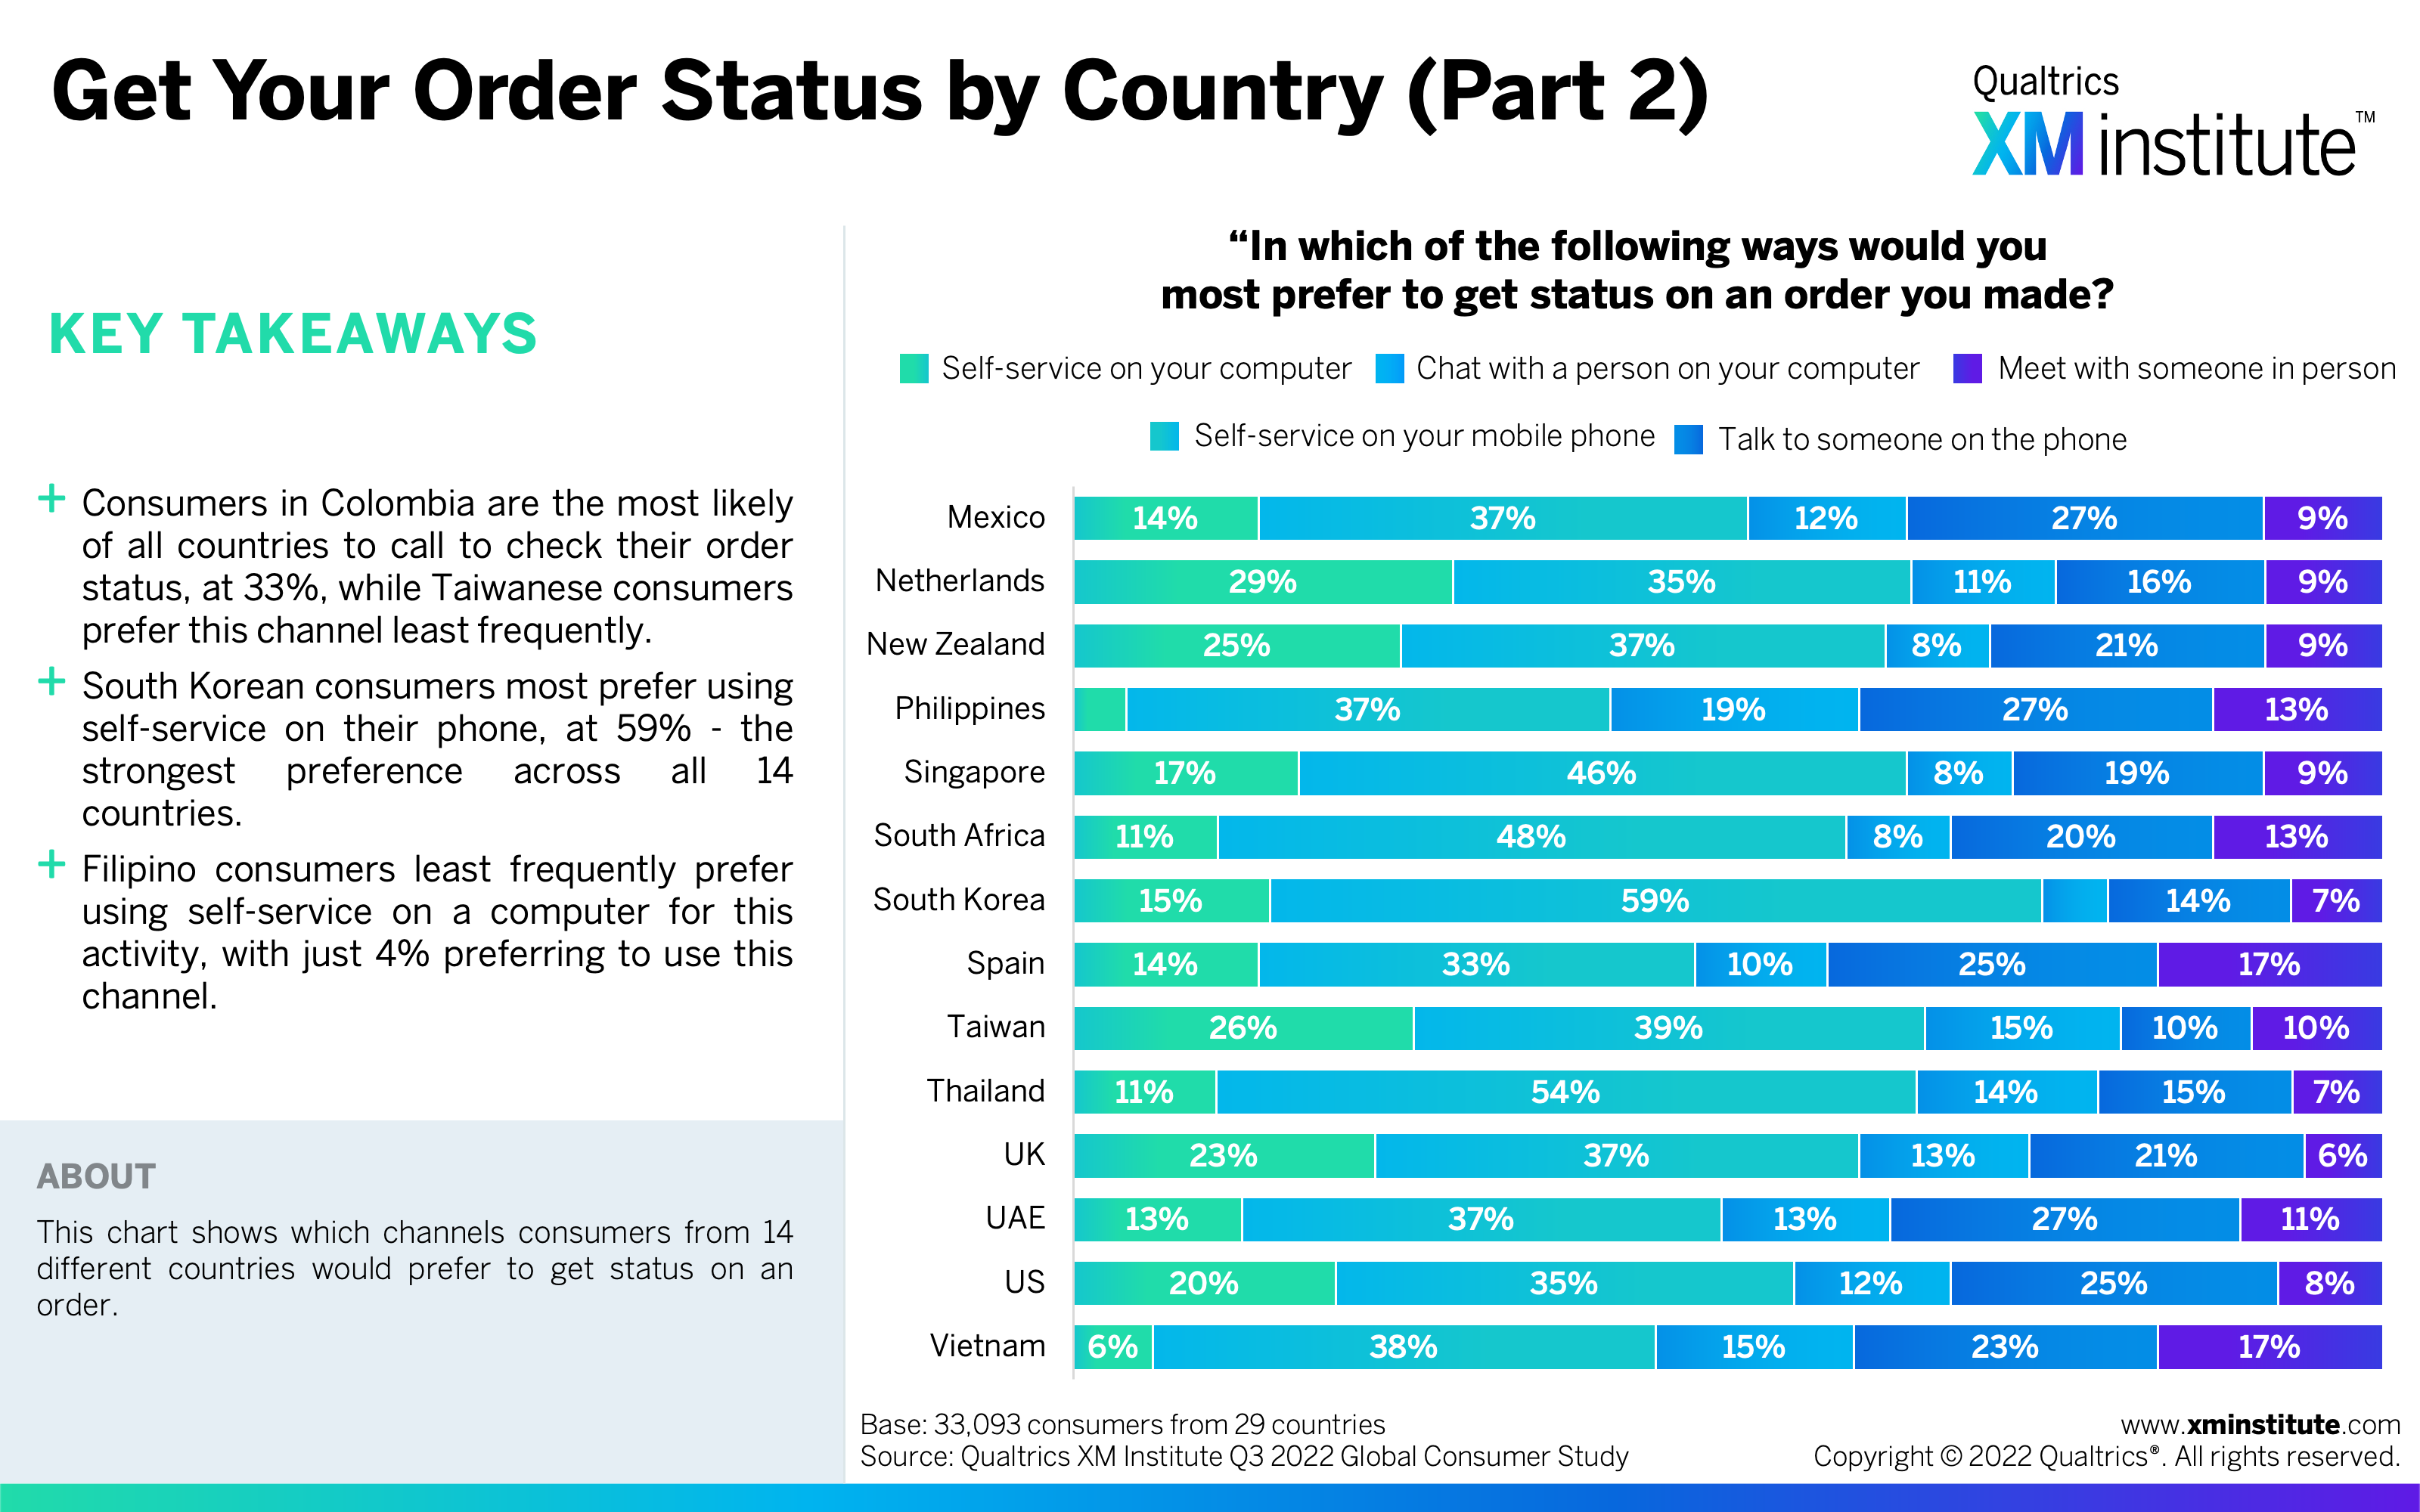
- Average across Interactions by Country (Part 2) (see Figure 3)
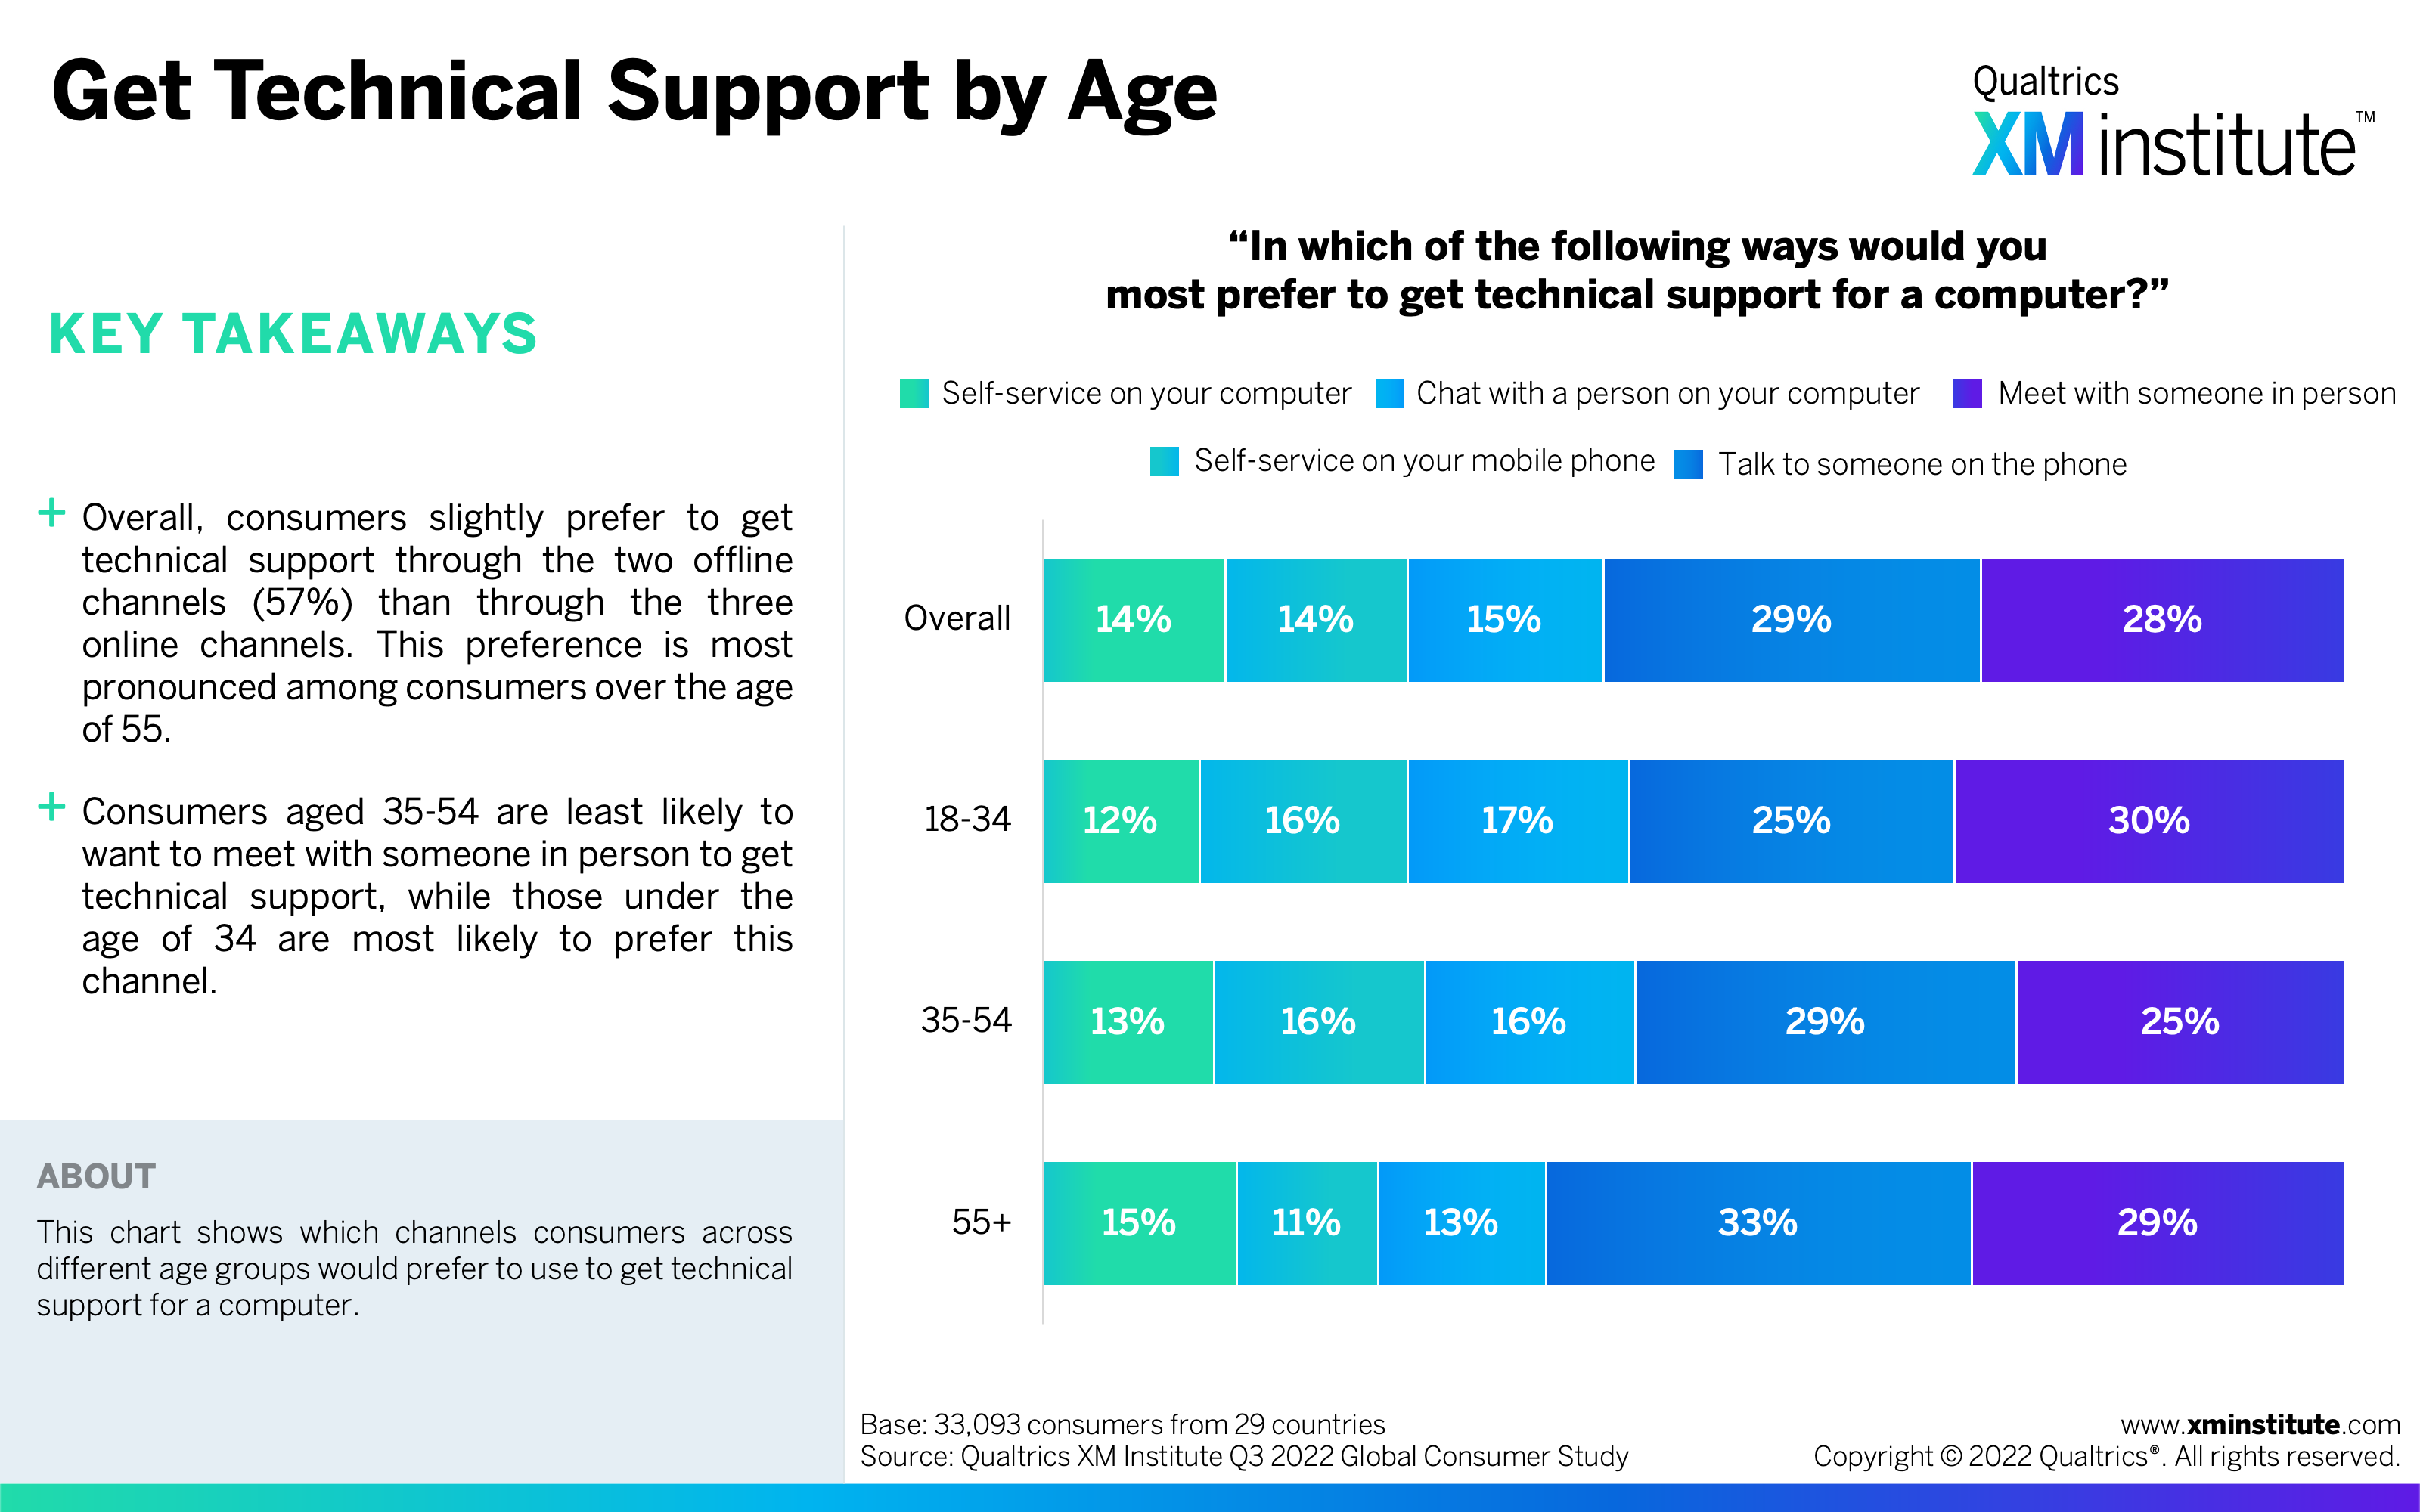
- Get Technical Support by Age (see Figure 4)
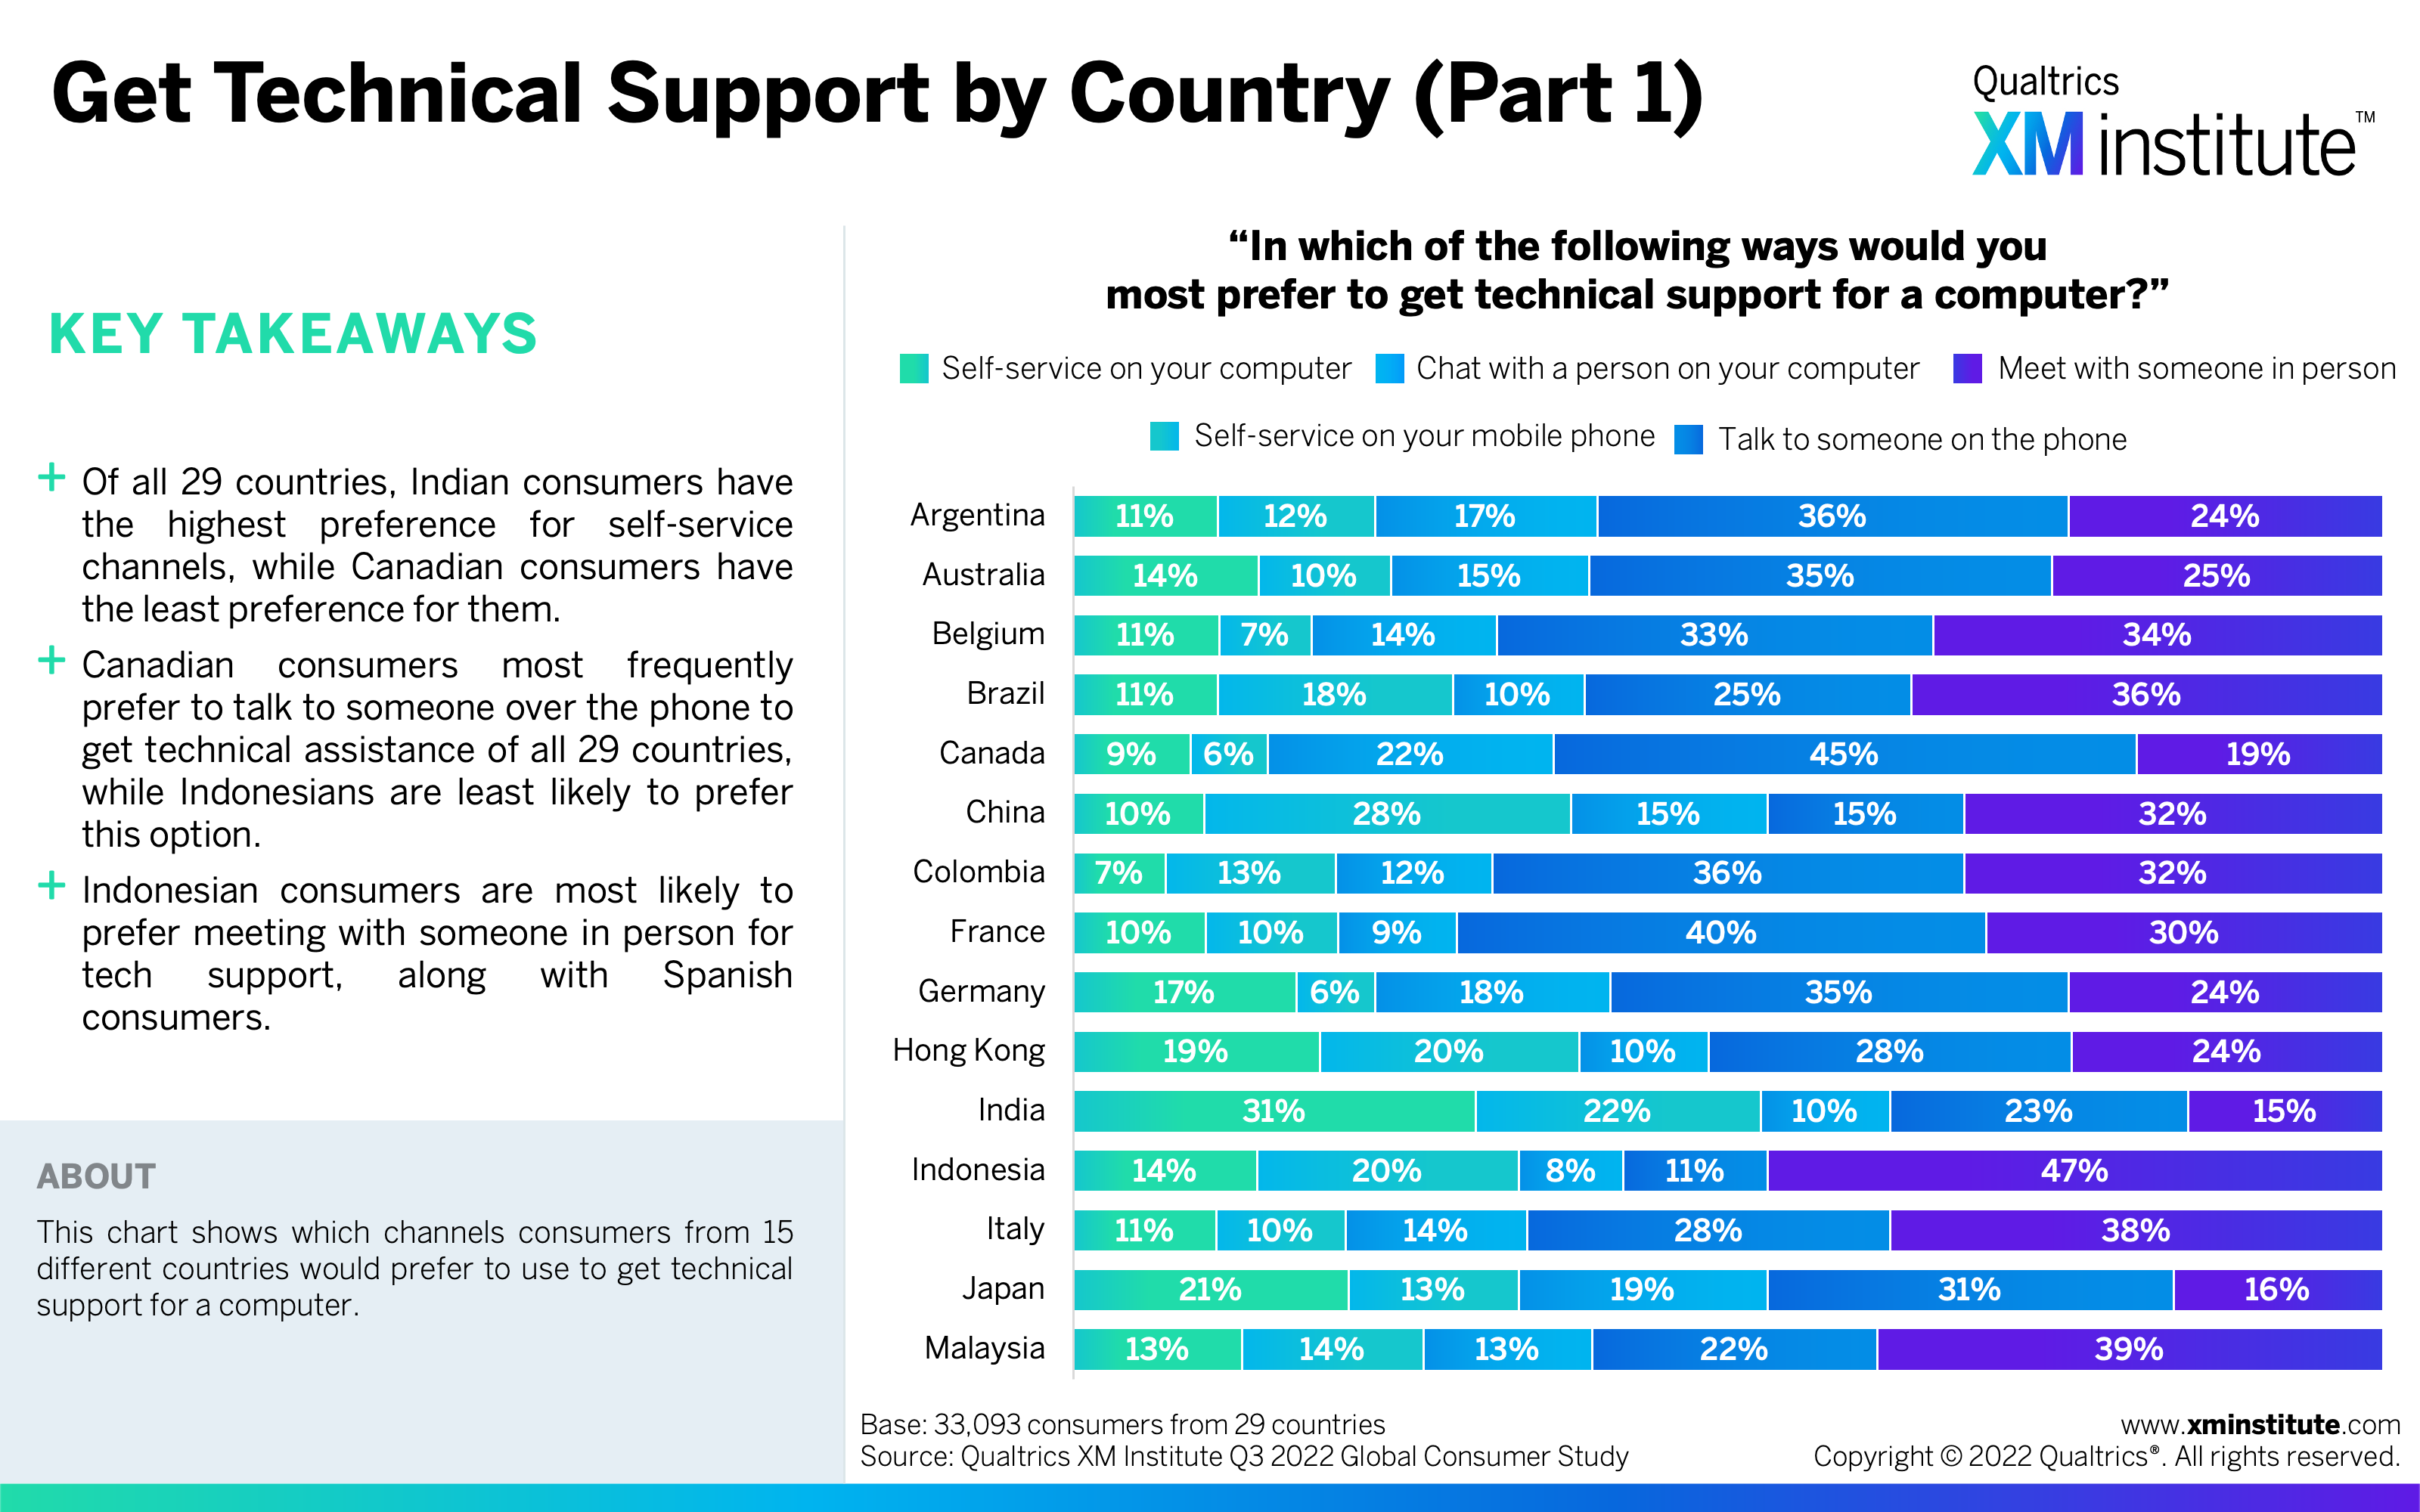
- Get Technical Support by Country (Part 1) (see Figure 5)
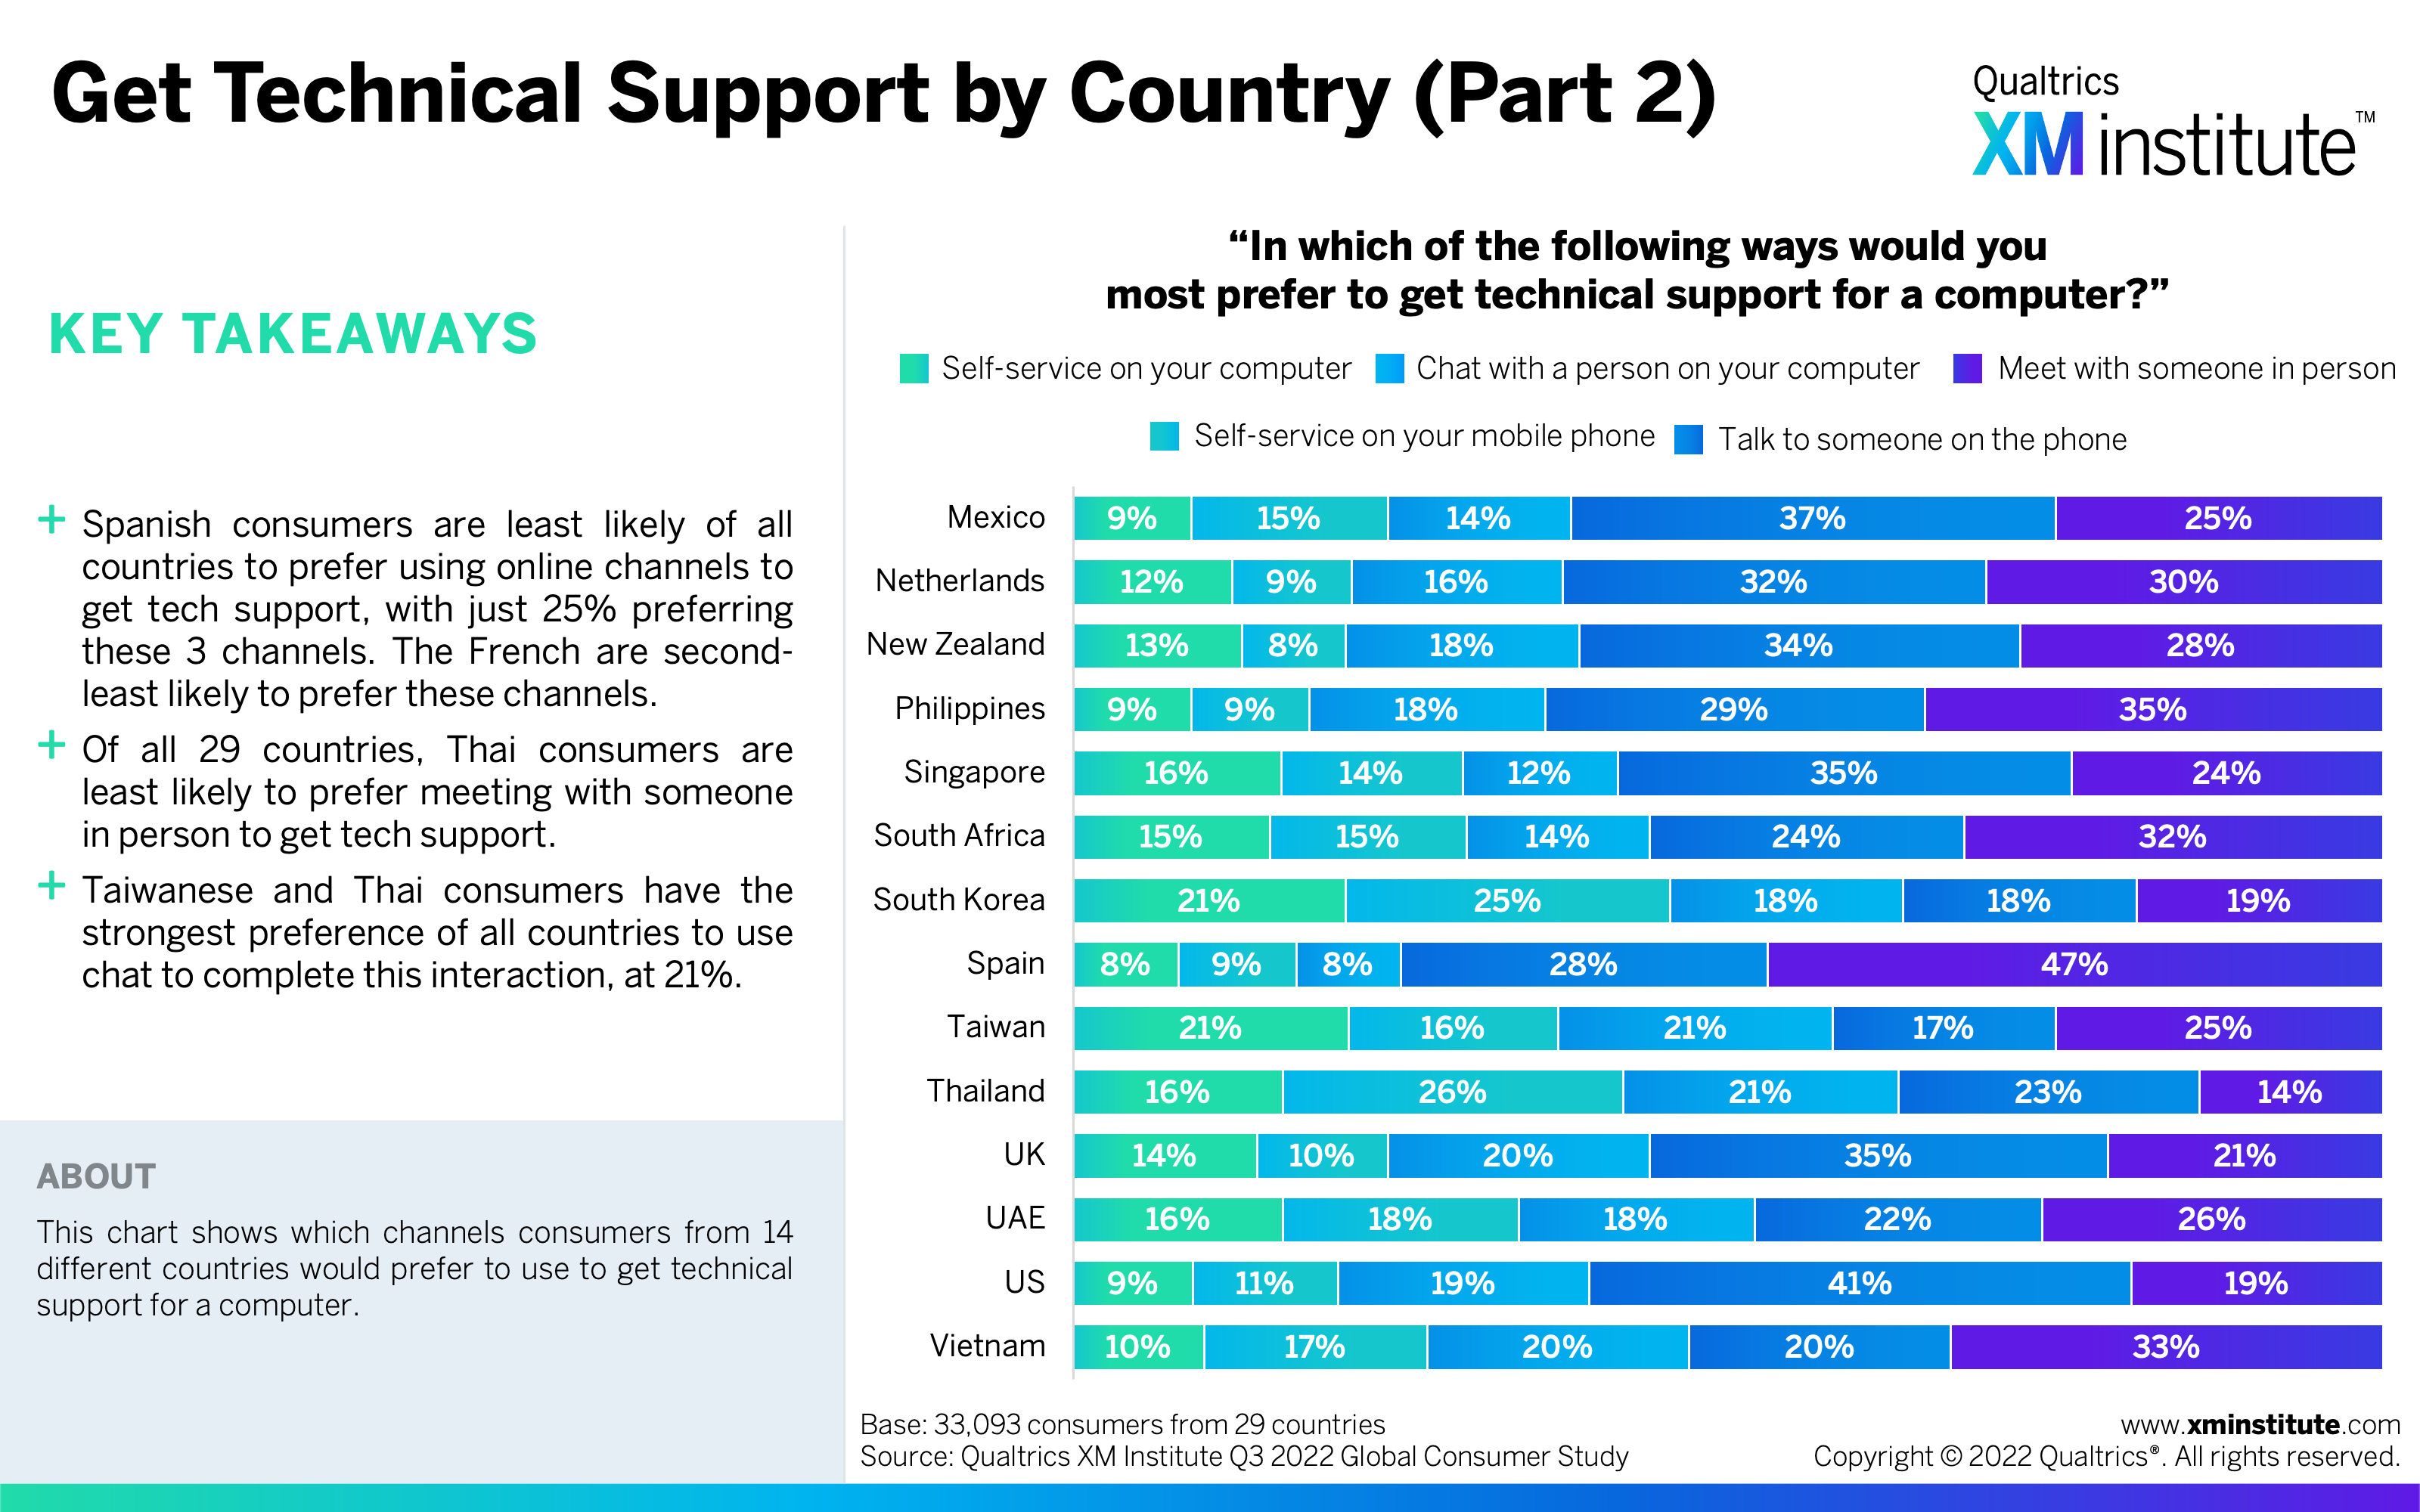
- Get Technical Support by Country (Part 2) (see Figure 6)
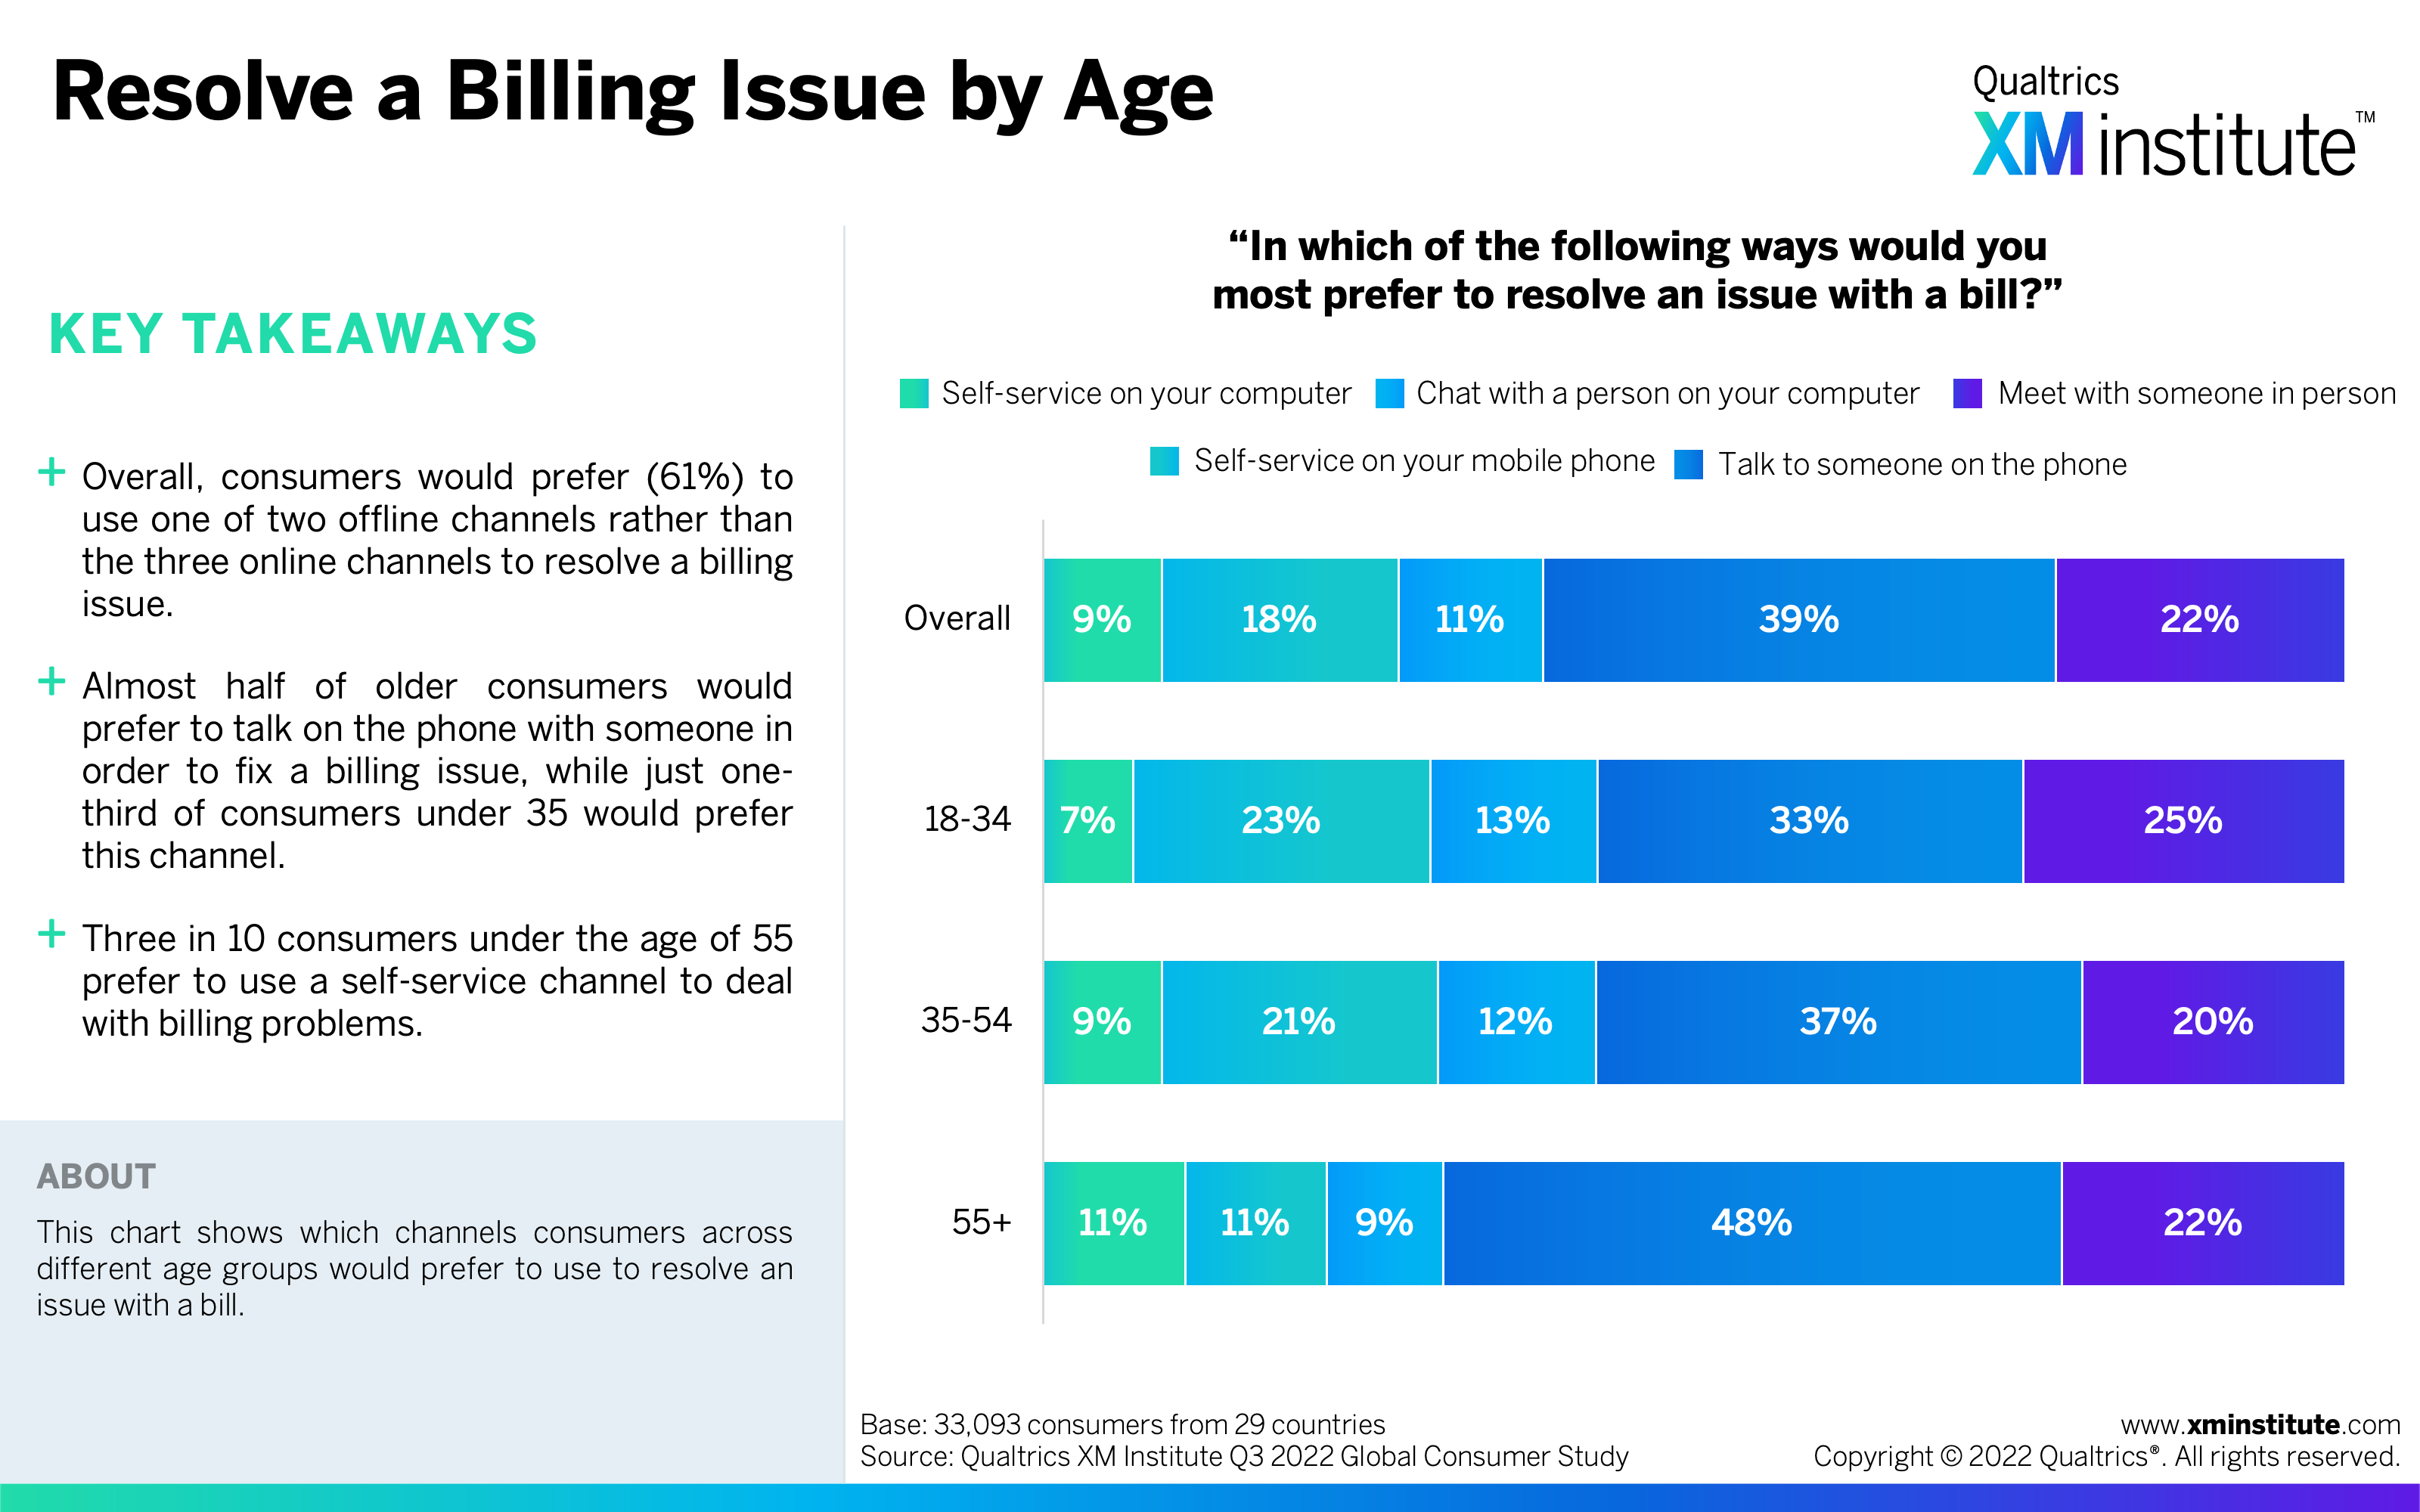
- Resolve a Billing Issue by Age (see Figure 7)
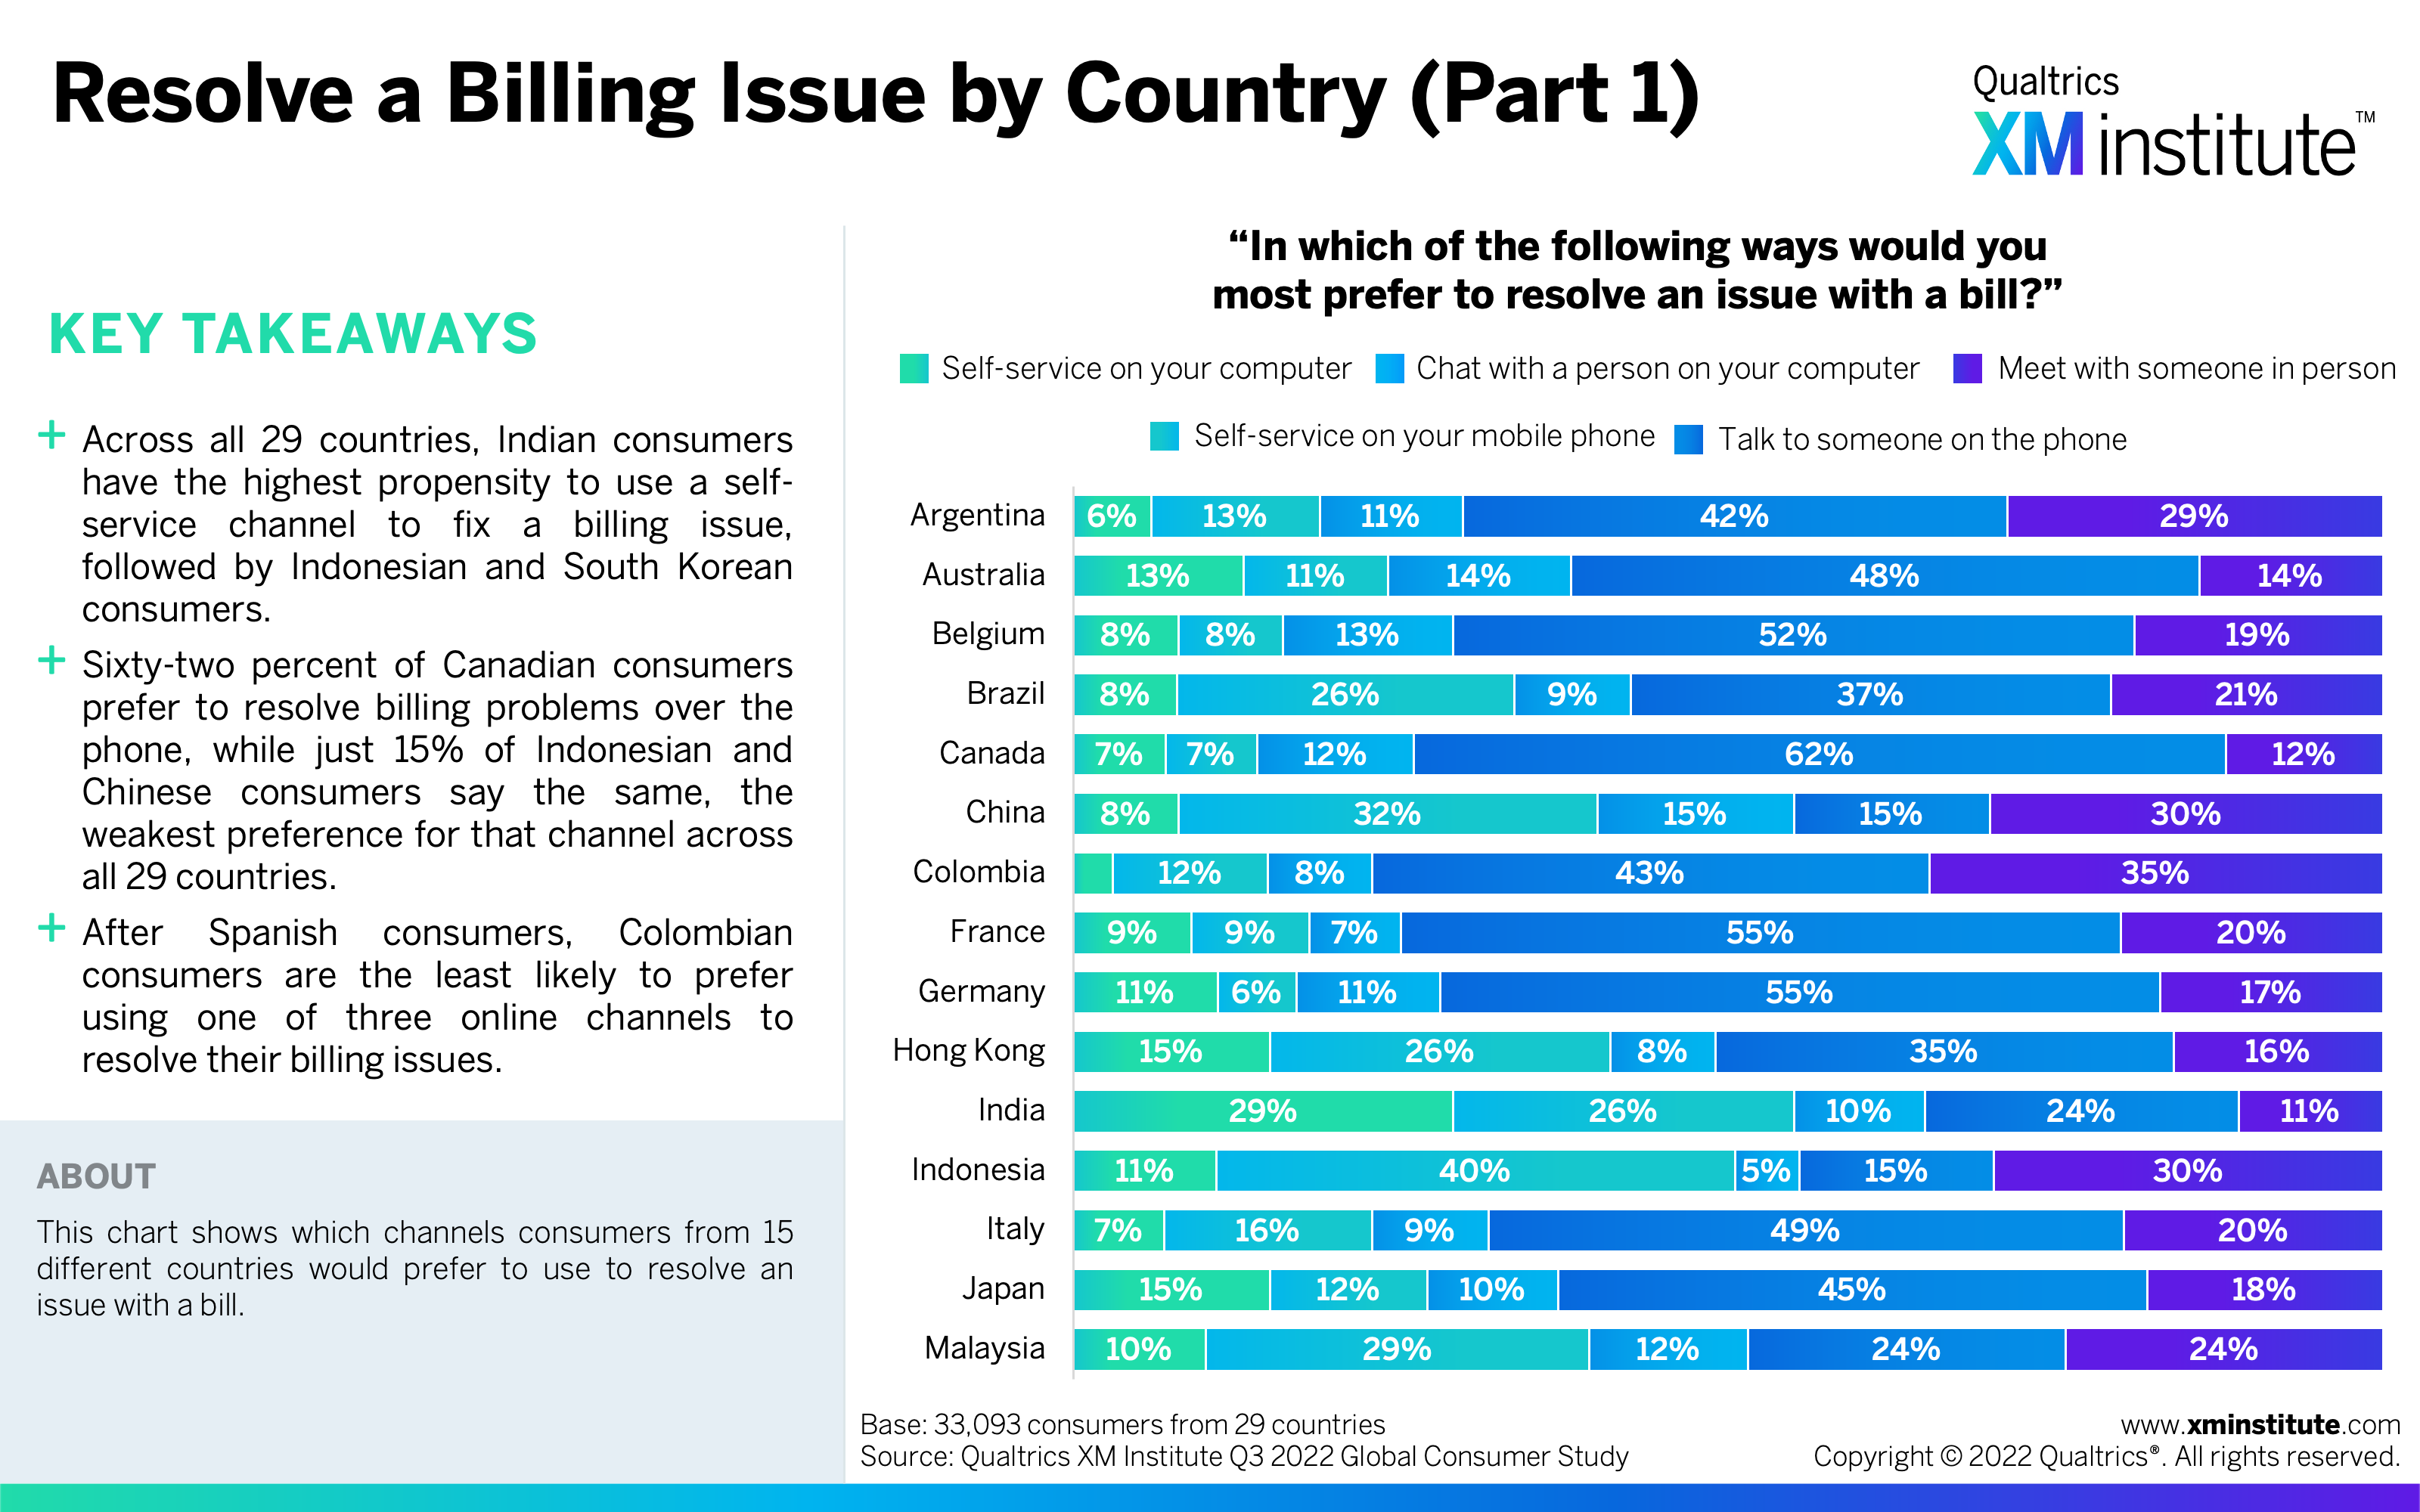
- Resolve a Billing Issue by Country (Part 1) (see Figure 8)
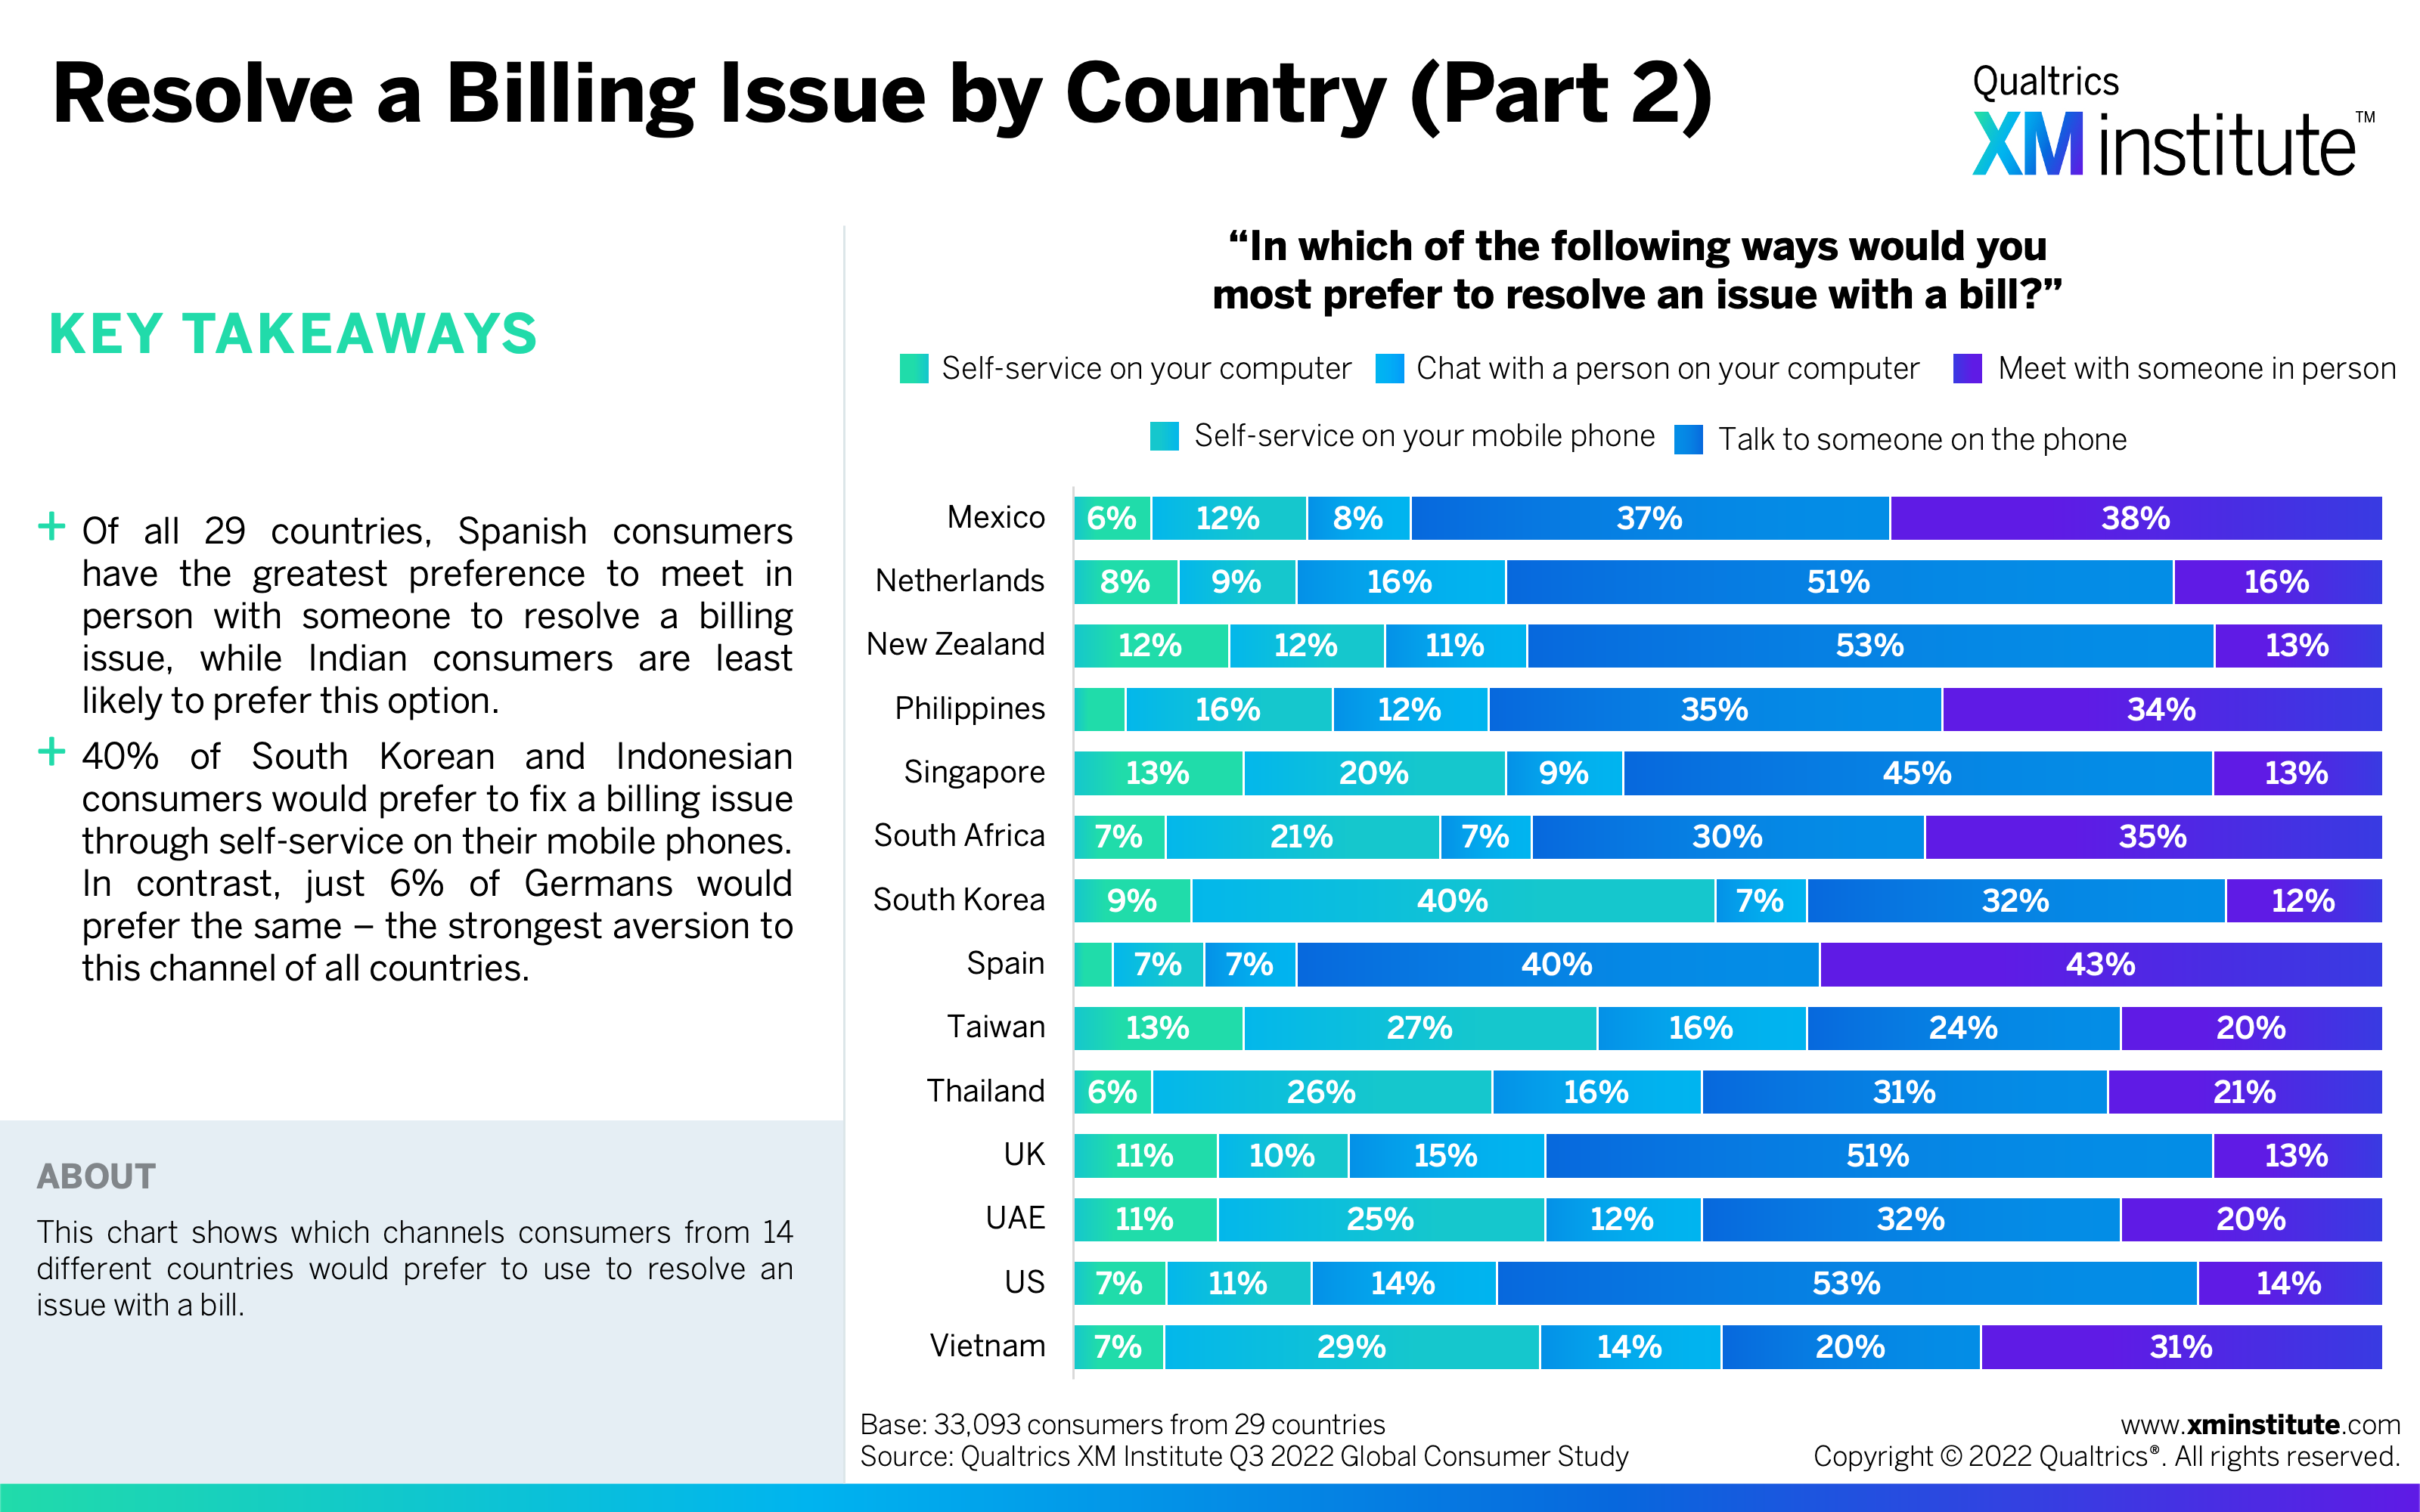
- Resolve a Billing Issue by Country (Part 2) (see Figure 9)
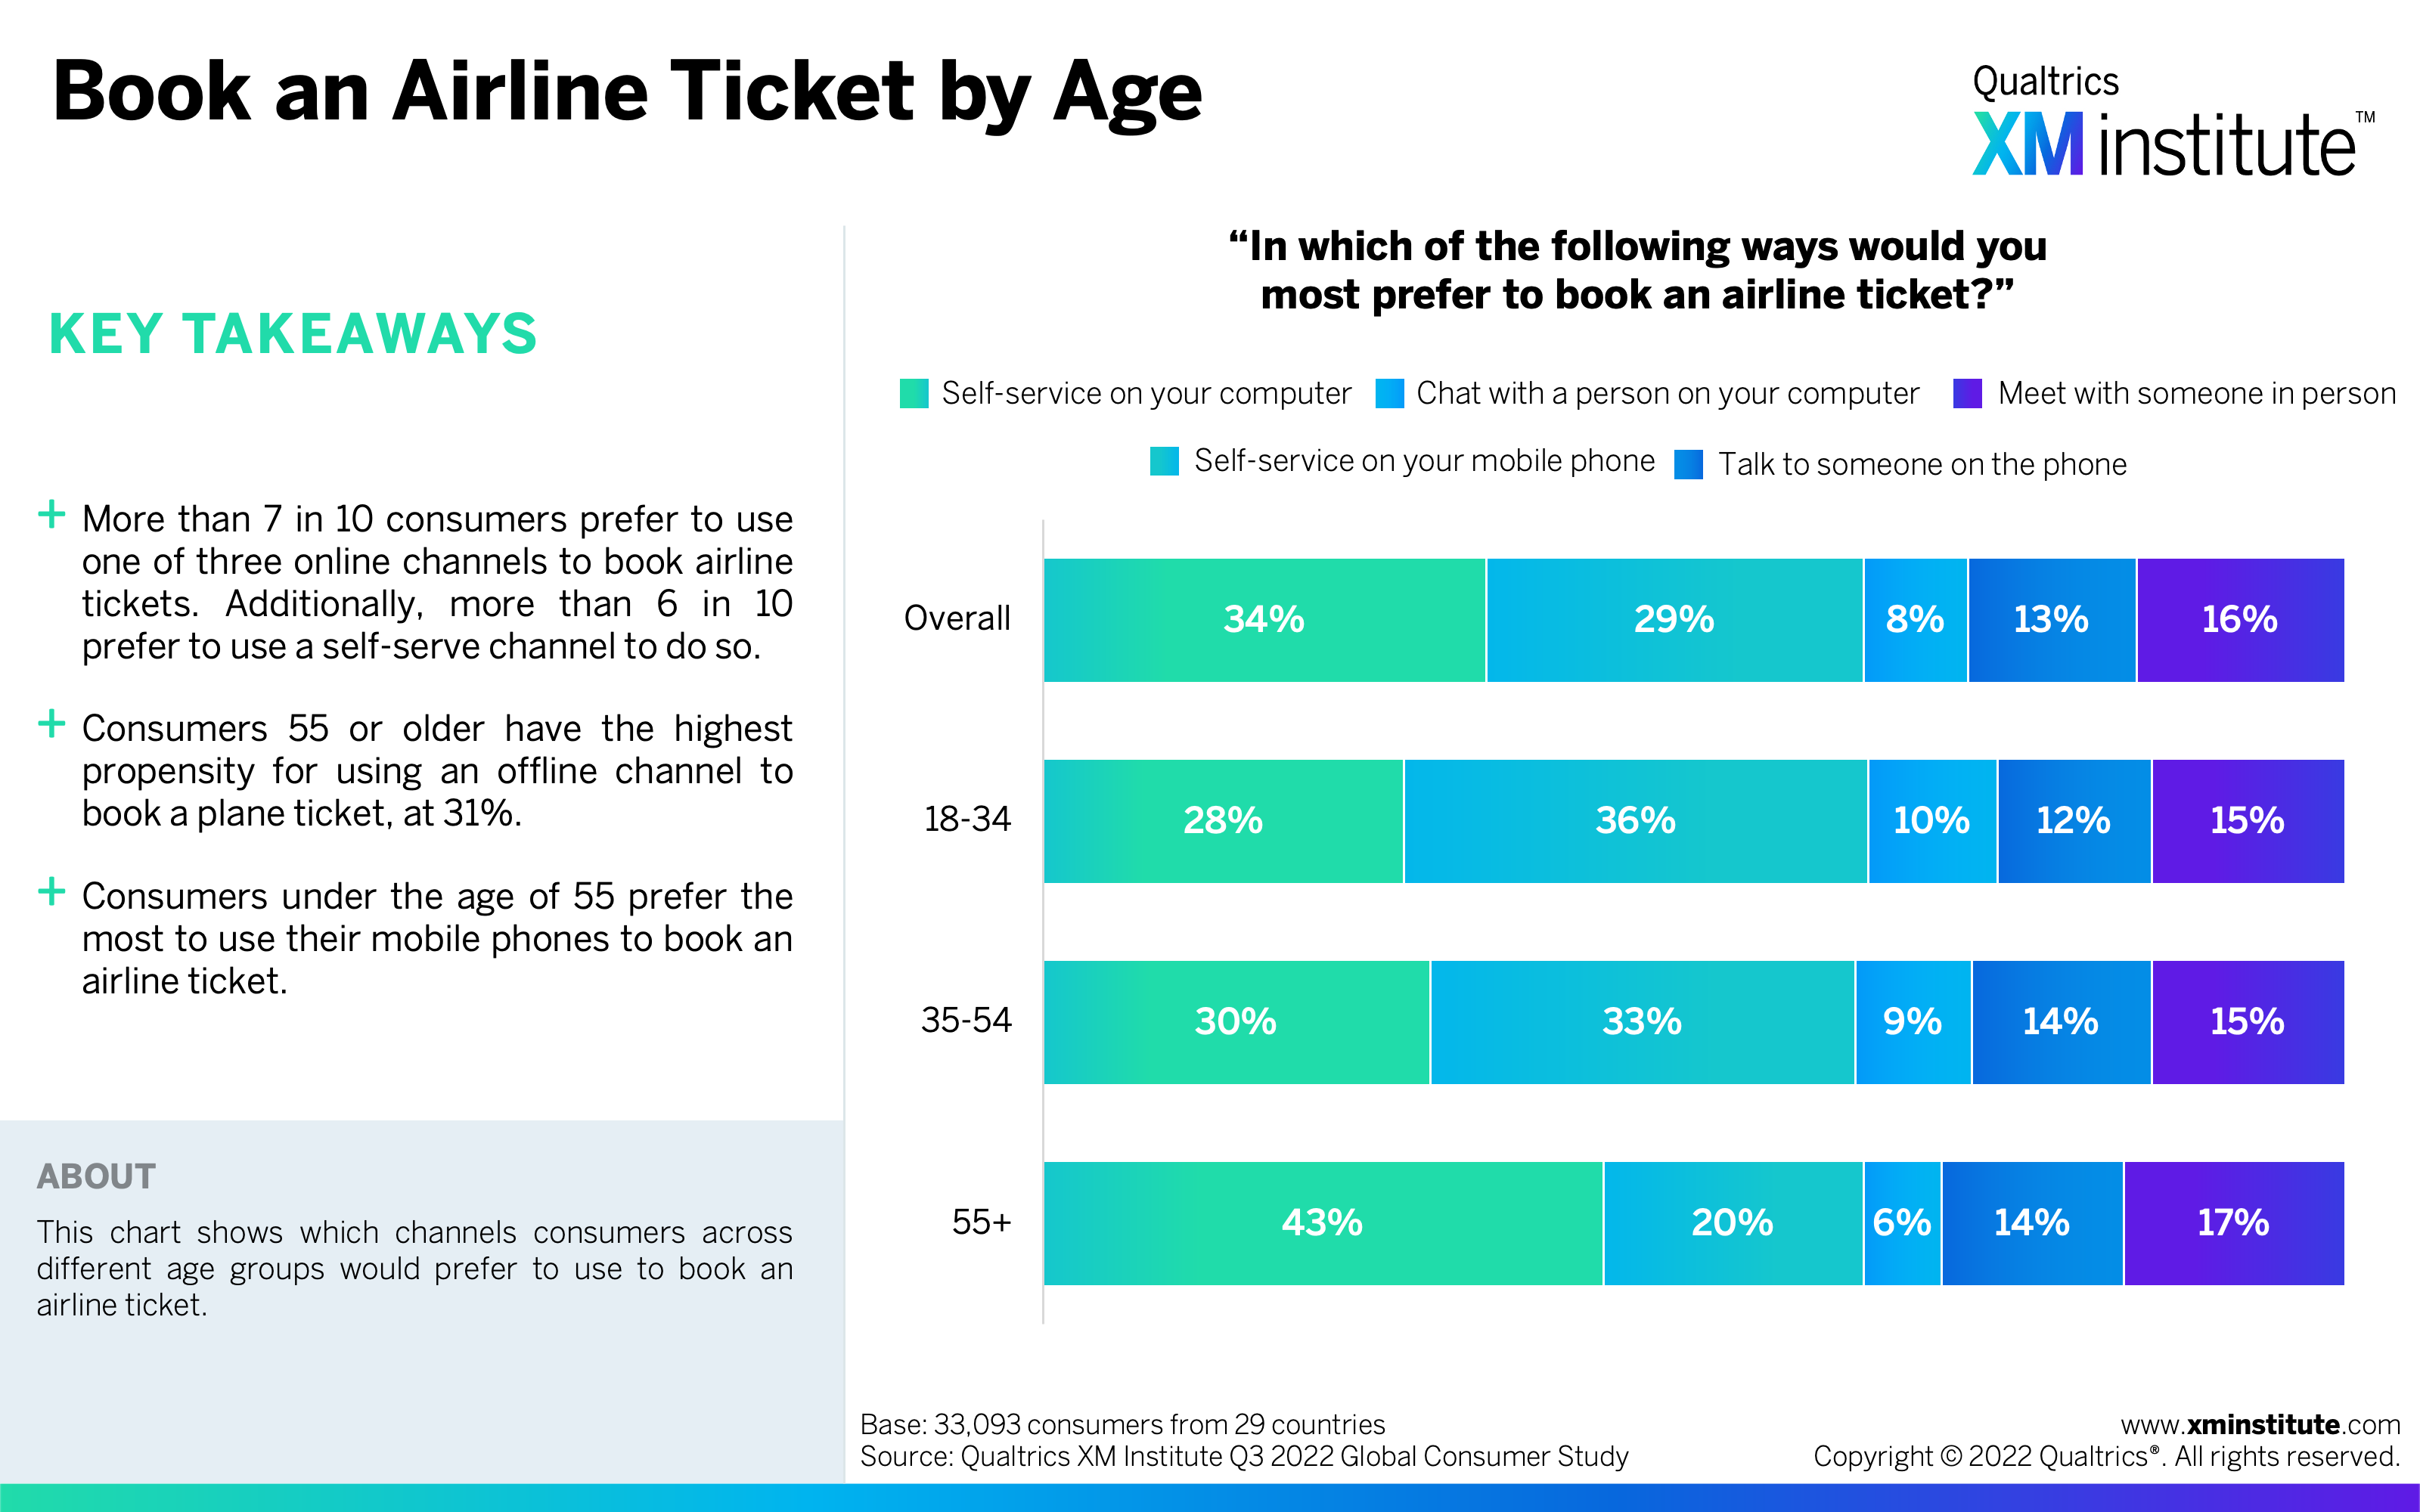
- Book an Airline Ticket by Age (see Figure 10)
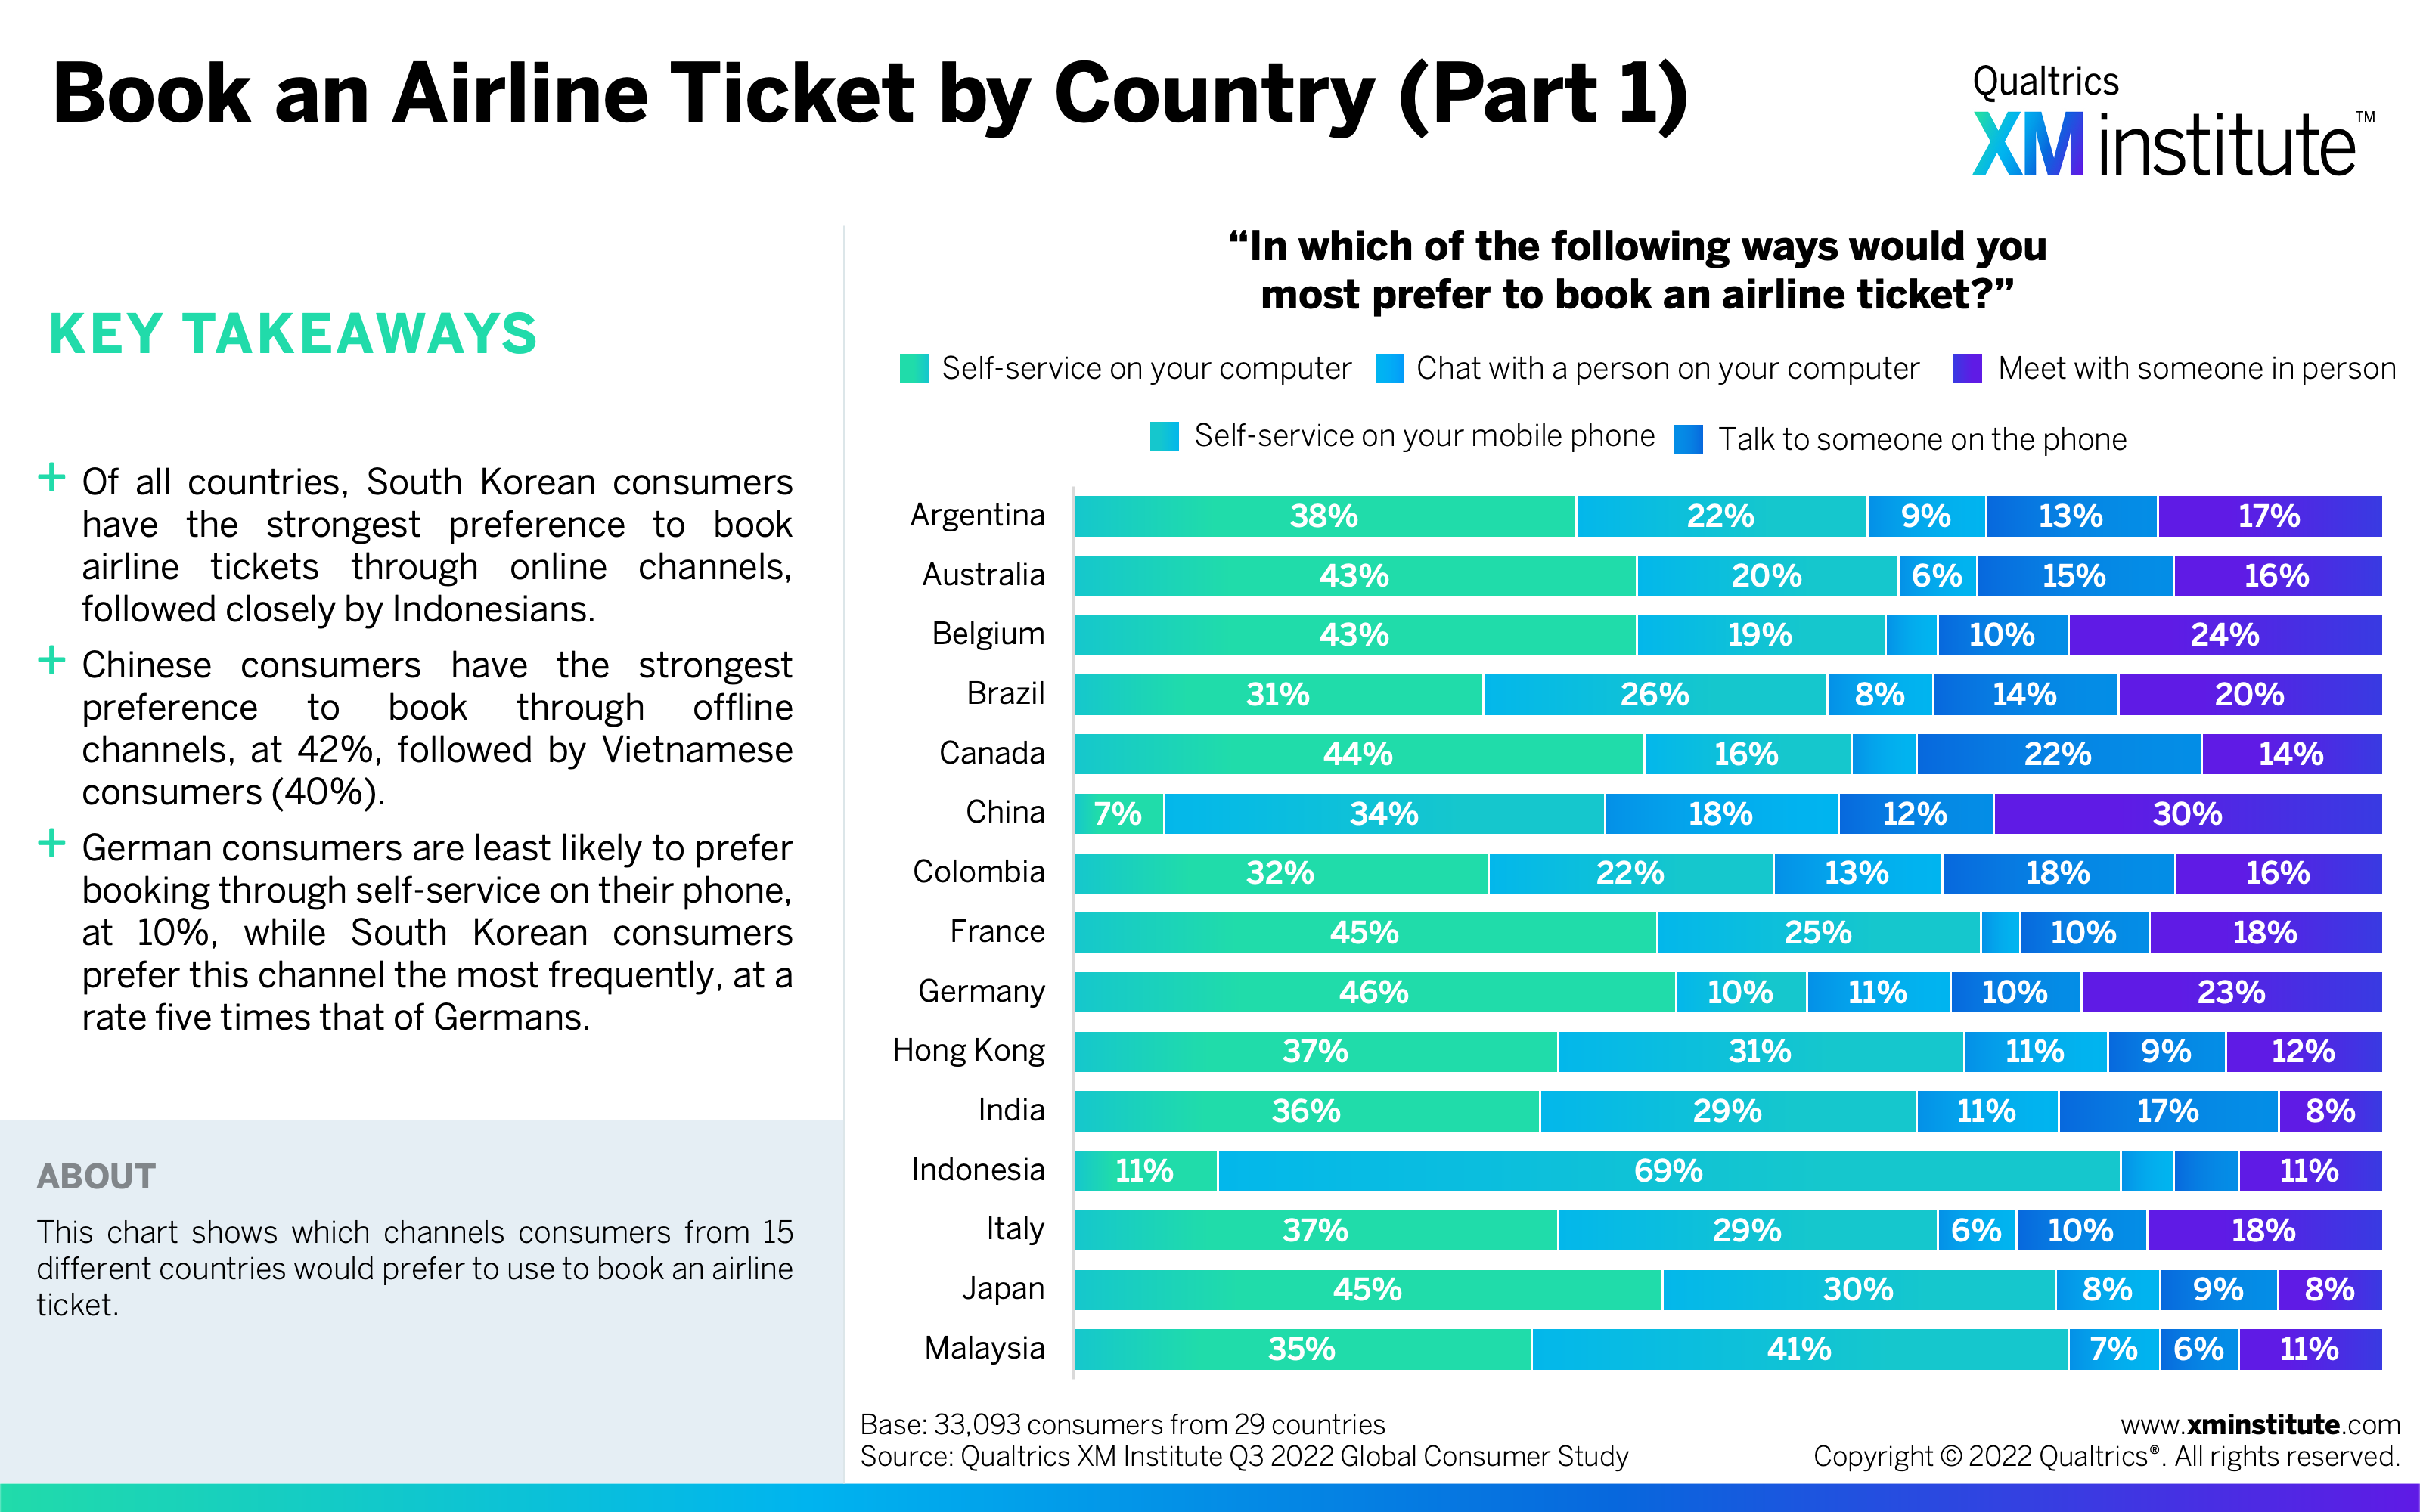
- Book an Airline Ticket by Country (Part 1) (see Figure 11)
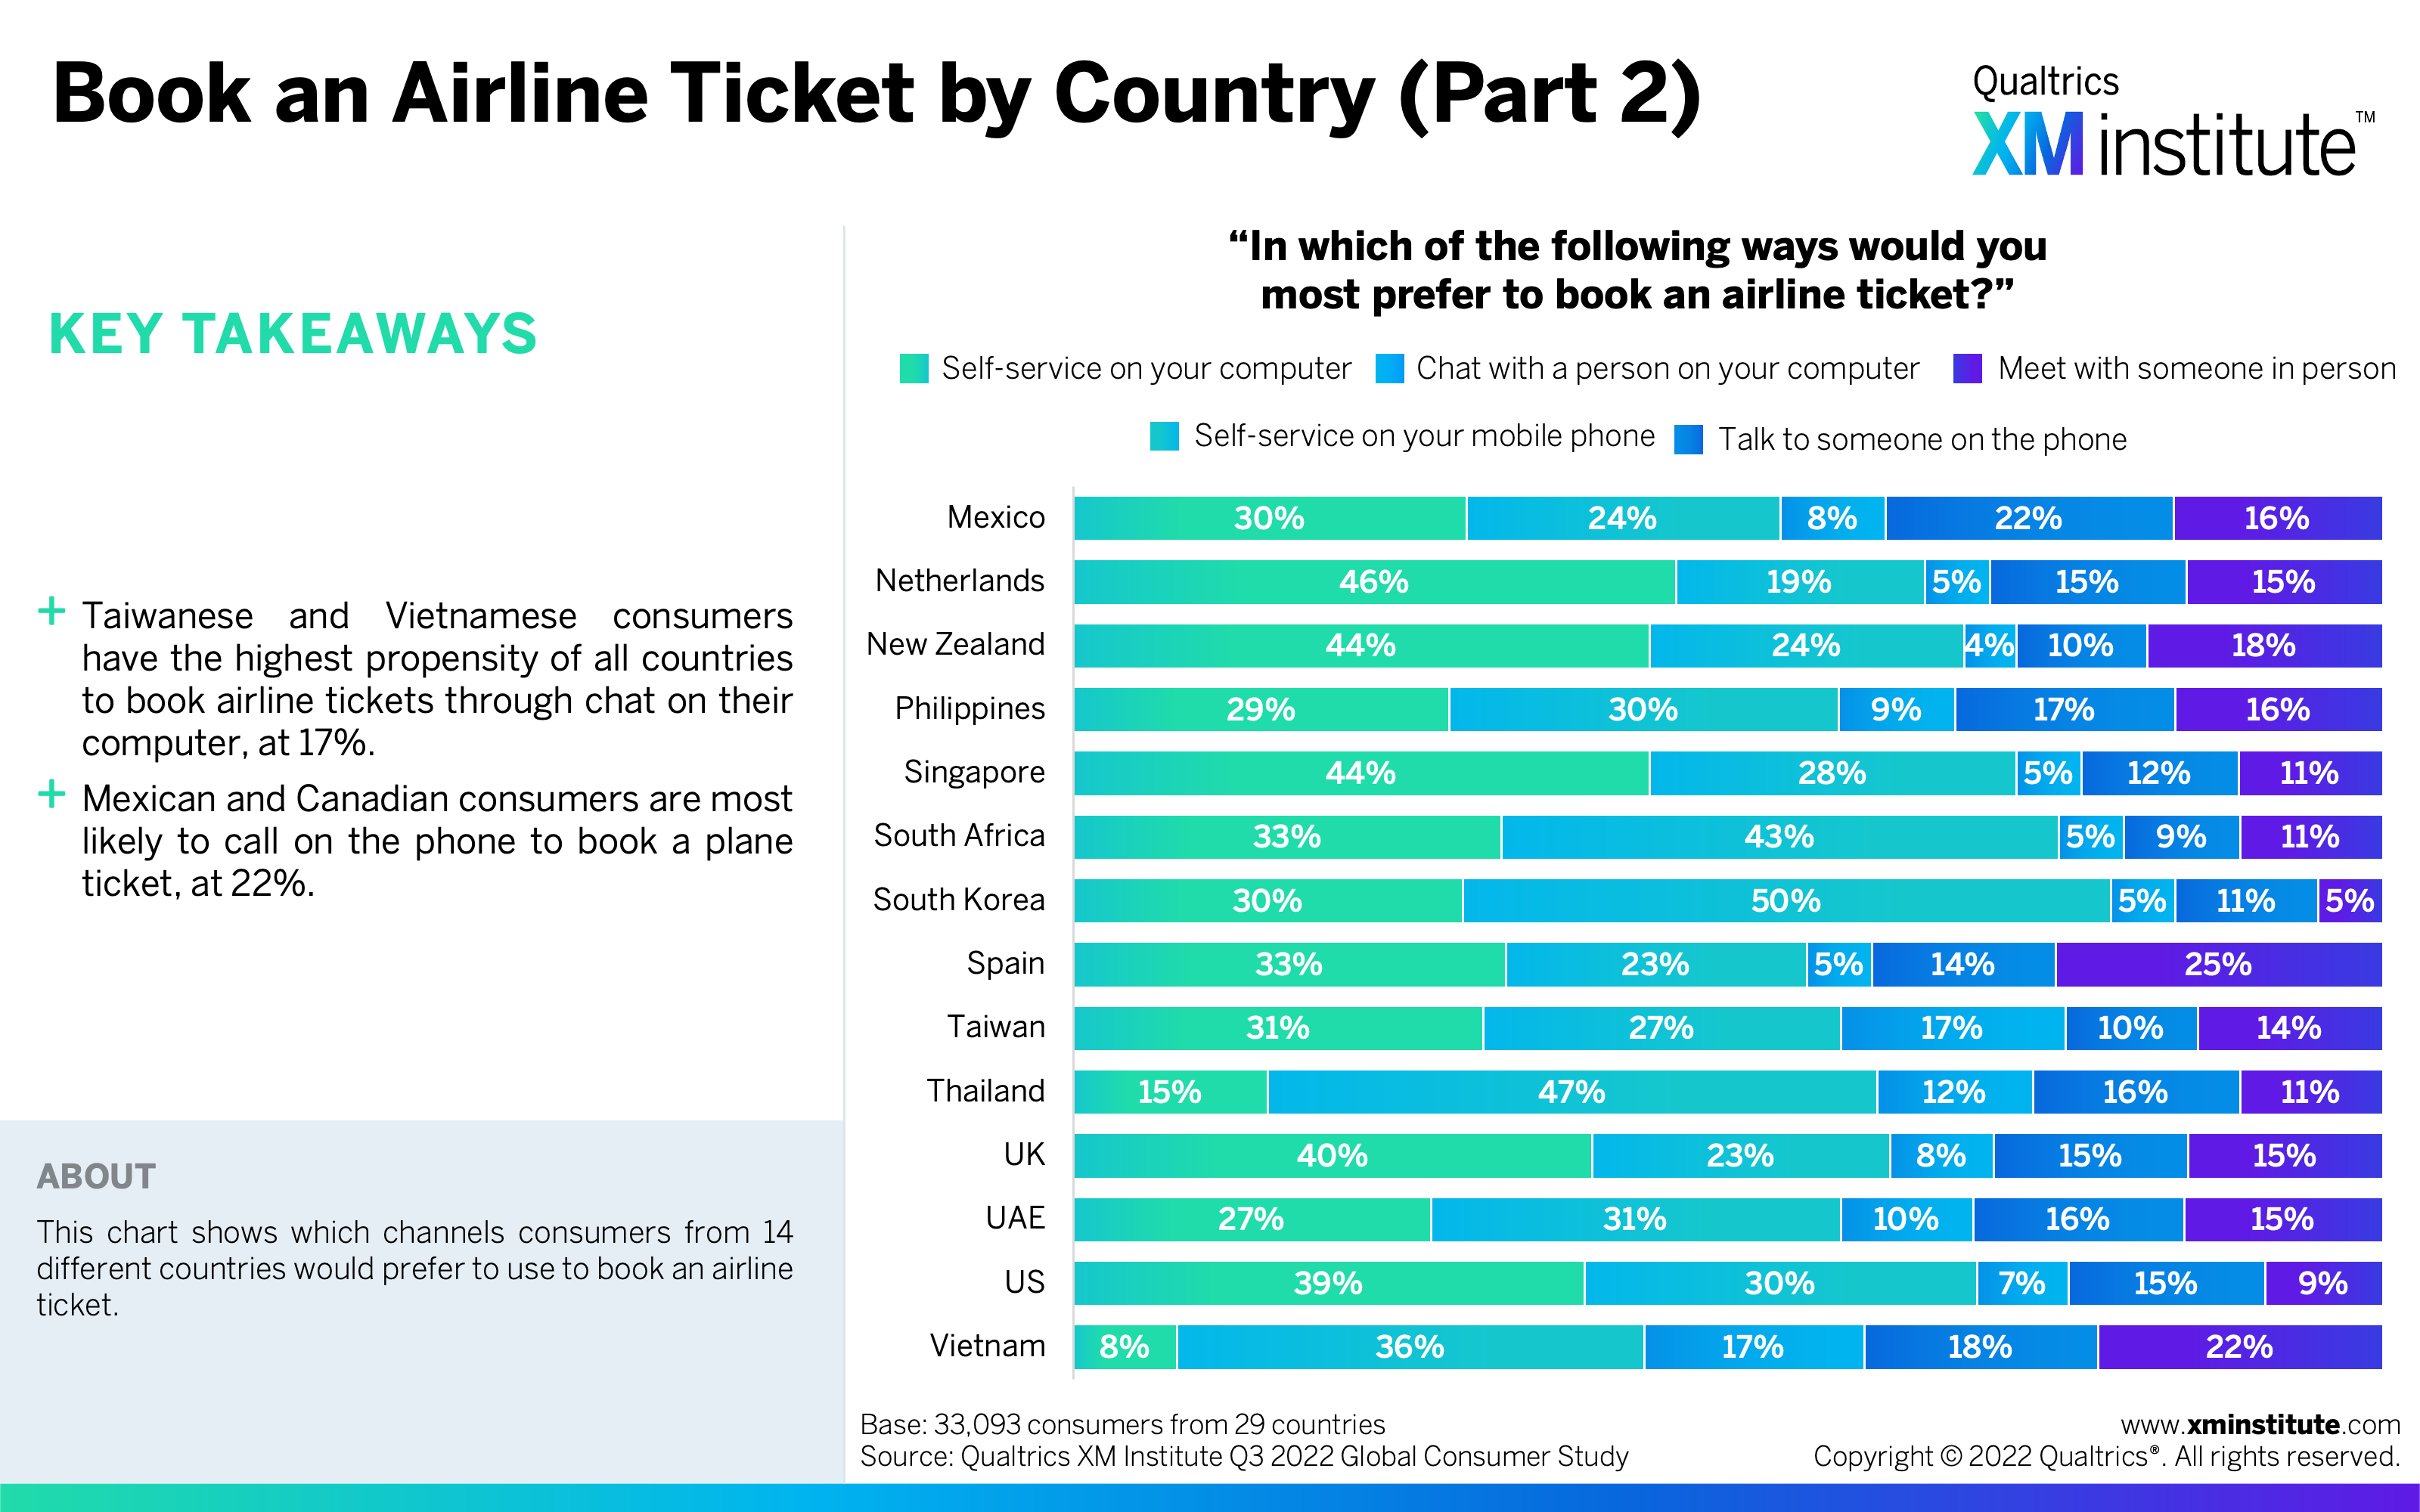
- Book an Airline Ticket by Country (Part 2) (see Figure 12)
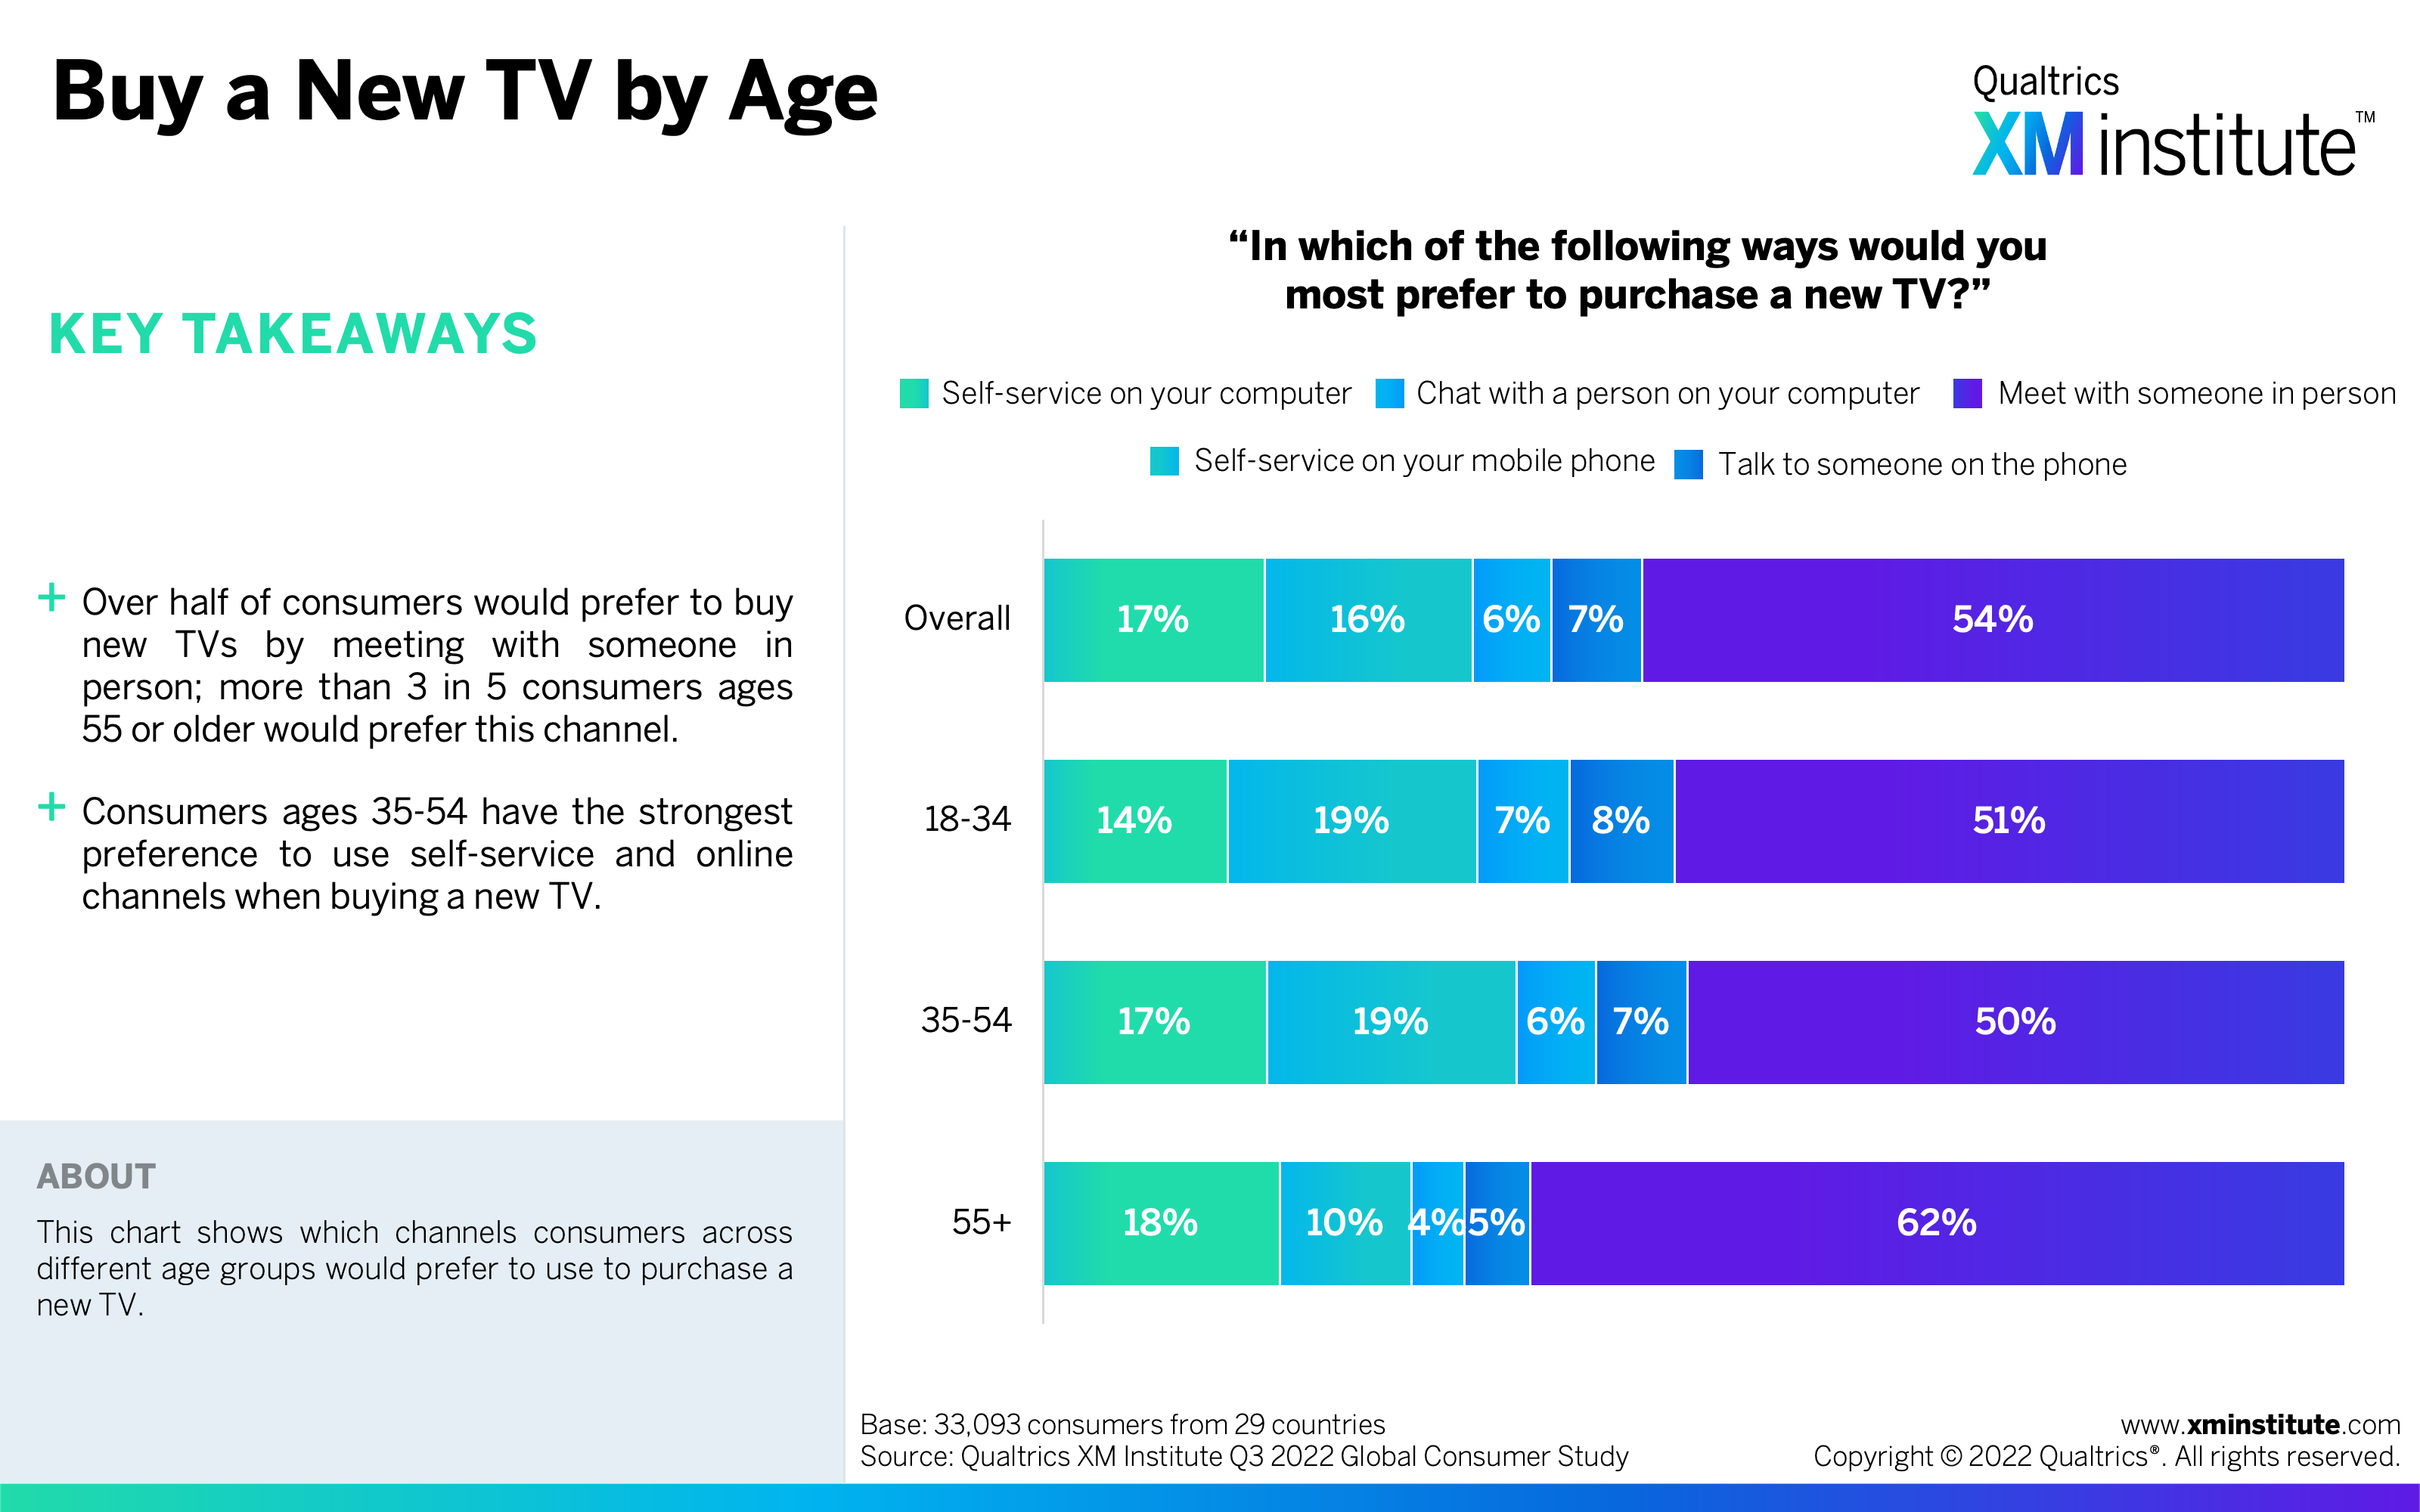
- Buy a New TV by Age (see Figure 13)
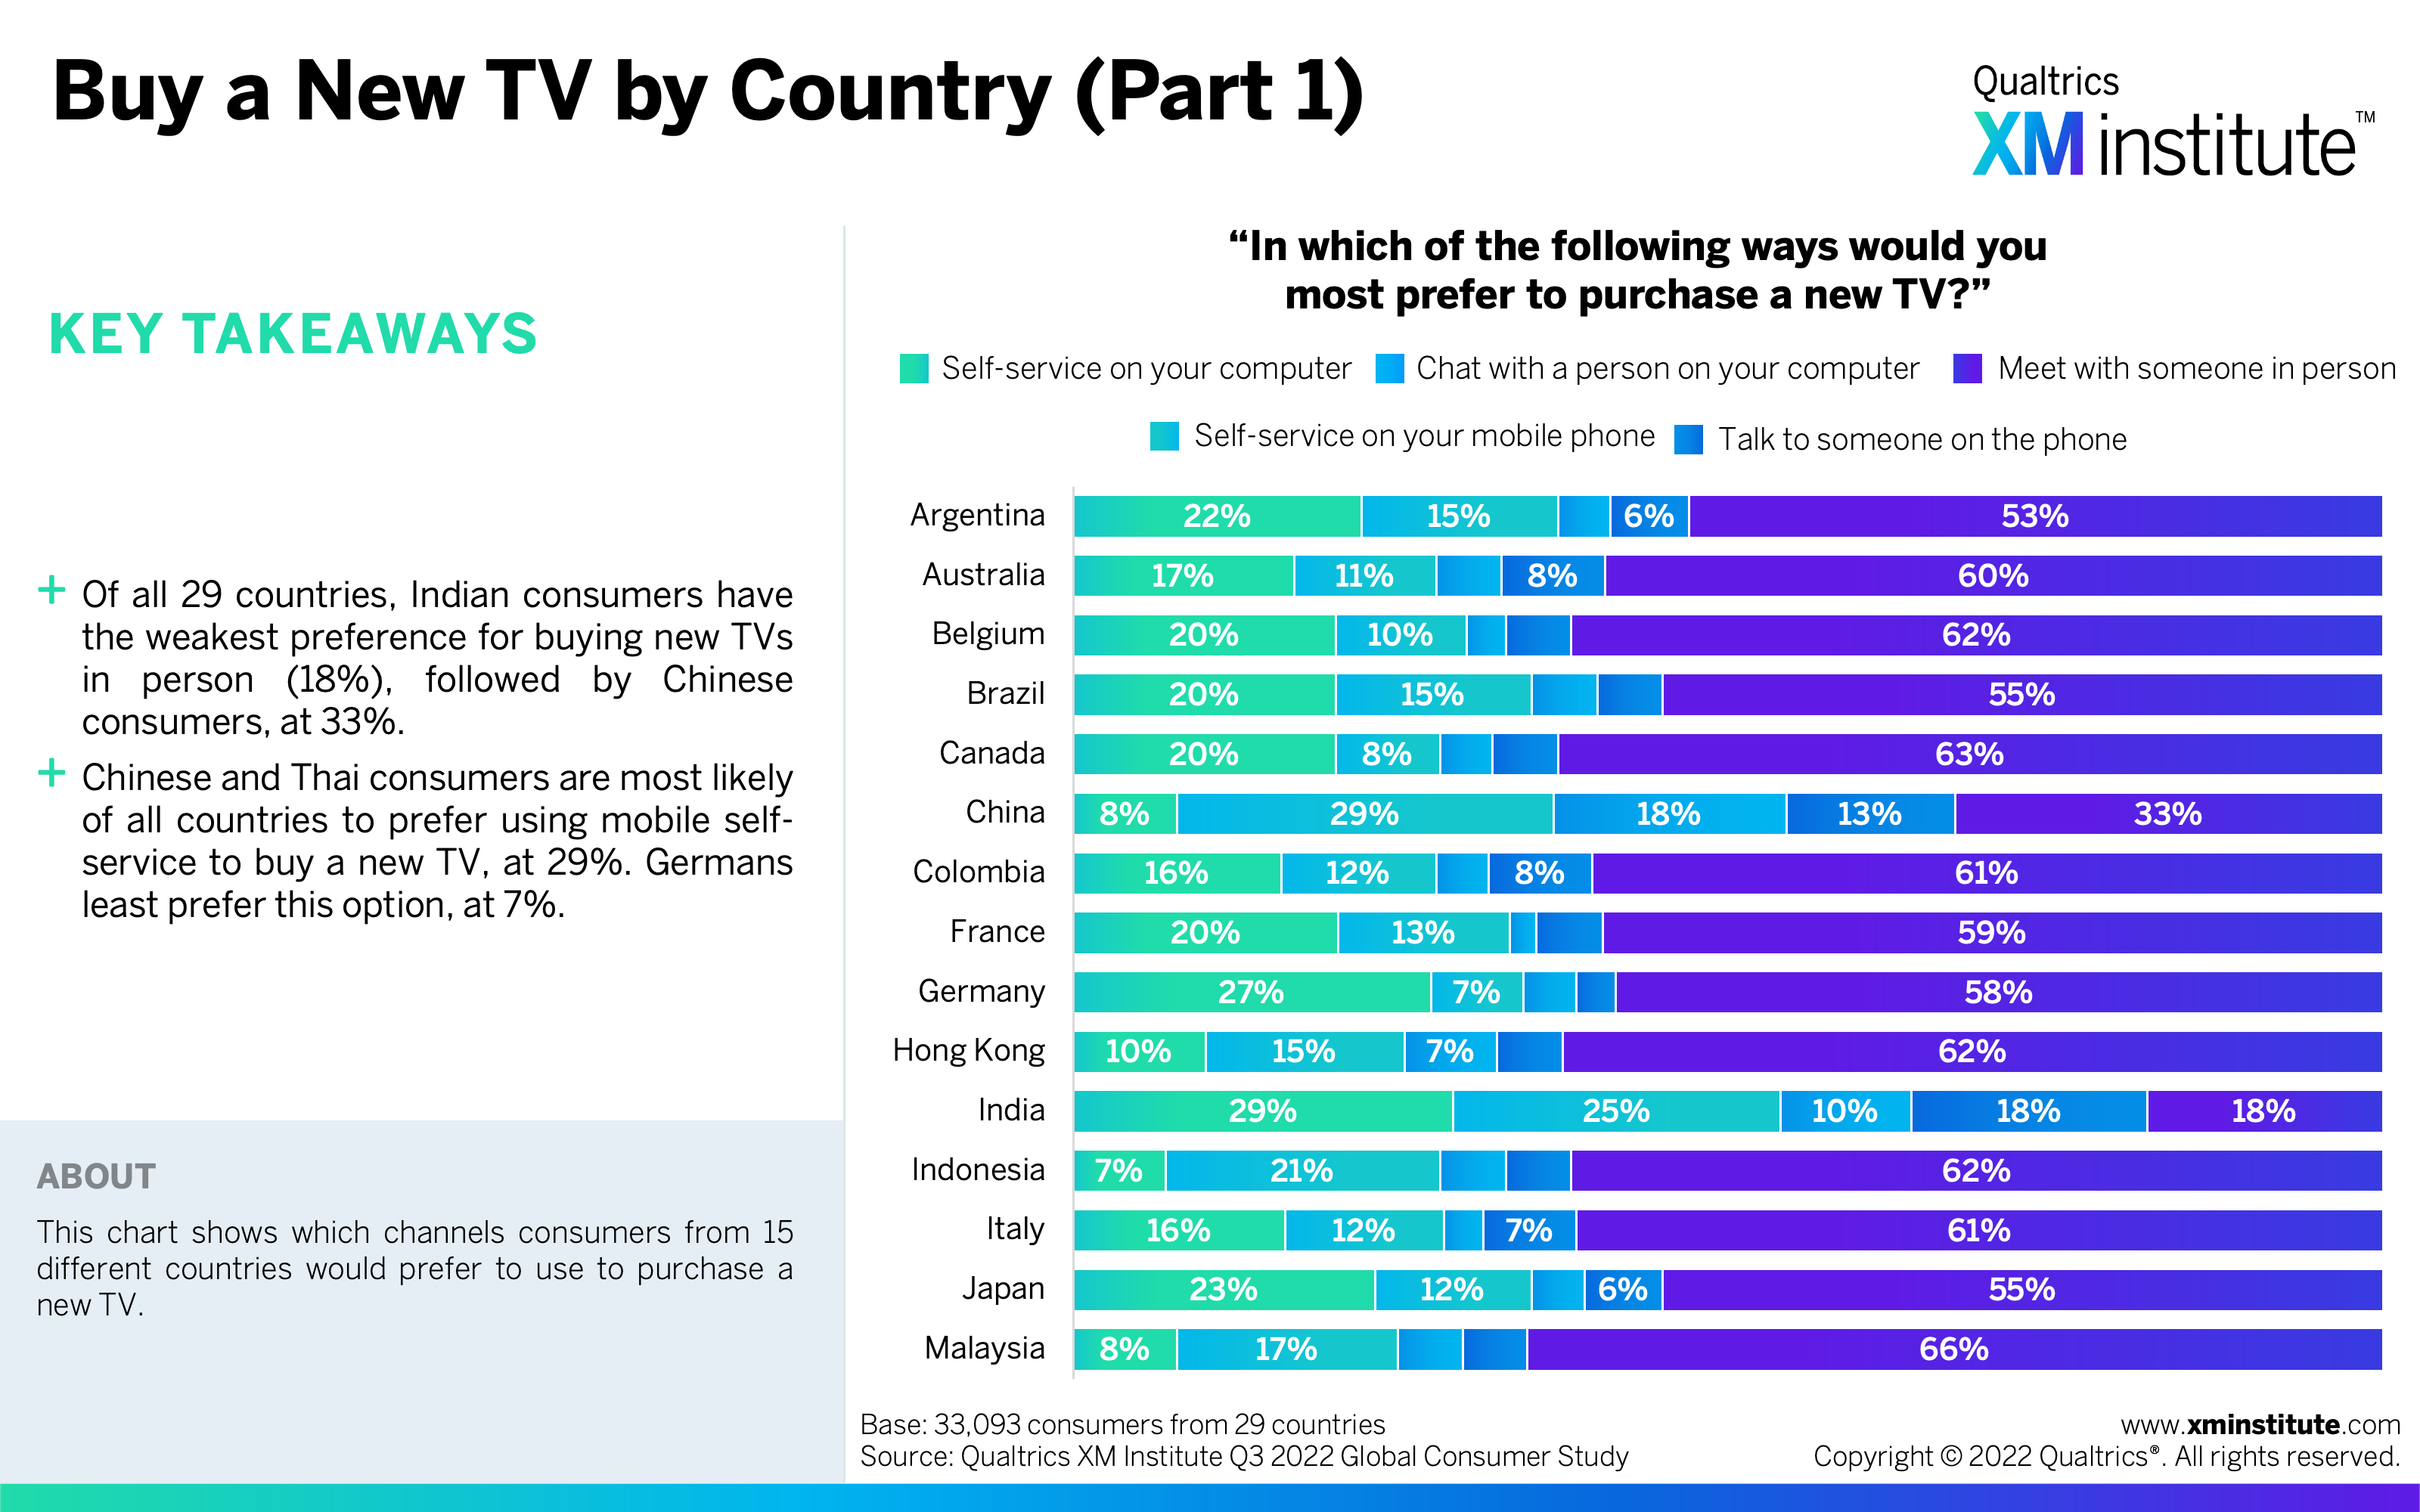
- Buy a New TV by Country (Part 1) (see Figure 14)
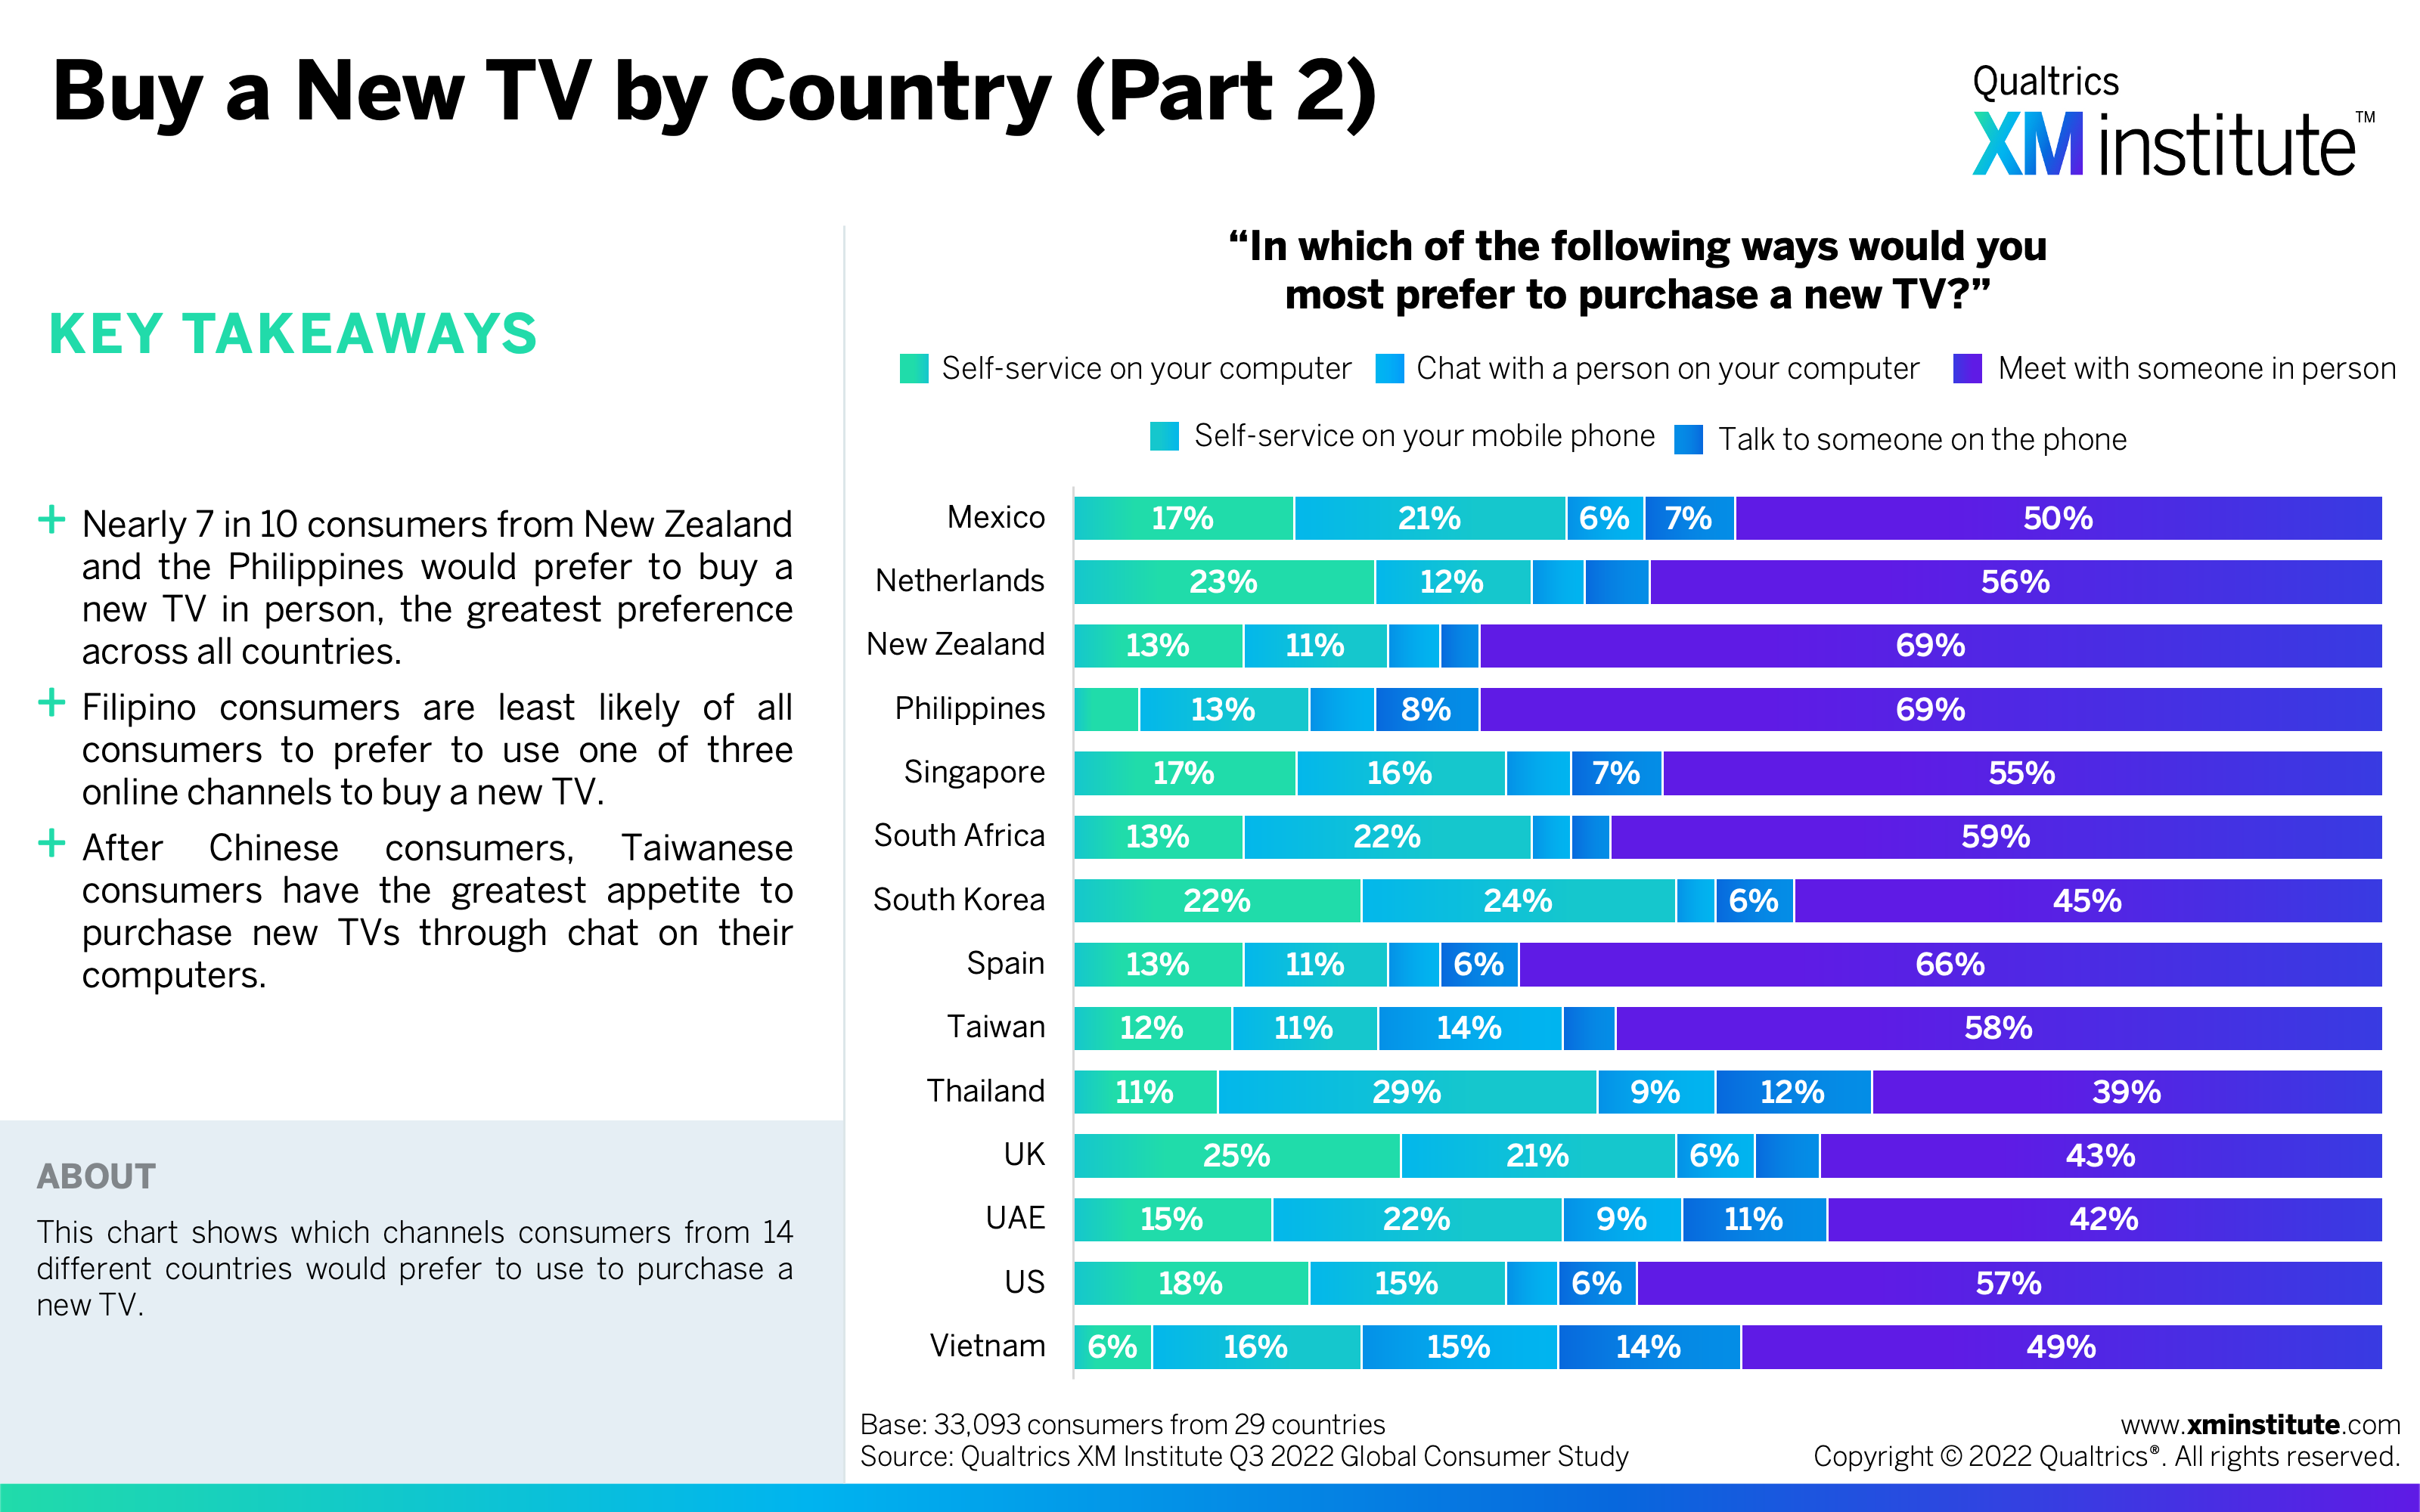
- Buy a New TV by Country (Part 2) (see Figure 15)
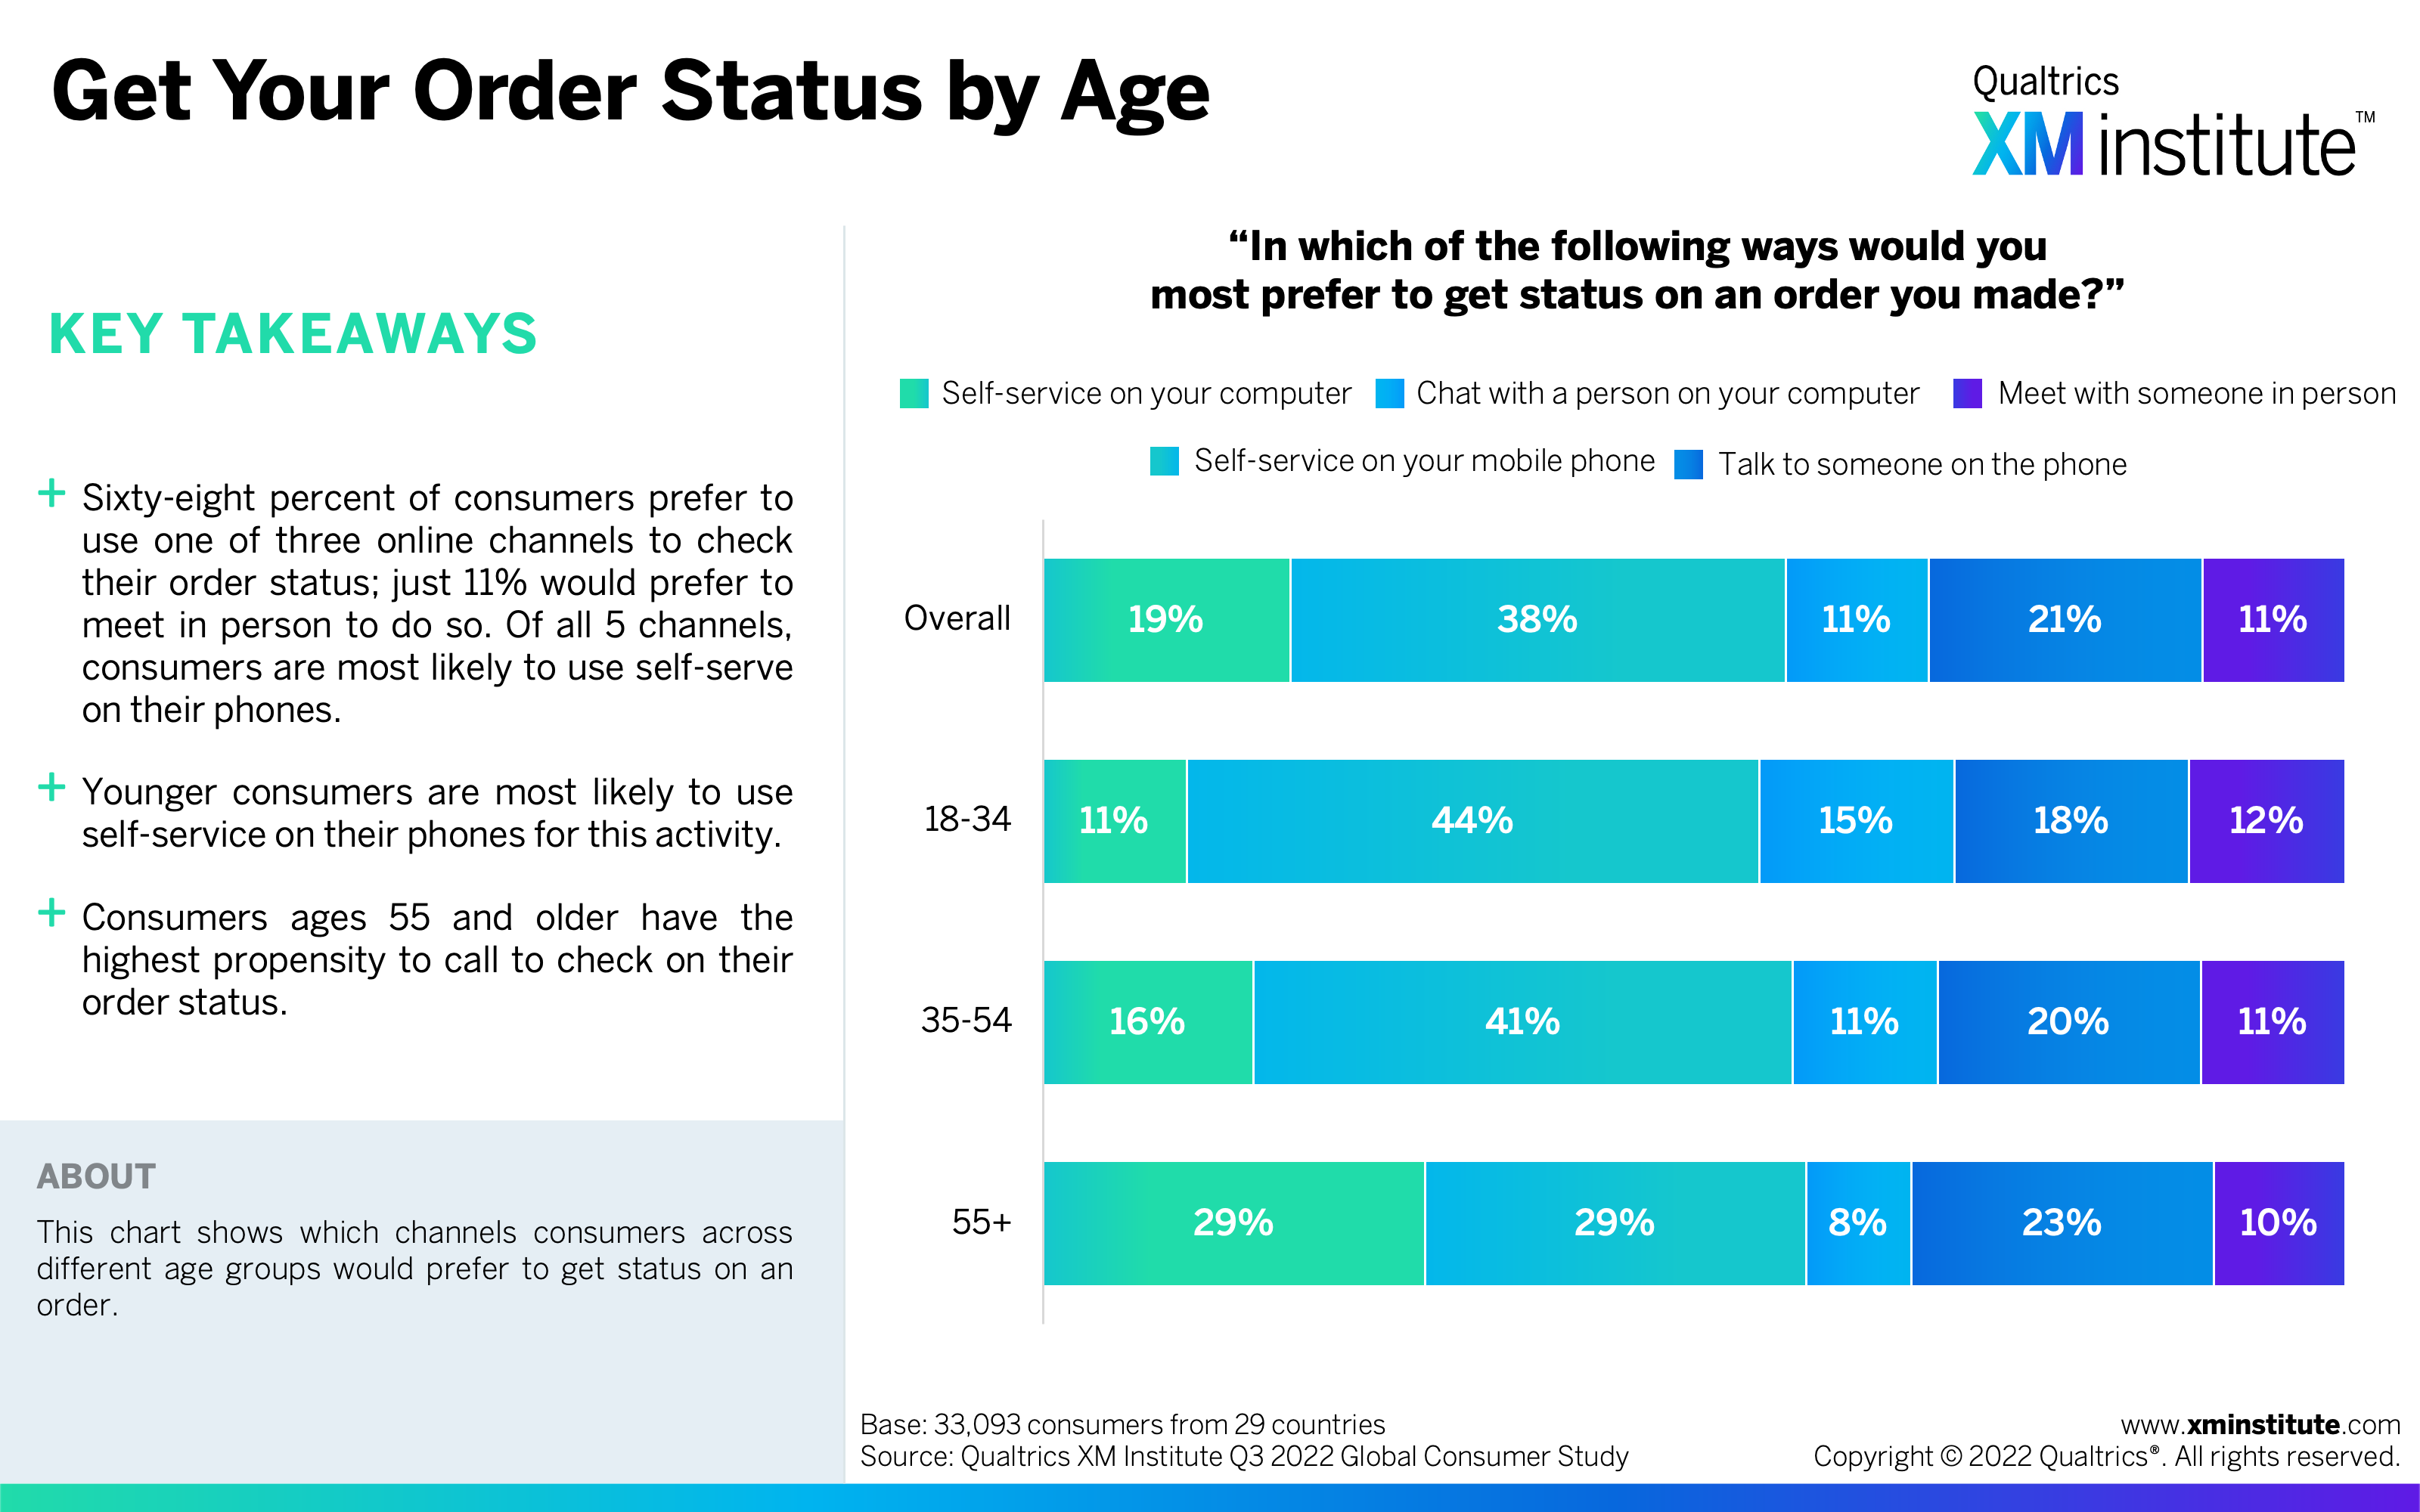
- Get Your Order Status by Age (see Figure 16)
- Get Your Order Status by Country (Part 1) (see Figure 17)
- Get Your Order Status by Country (Part 2) (see Figure 18)
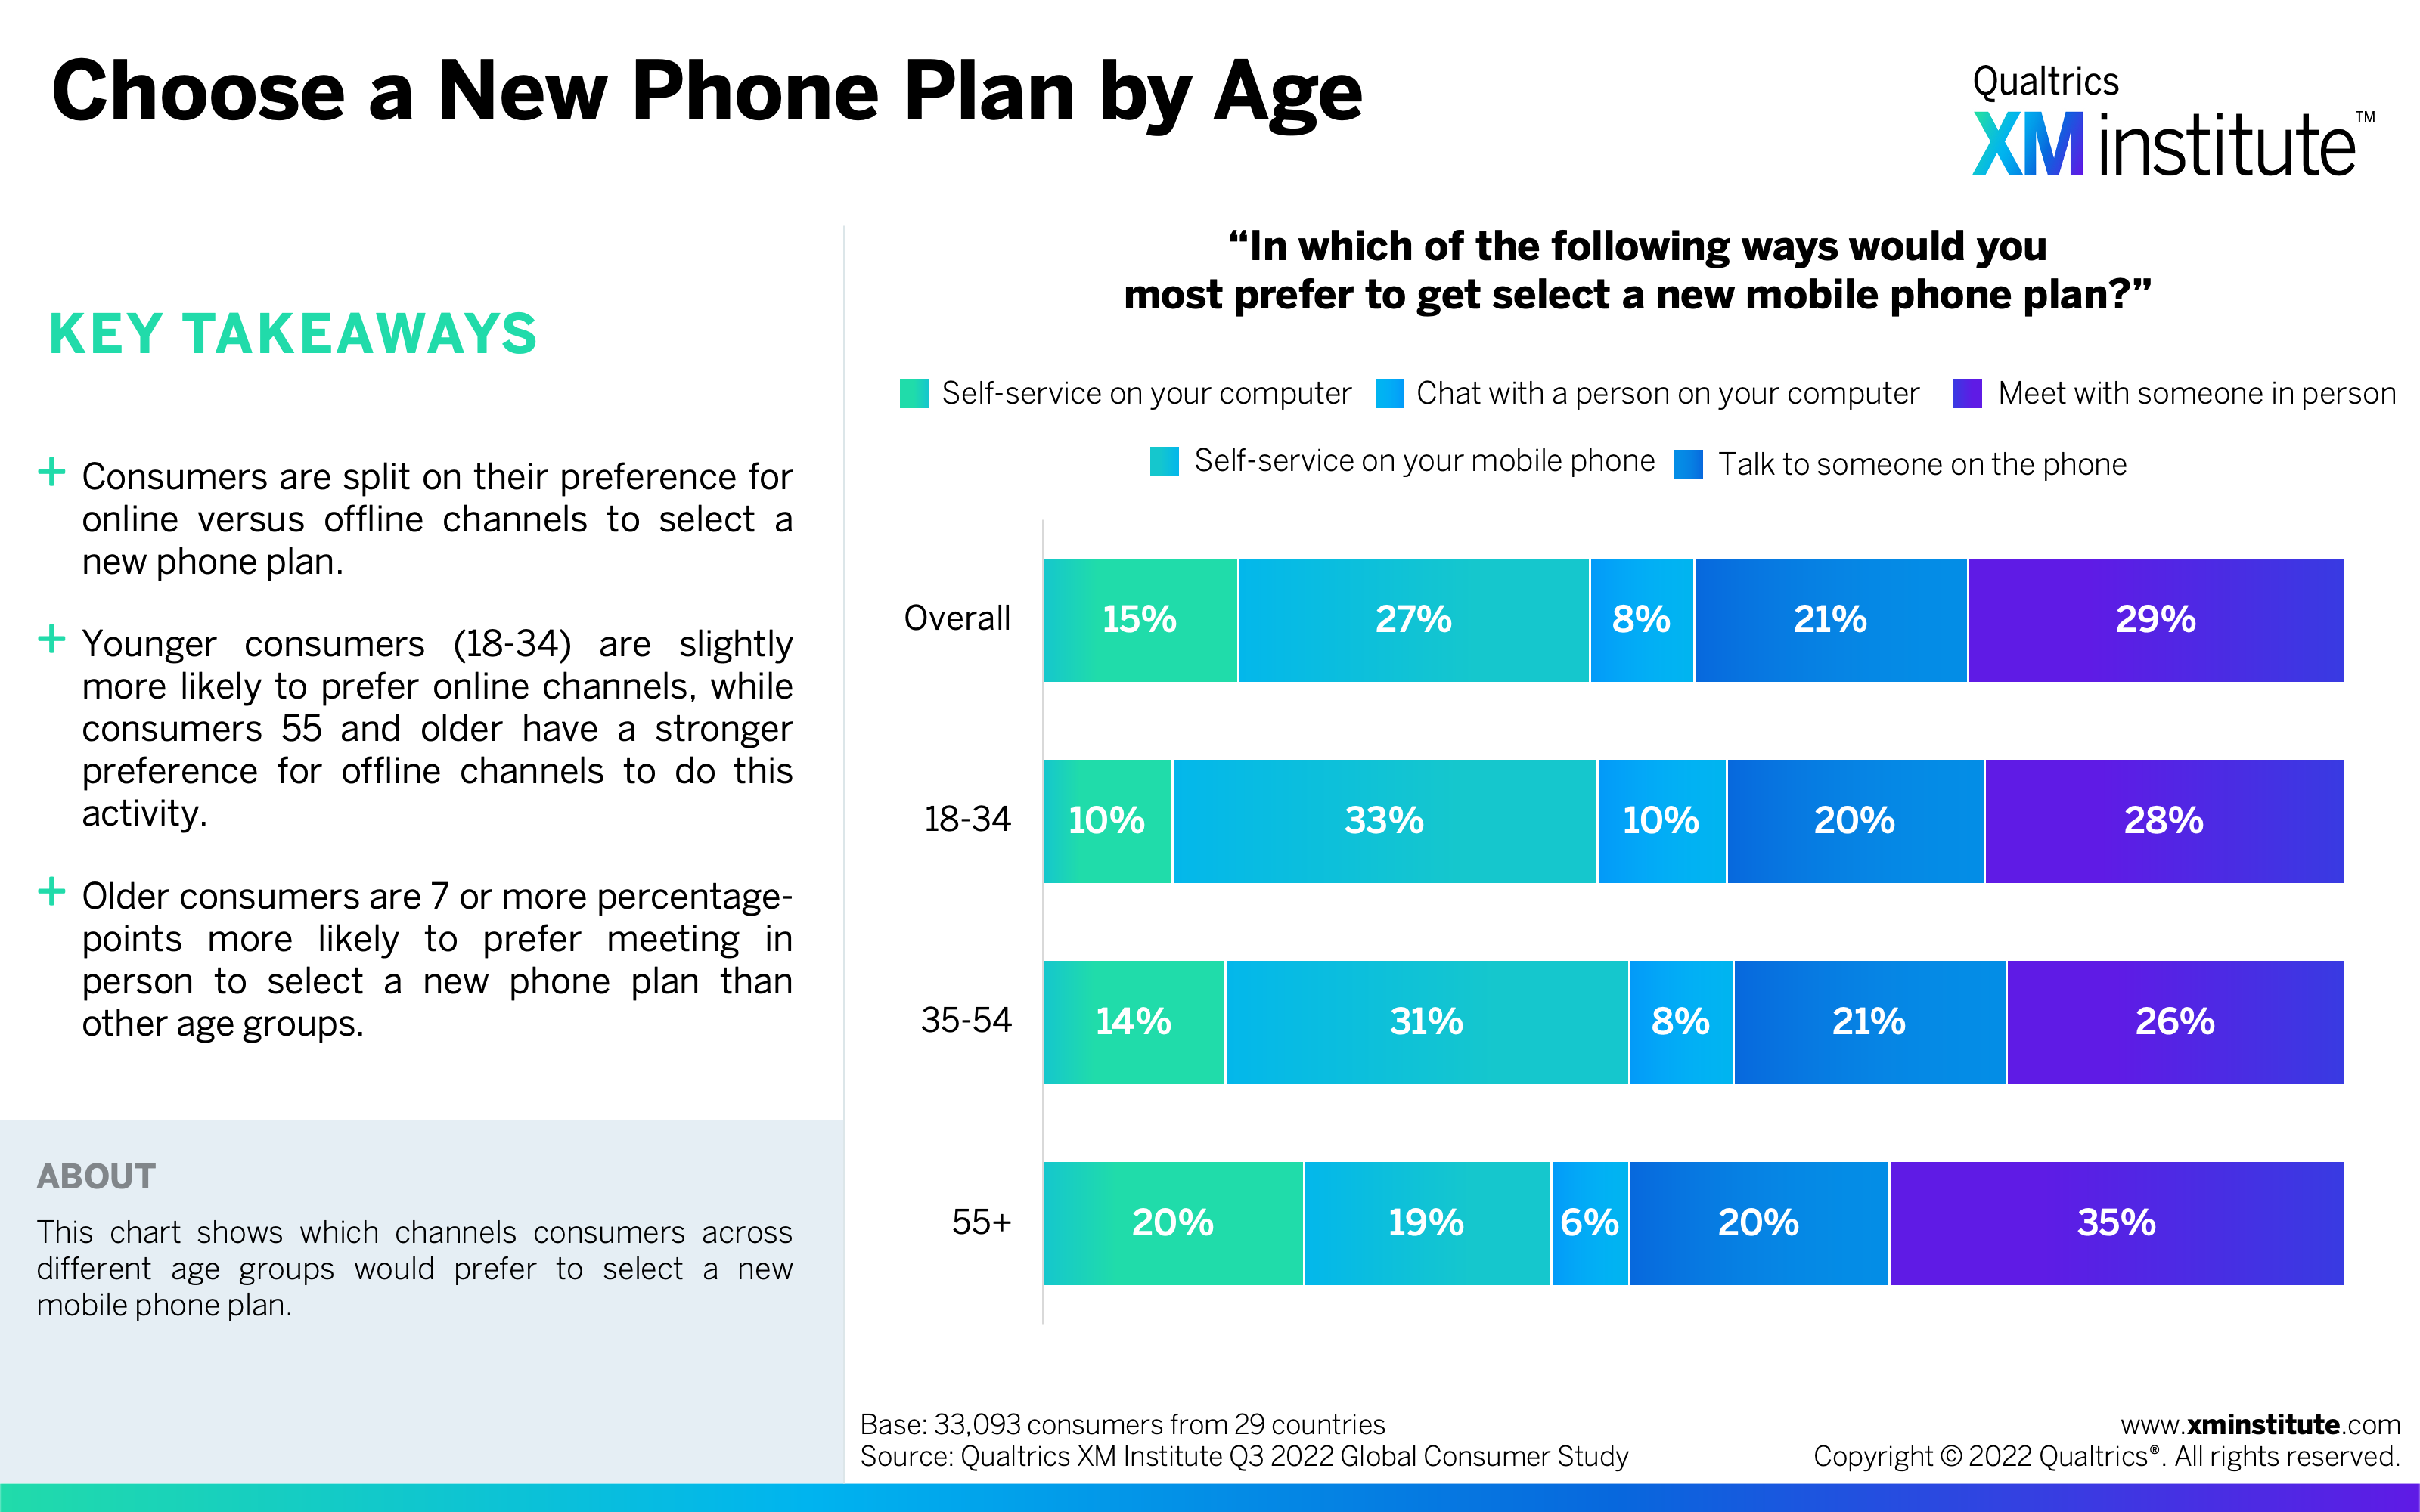
- Choose a New Phone Plan by Age (see Figure 19)
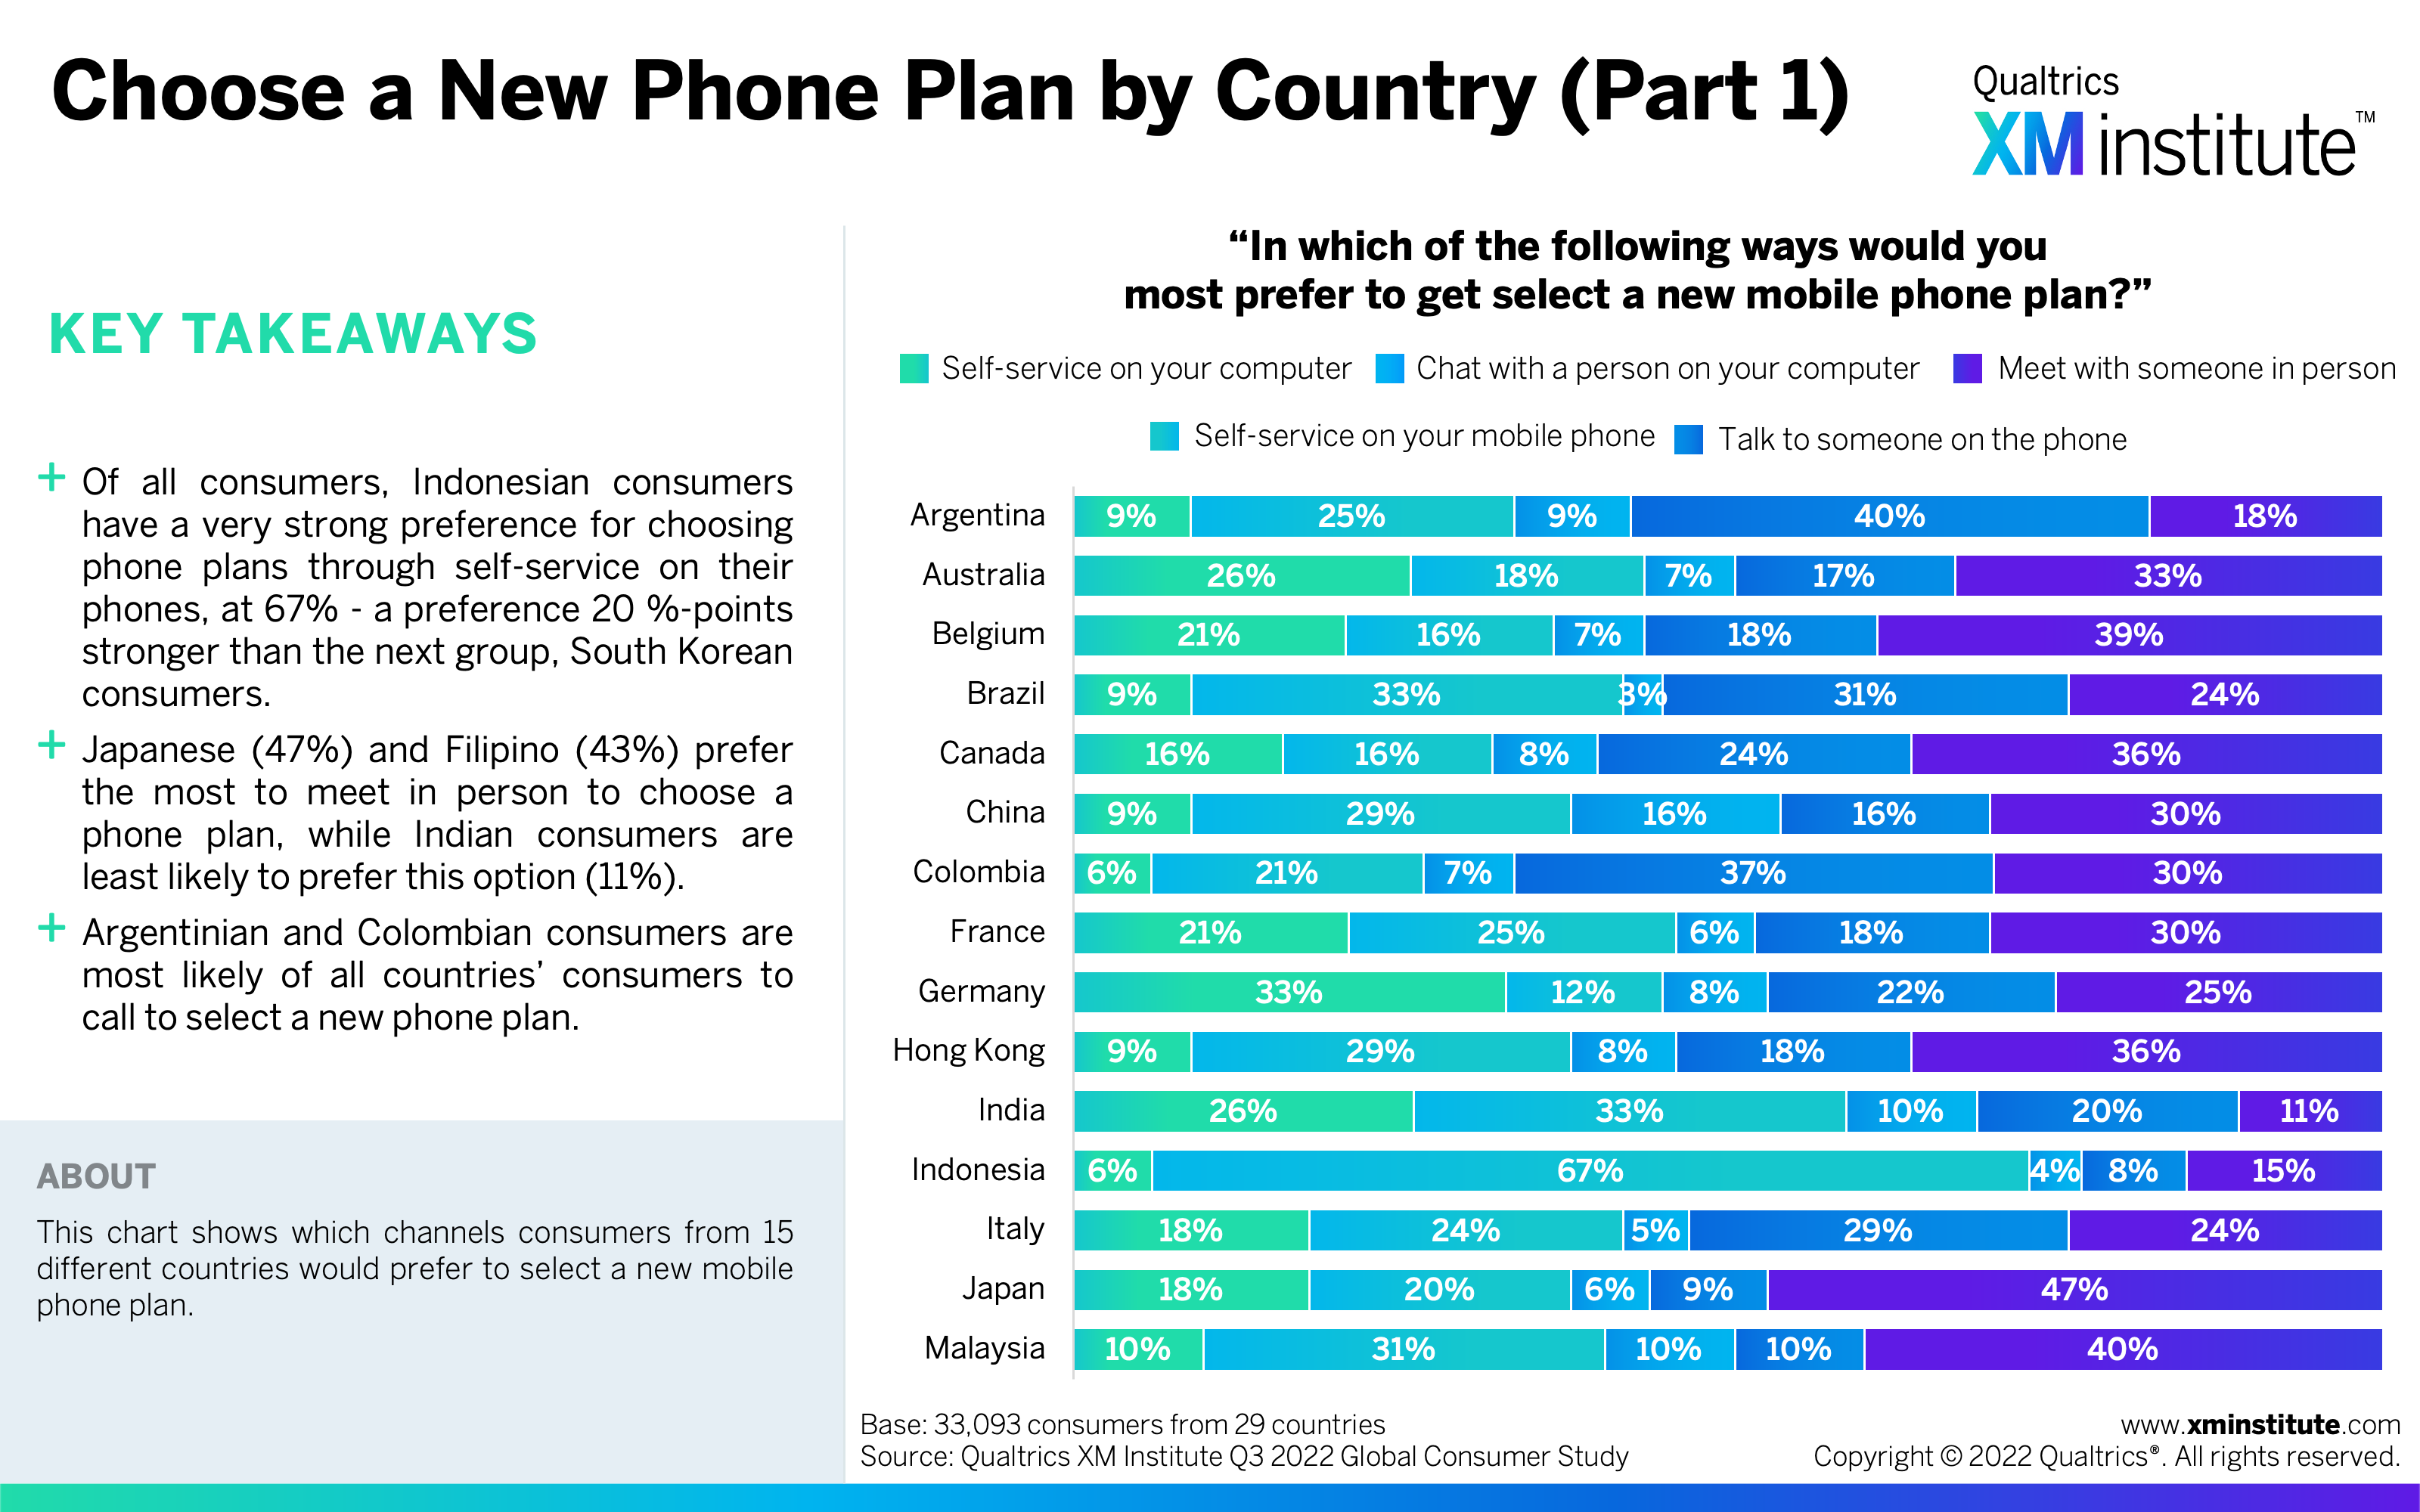
- Choose a New Phone Plan by Country (Part 1) (see Figure 20)
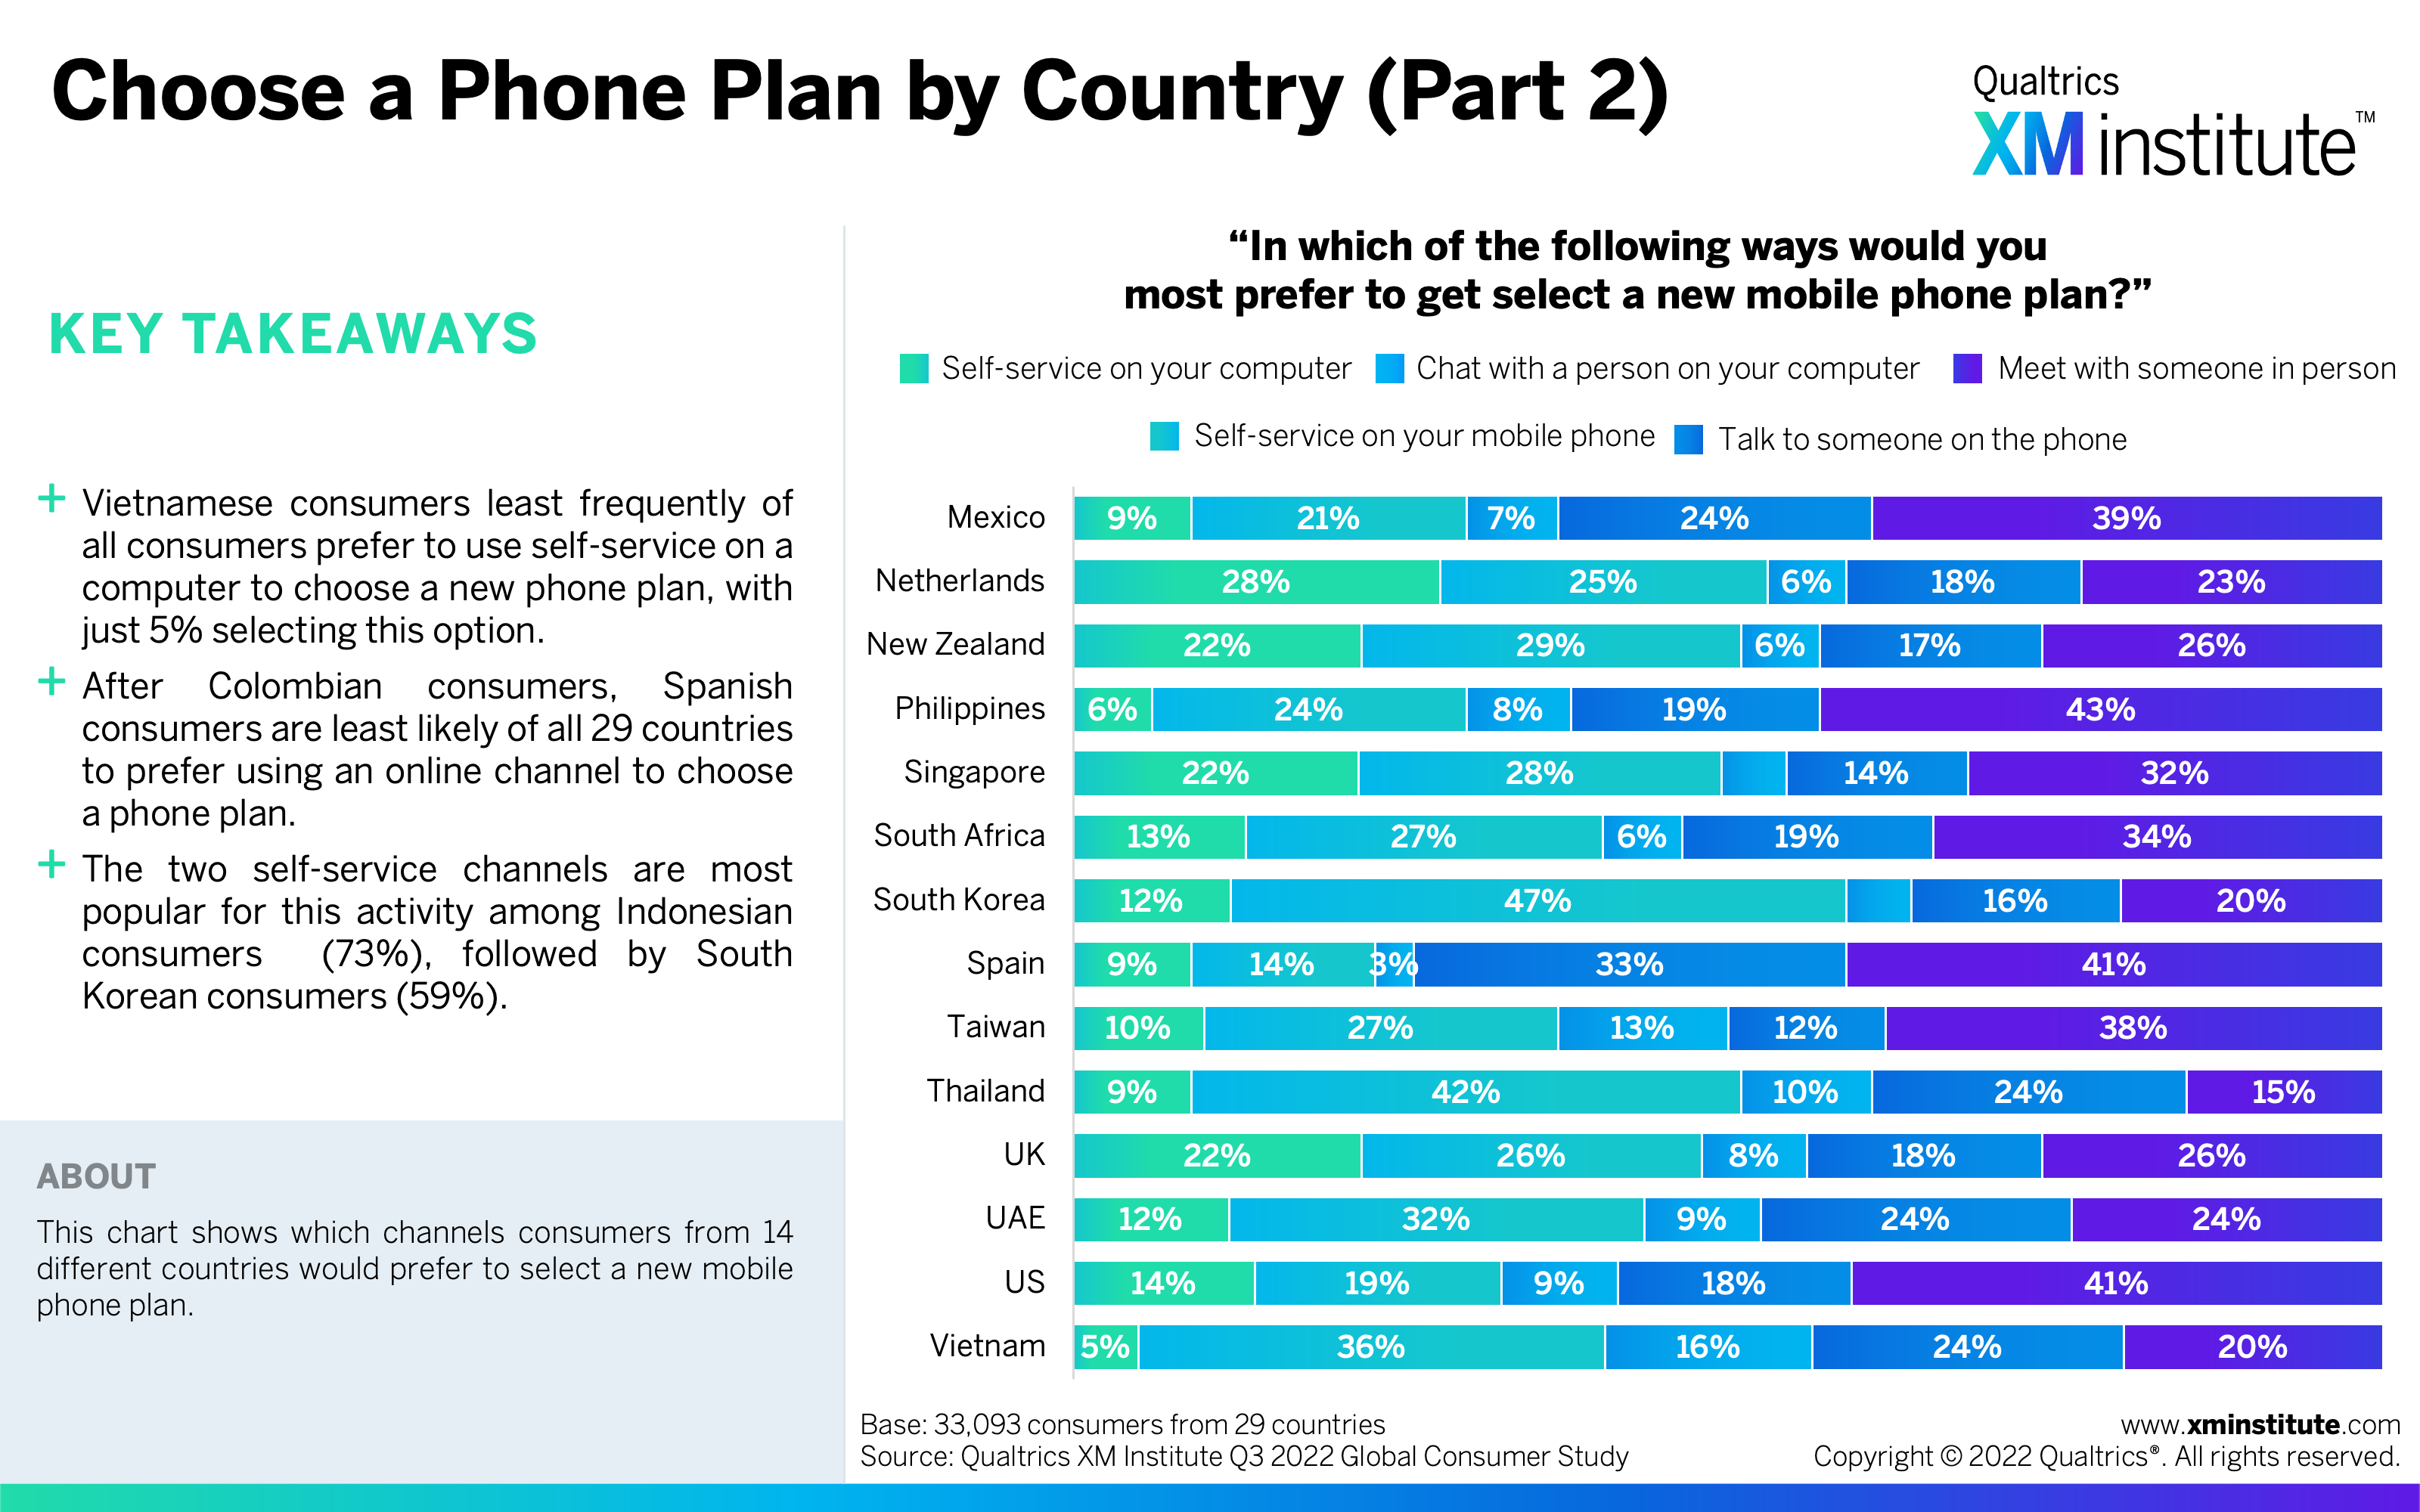
- Choose a New Phone Plan by Country (Part 2) (see Figure 21)
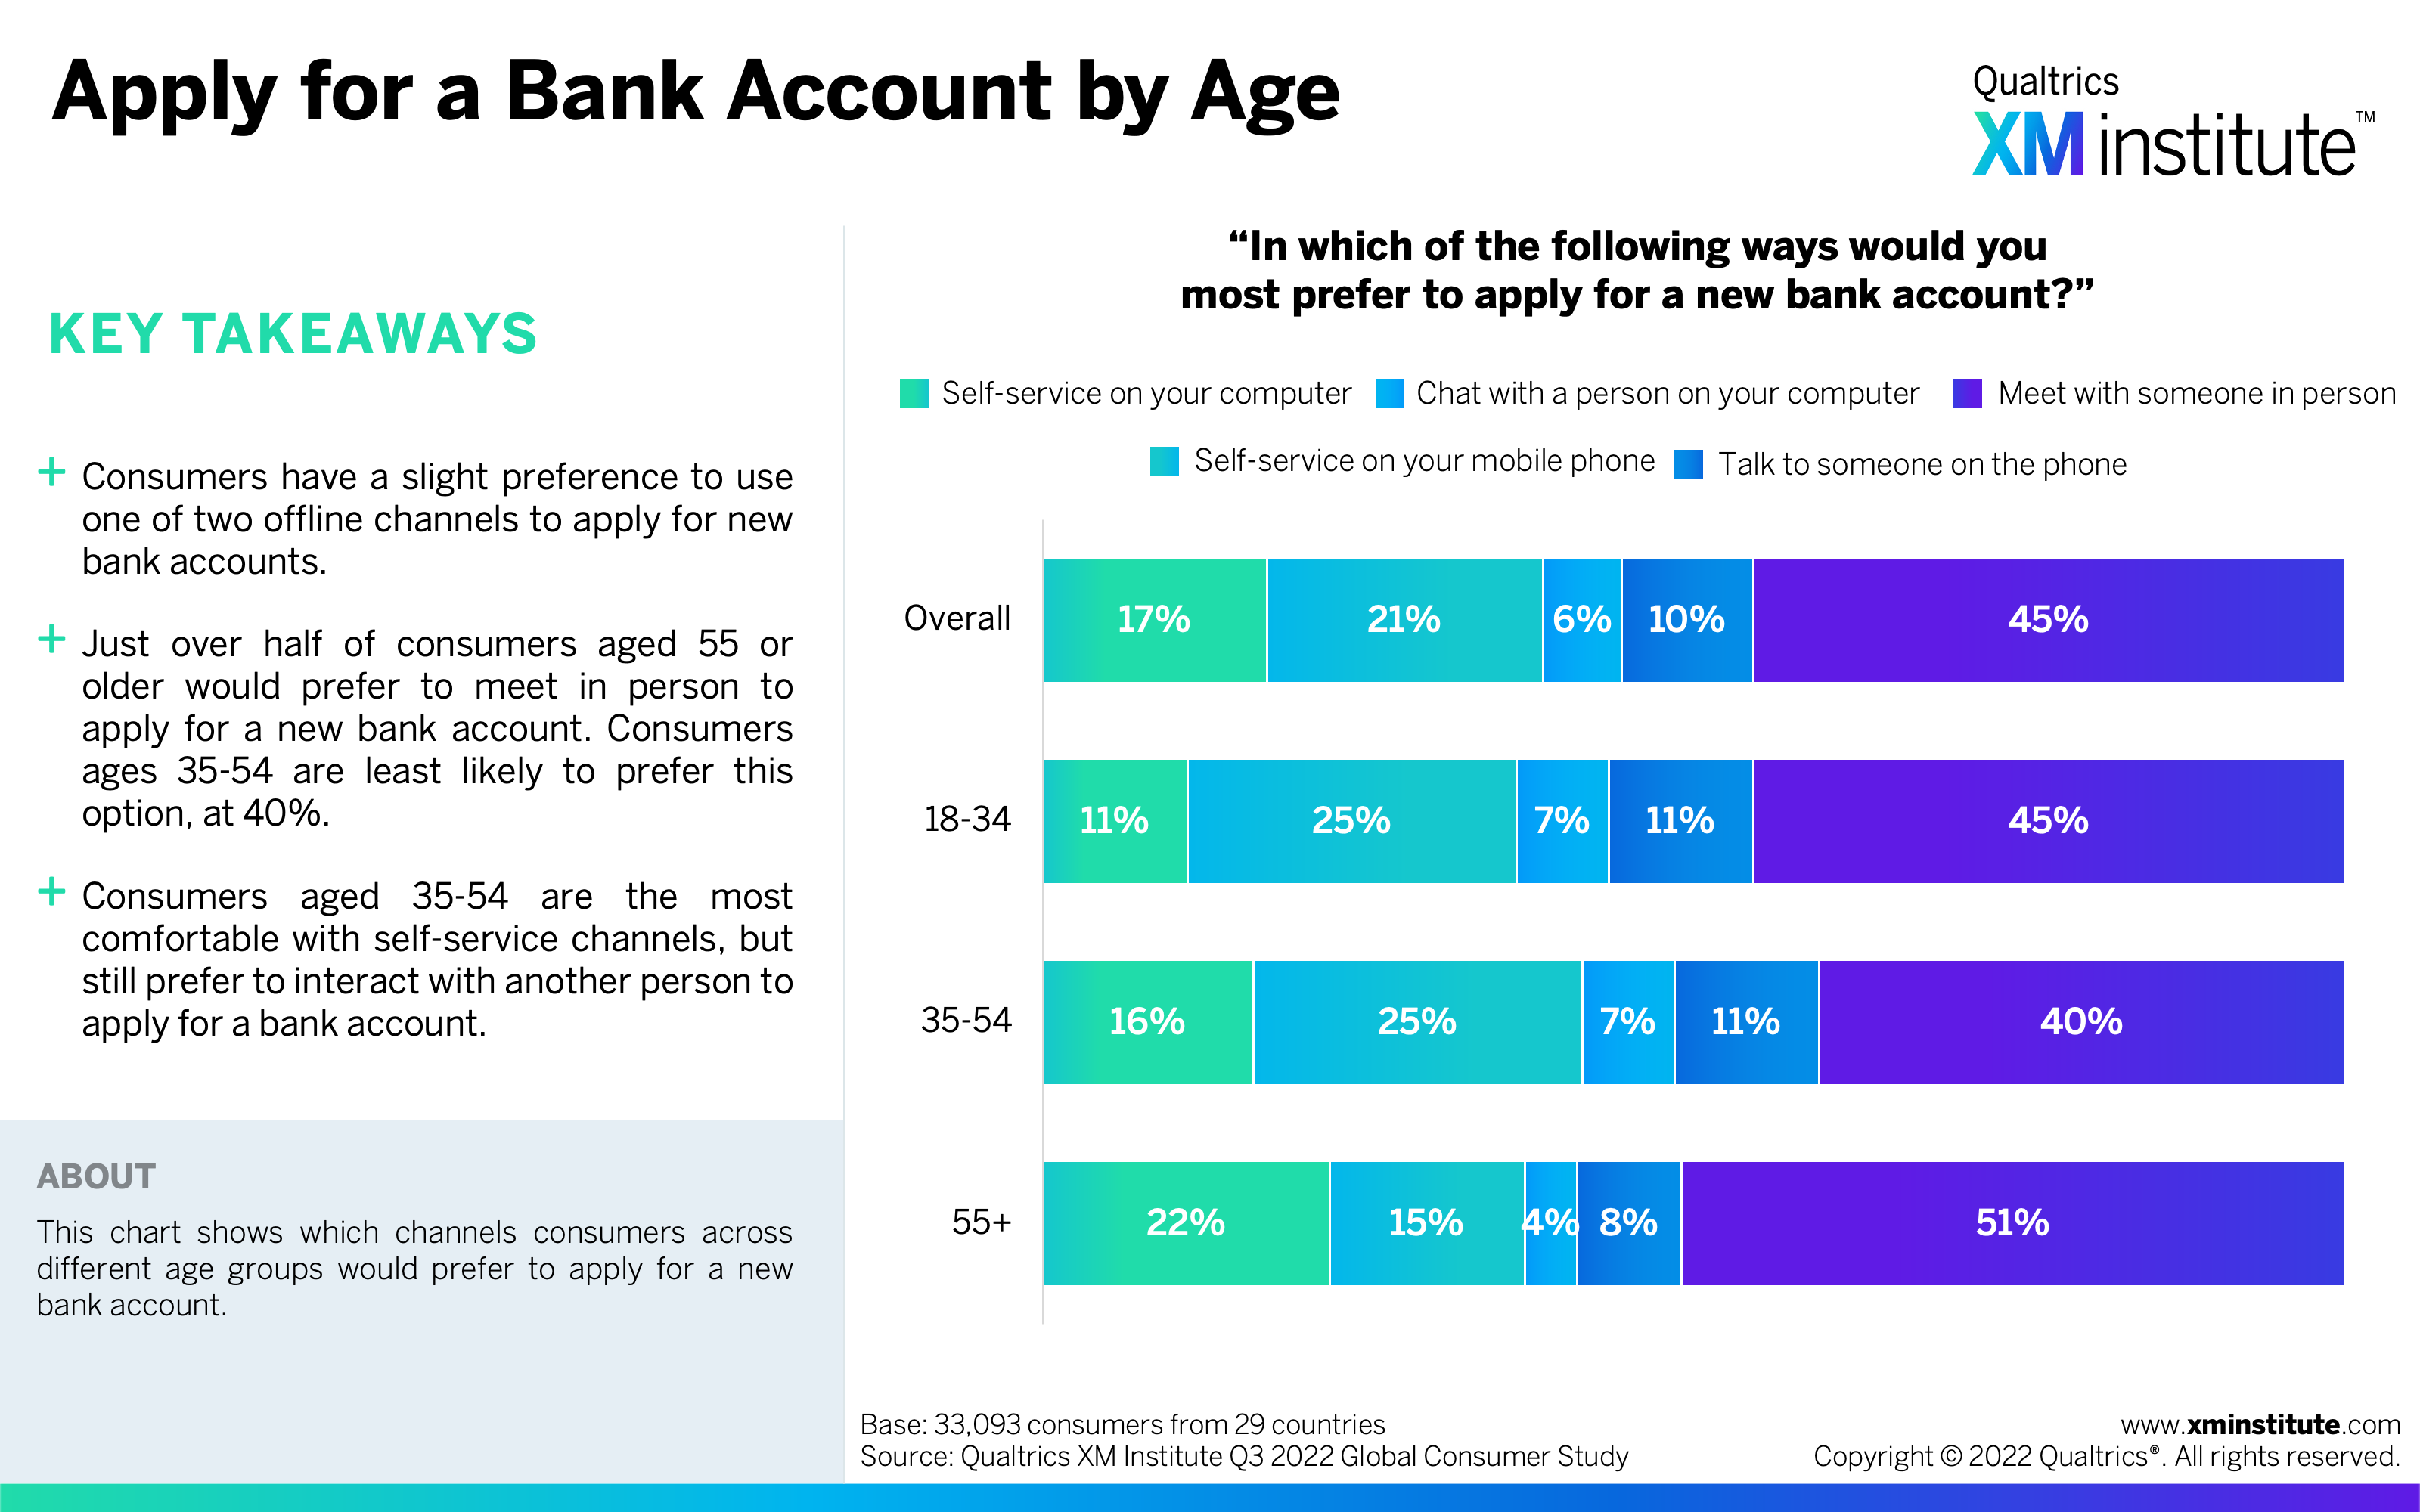
- Apply for a Bank Account by Age (see Figure 22)
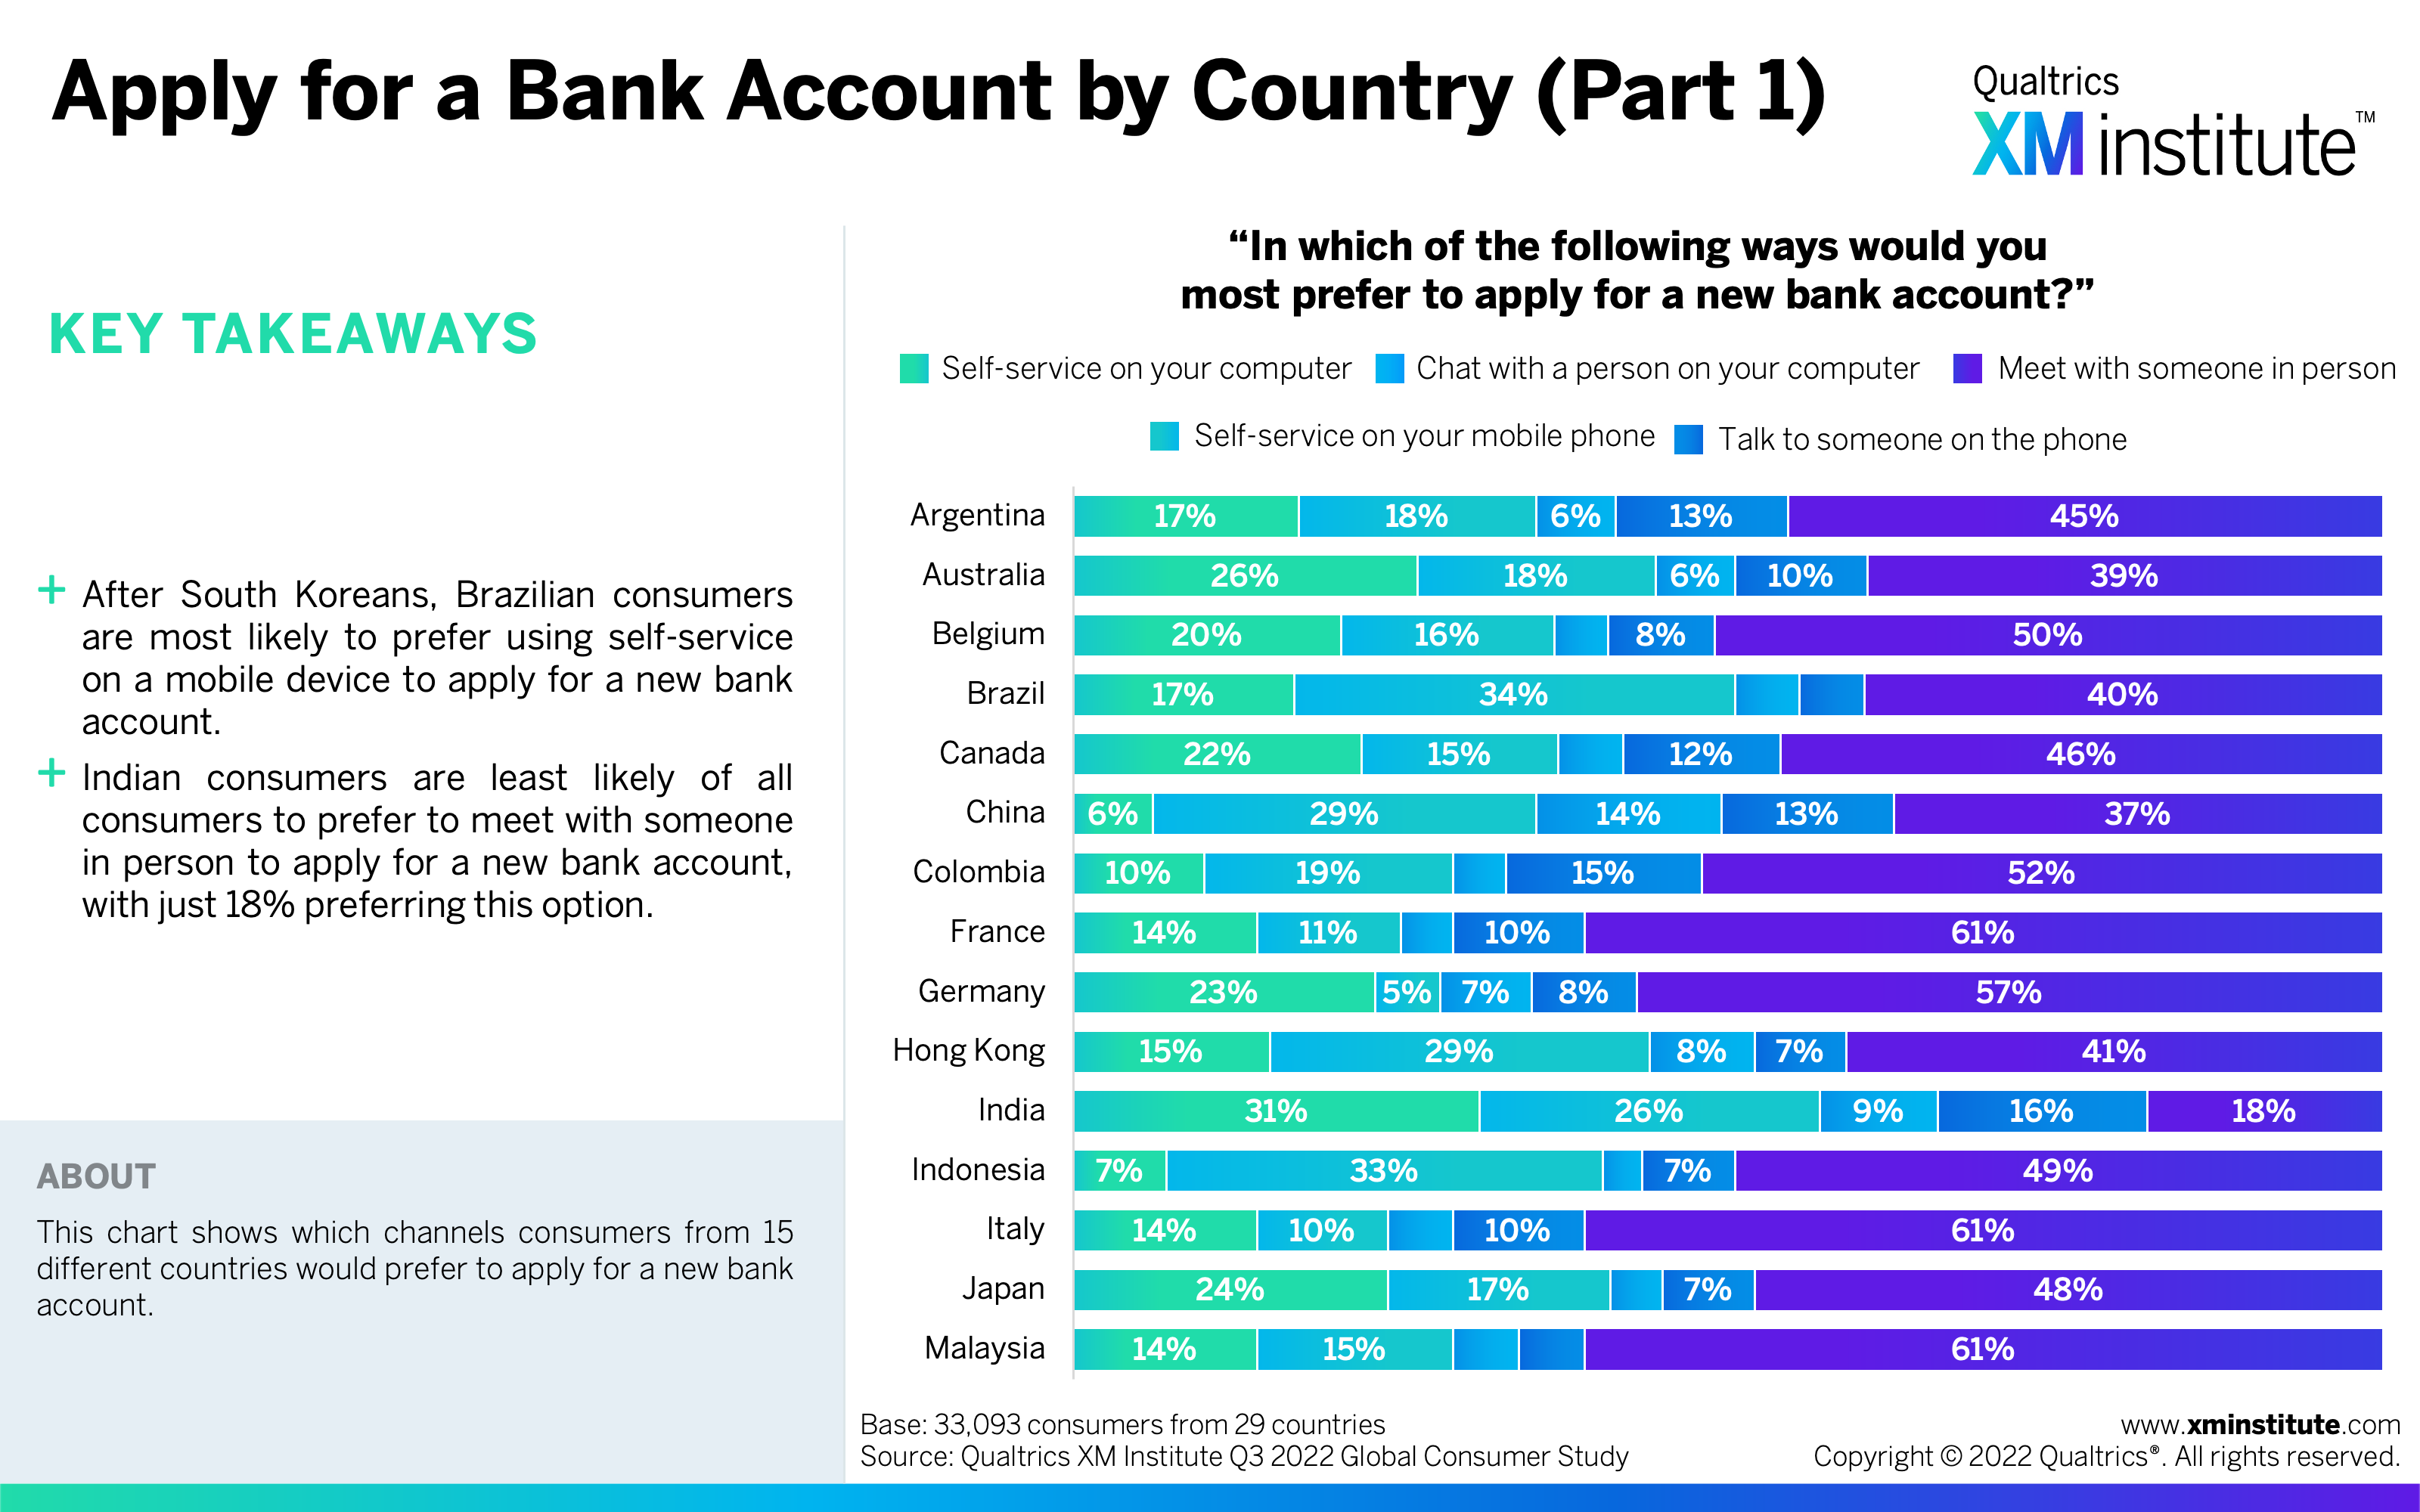
- Apply for a Bank Account by Country (Part 1) (see Figure 23)
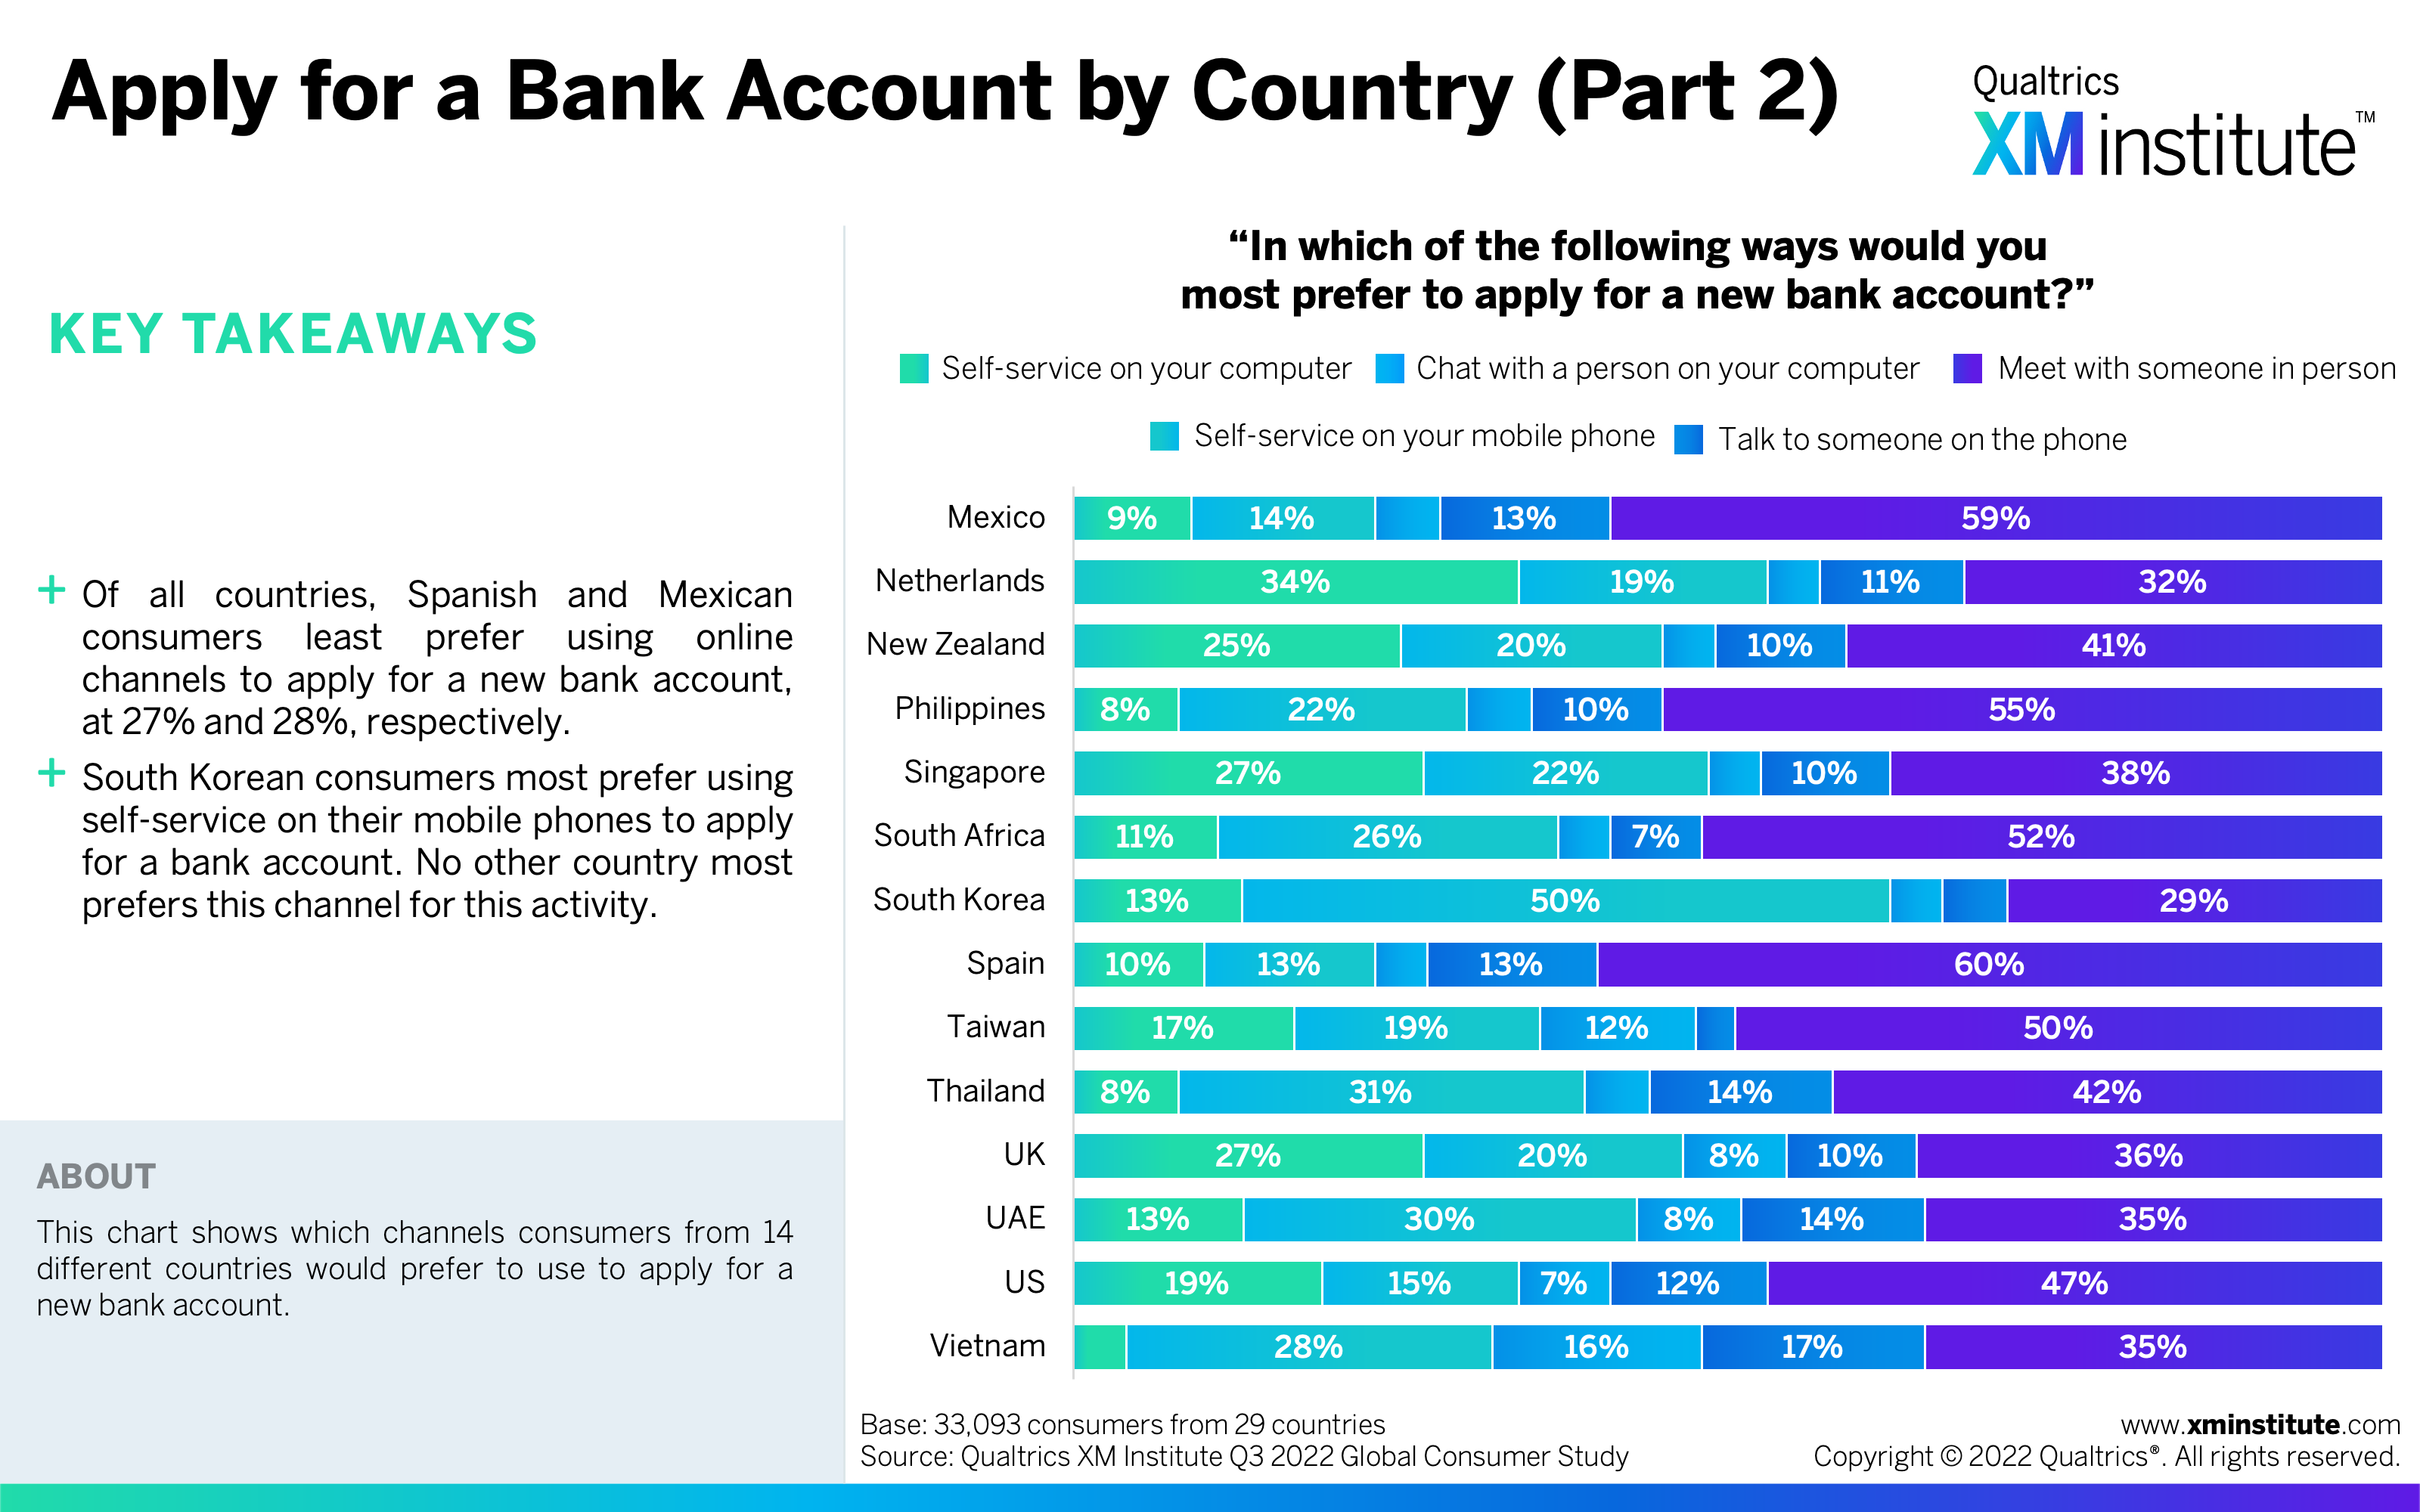
- Apply for a Bank Account by Country (Part 2) (see Figure 24)
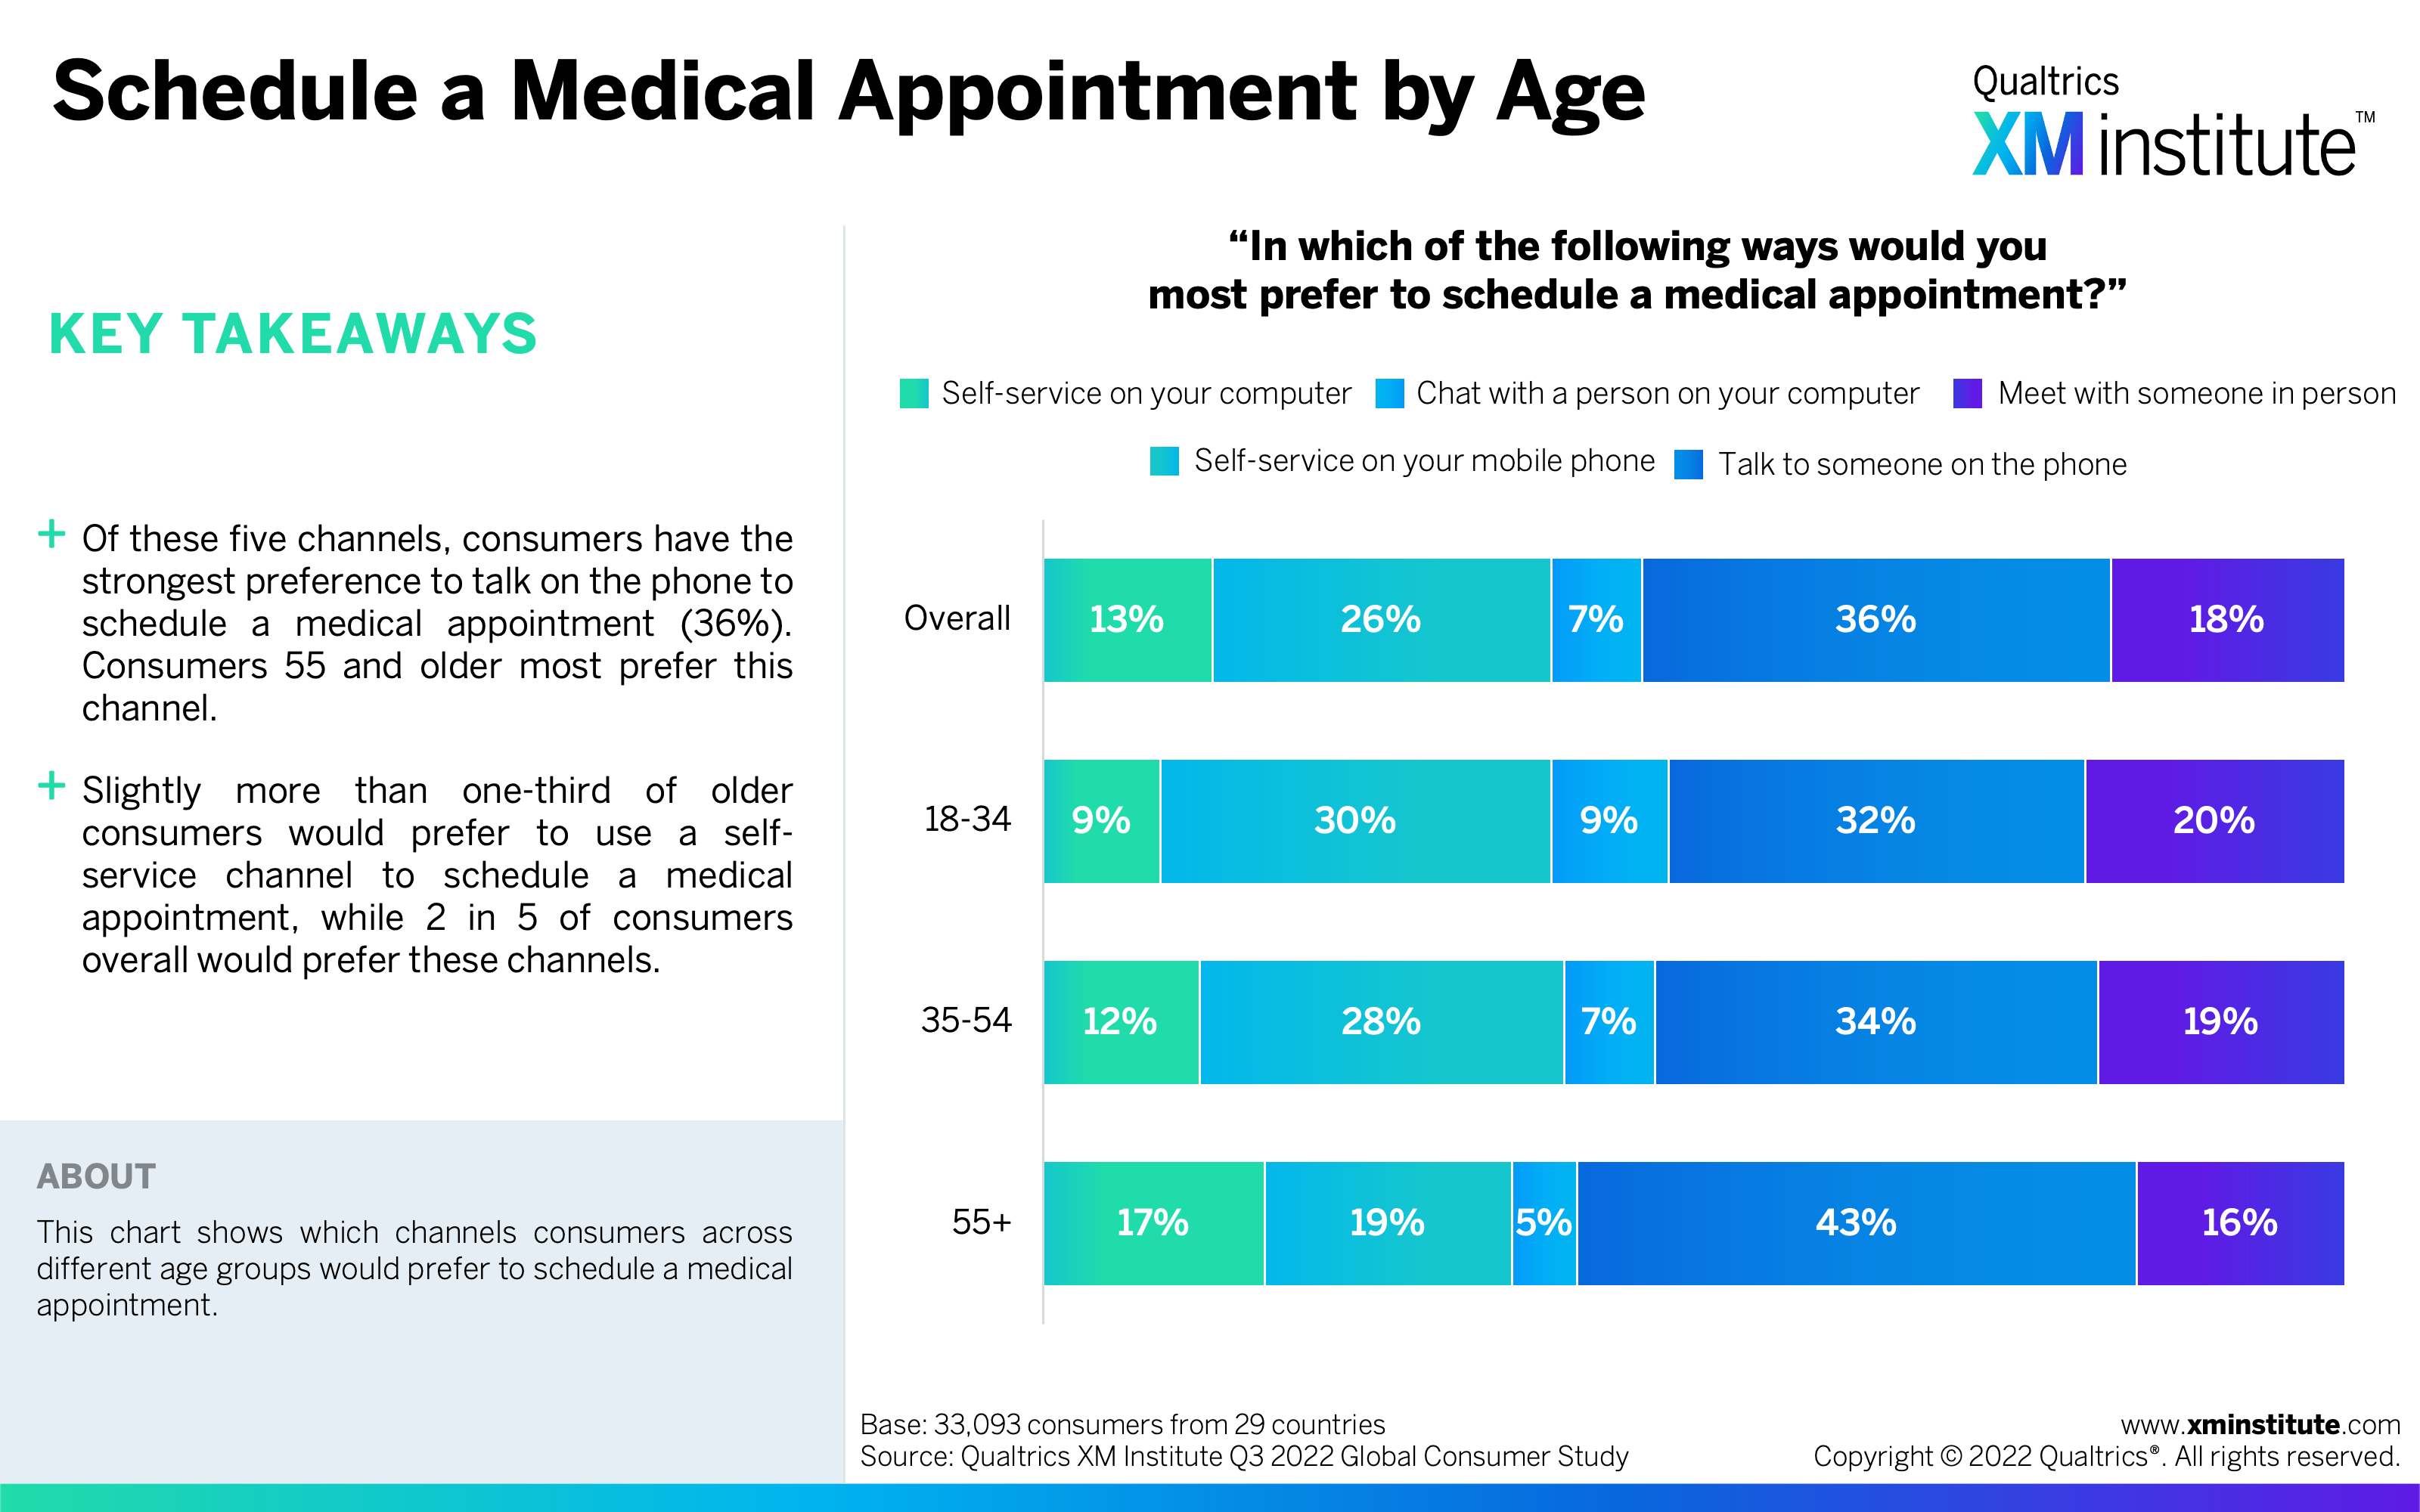
- Schedule a Medical Appointment by Age (see Figure 25)
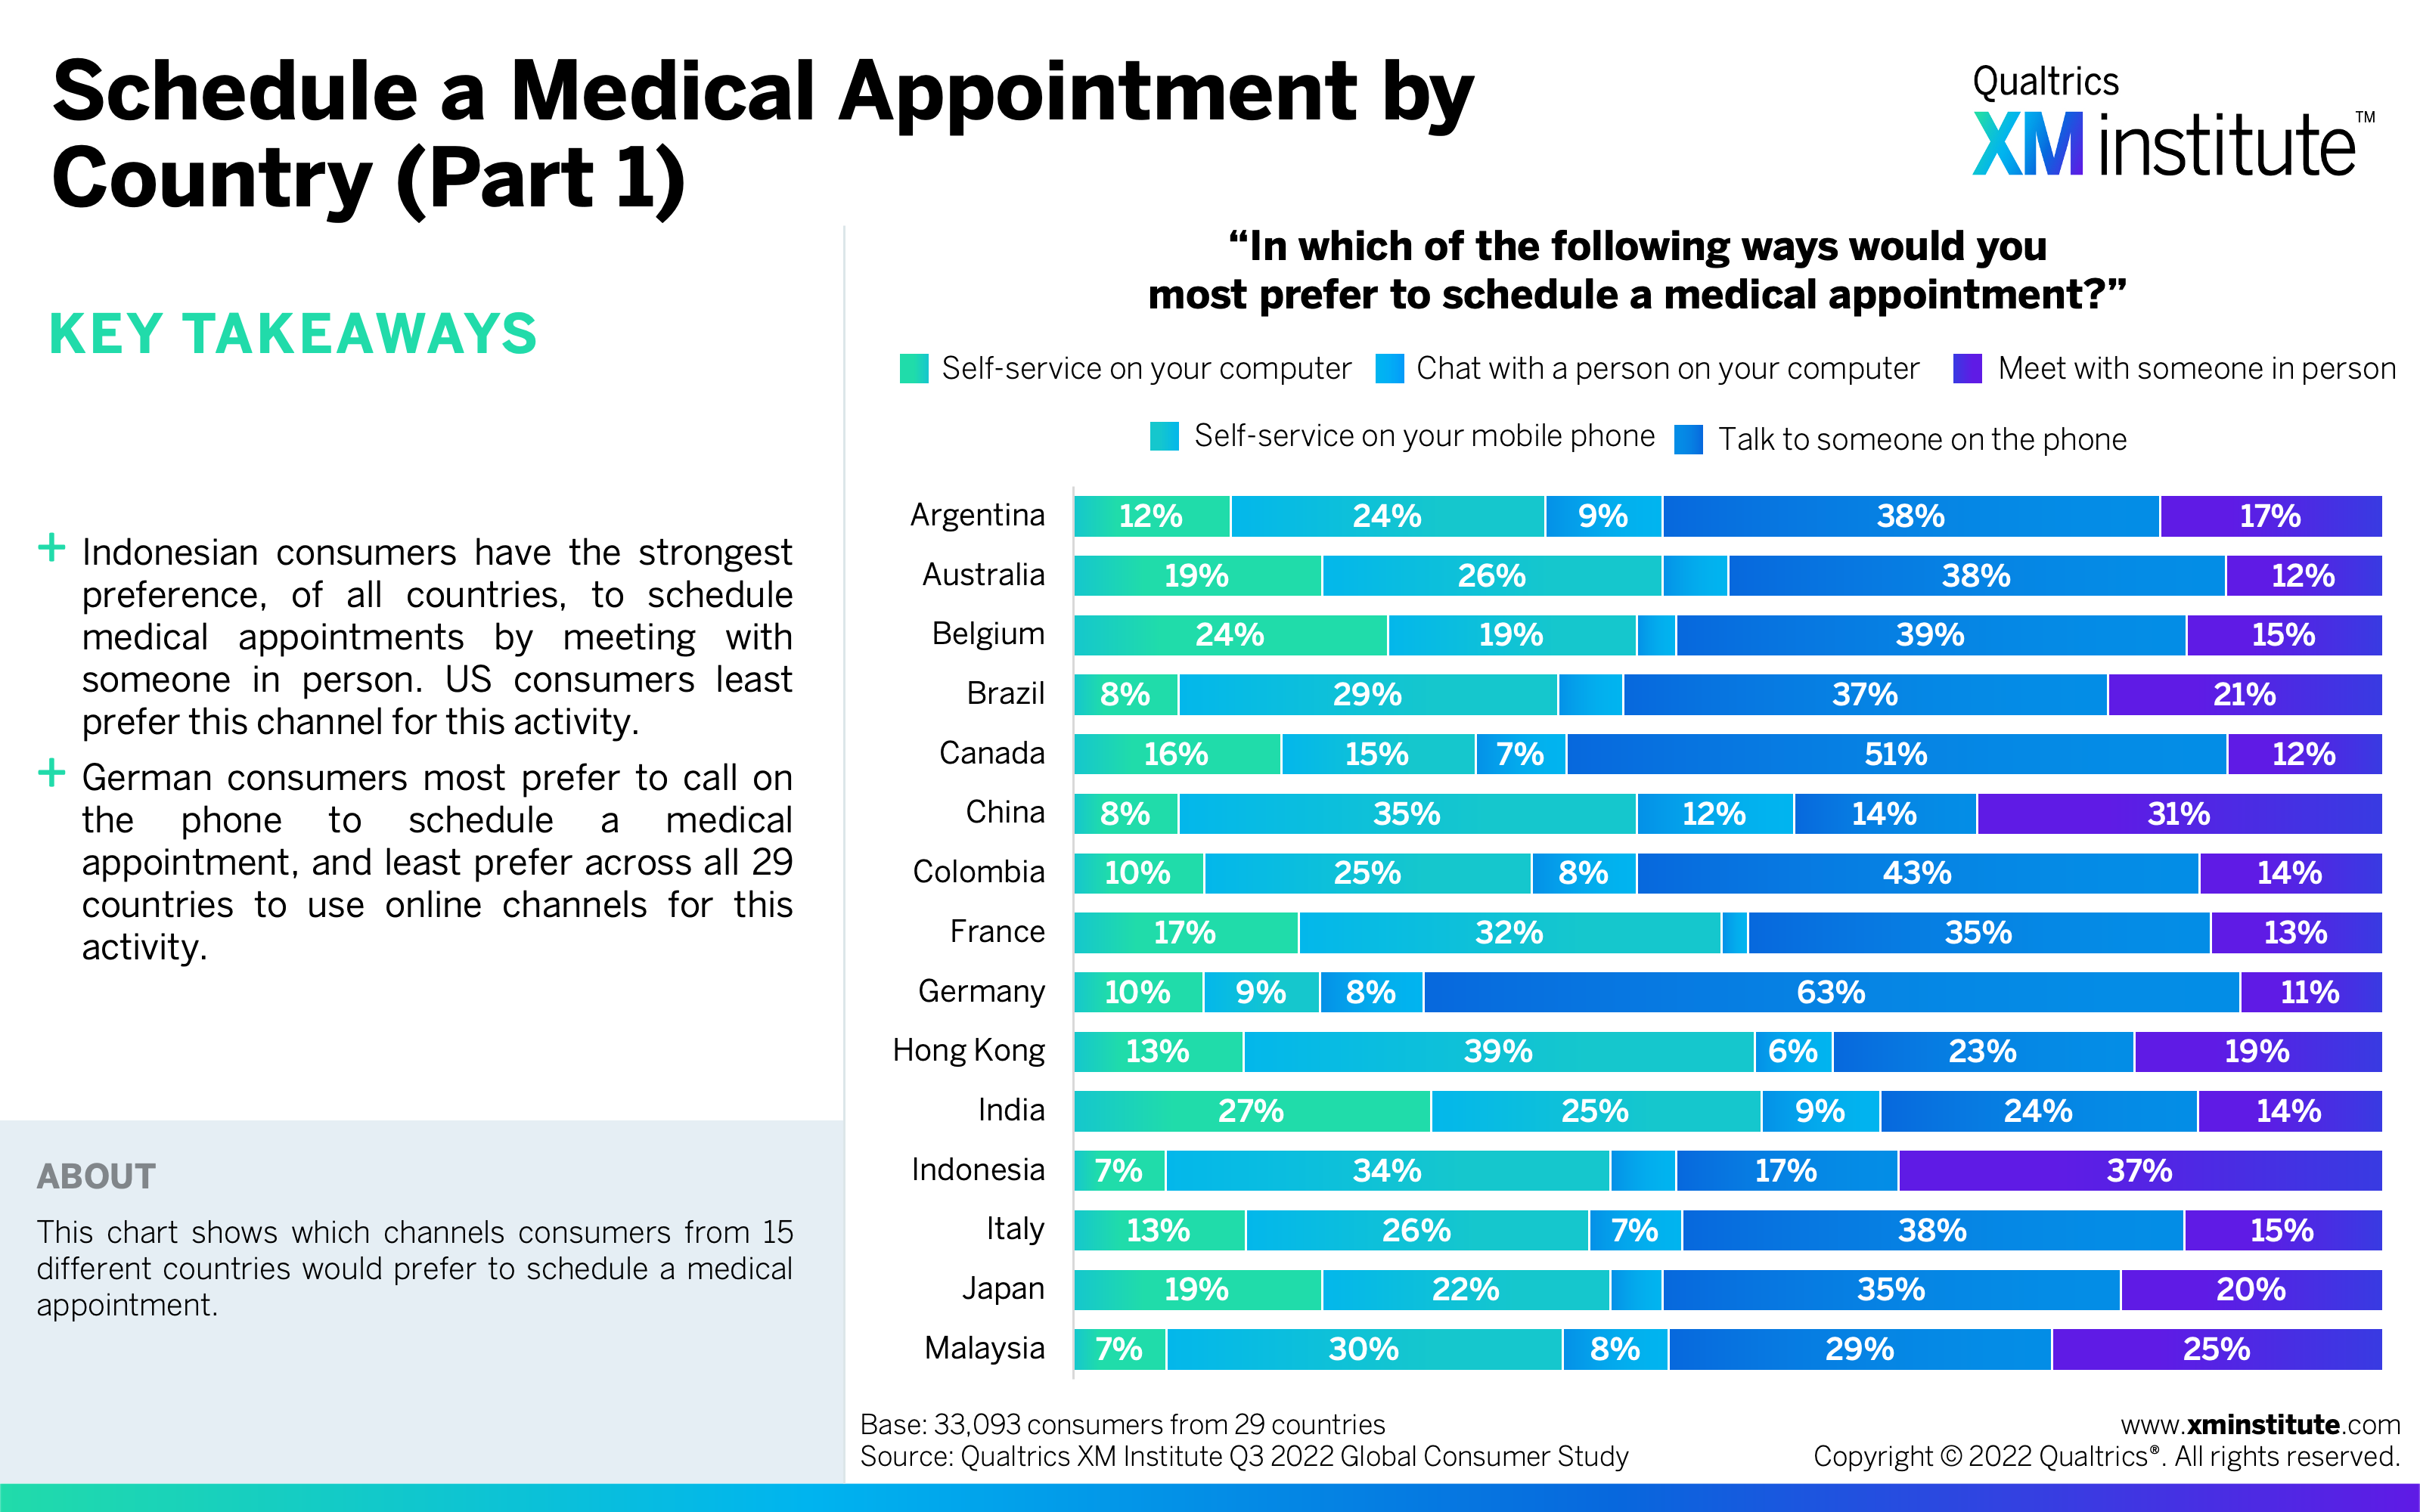
- Schedule a Medical Appointment by Country (Part 1) (see Figure 26)
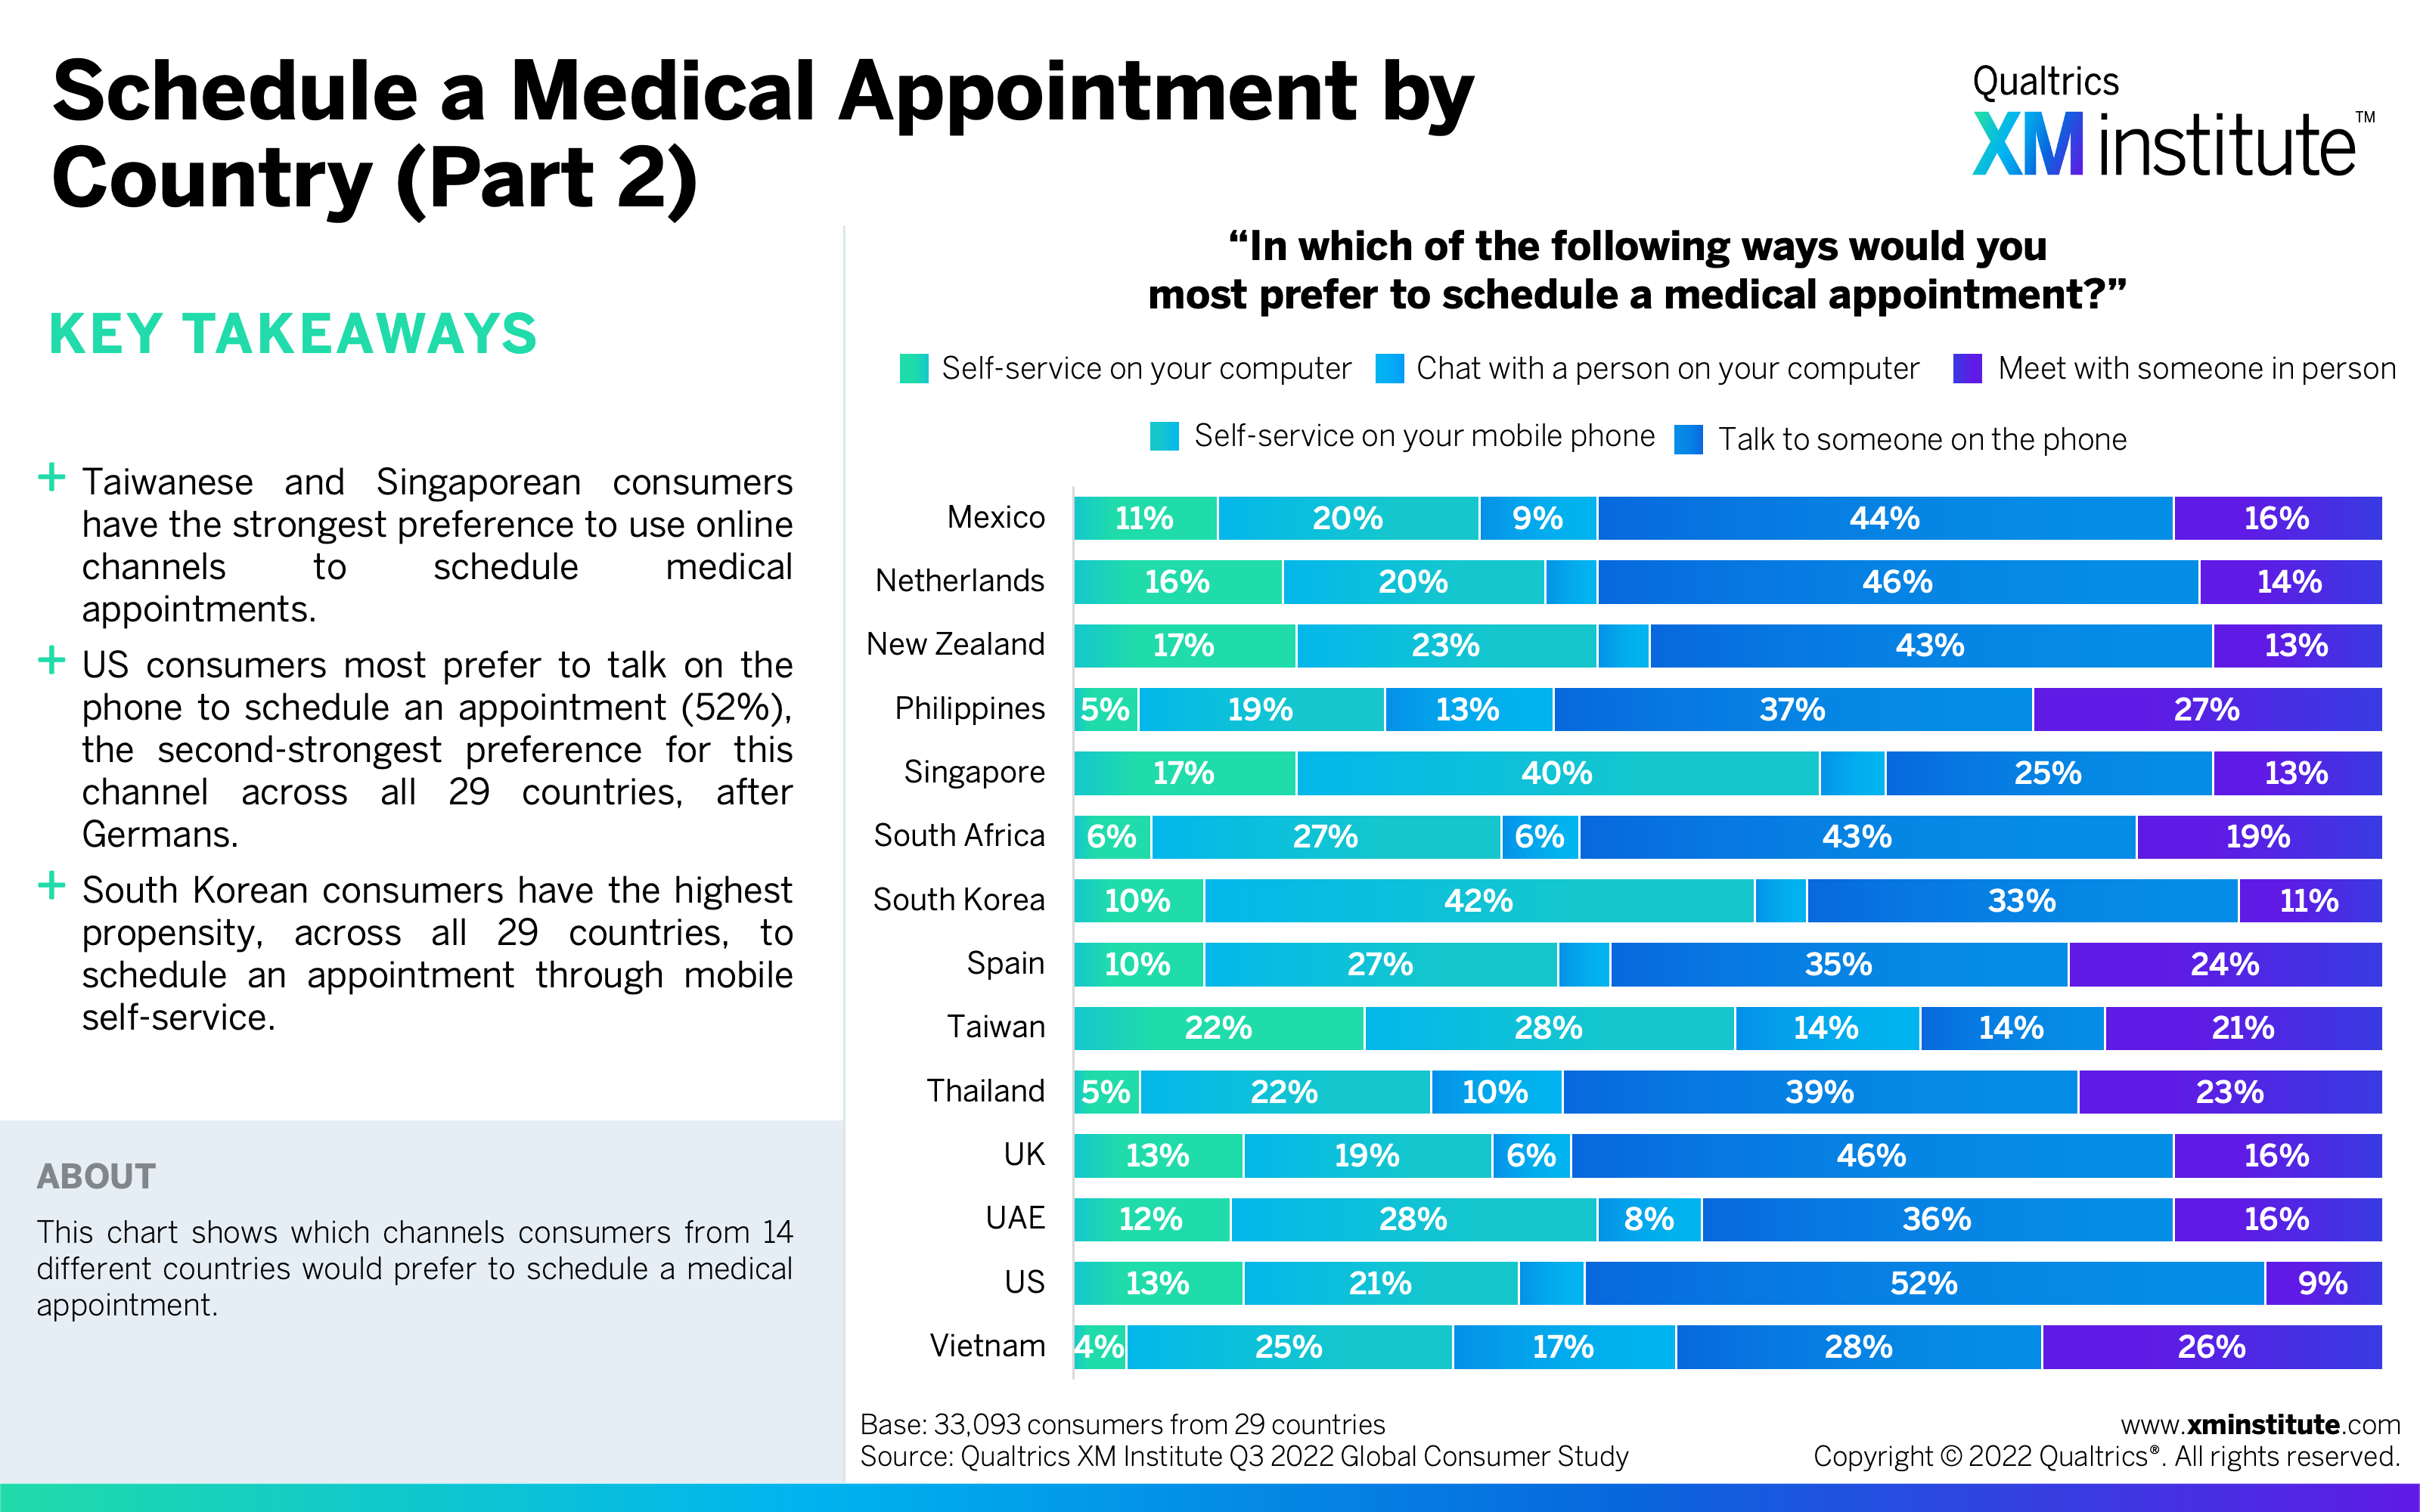
- Schedule a Medical Appointment by Country (Part 2) (see Figure 27)
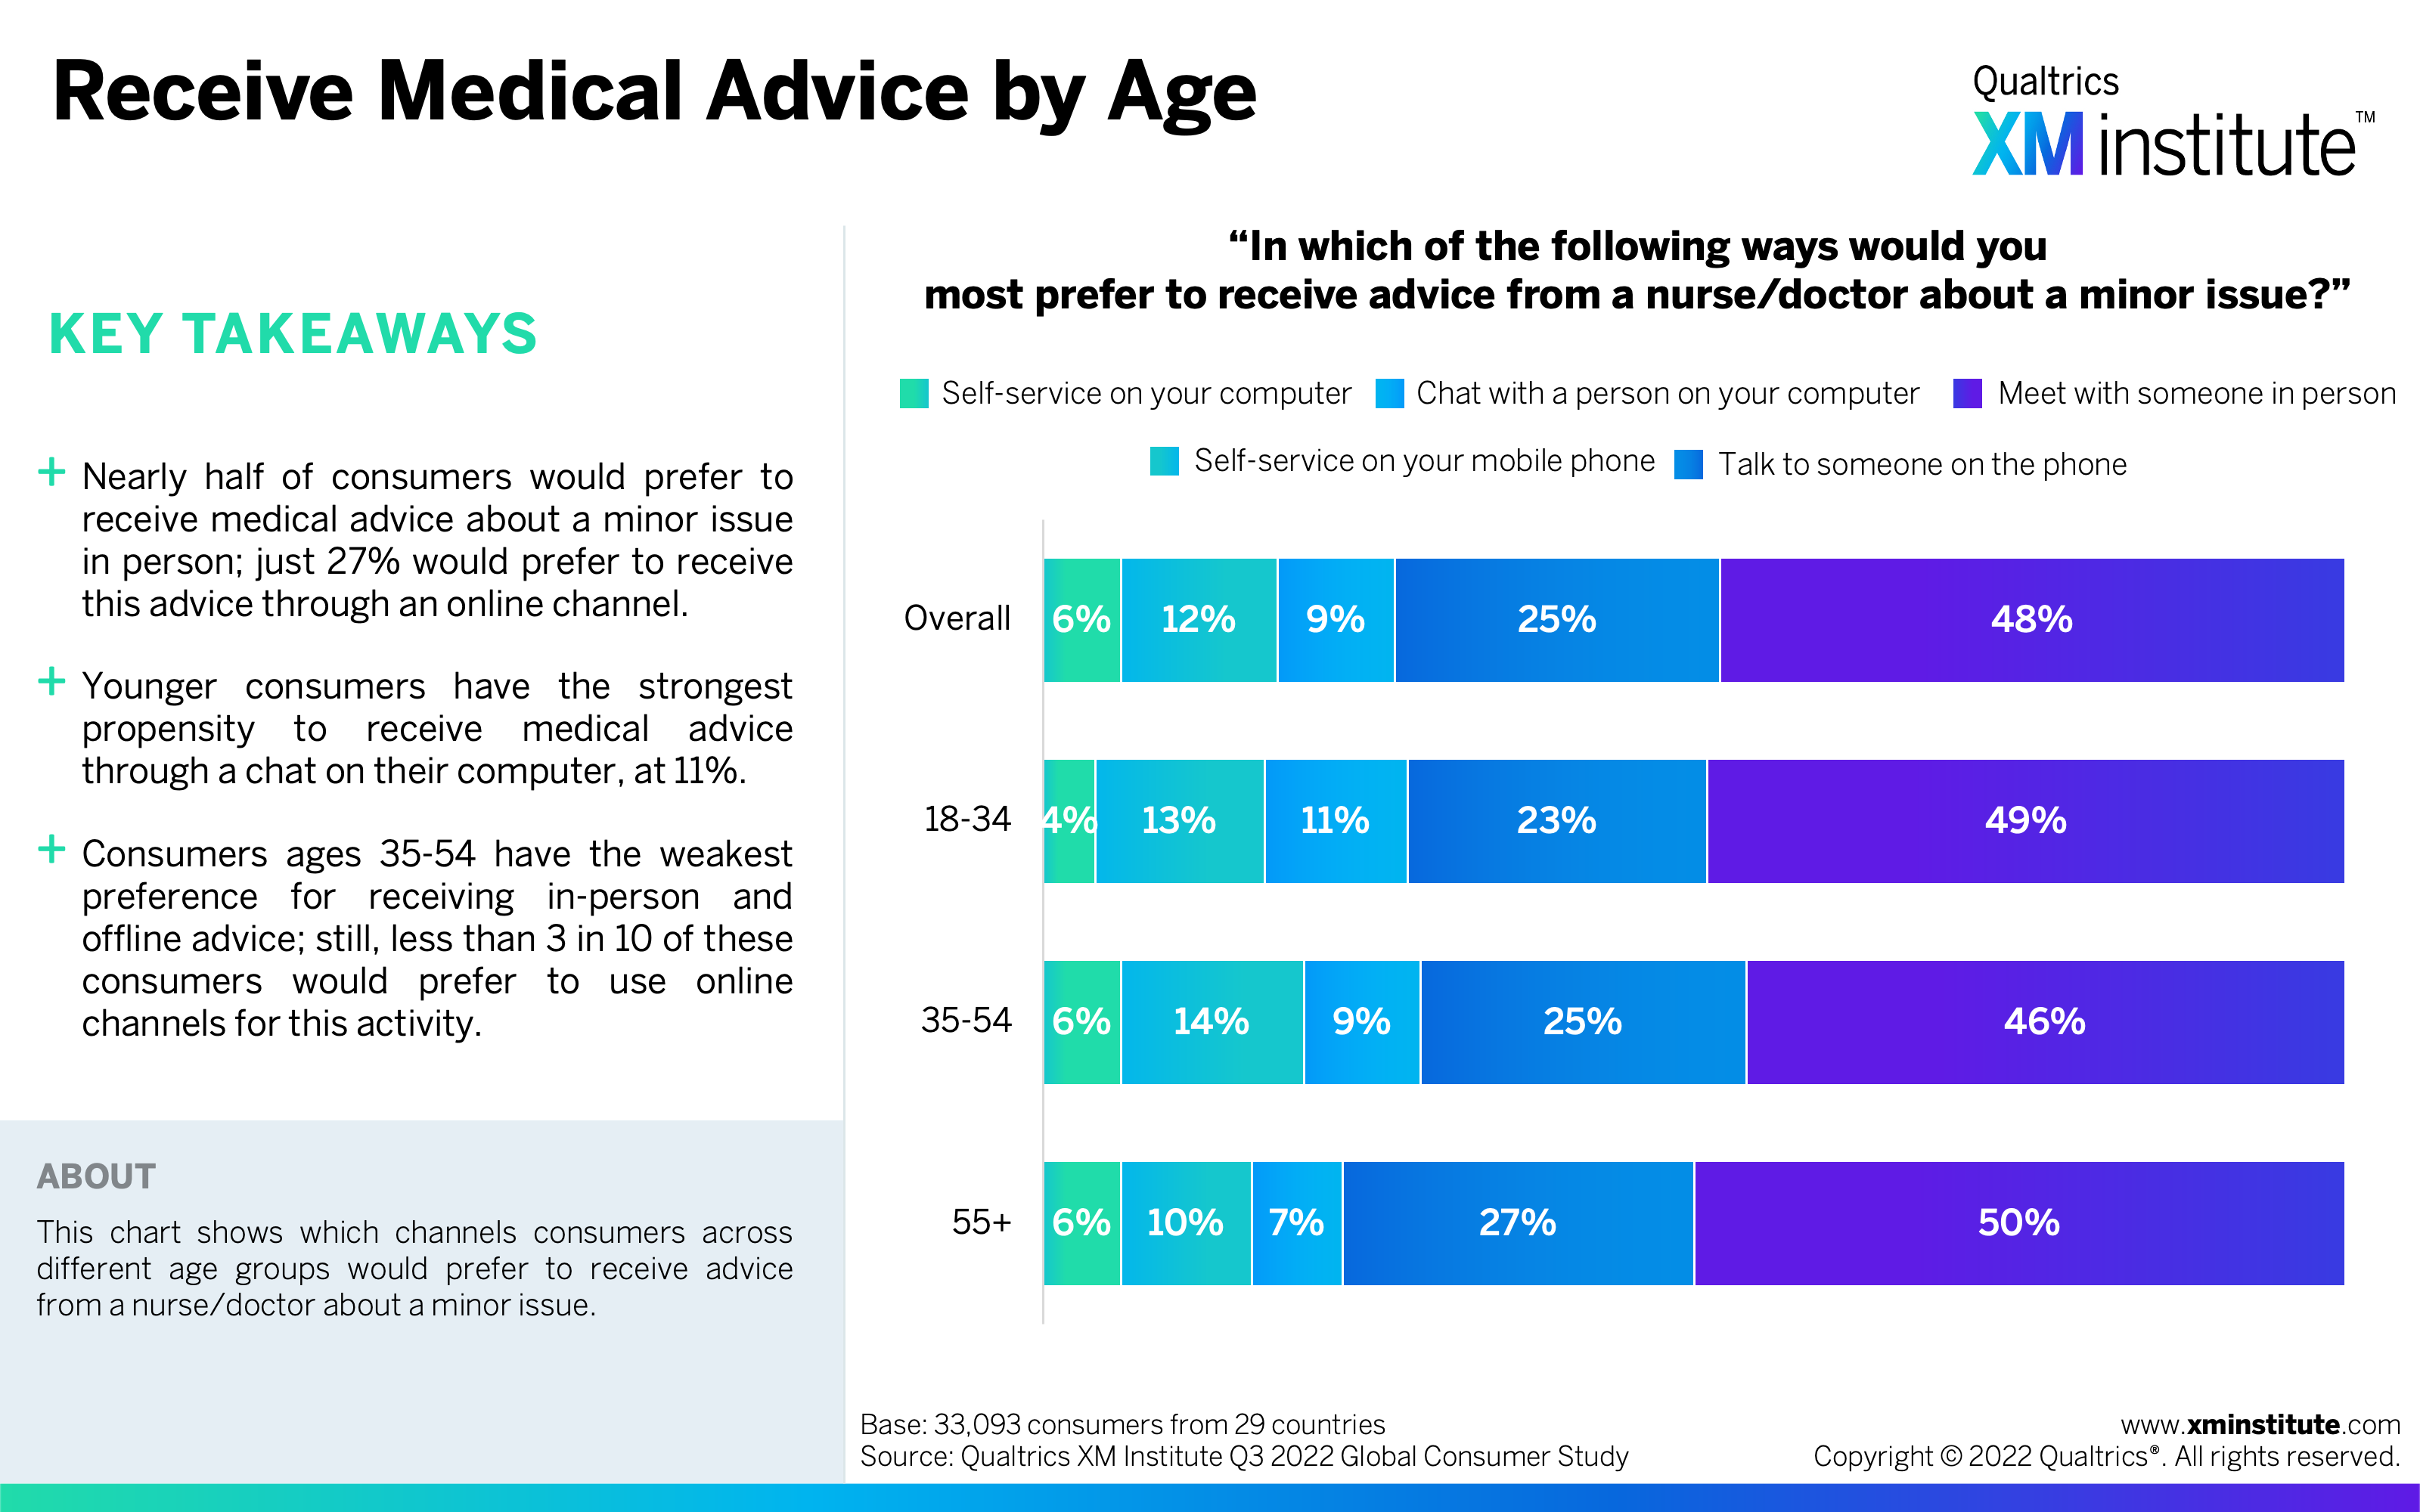
- Receive Medical Advice by Age (see Figure 28)
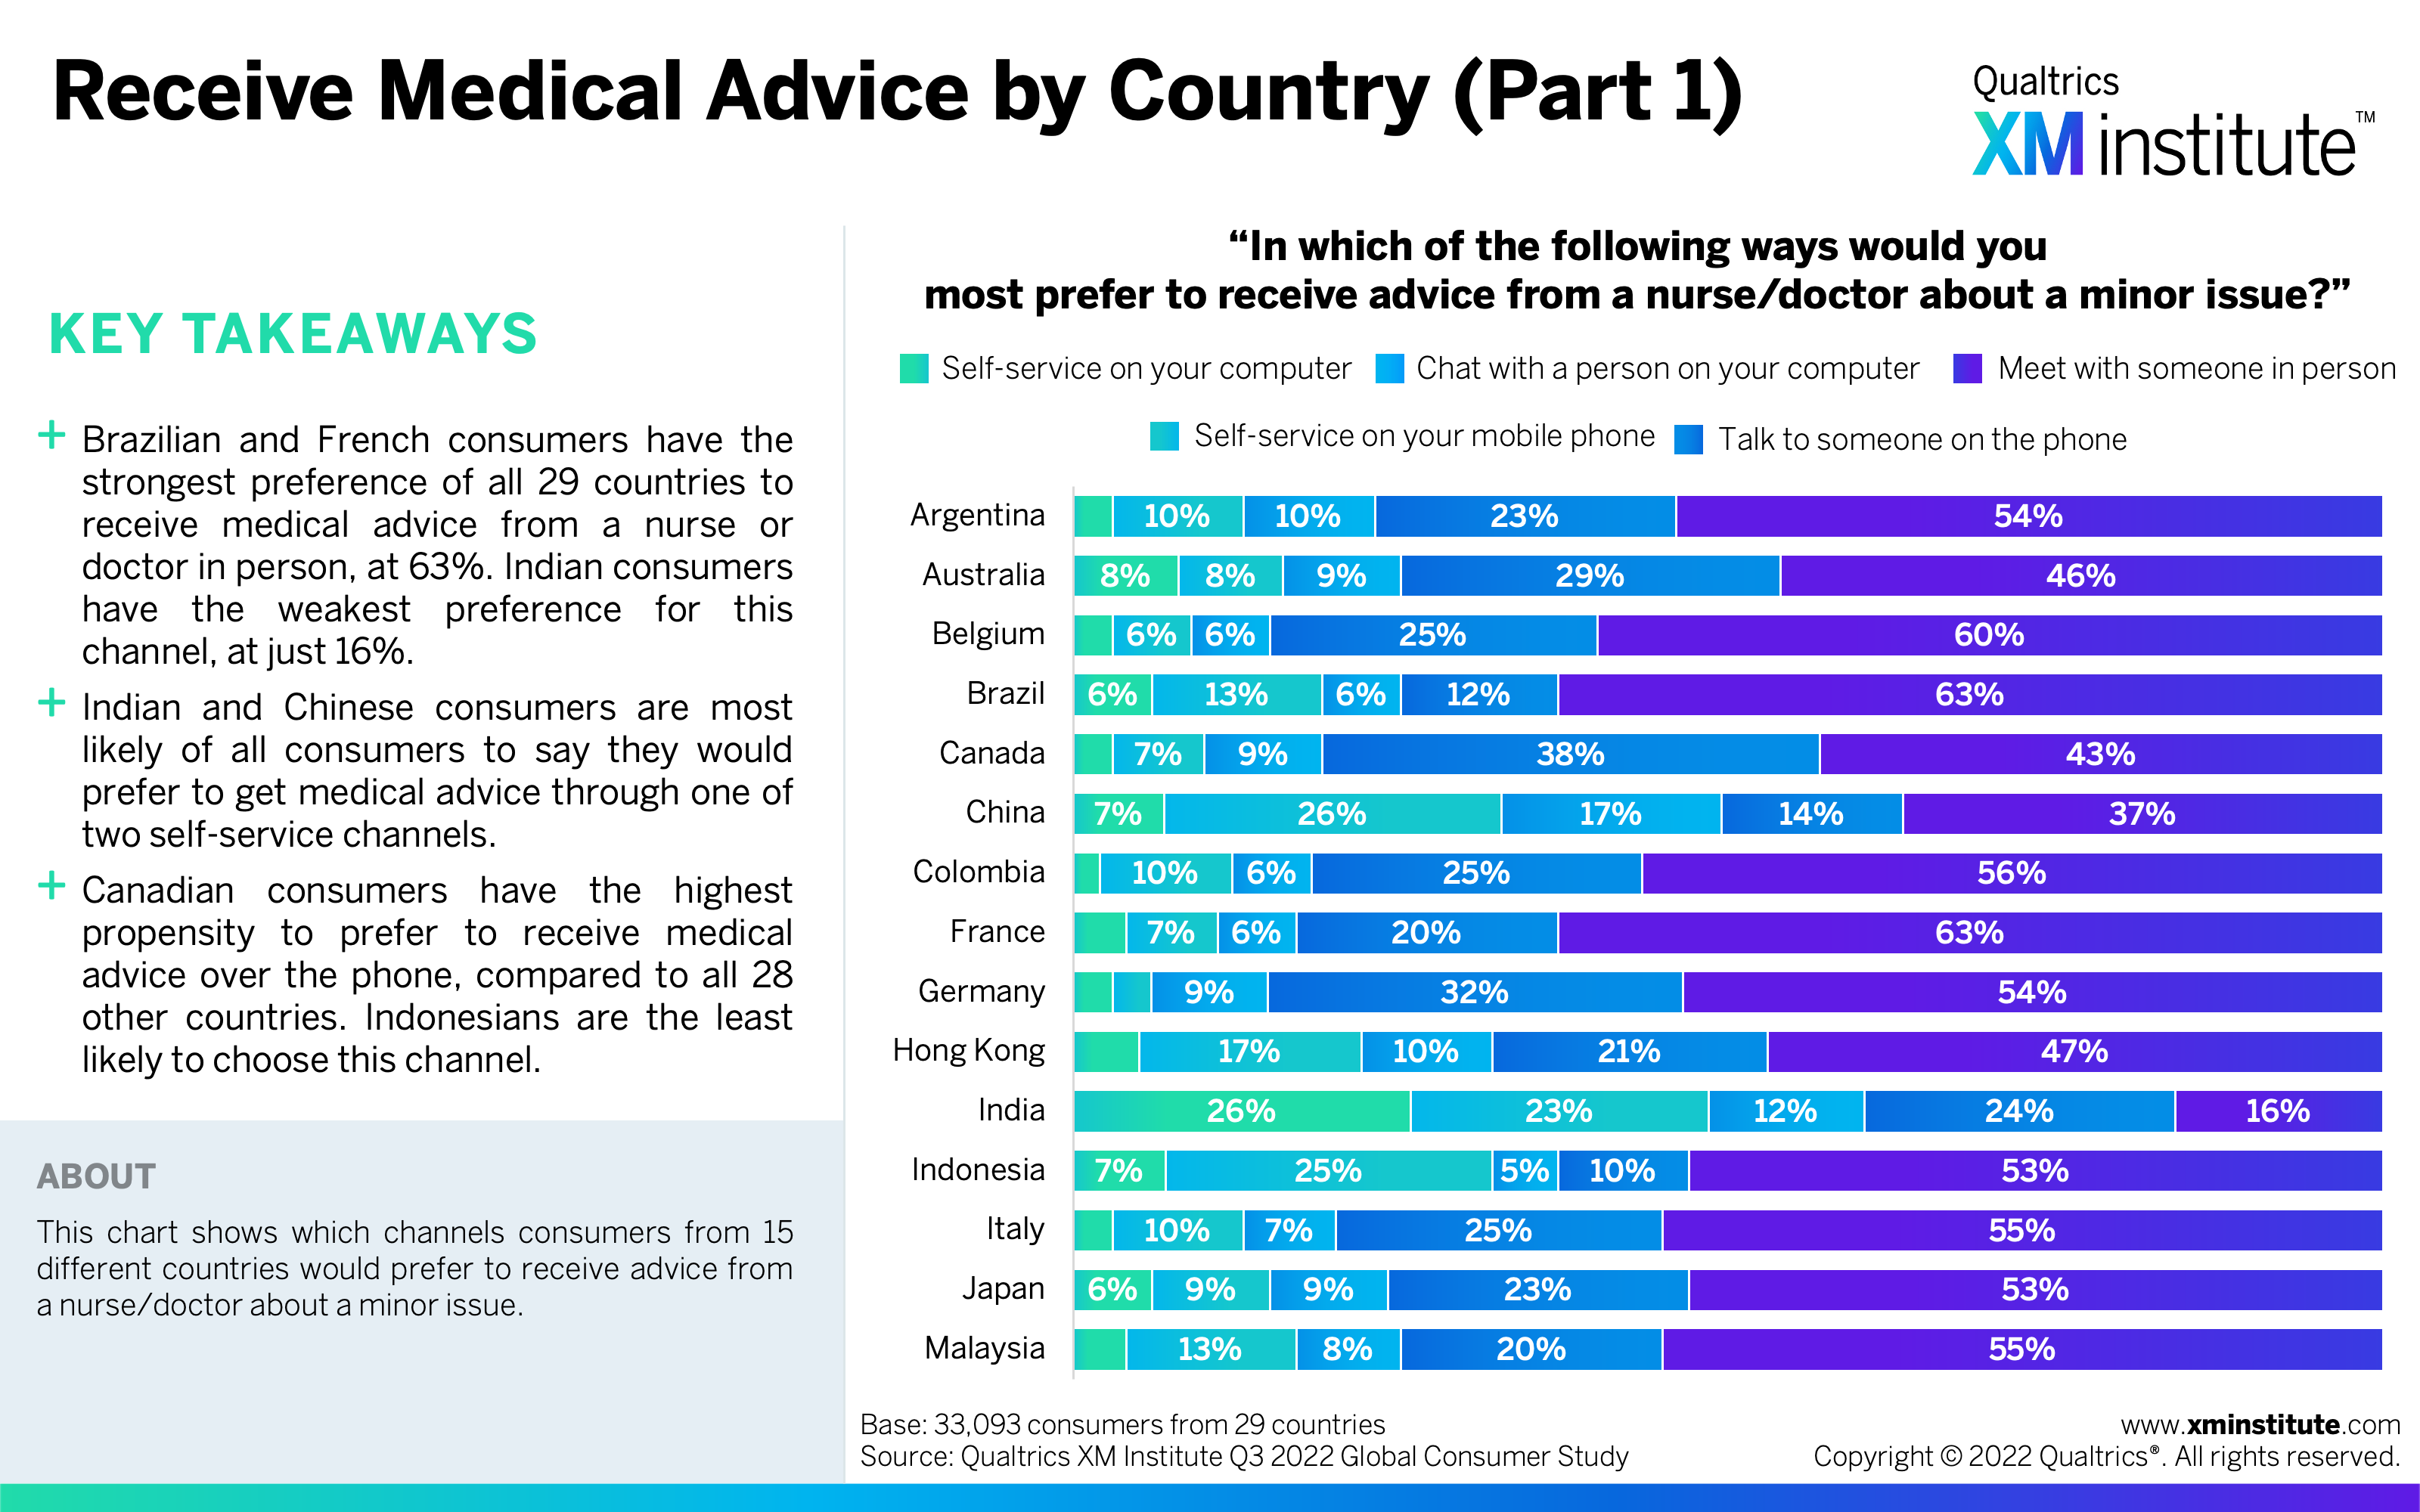
- Receive Medical Advice by Country (Part 1) (see Figure 29)
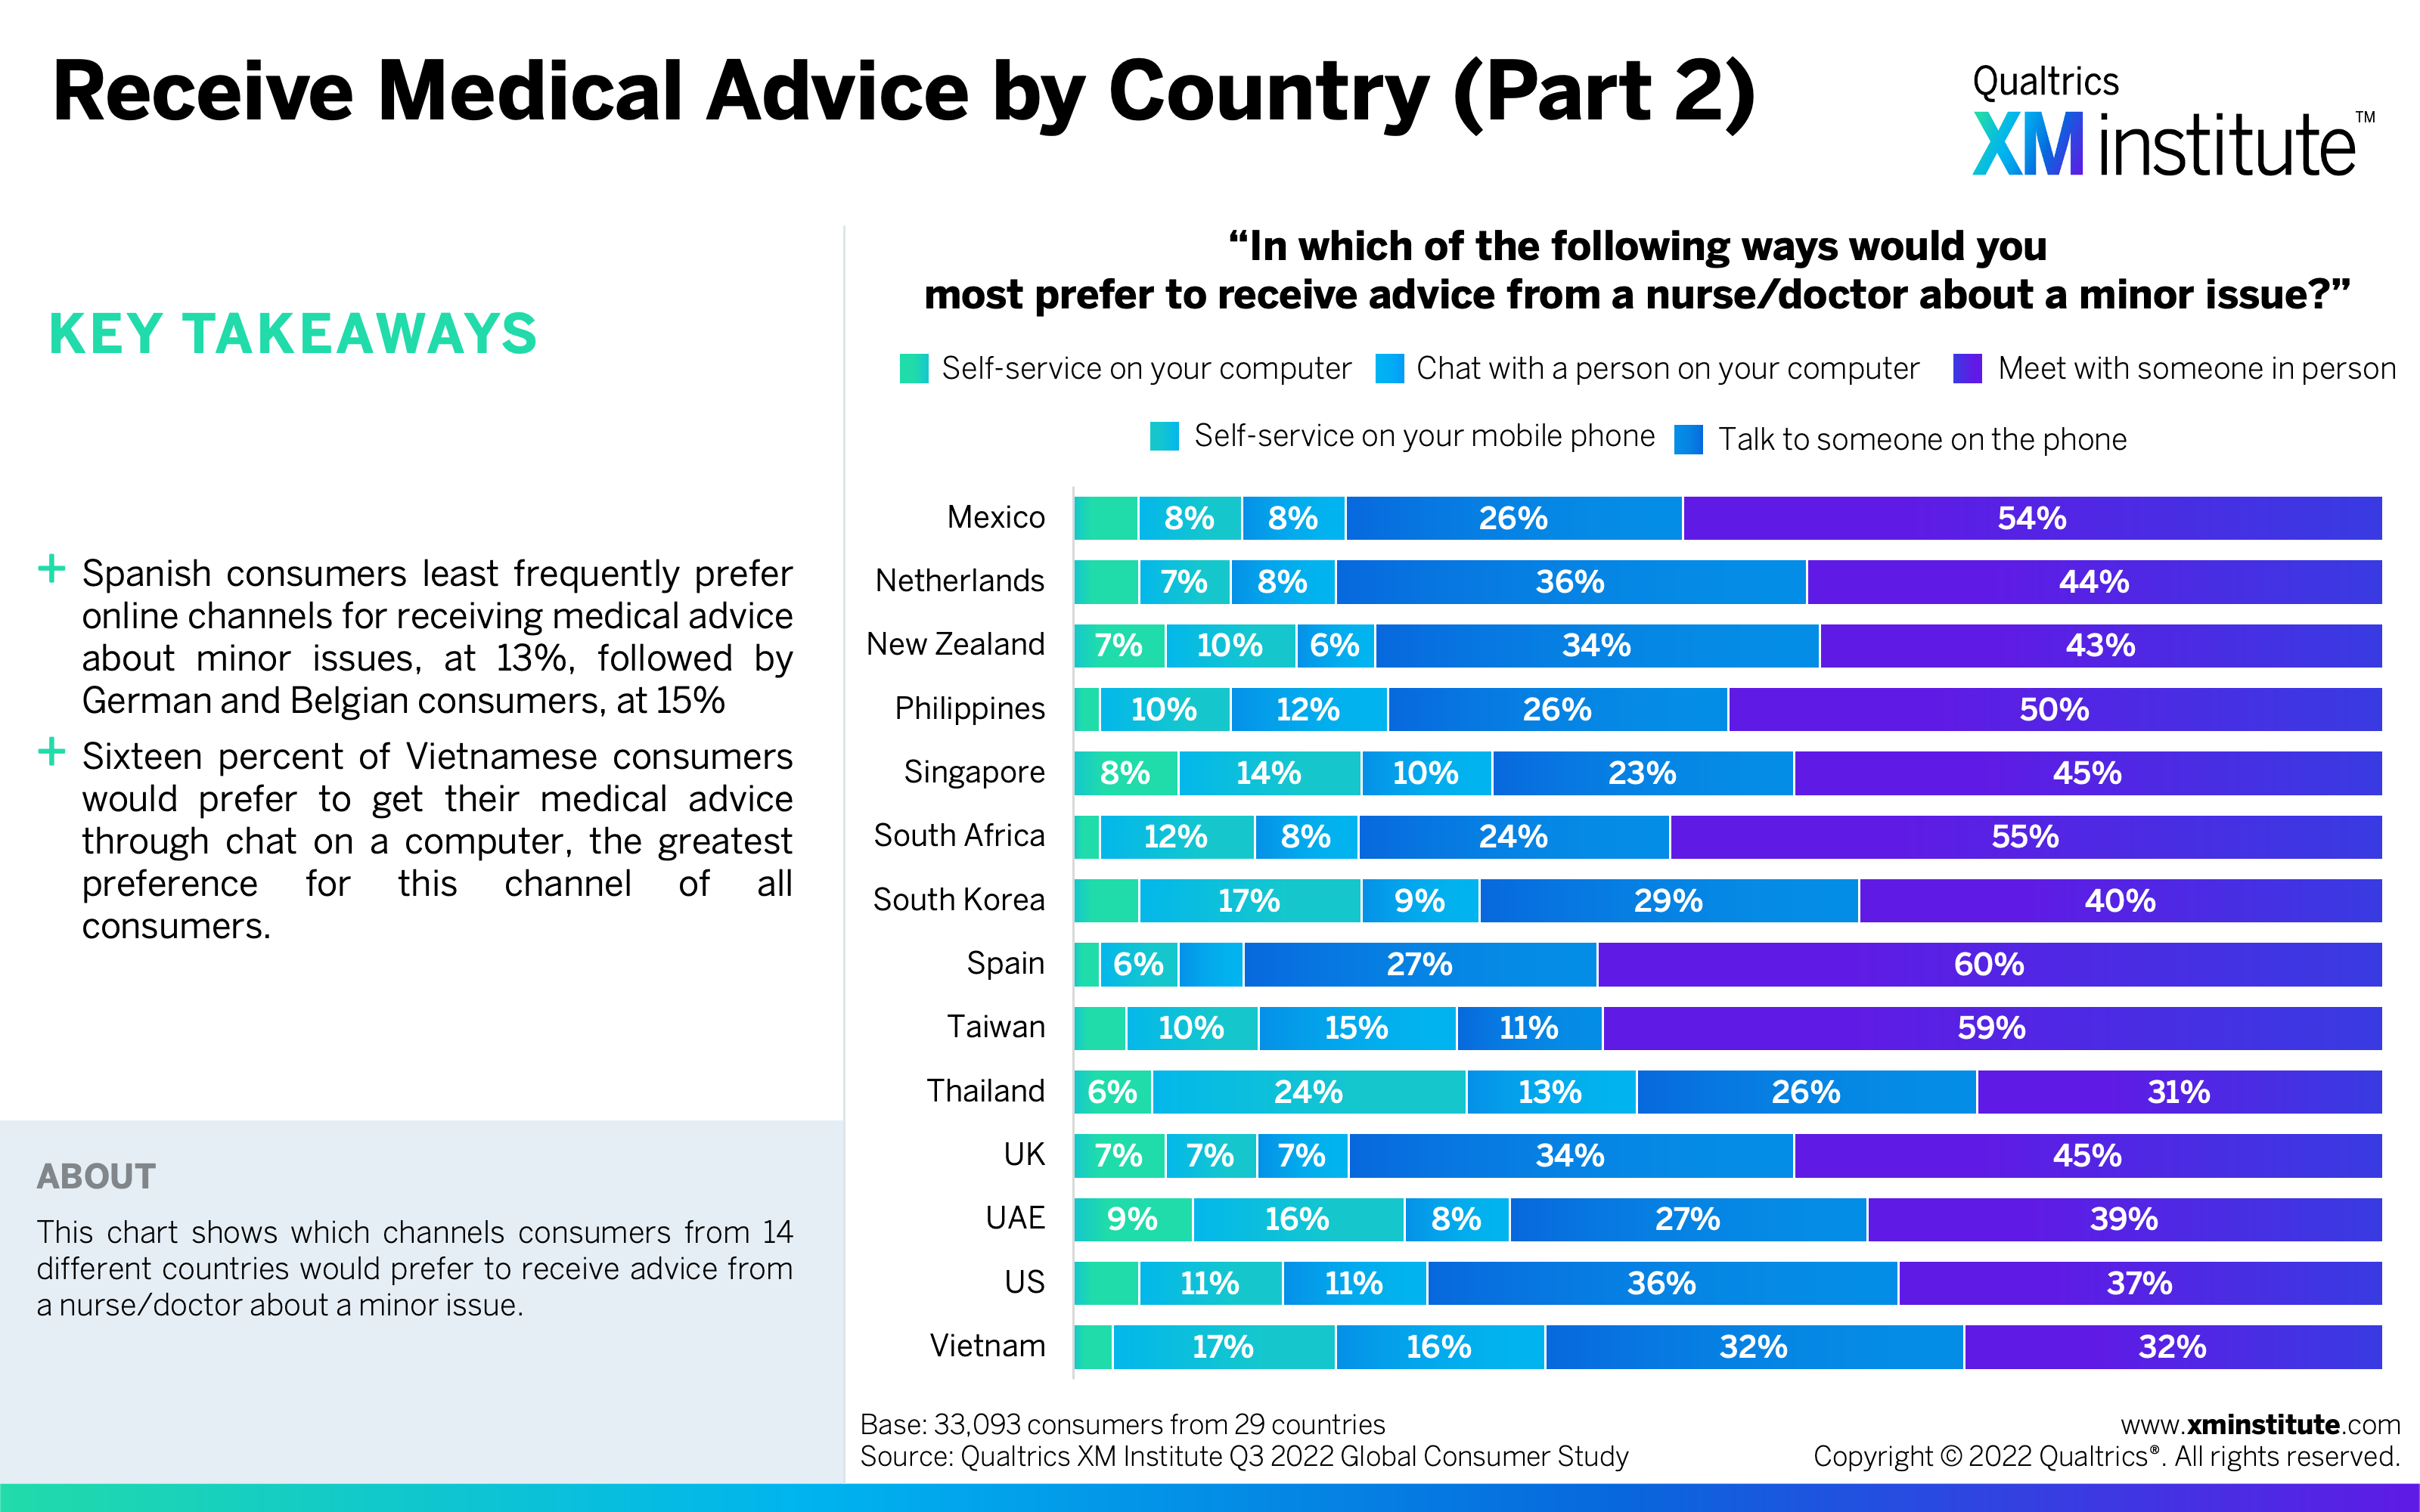
- Receive Medical Advice by Country (Part 2) (see Figure 30)
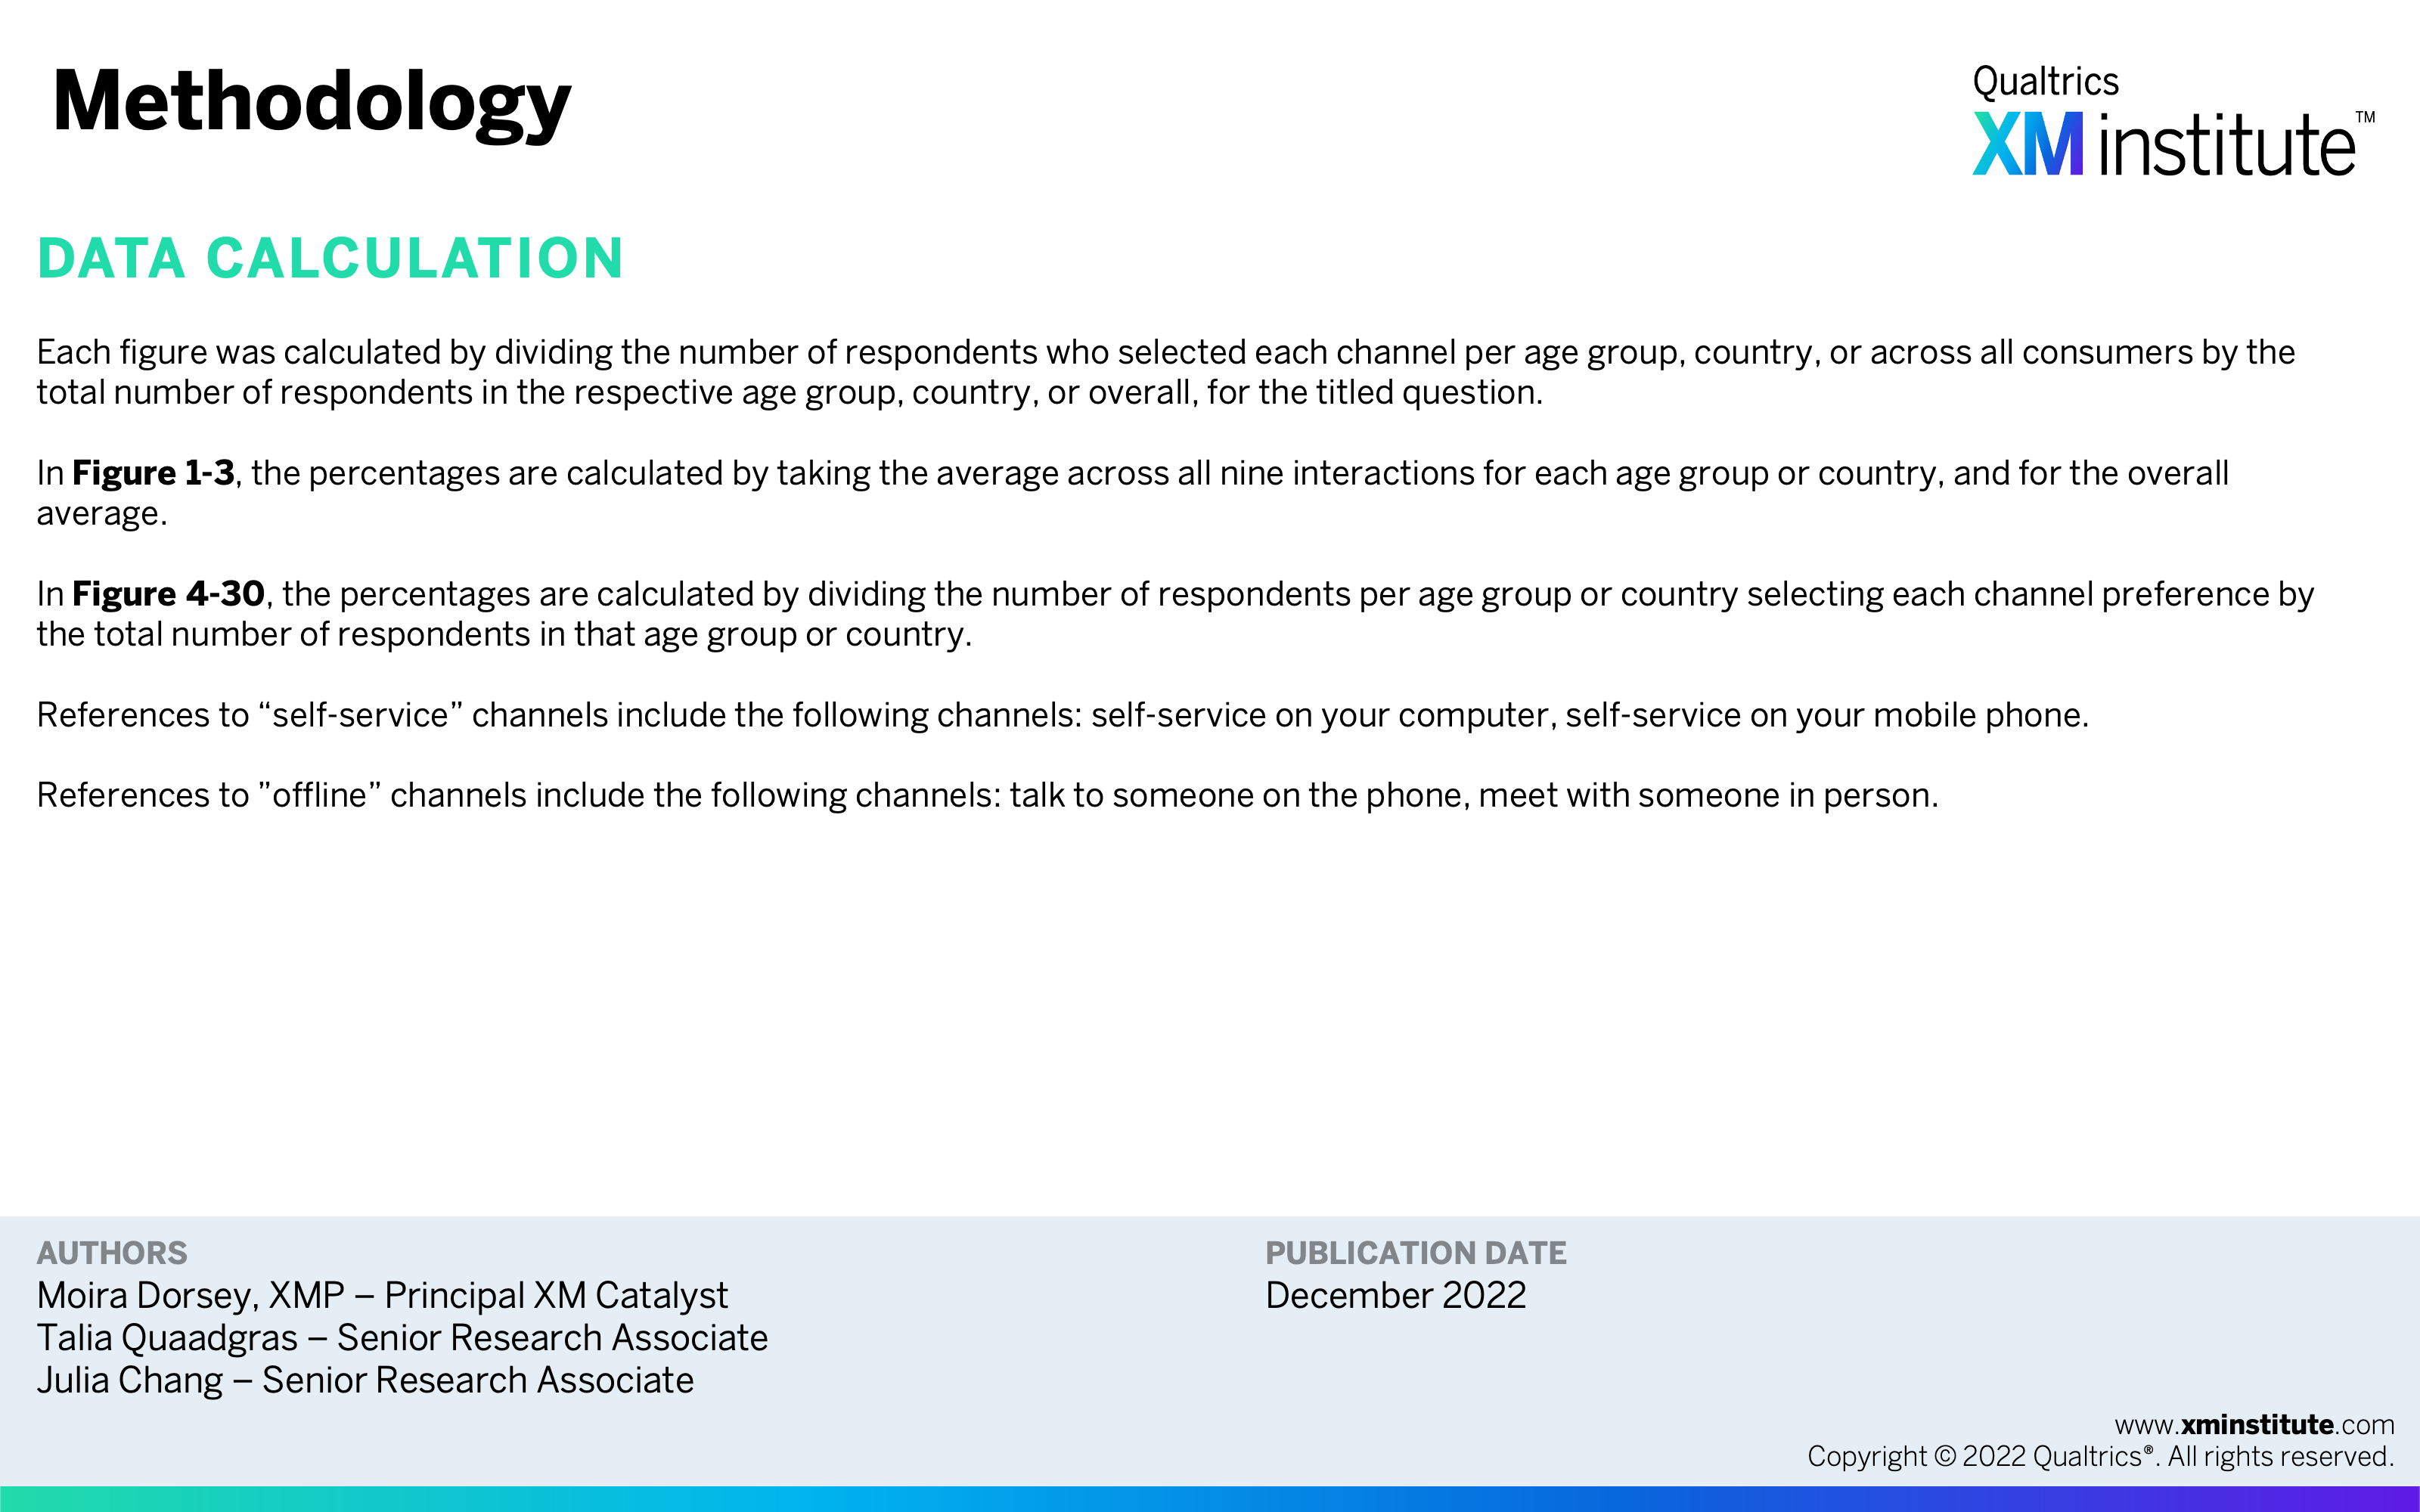
- Methodology (see Figure 31)


