Key Findings
To understand the current state of Experience Management (XM) in HR, Qualtrics XM Institute surveyed 911 senior leaders in HR/People Operations at companies with 1,000 or more employees about their companies’ XM efforts. Highlights from the research include:
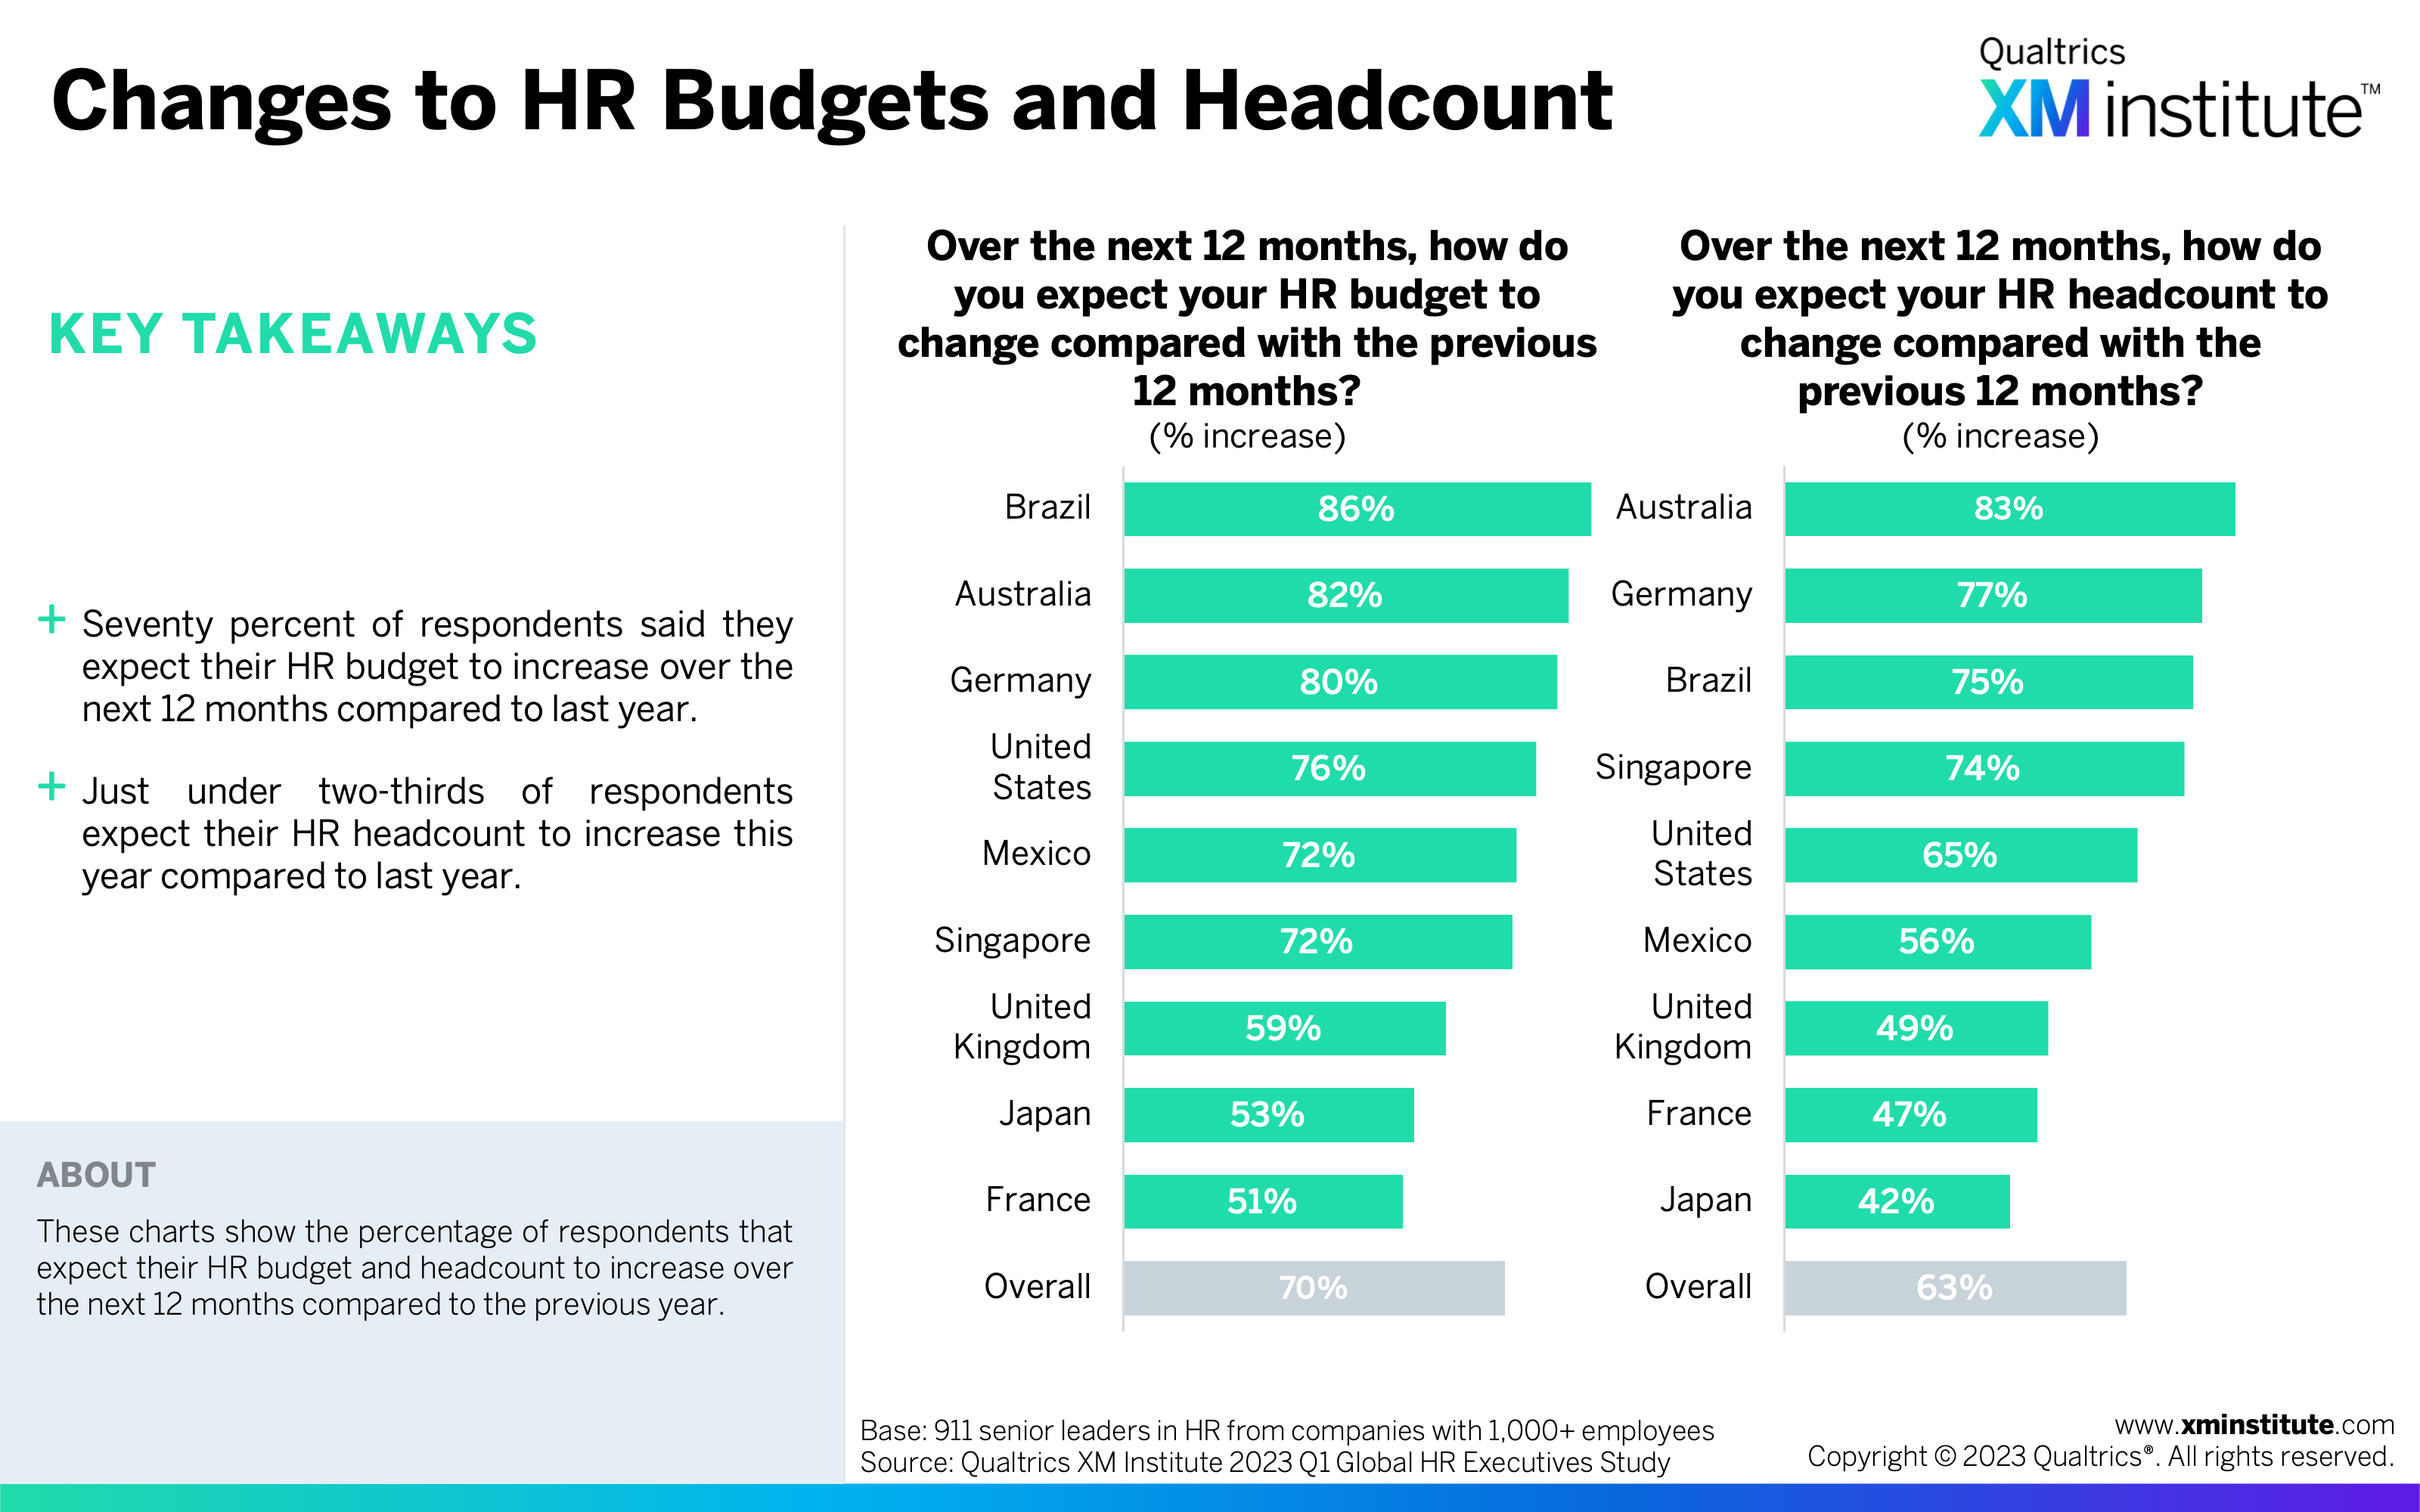
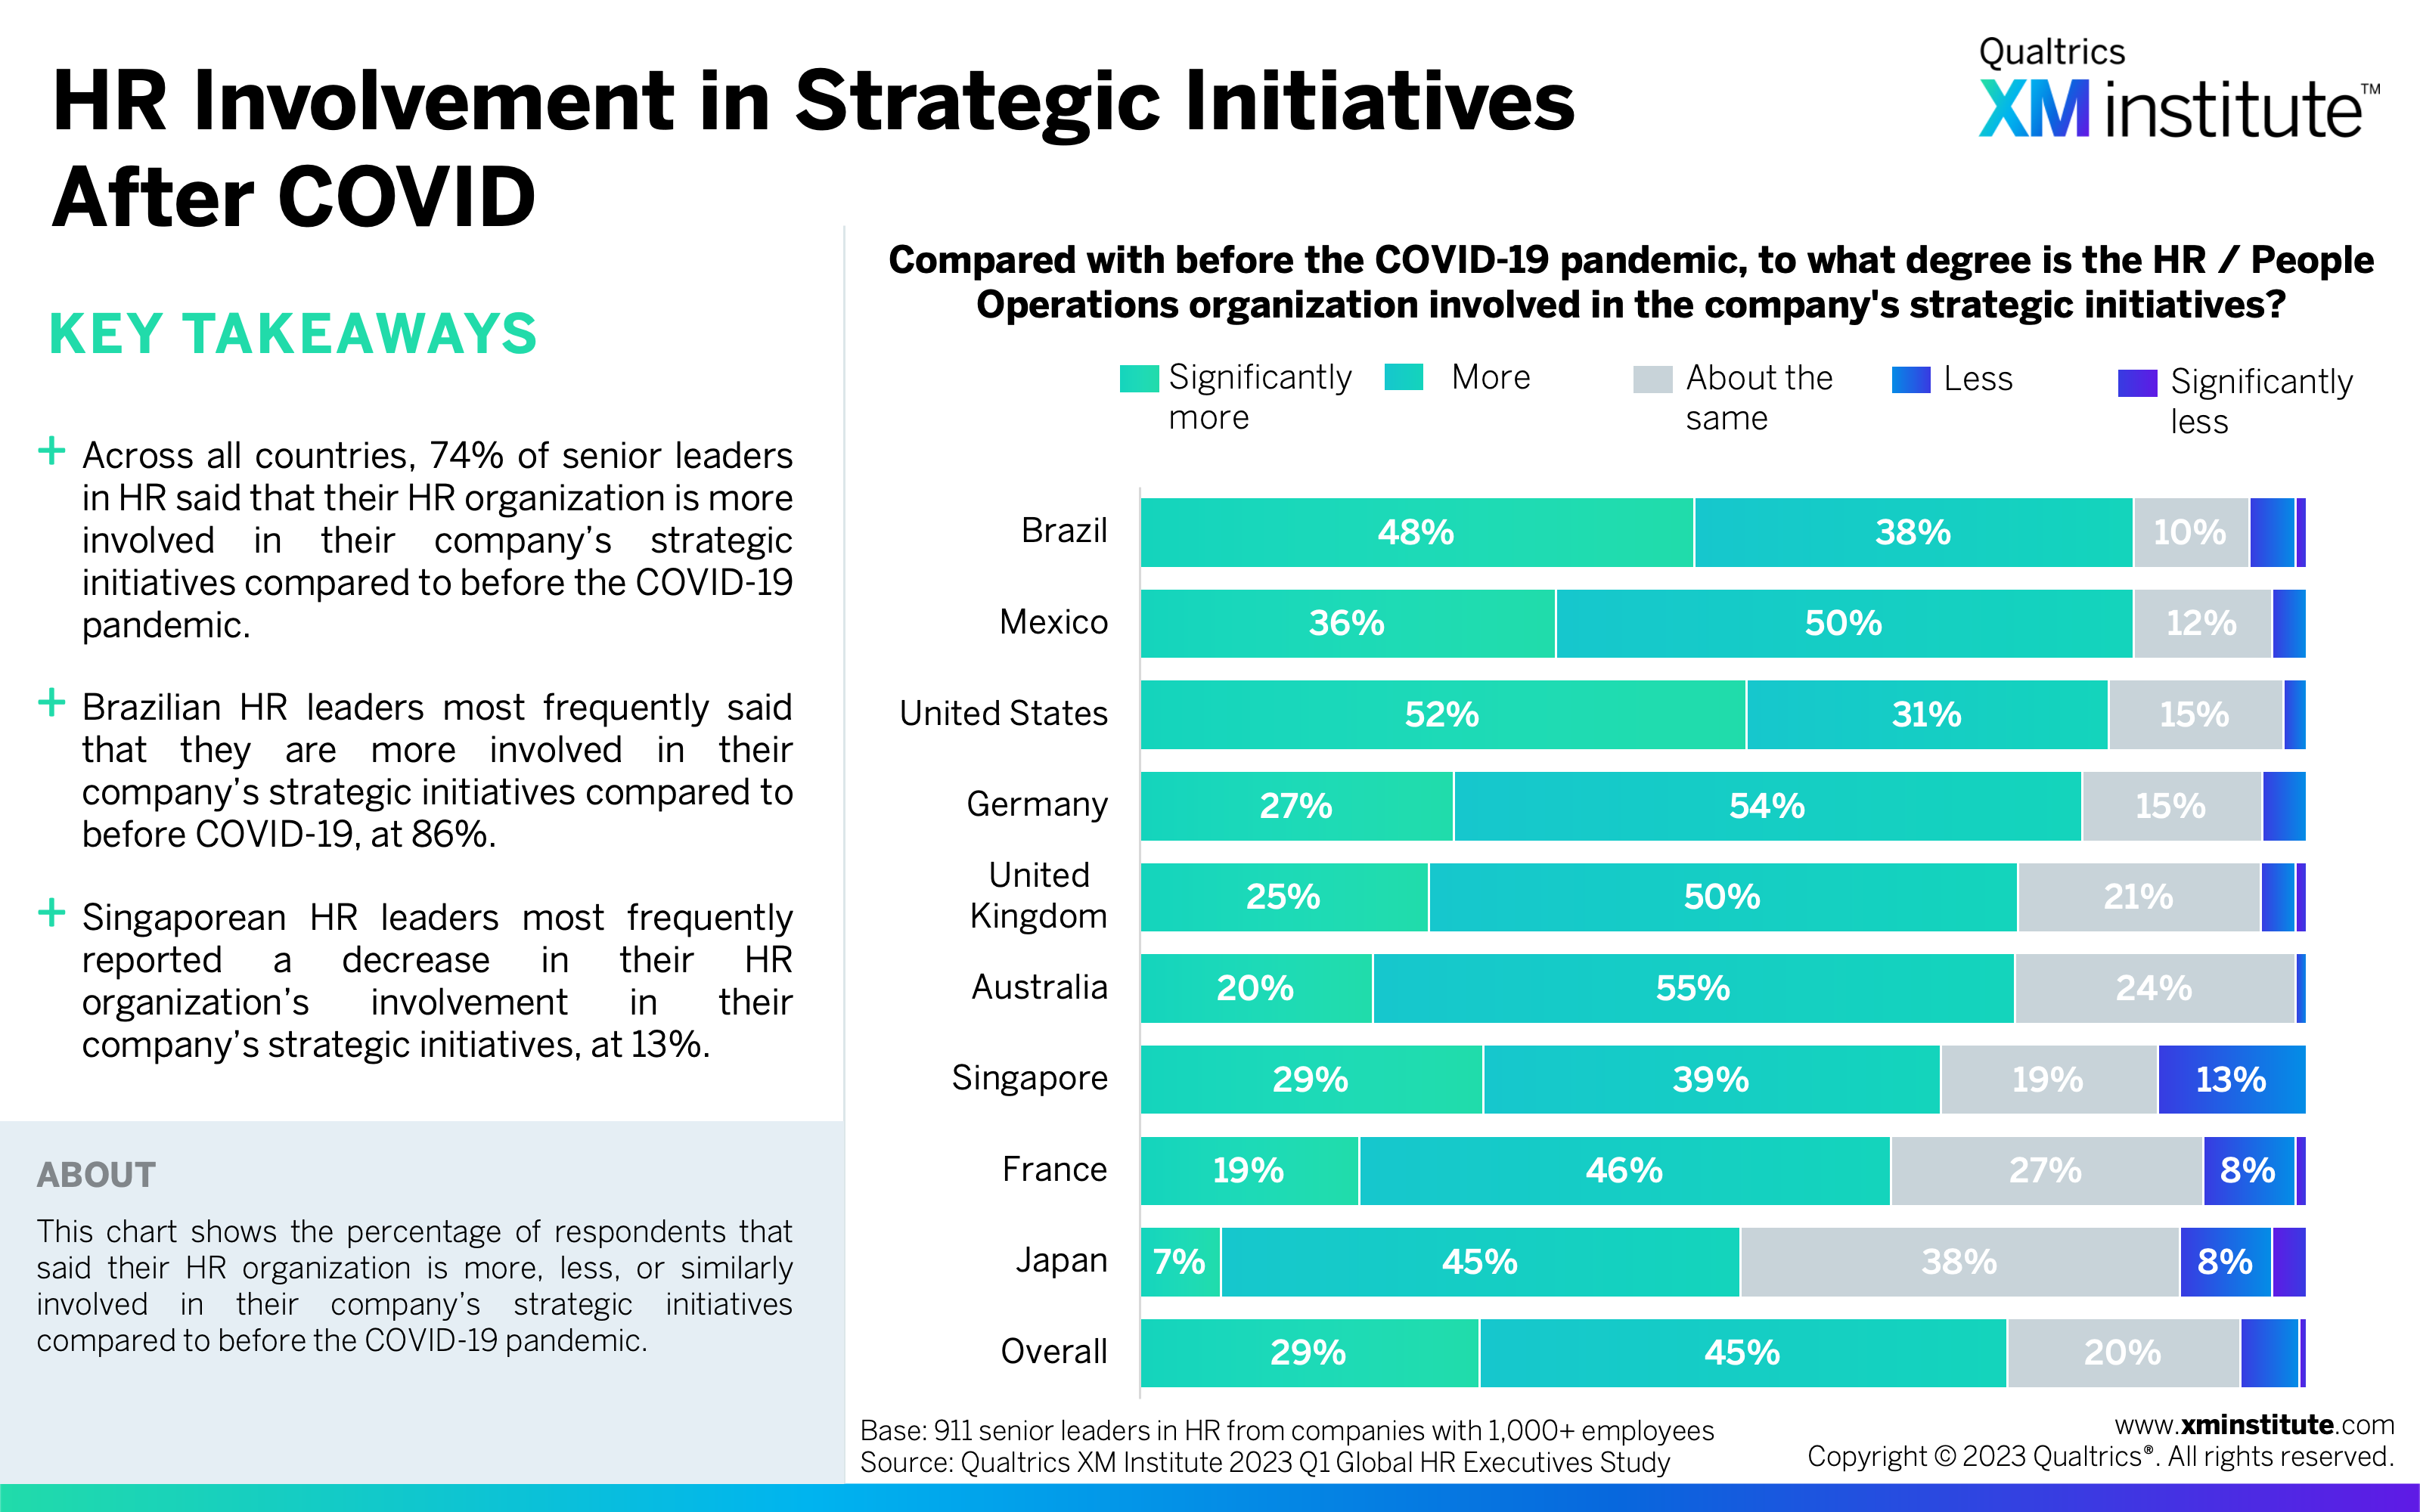
- HR is growing in importance around the world. Not only are HR organizations growing, with 70% of HR leaders reporting budget increases and 63% reporting headcount increases for the year, but they are also growing their strategic importance. Seventy-four percent of HR leaders said HR is more involved in their company’s strategic initiatives compared to before the COVID-19 pandemic.
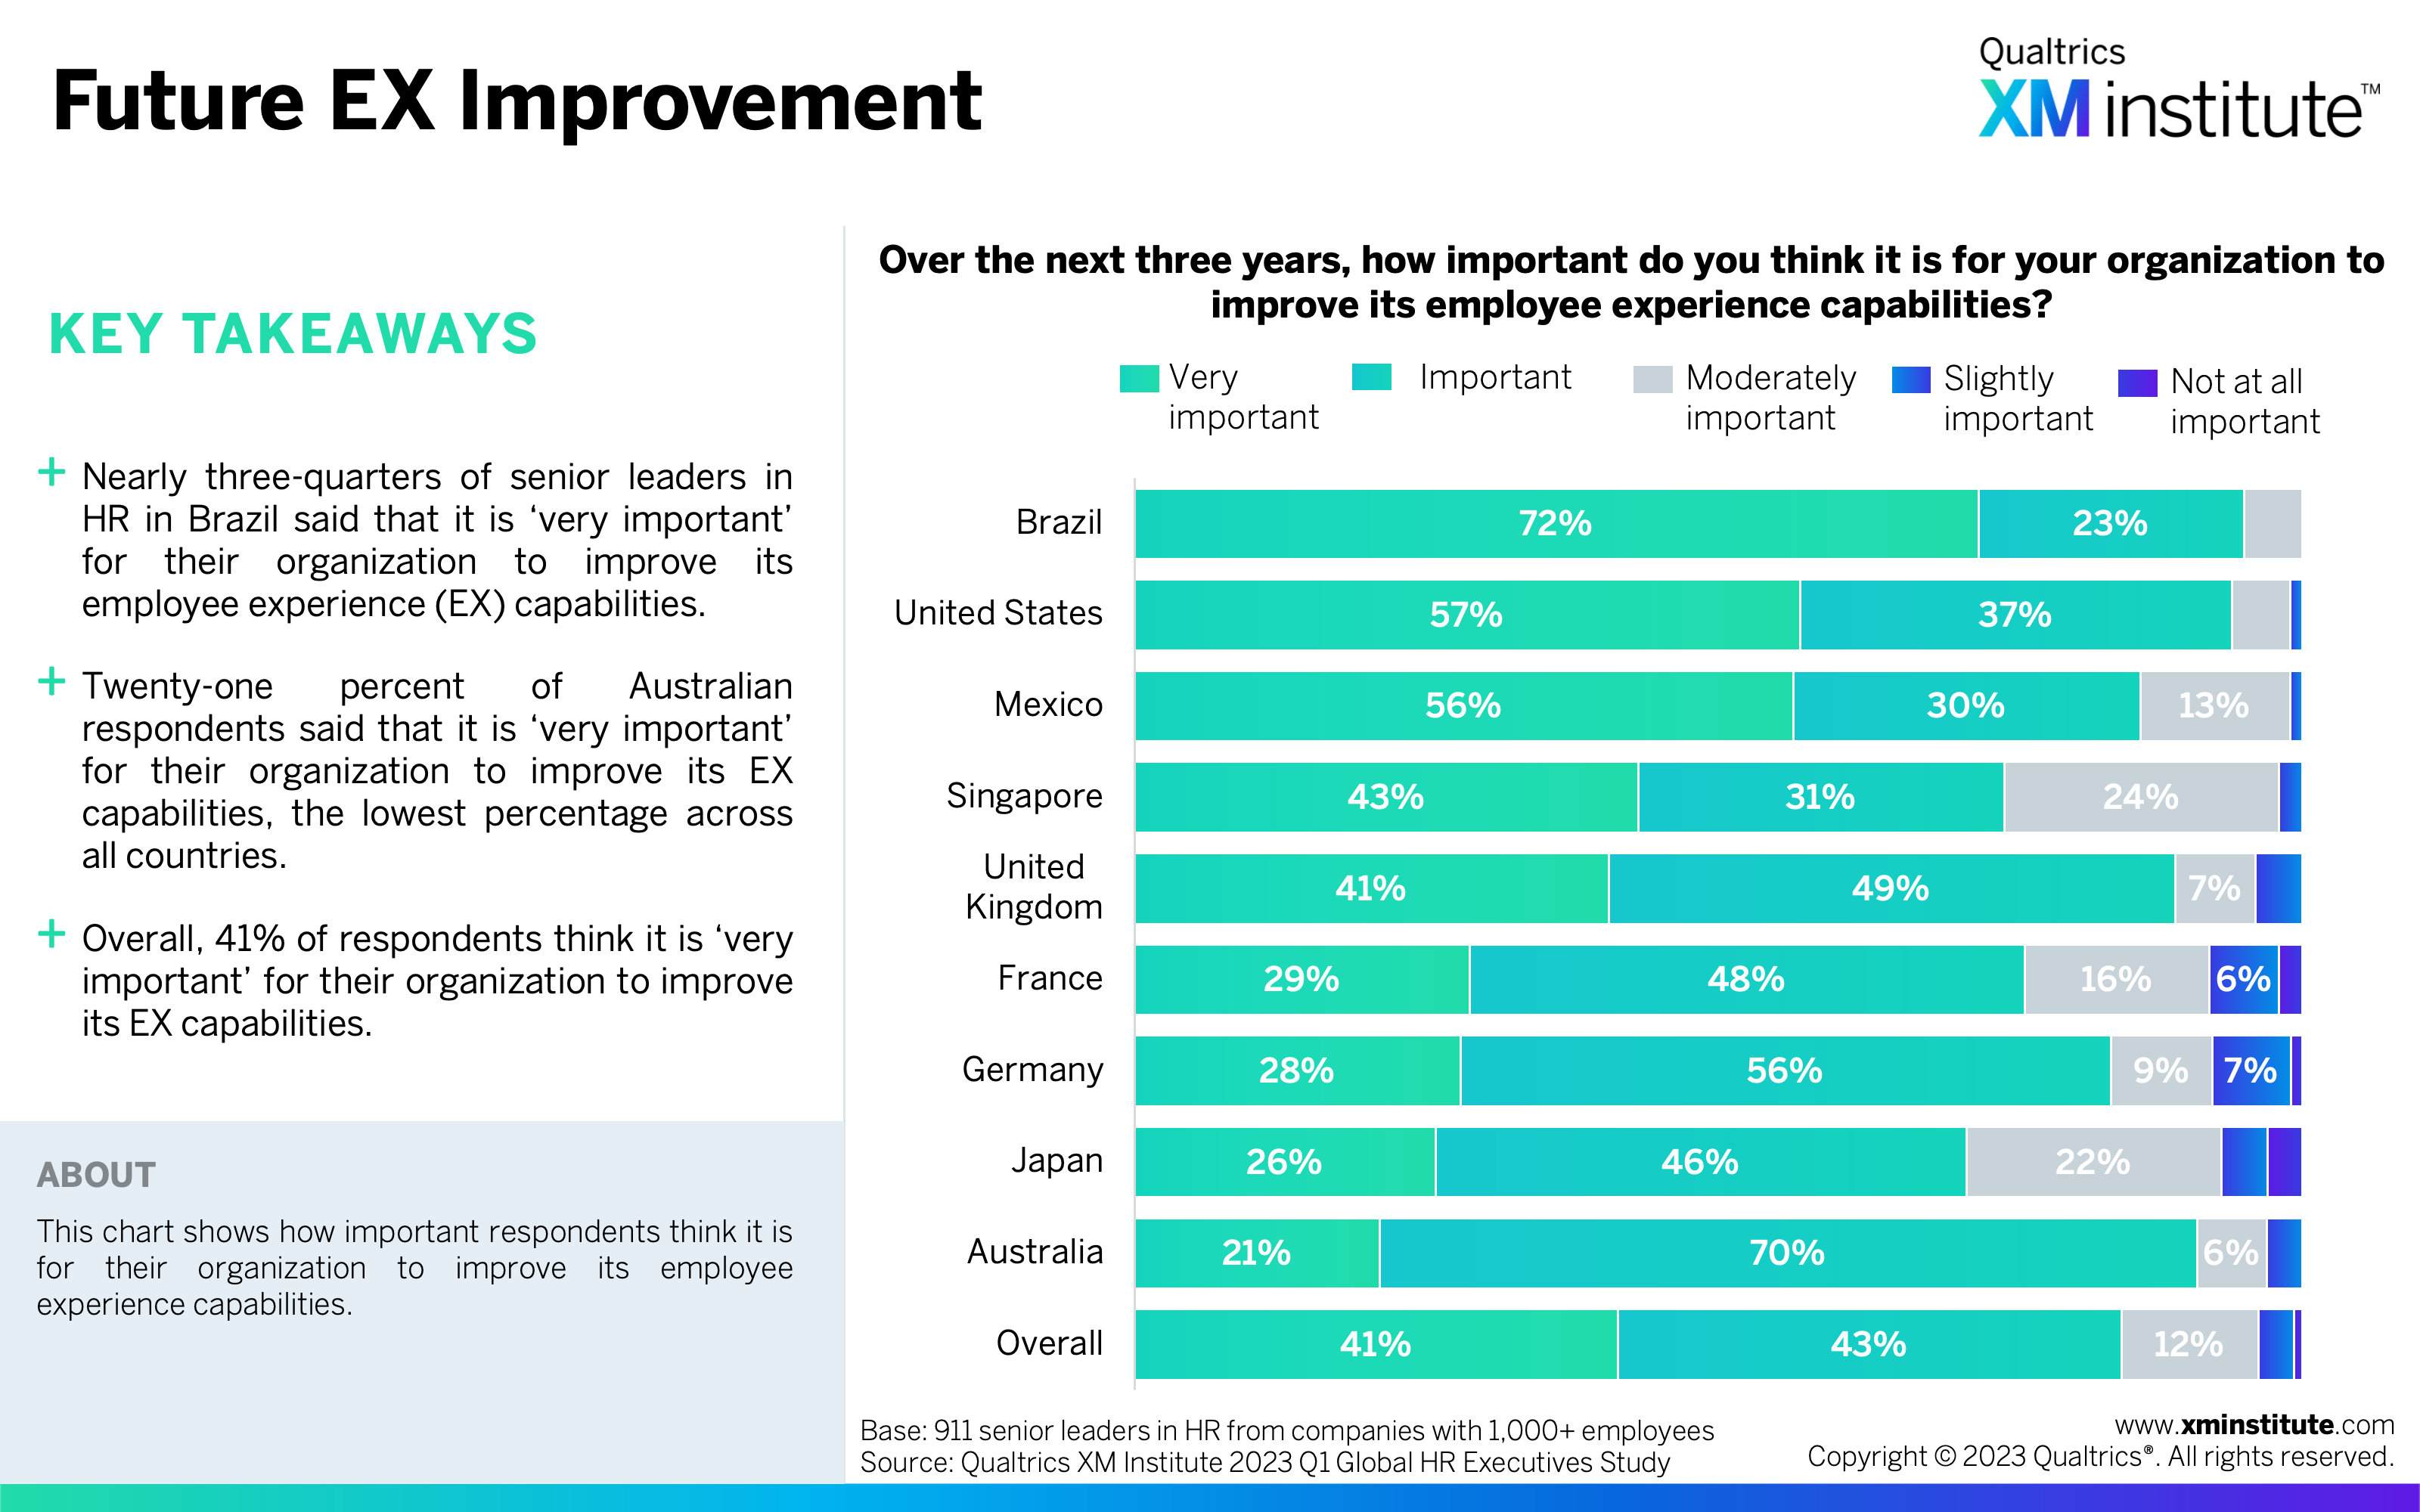
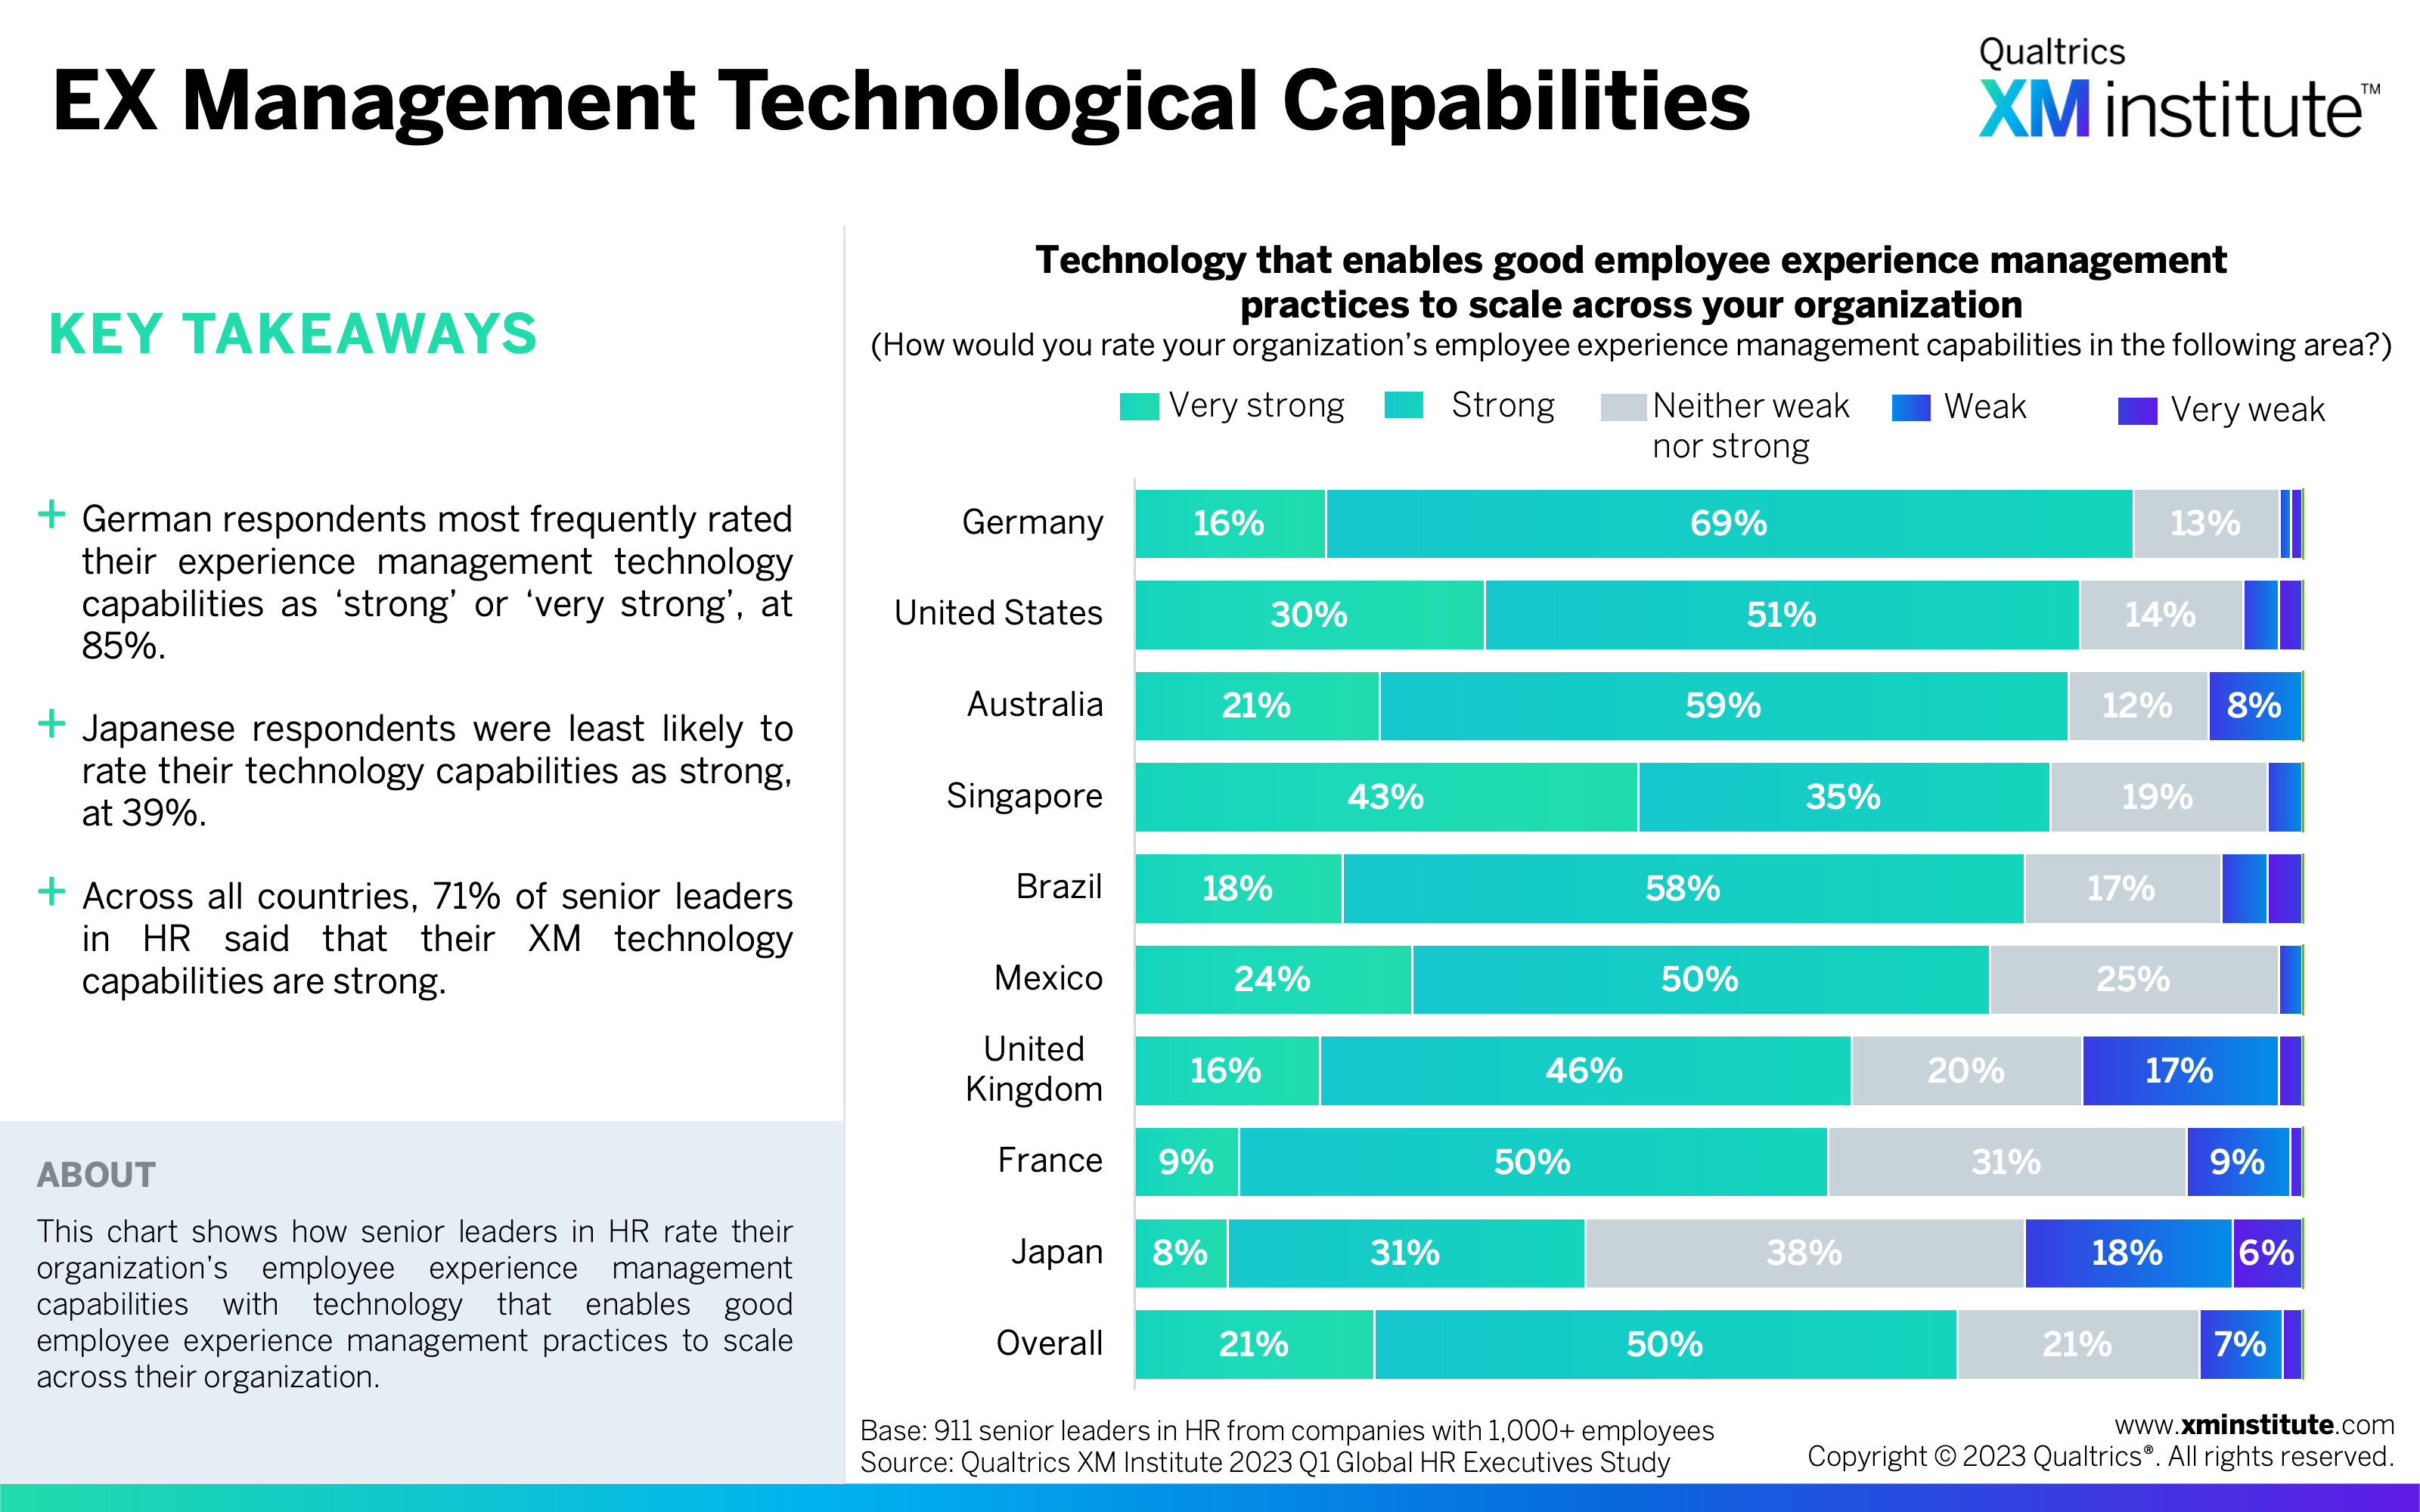
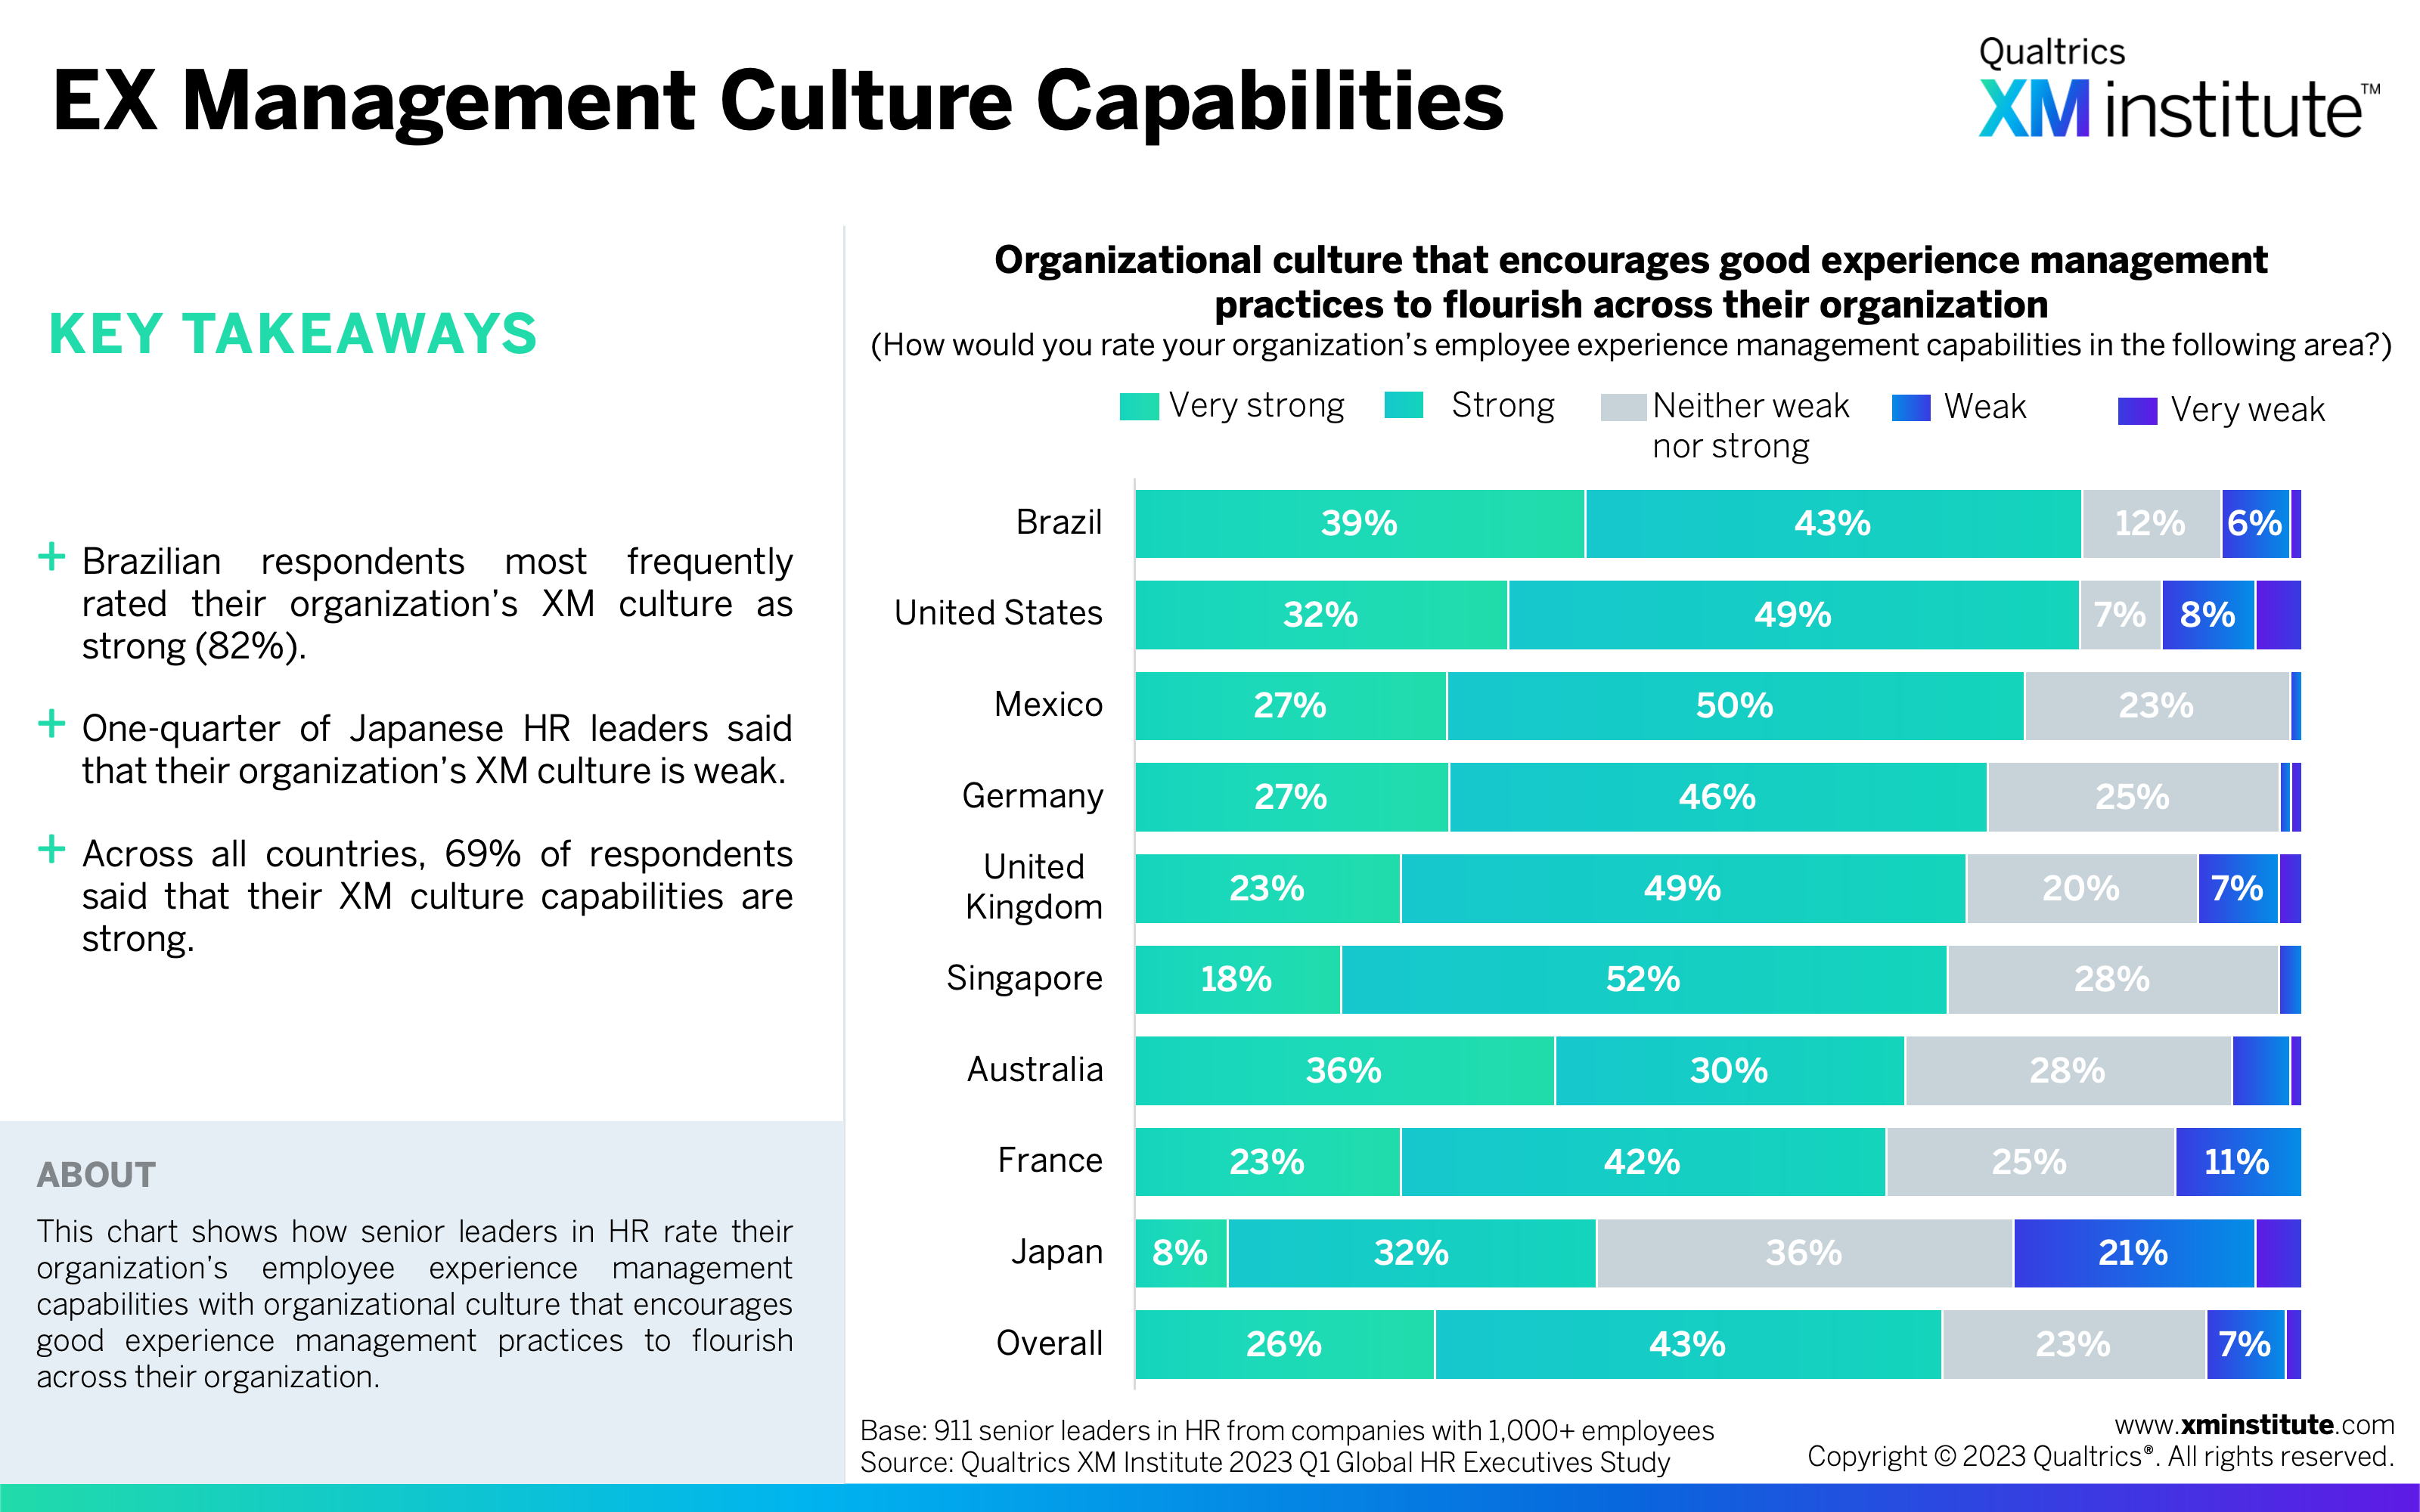
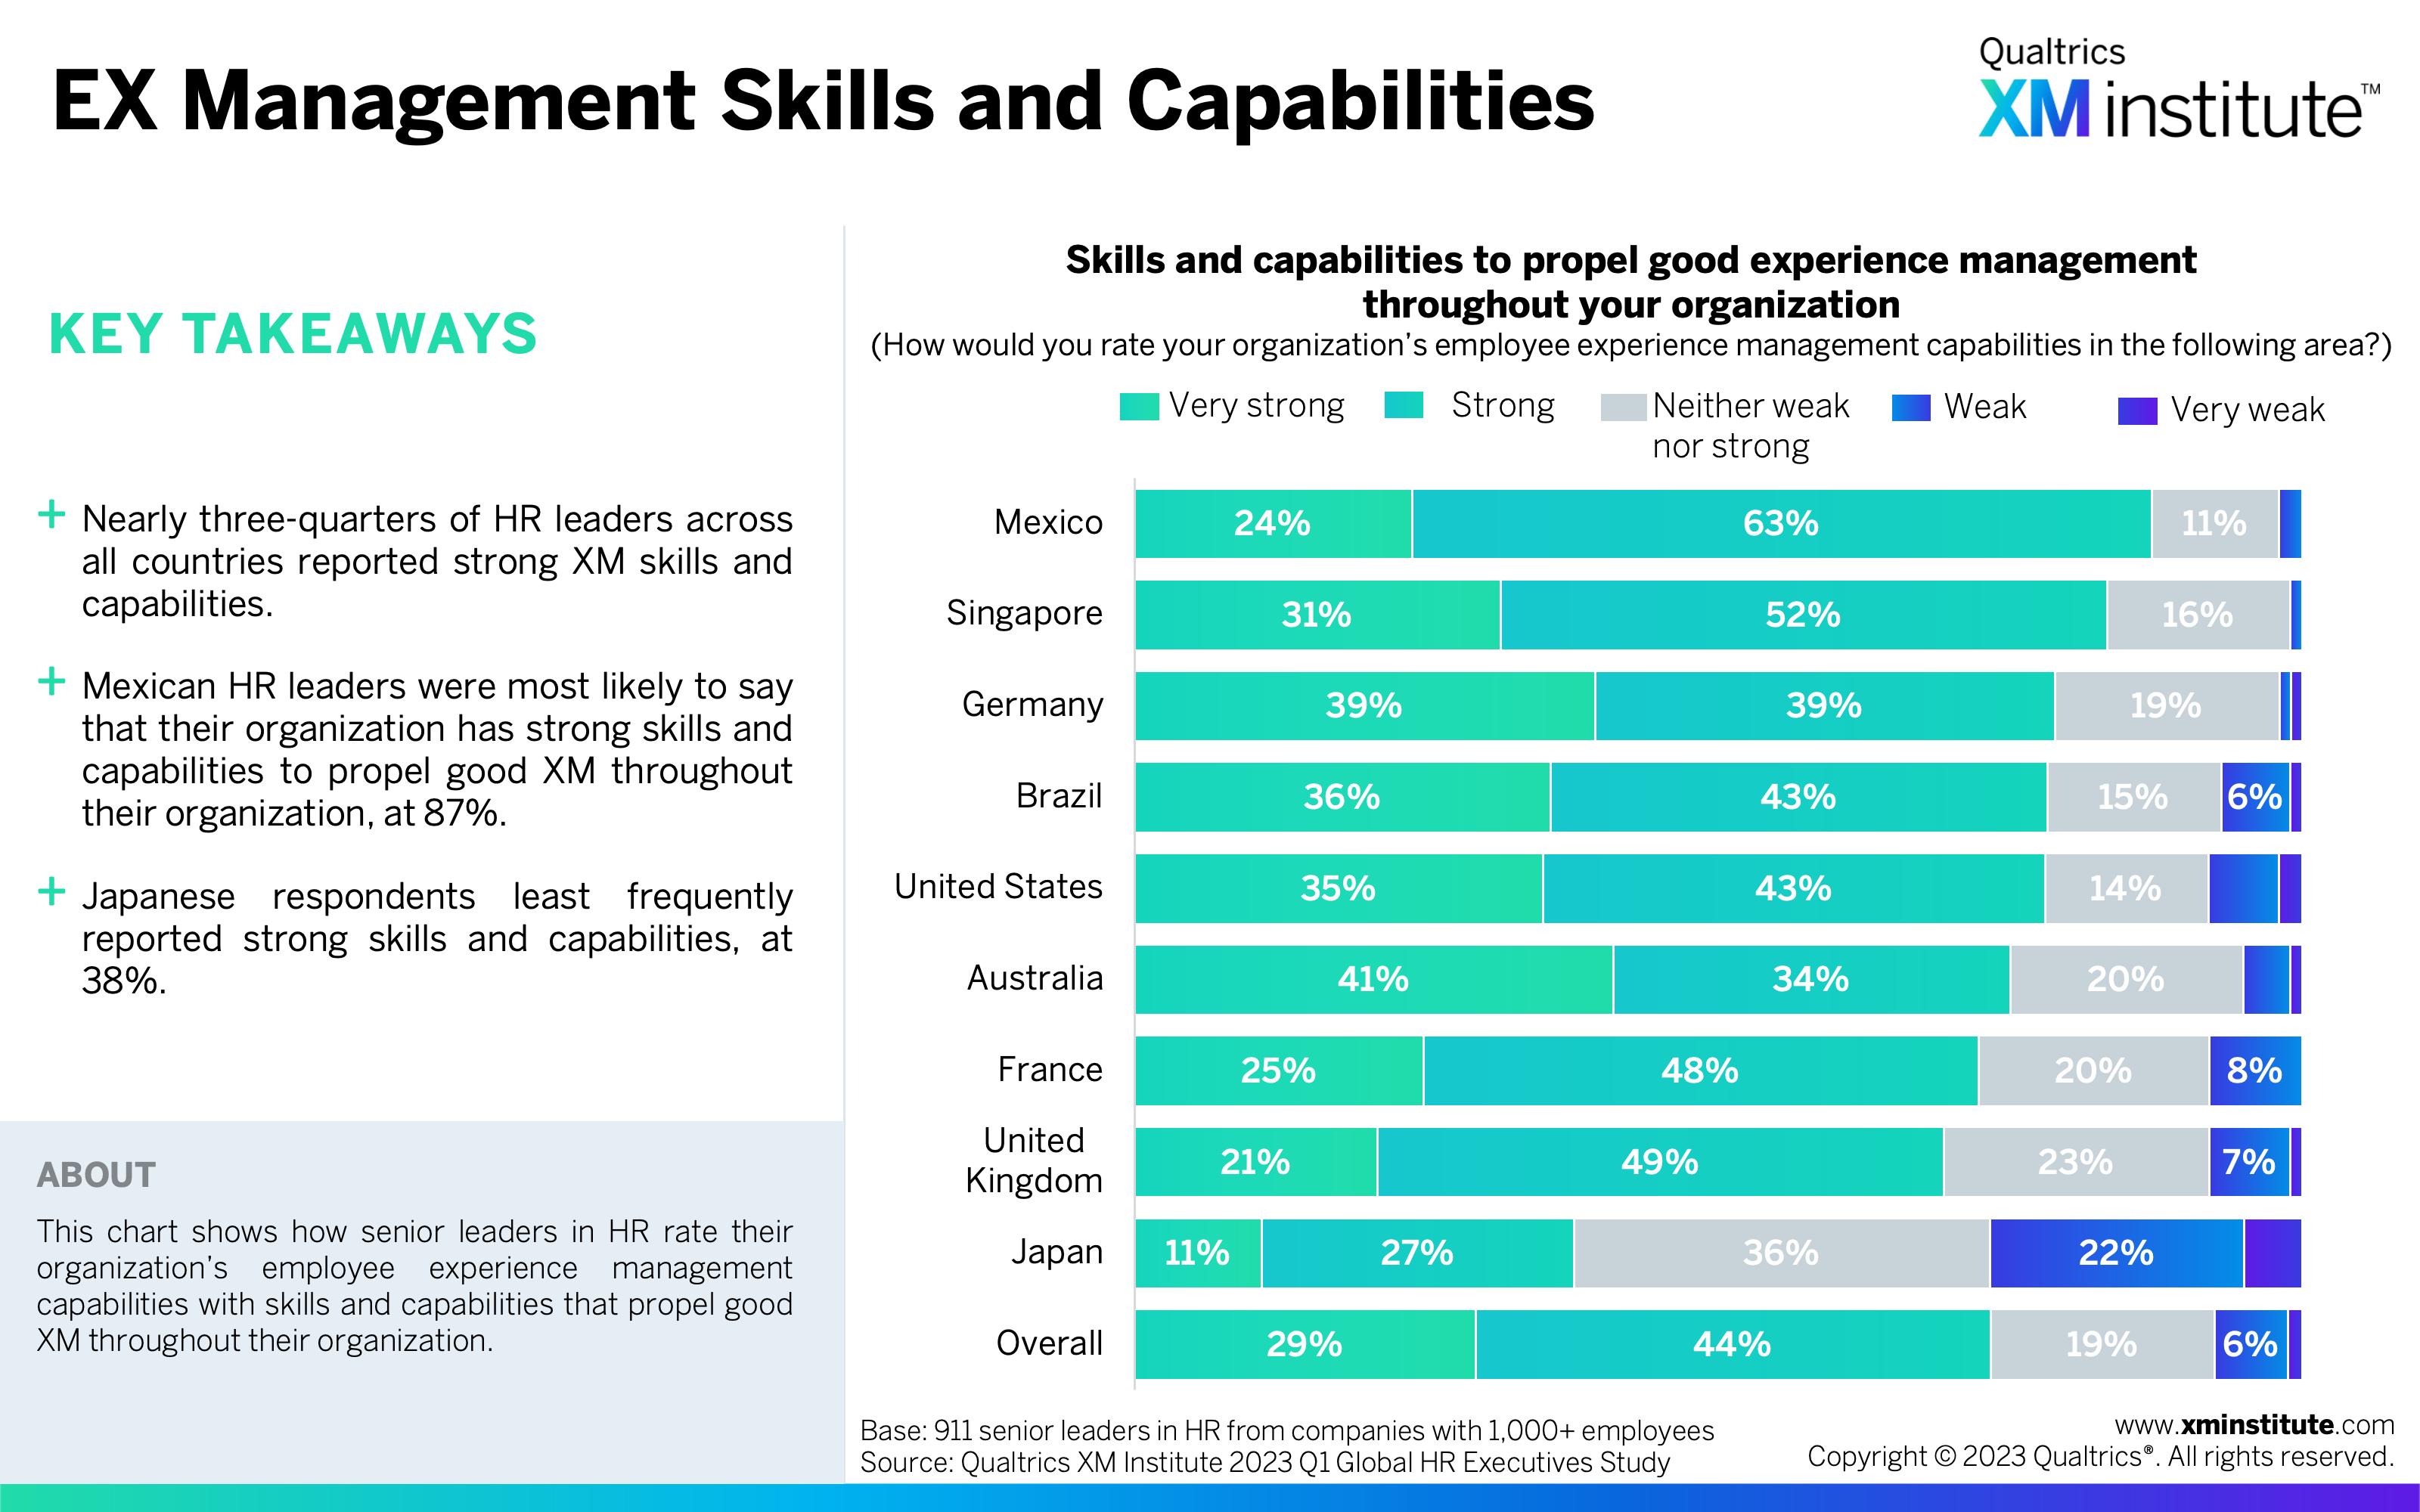
- HR leaders reported strong EX management capabilities, but there’s room for improvement. HR leaders rated their employee experience management capabilities as strong across the three elements of technology (71%), culture (69%), and skills and capabilities (73%). They still see the importance of improving their employee experience capabilities; 84% said this is important for their organization to do over the next three years.
- ‘Lack of clear strategy’ is the top obstacle to EX success. Thirty percent of HR leaders cited ‘lack of clear strategy’ as an obstacle. Organizations with fewer than 10,000 employees were more likely to report this as an obstacle (32%) compared to larger companies (23%). Globally, HR leaders cited ‘misaligned incentives and rewards’ and ‘lack of critical skills’ as obstacles next most frequently.
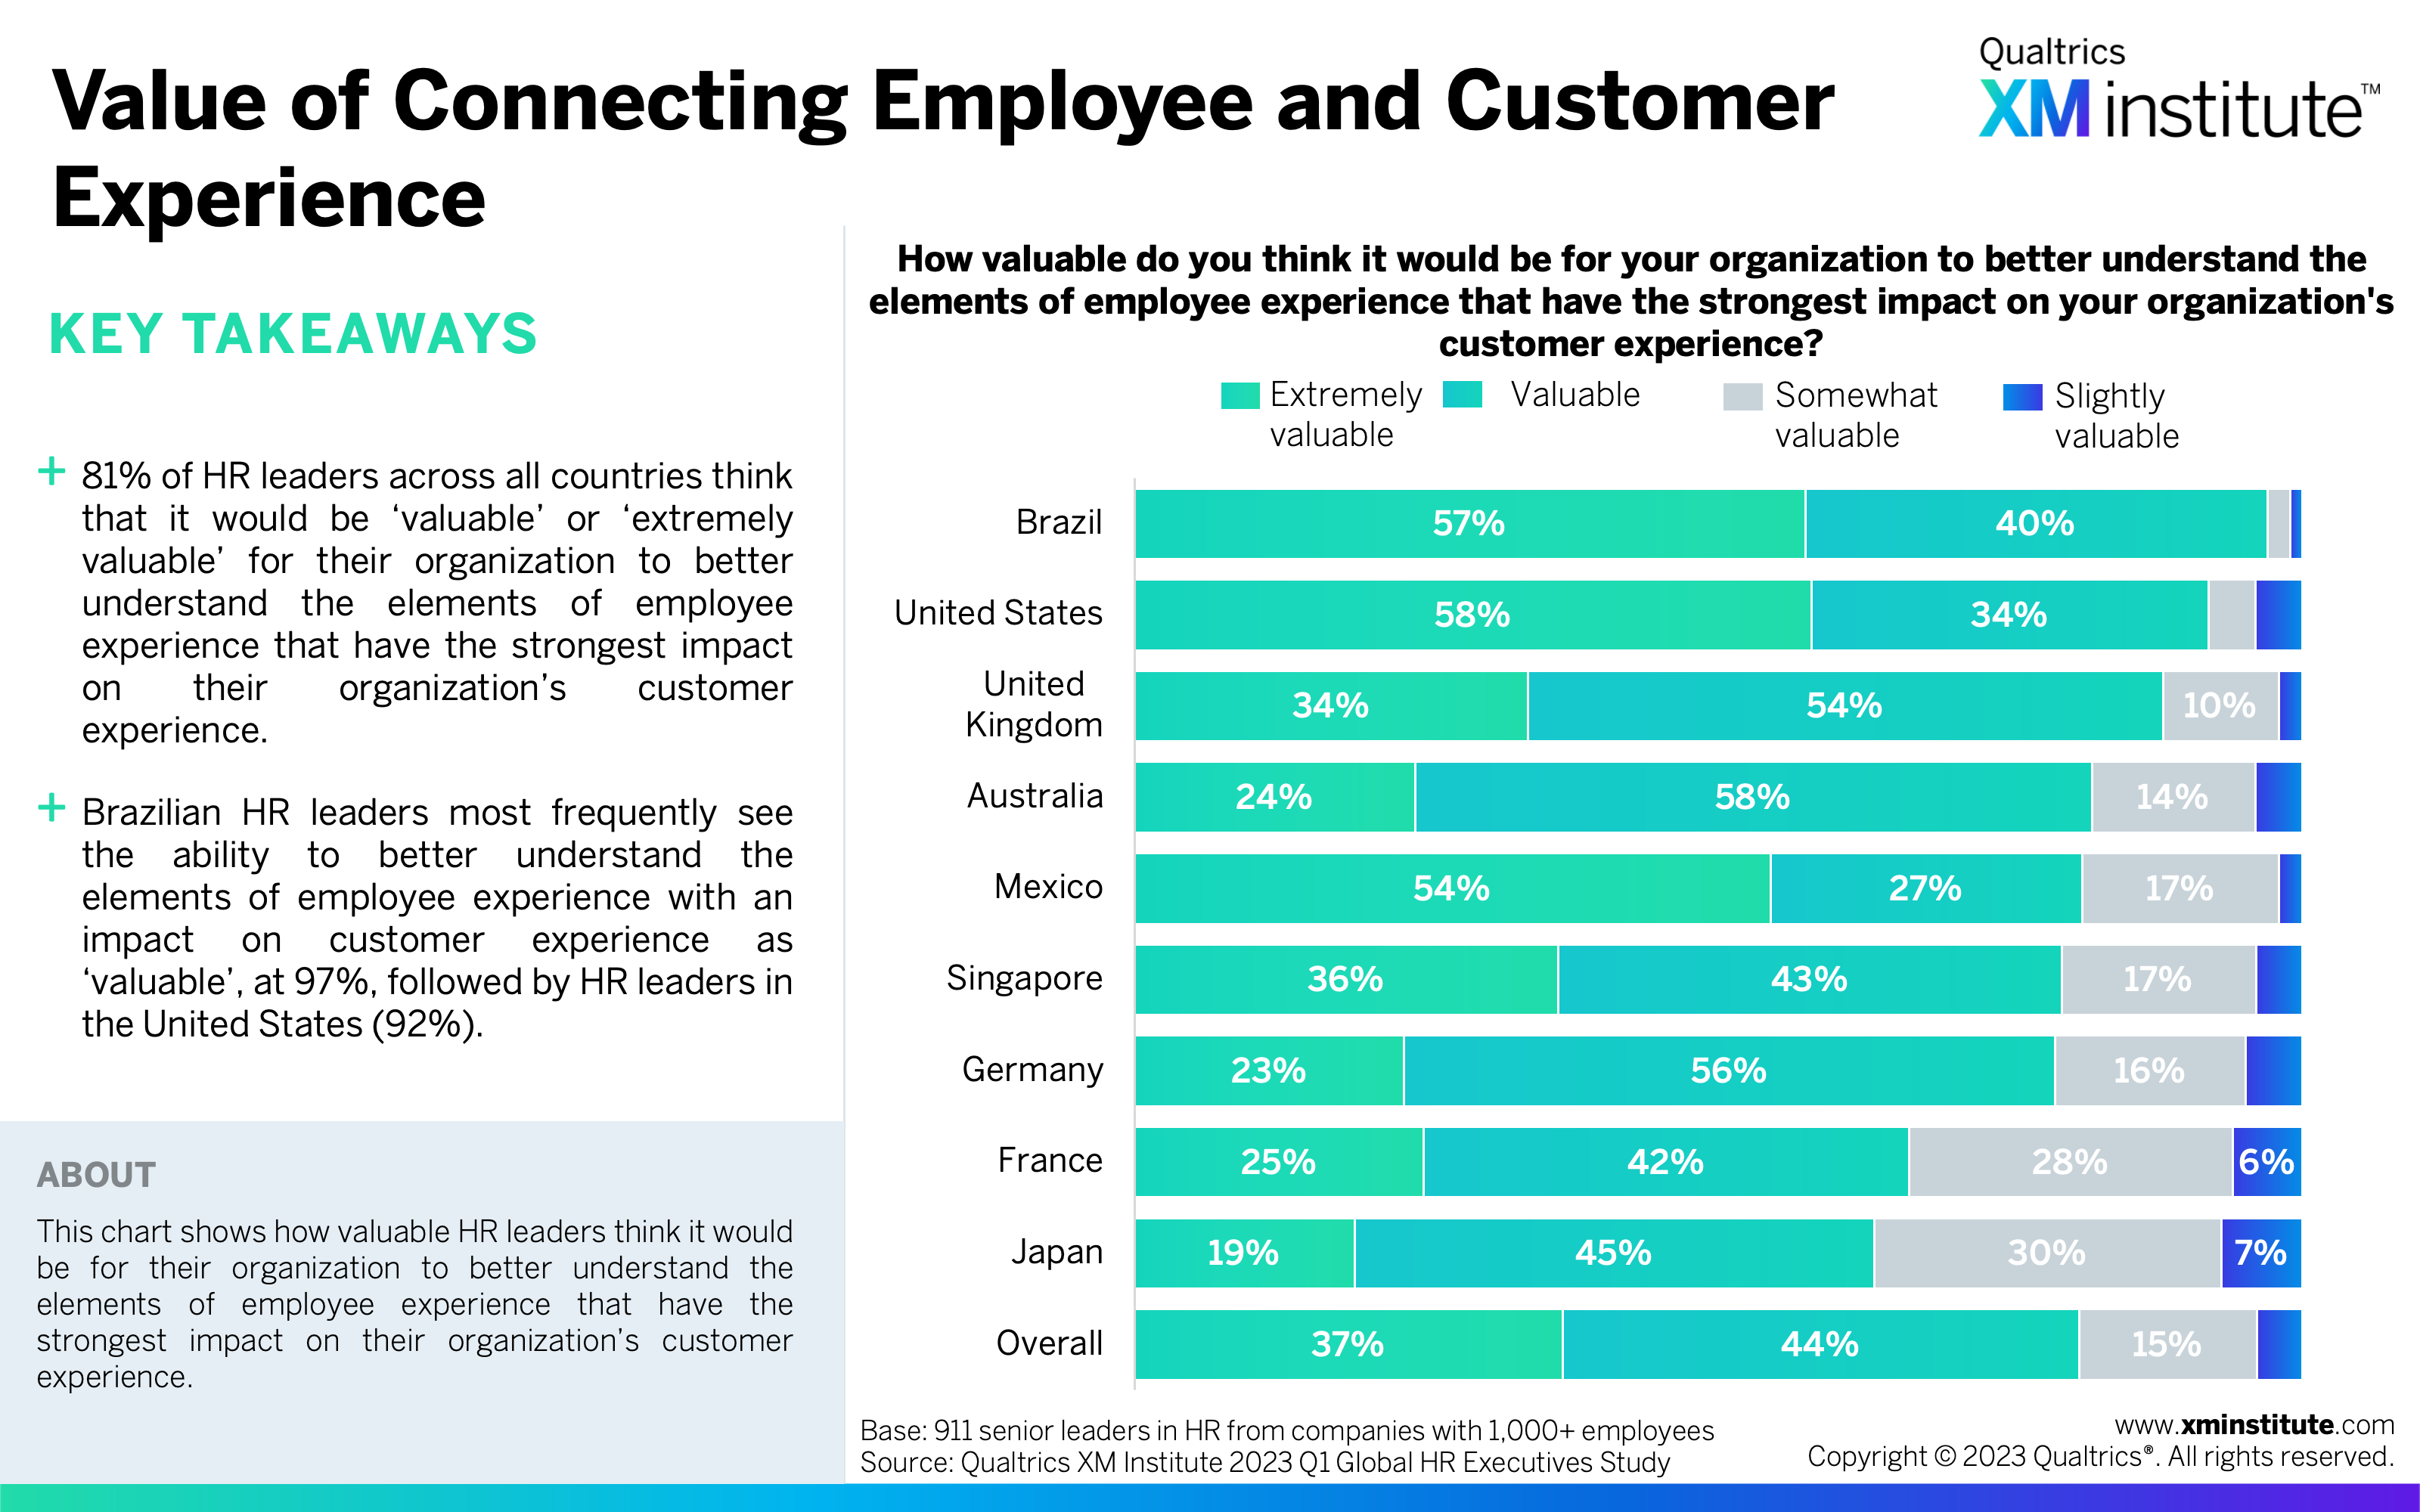
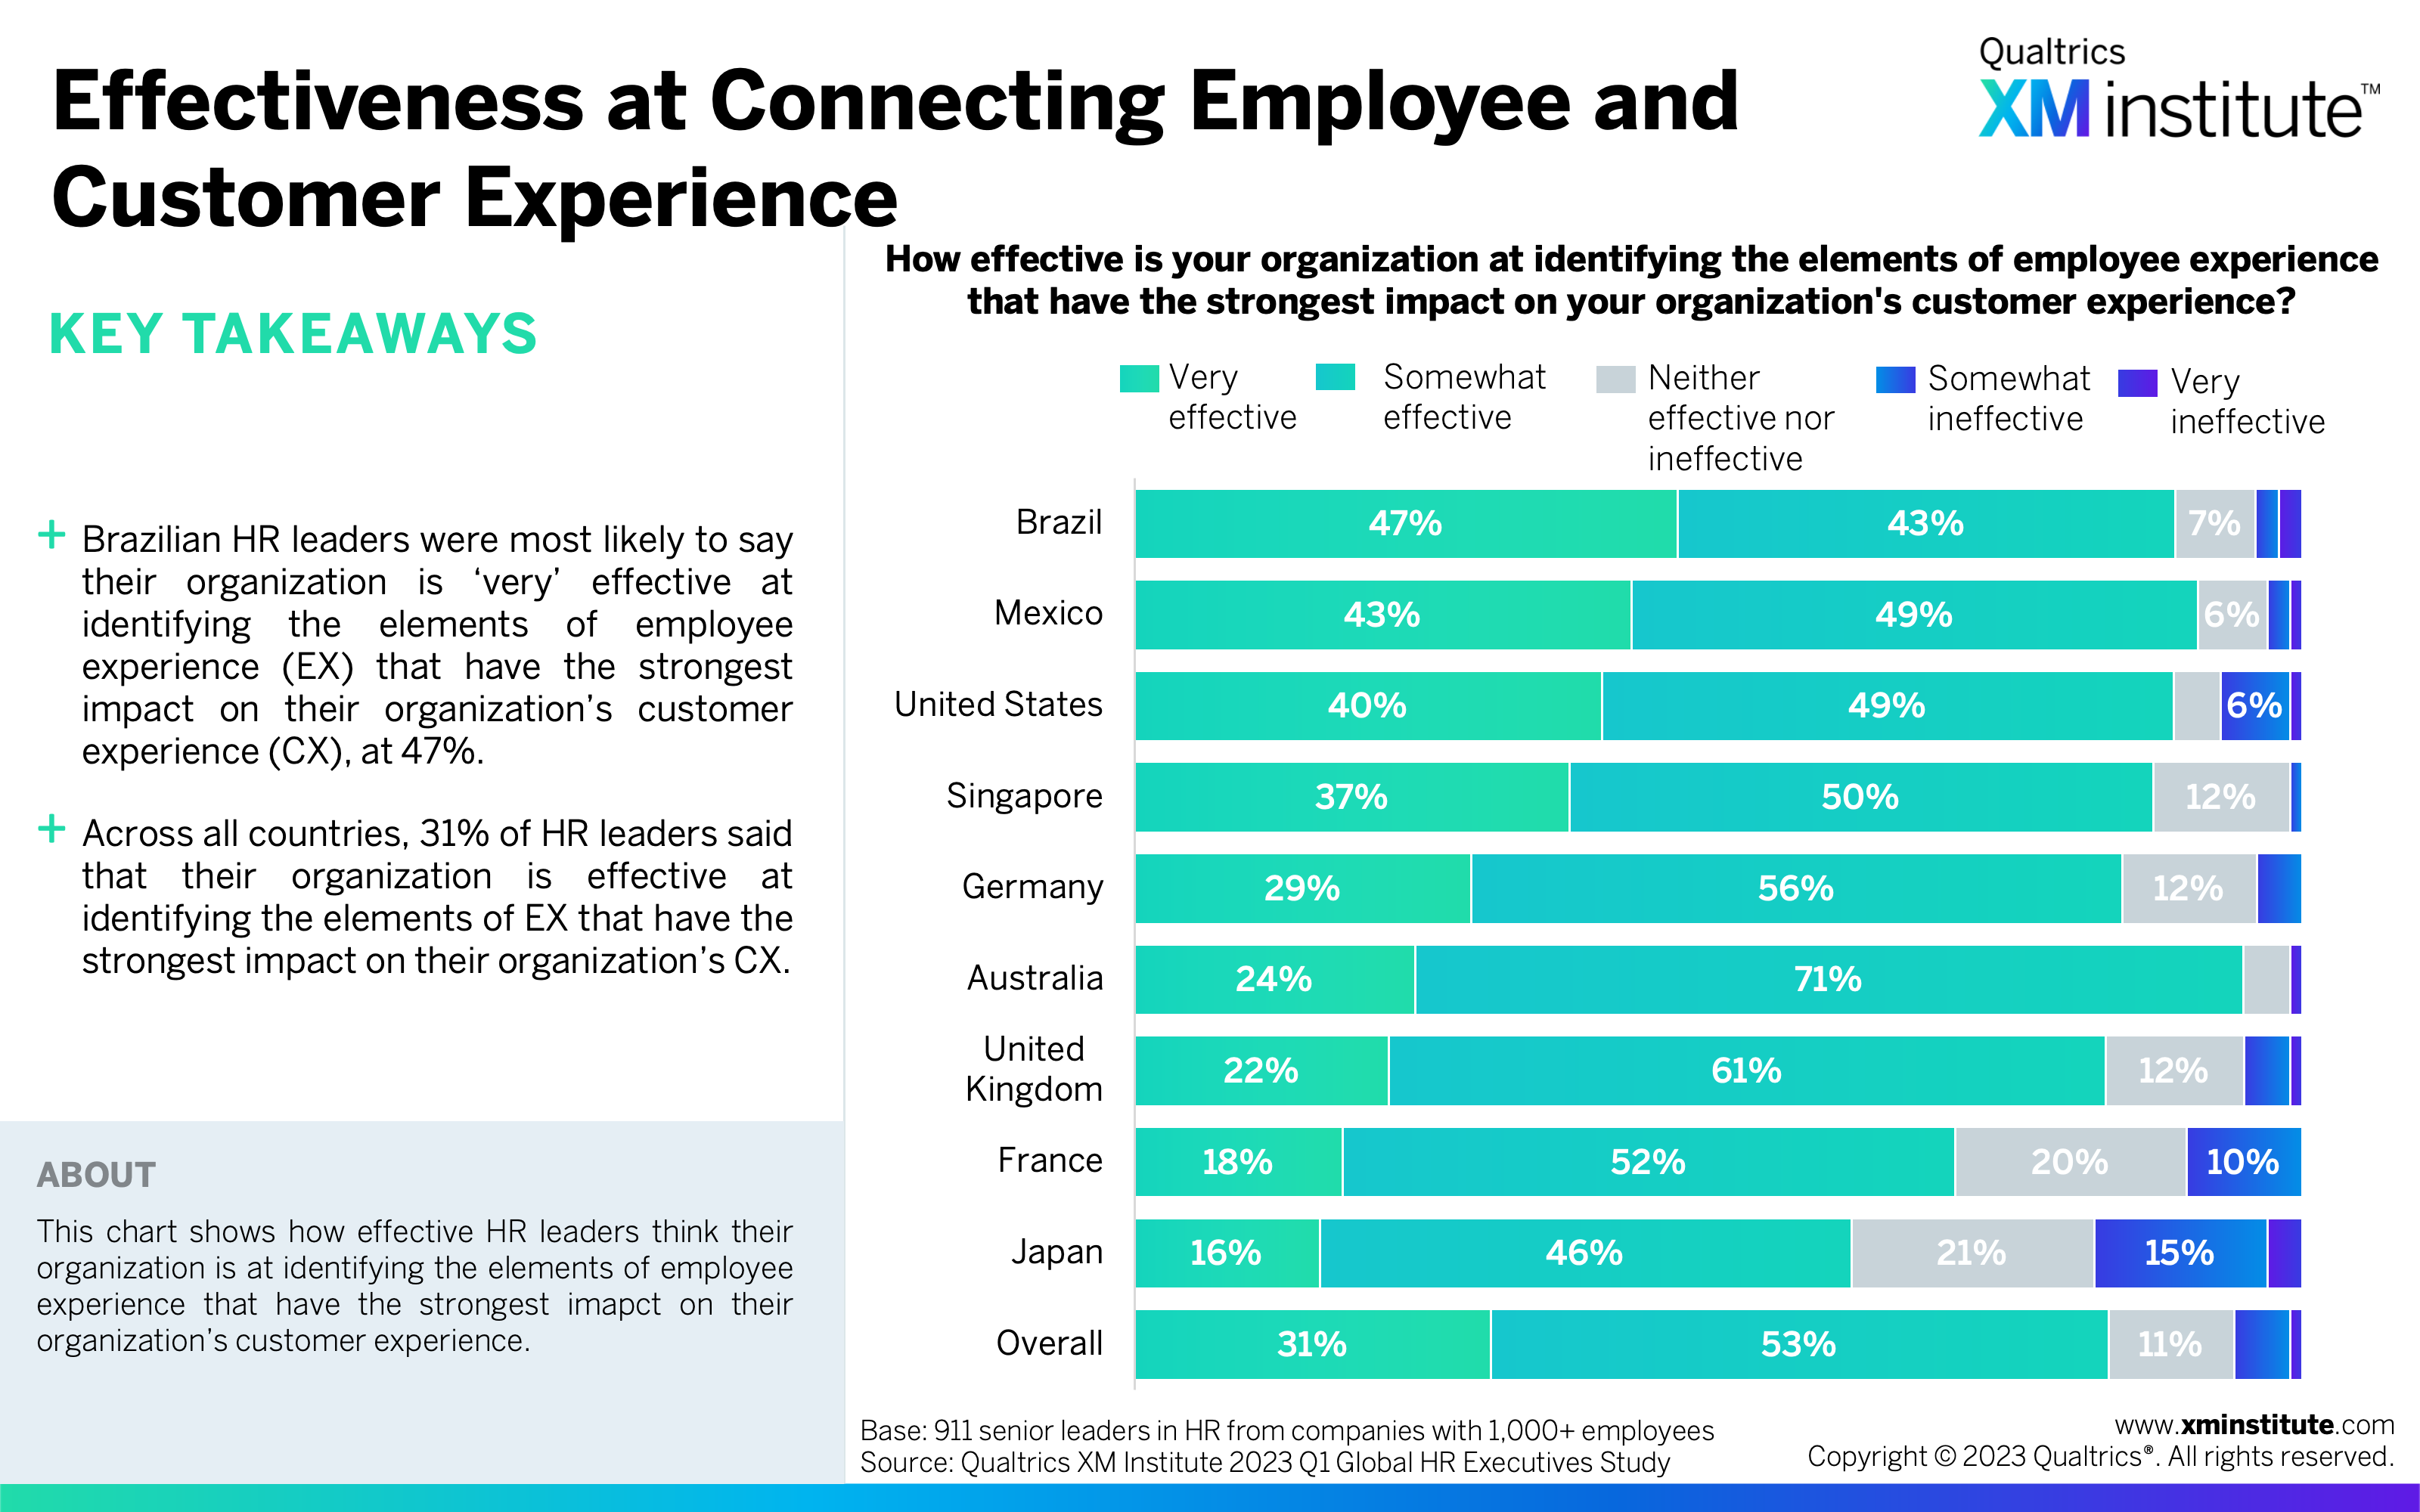
- There’s high perceived value in connecting employee and customer experience. Over four in five HR leaders said it would be ‘valuable’ or ‘extremely valuable’ for their organization to better understand the elements of employee experience that have the strongest impact on customer experience. Meanwhile, just 31% of respondents said their organization is ‘very effective’ at identifying these elements.
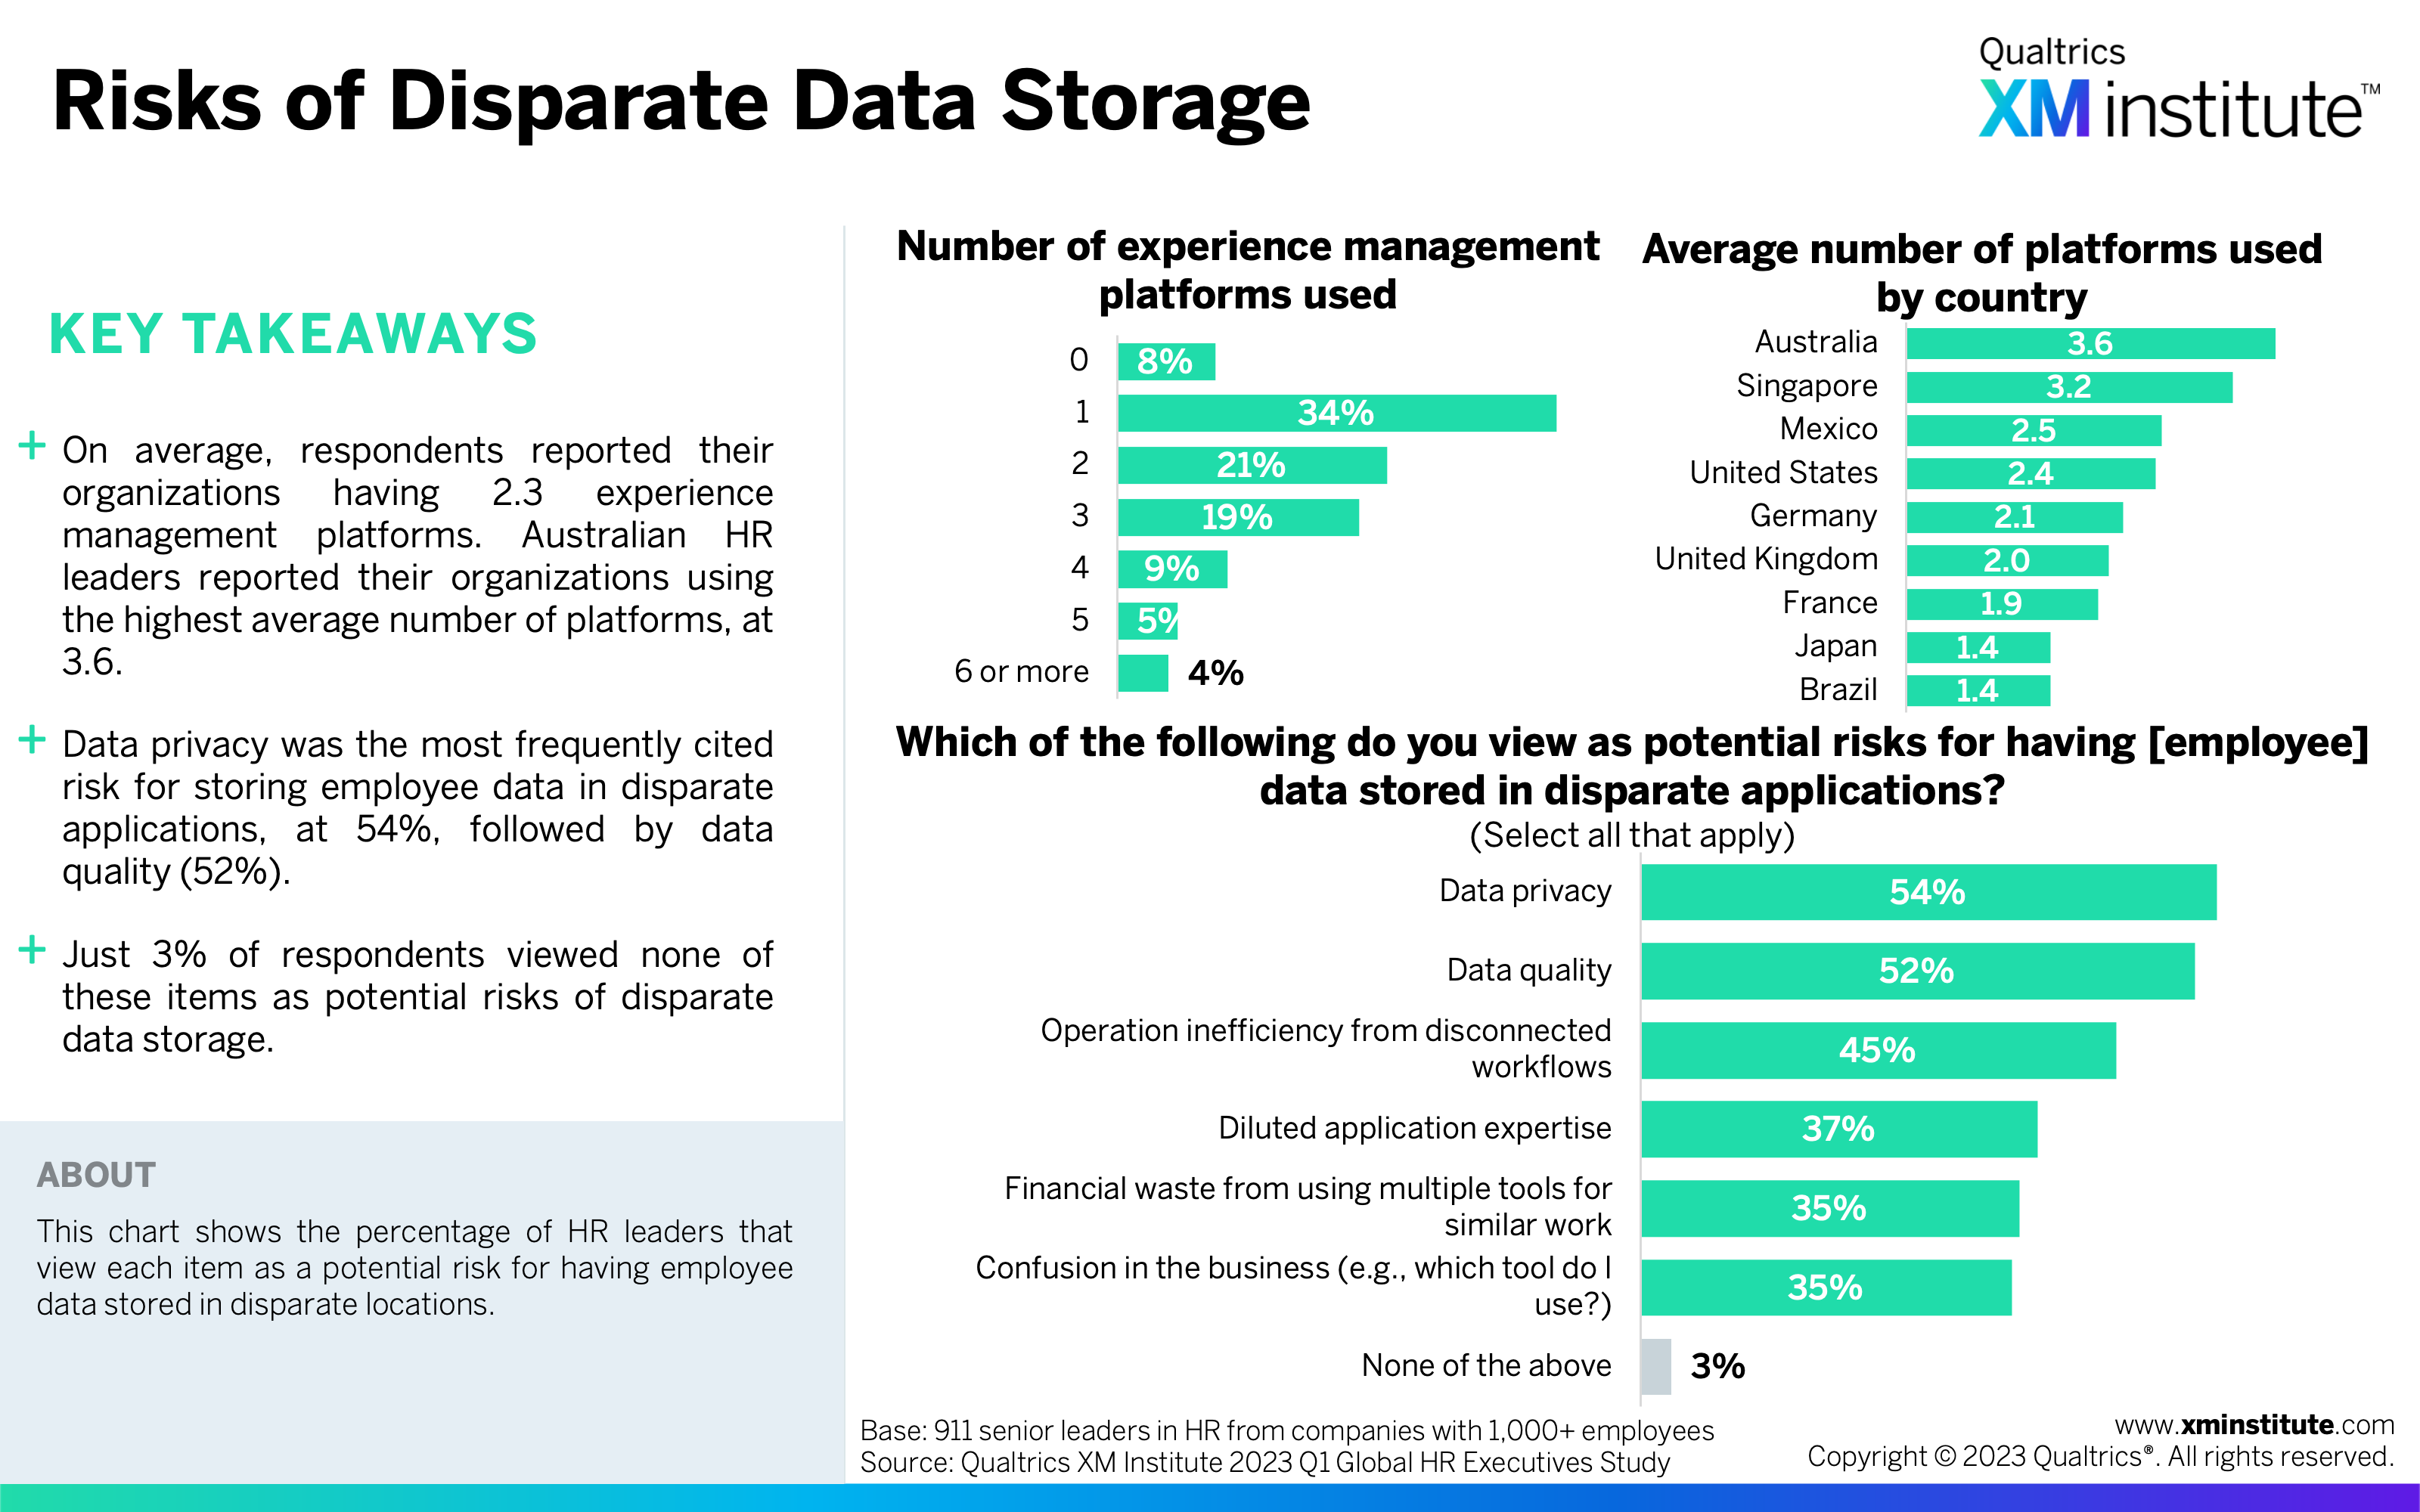
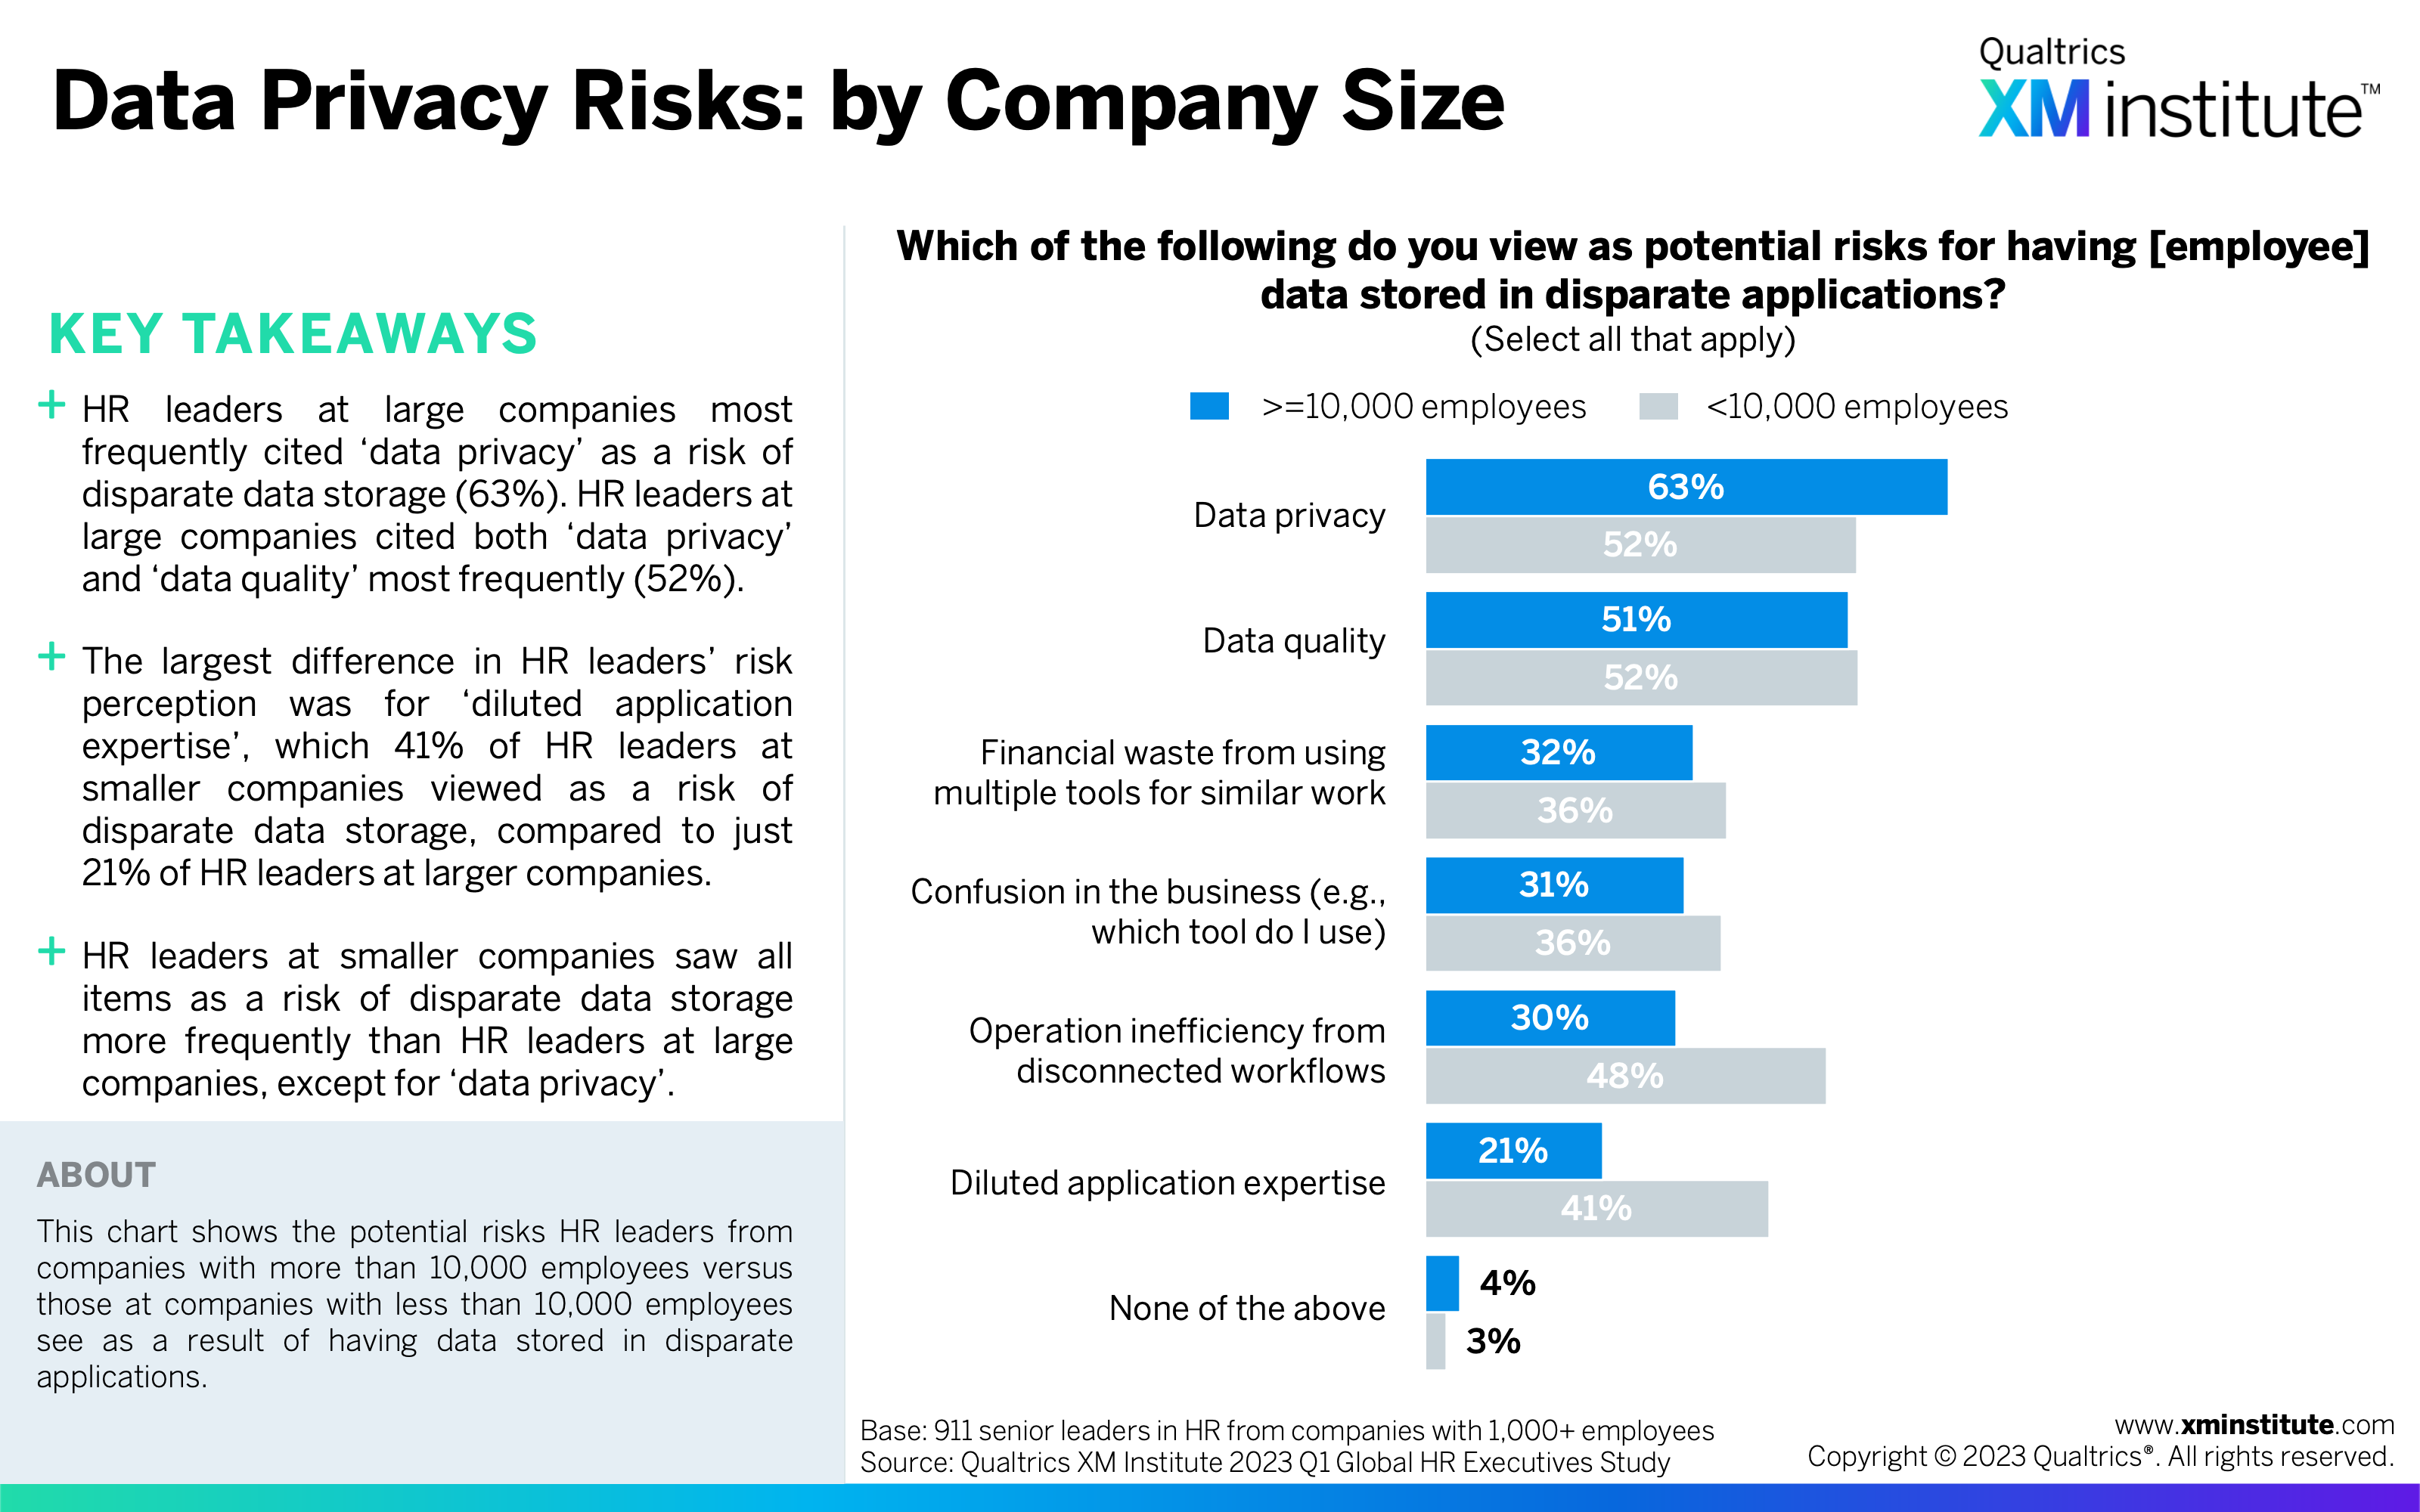
- Data privacy and quality are the top concerns for disparate employee data storage. More than fifty percent of respondents cited each of these items as a risk of disparate data storage. Meanwhile, these HR leaders reported their organizations using, on average, 2.3 experience management platforms.
Figures
Here are the figures in this Data Snapshot:
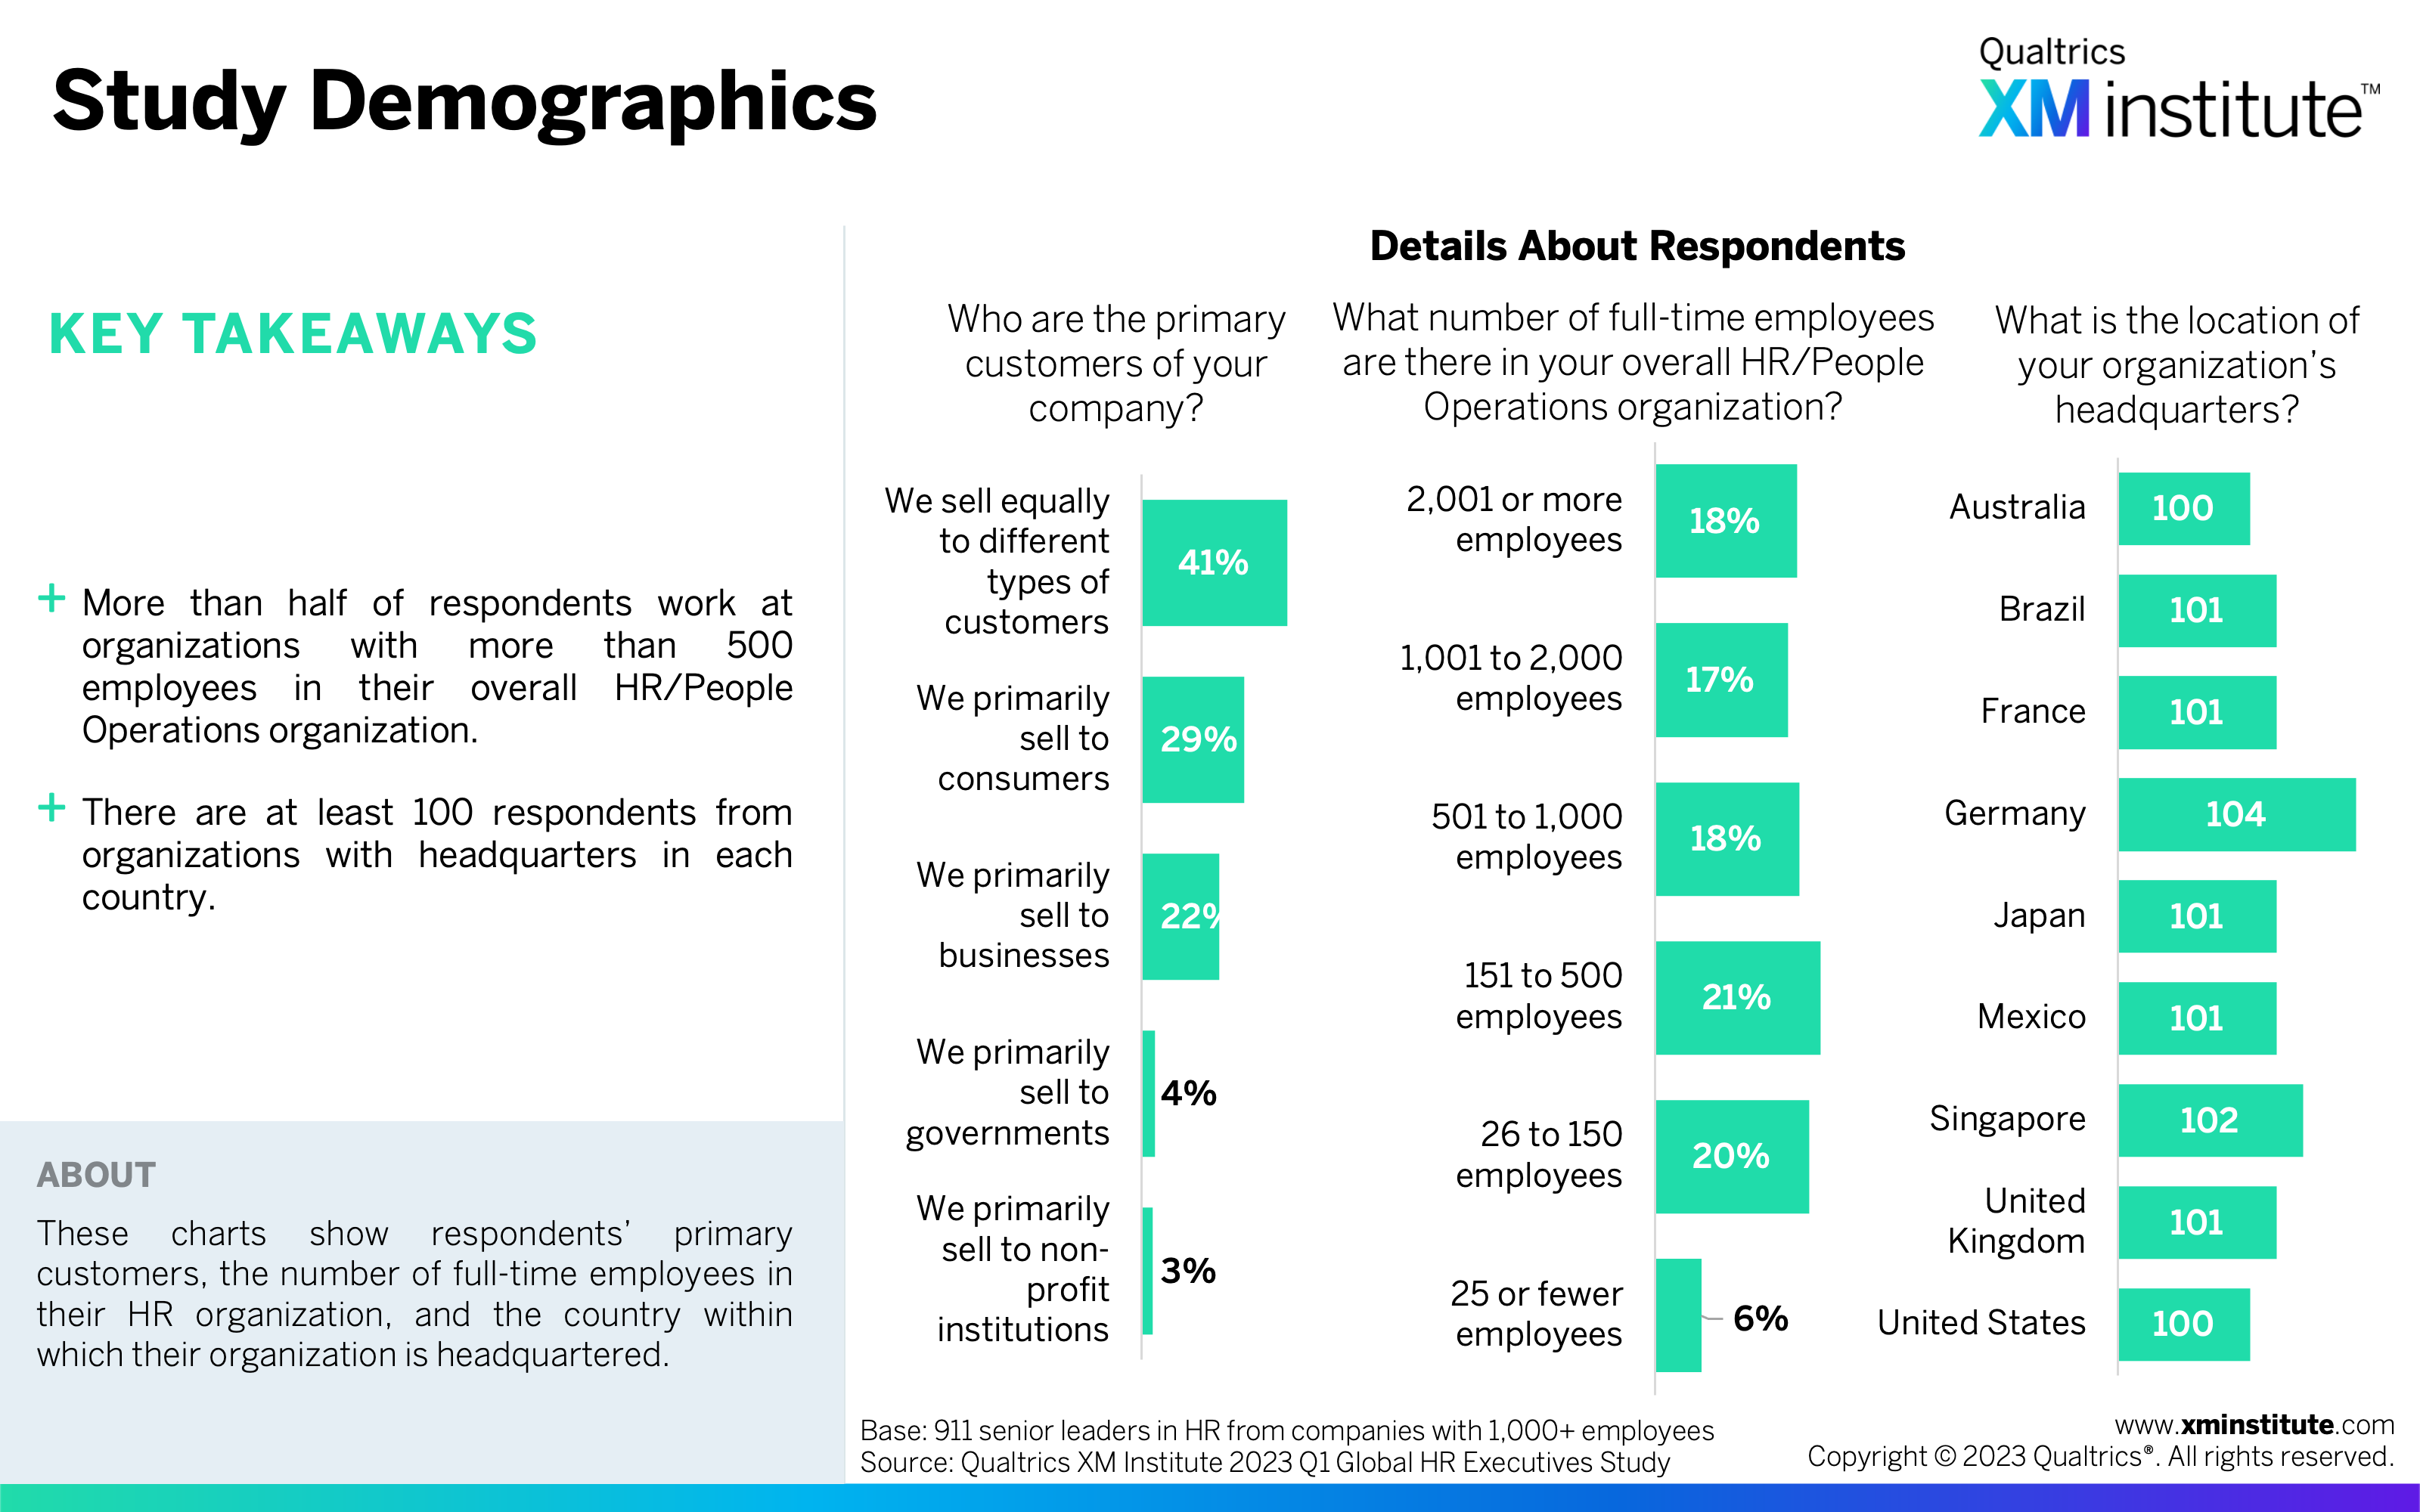
- Study Demographics (see Figure 1)
- Changes to HR Budgets and Headcount (see Figure 2)
- HR Involvement in Strategic Initiatives After COVID (see Figure 3)
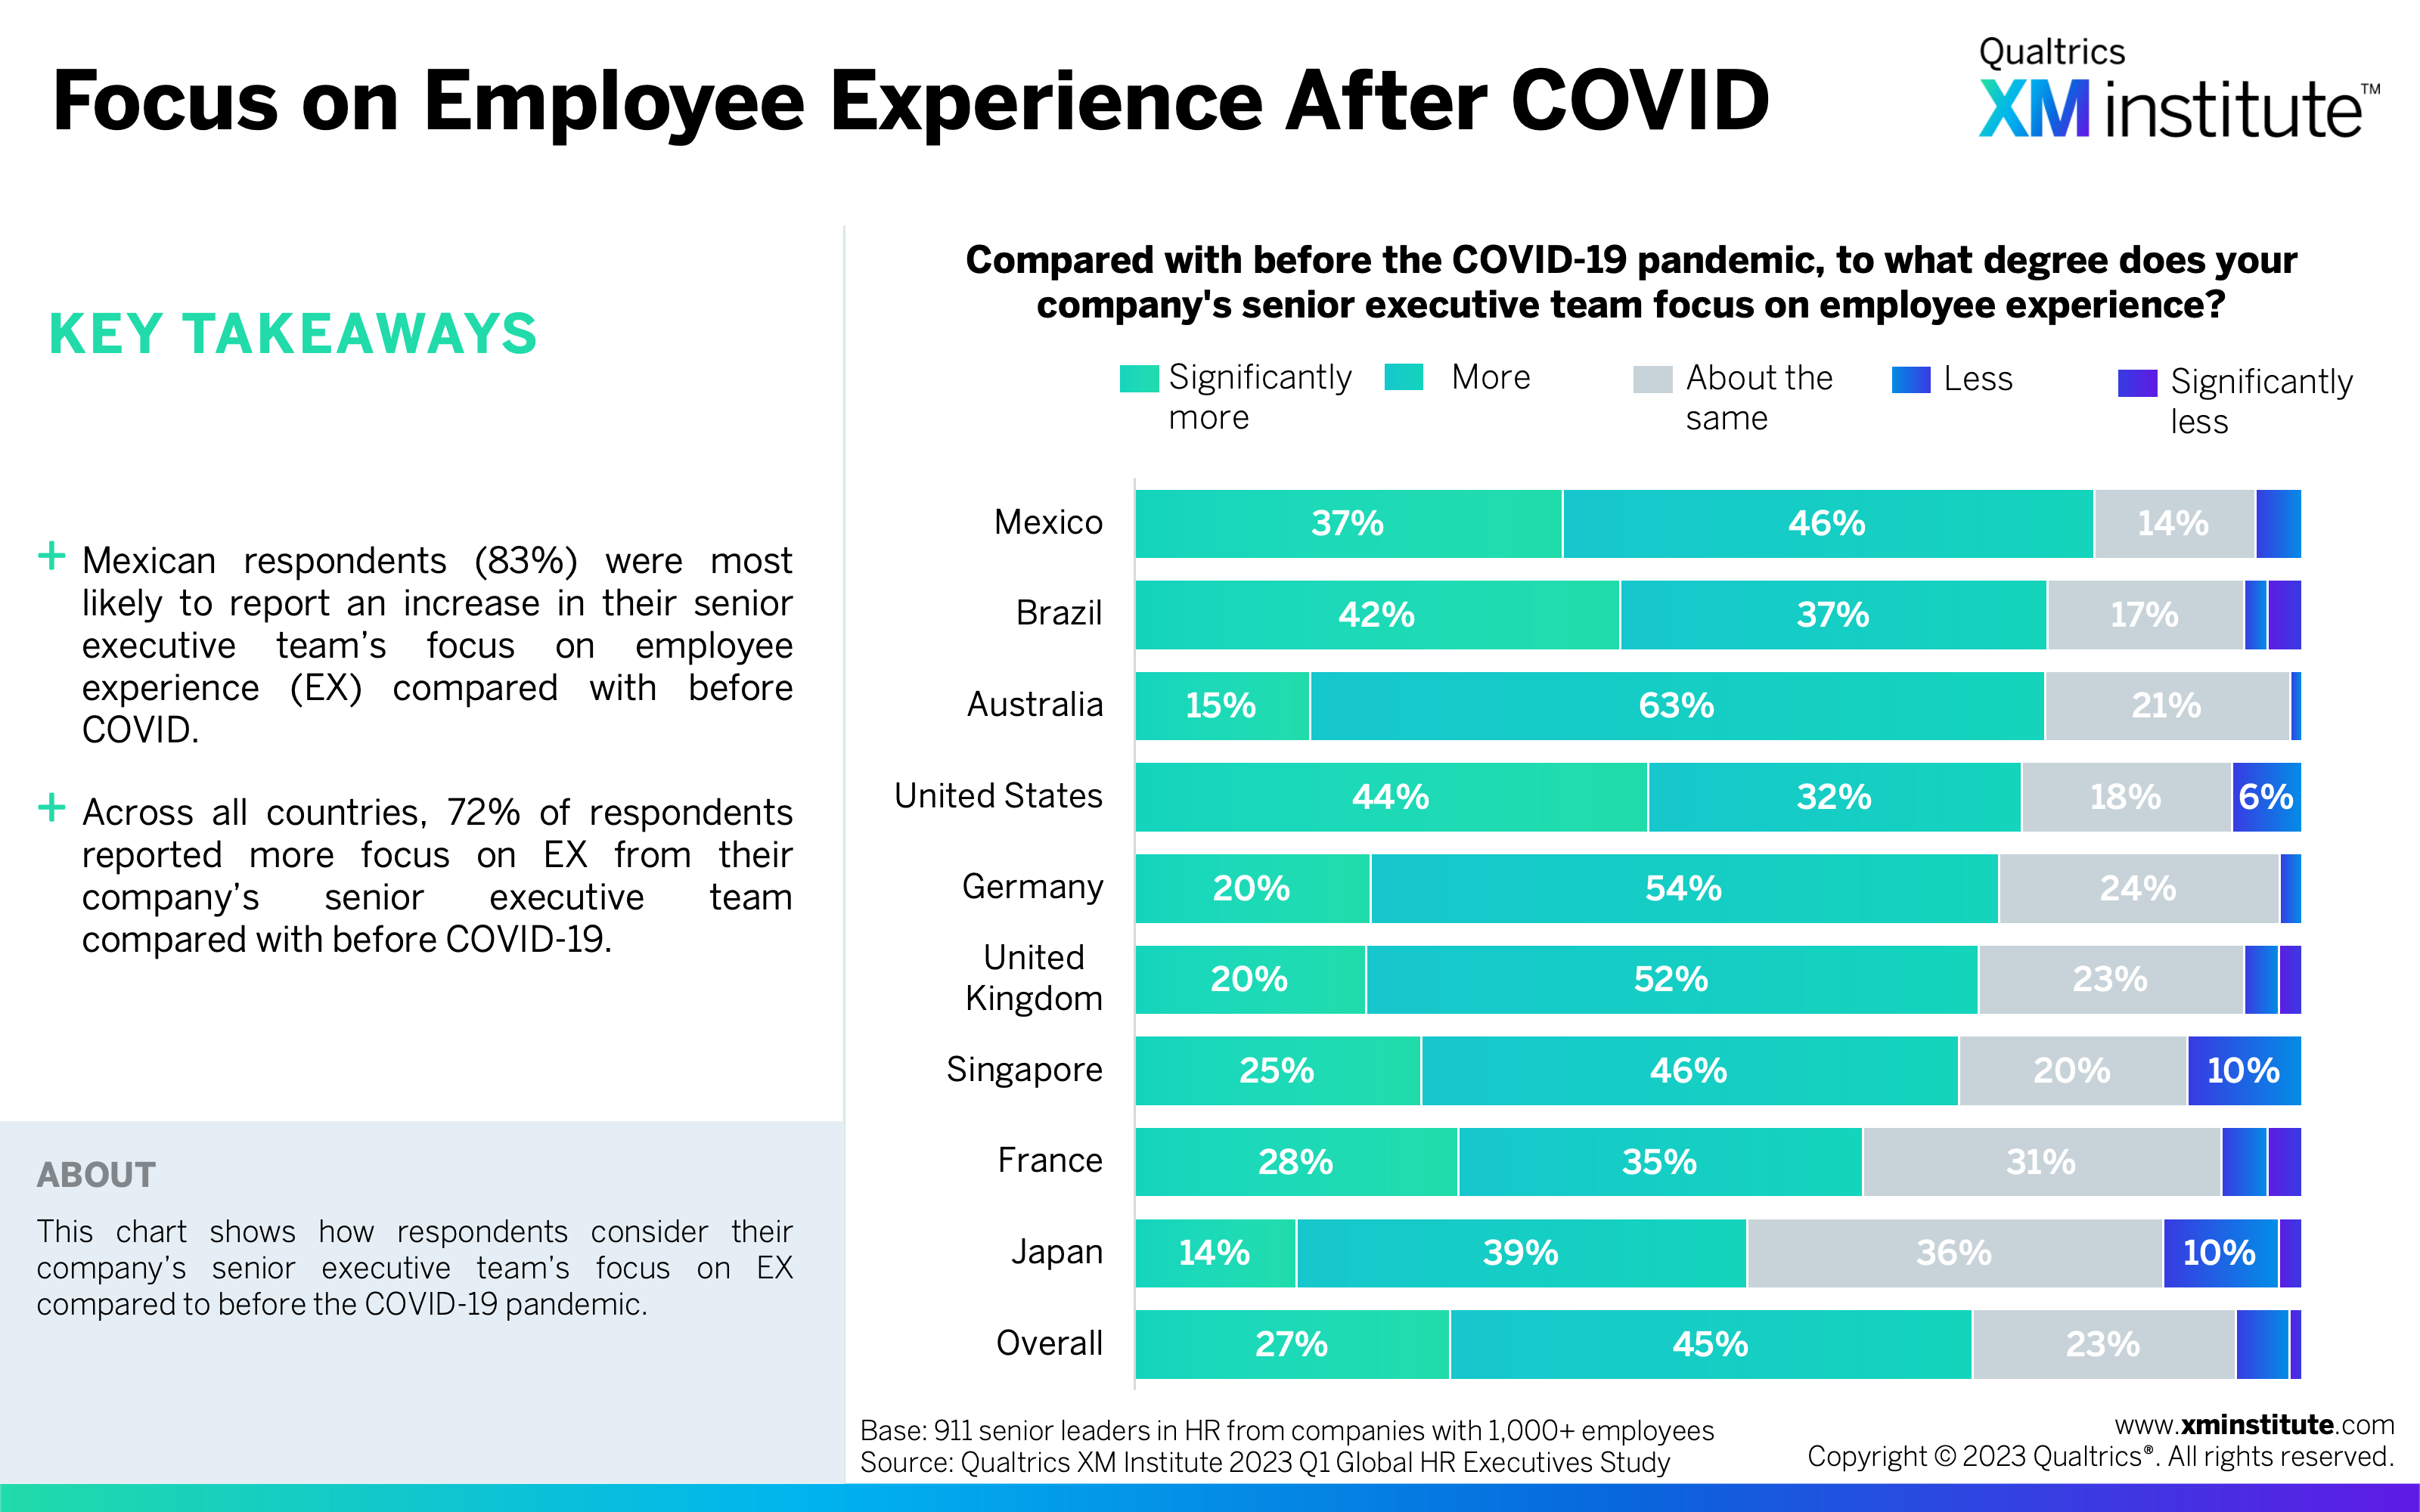
- Focus on Employee Experience After COVID (see Figure 4)
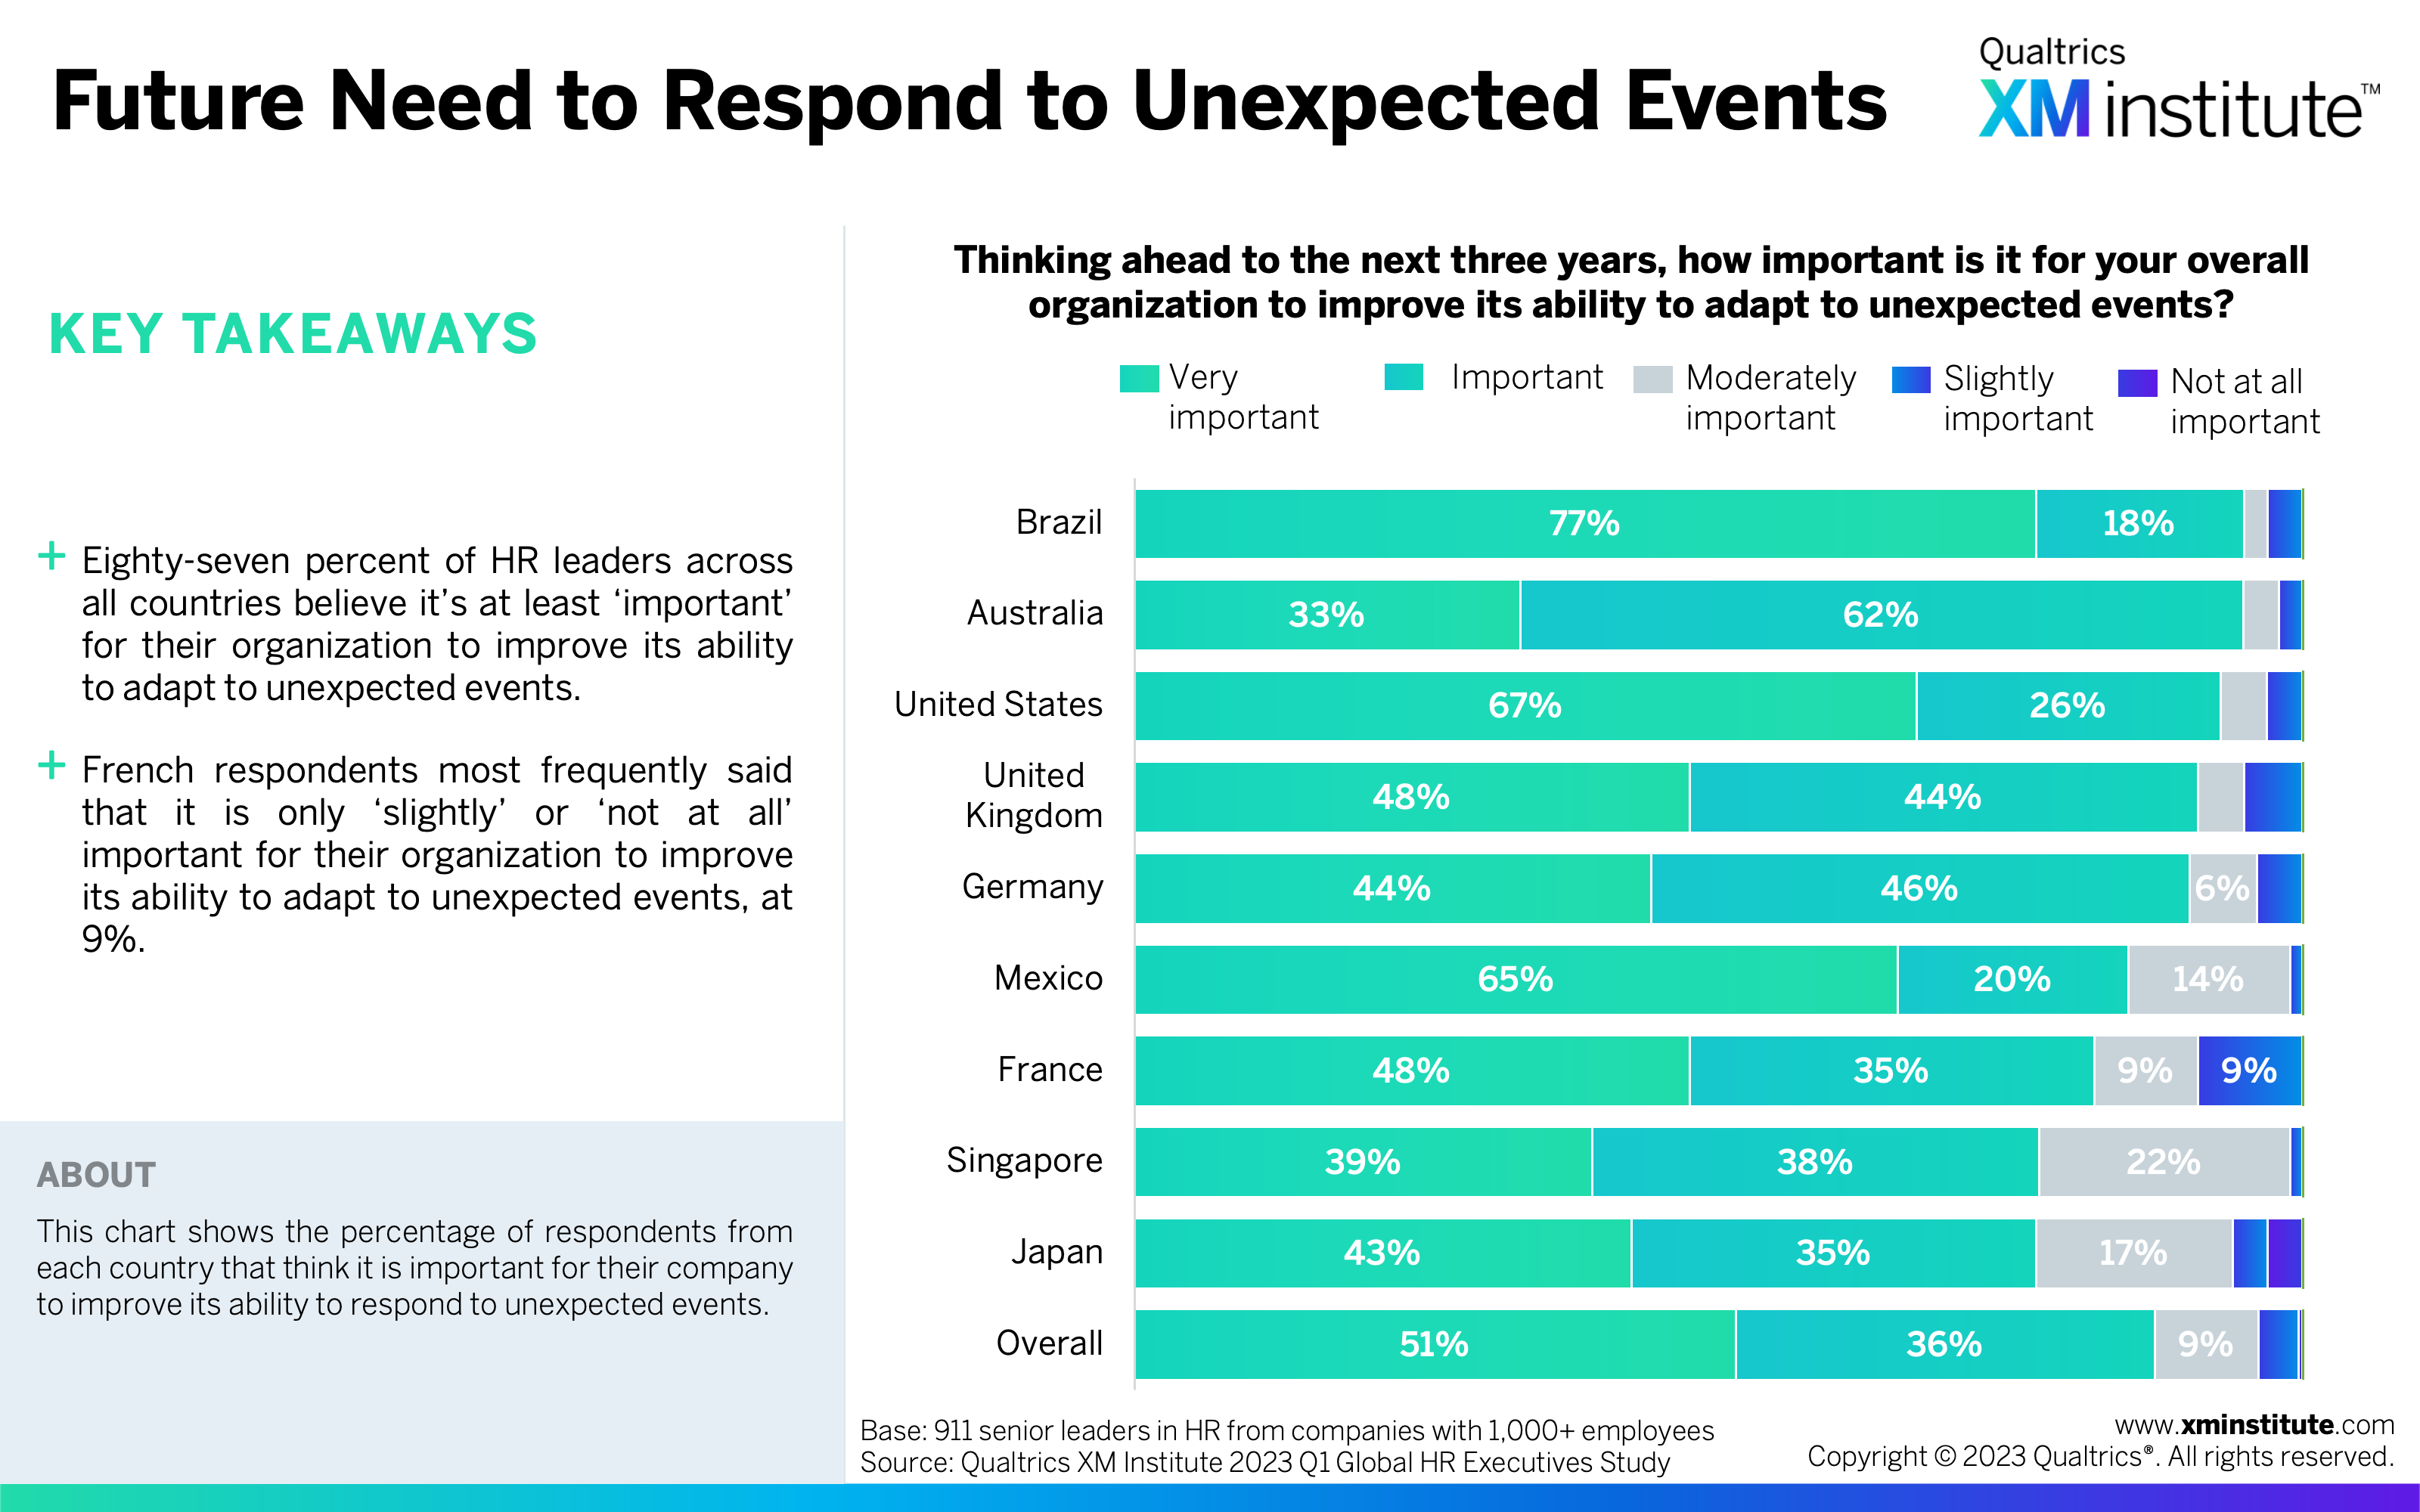
- Future Need to Respond to Unexpected Events (see Figure 5)
- Future EX Improvement (see Figure 6)
- EX Management Technological Capabilities (see Figure 7)
- EX Management Culture Capabilities (see Figure 8)
- EX Management Skills and Capabilities (see Figure 9)
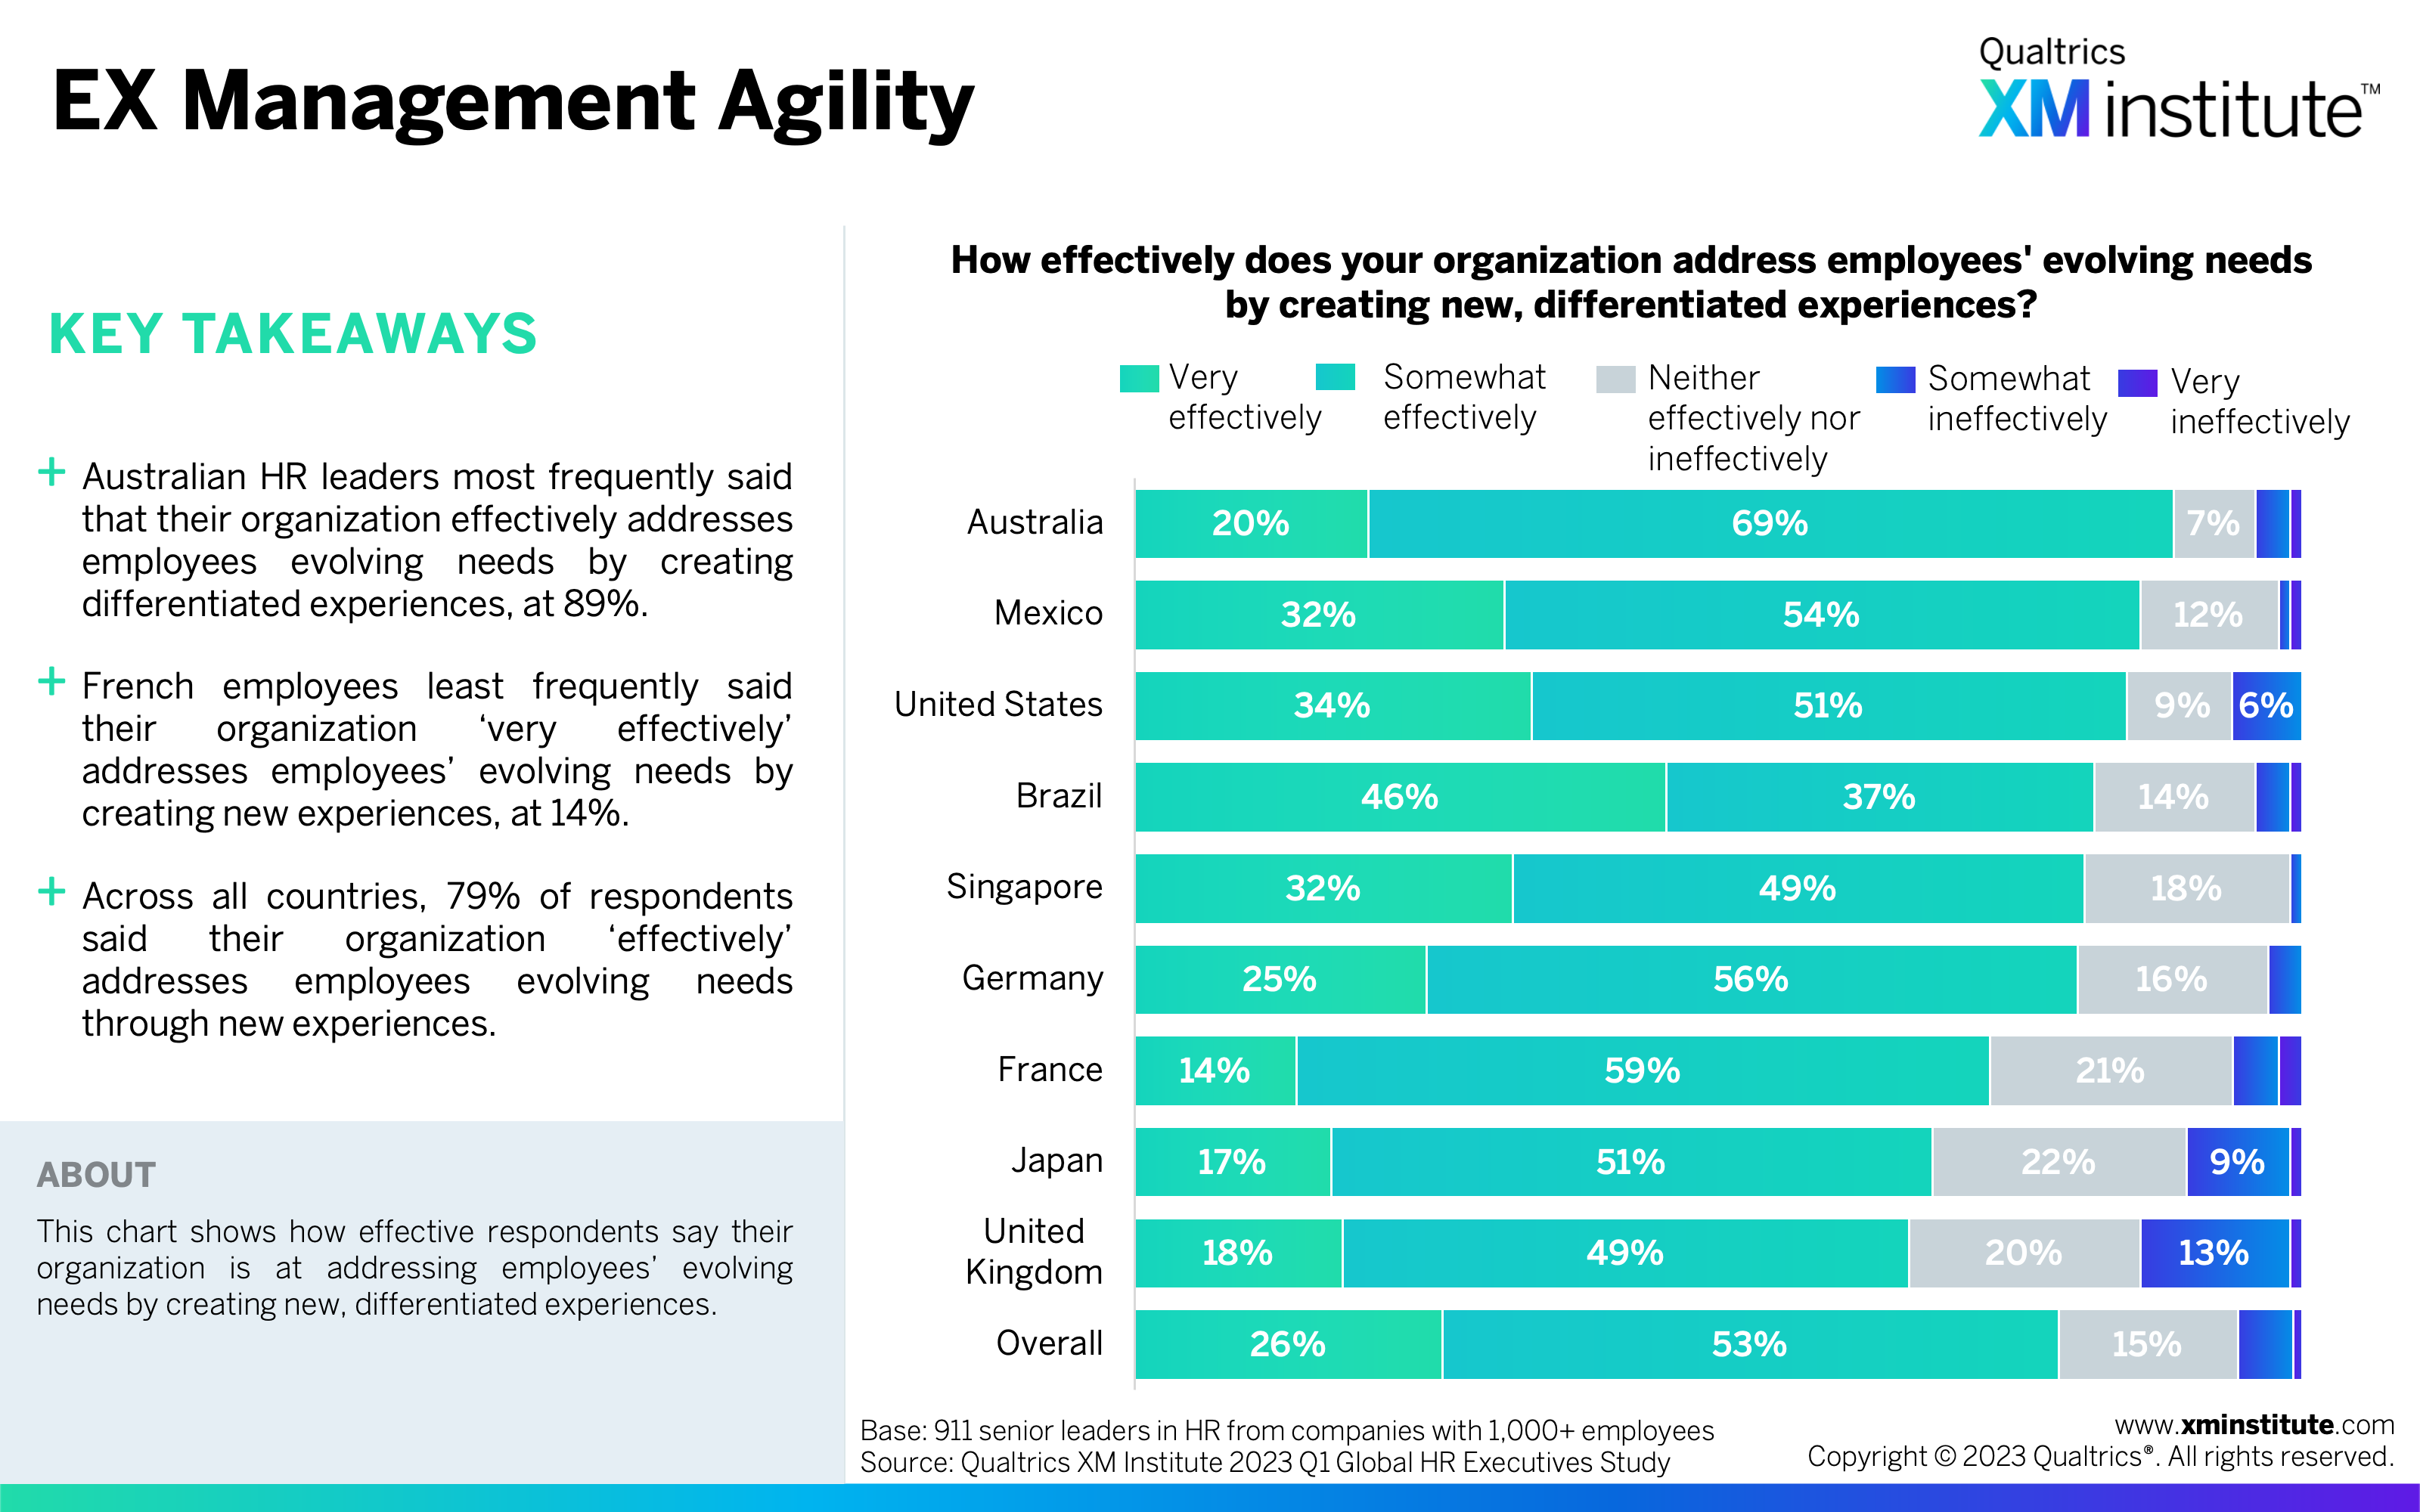
- EX Management Agility (see Figure 10)
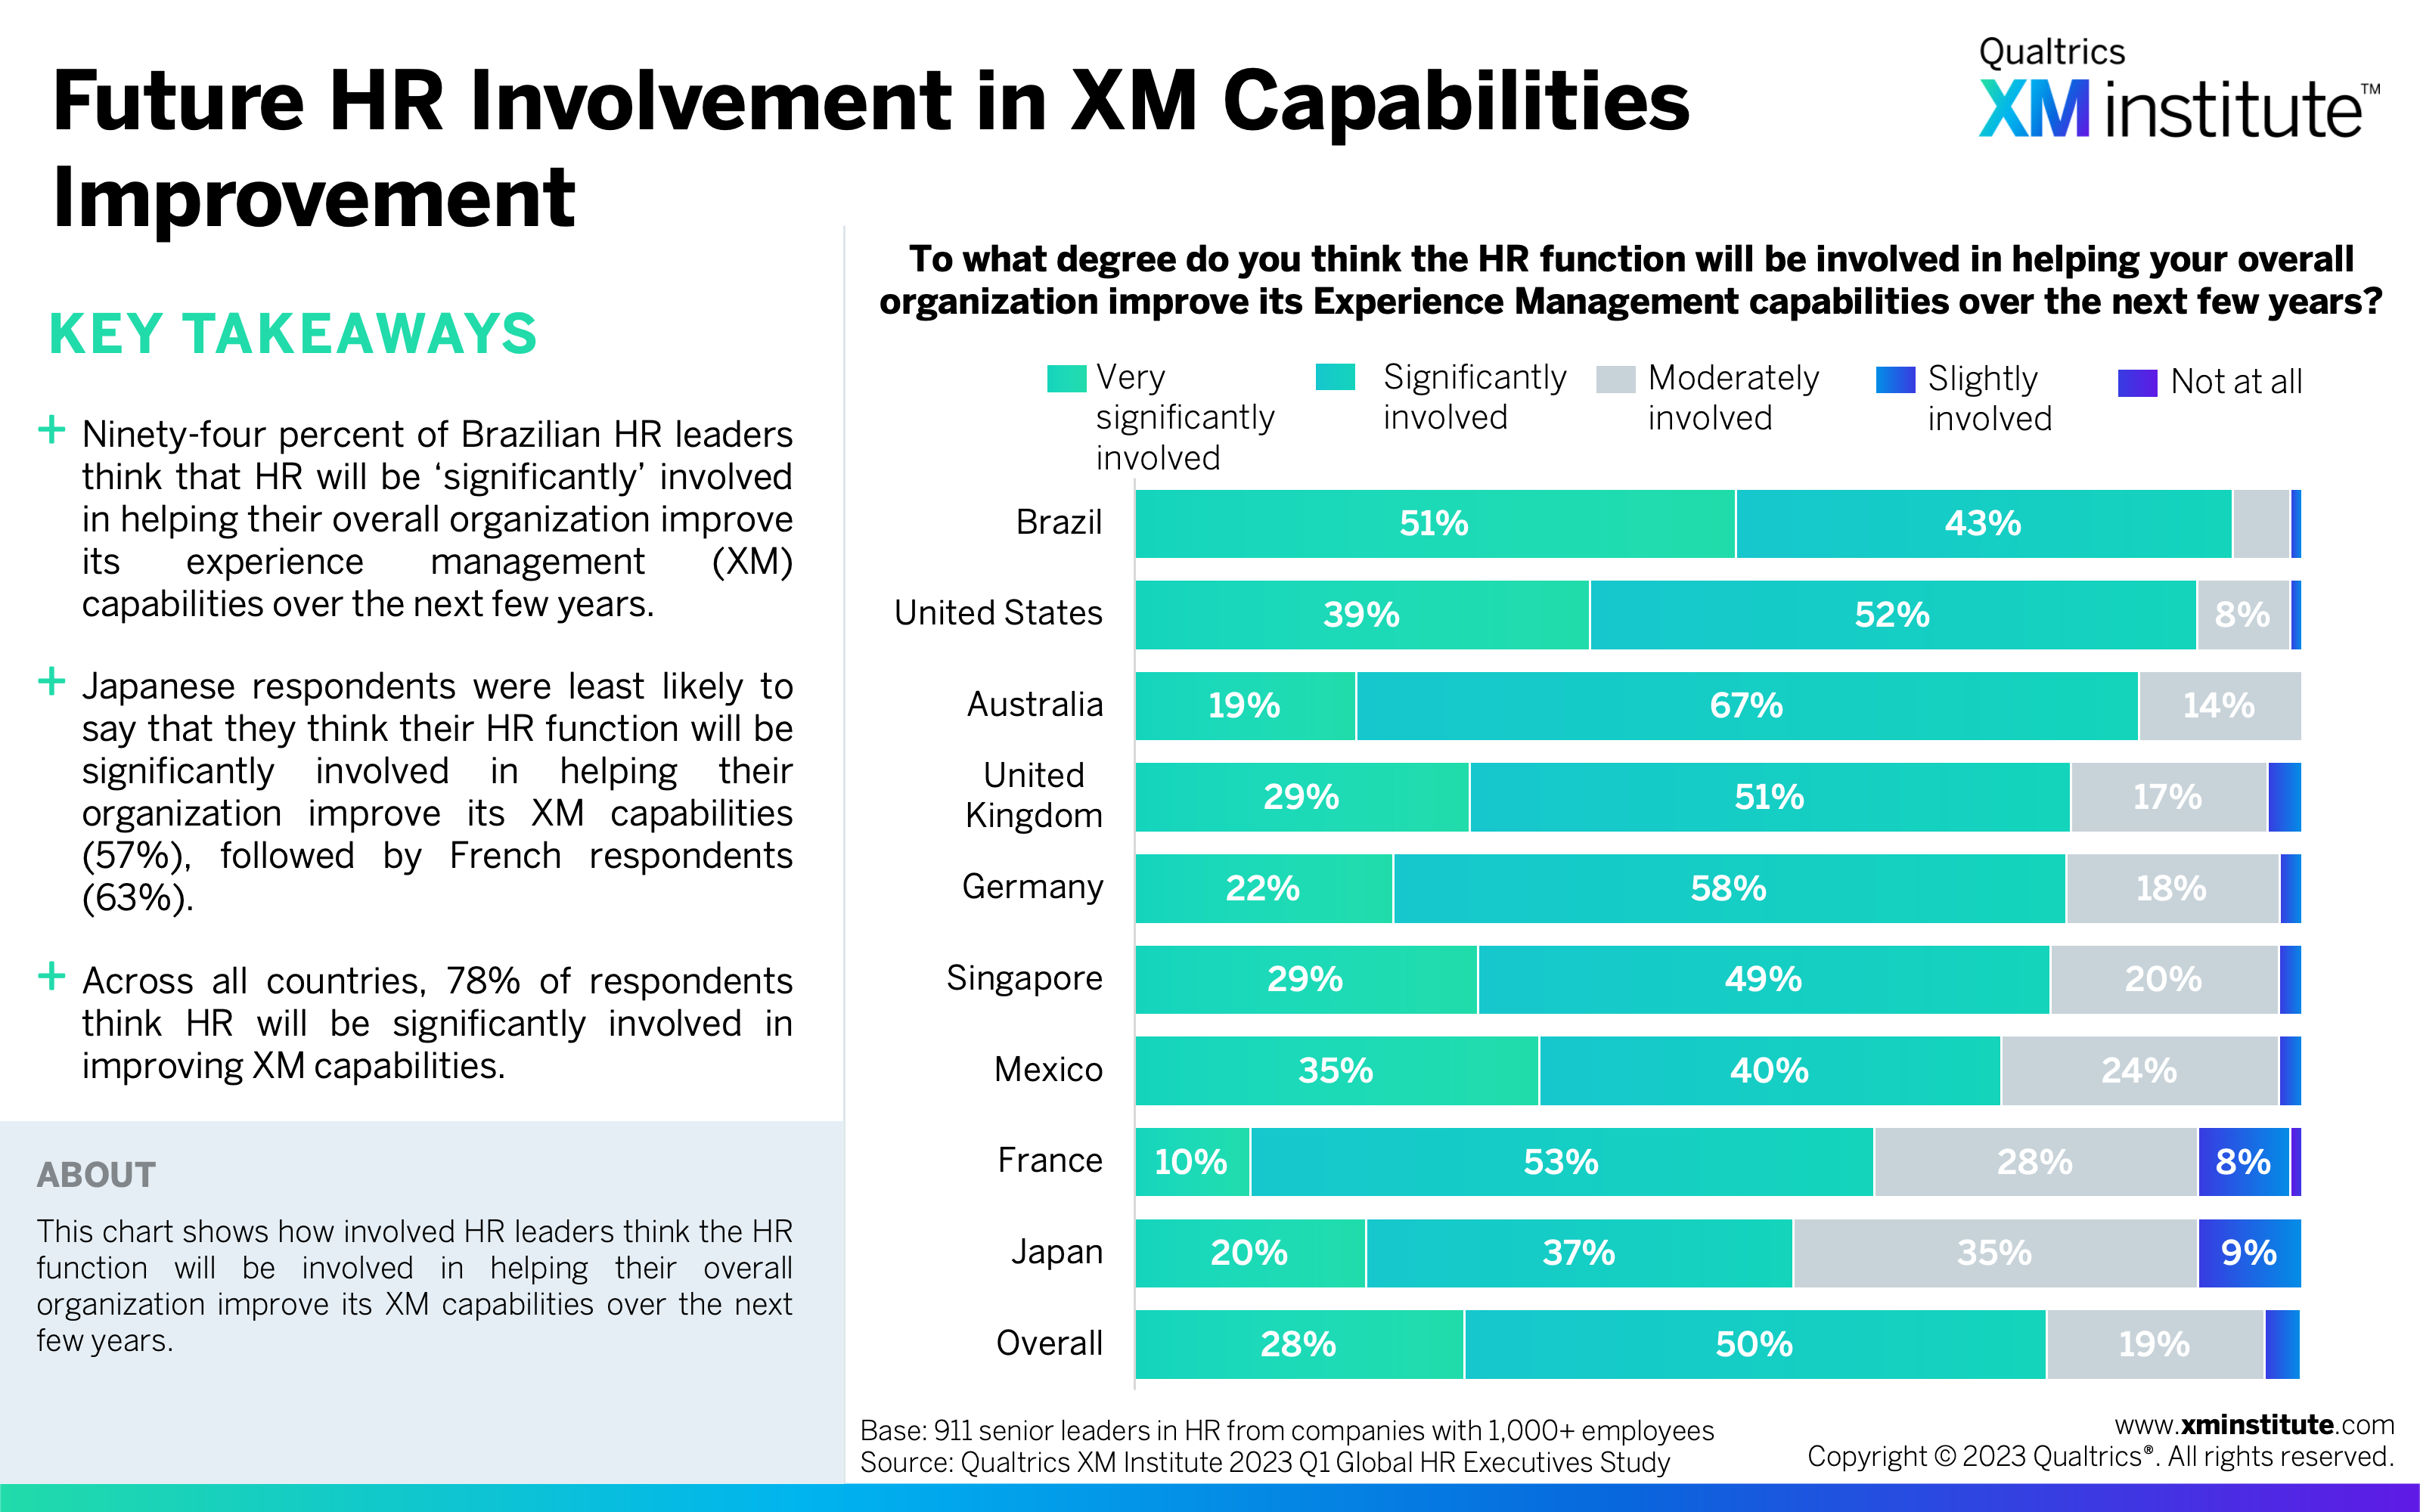
- Future HR Involvement in XM Capabilities (see Figure 11)
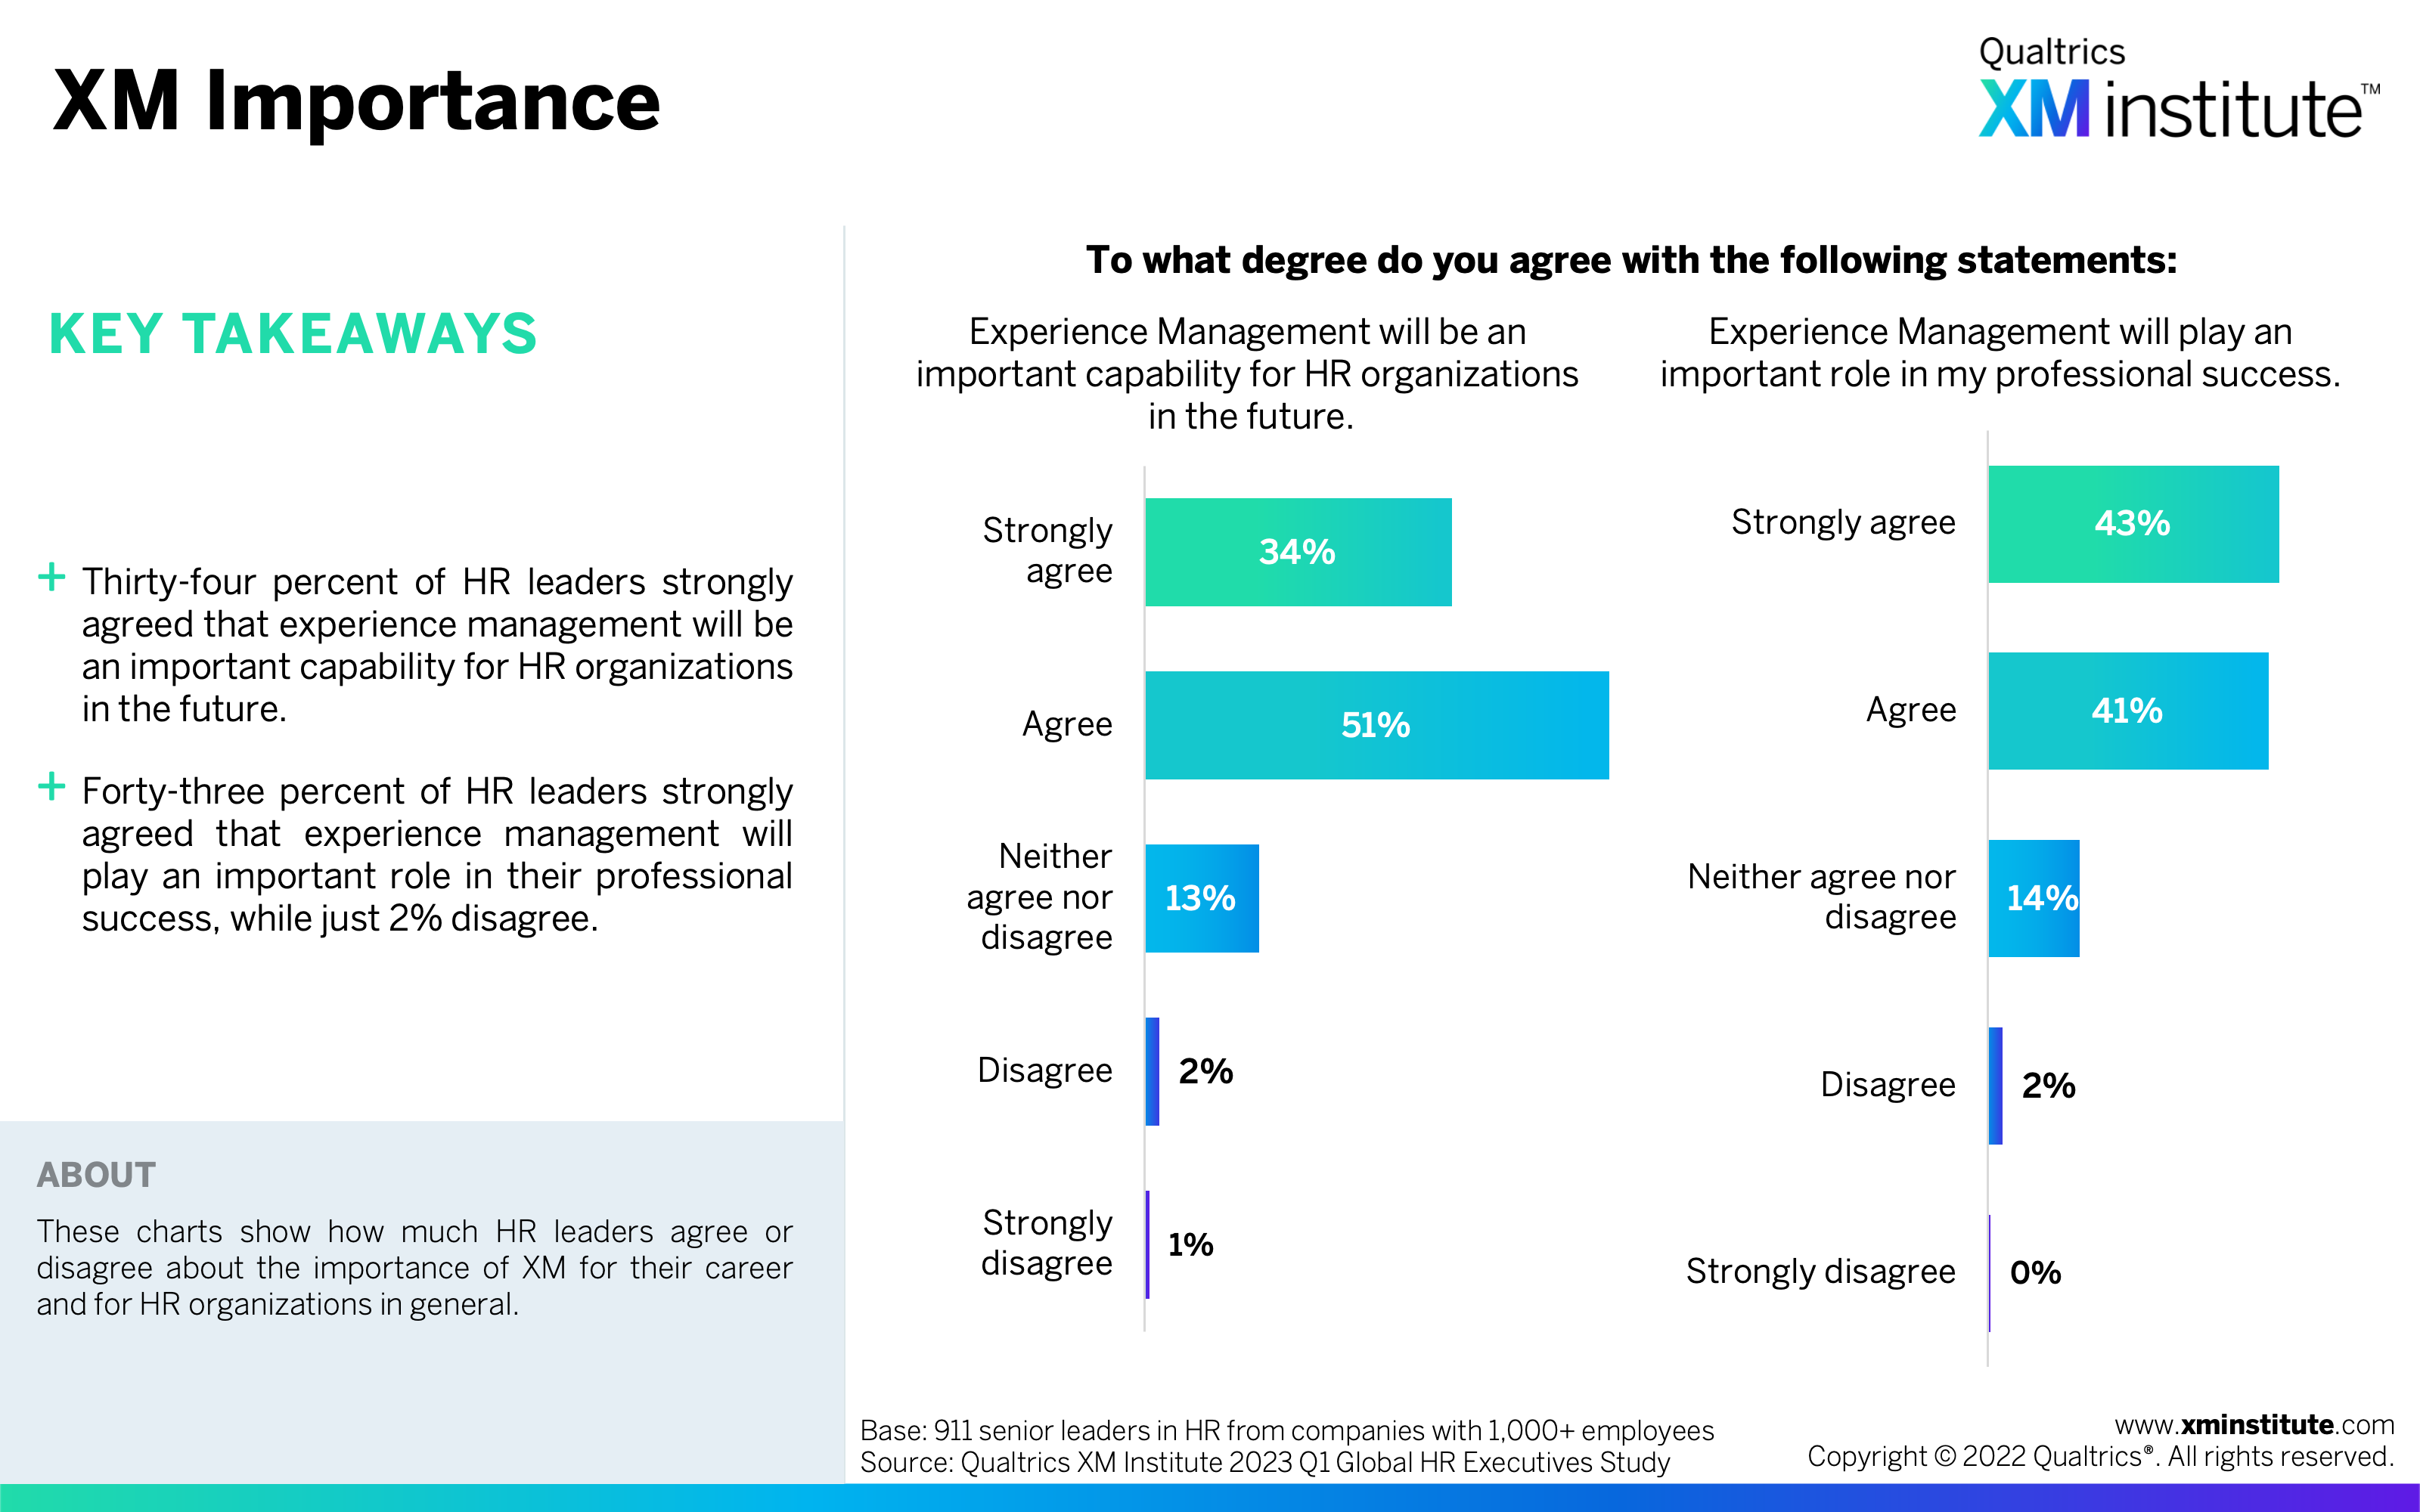
- XM Importance (see Figure 12)
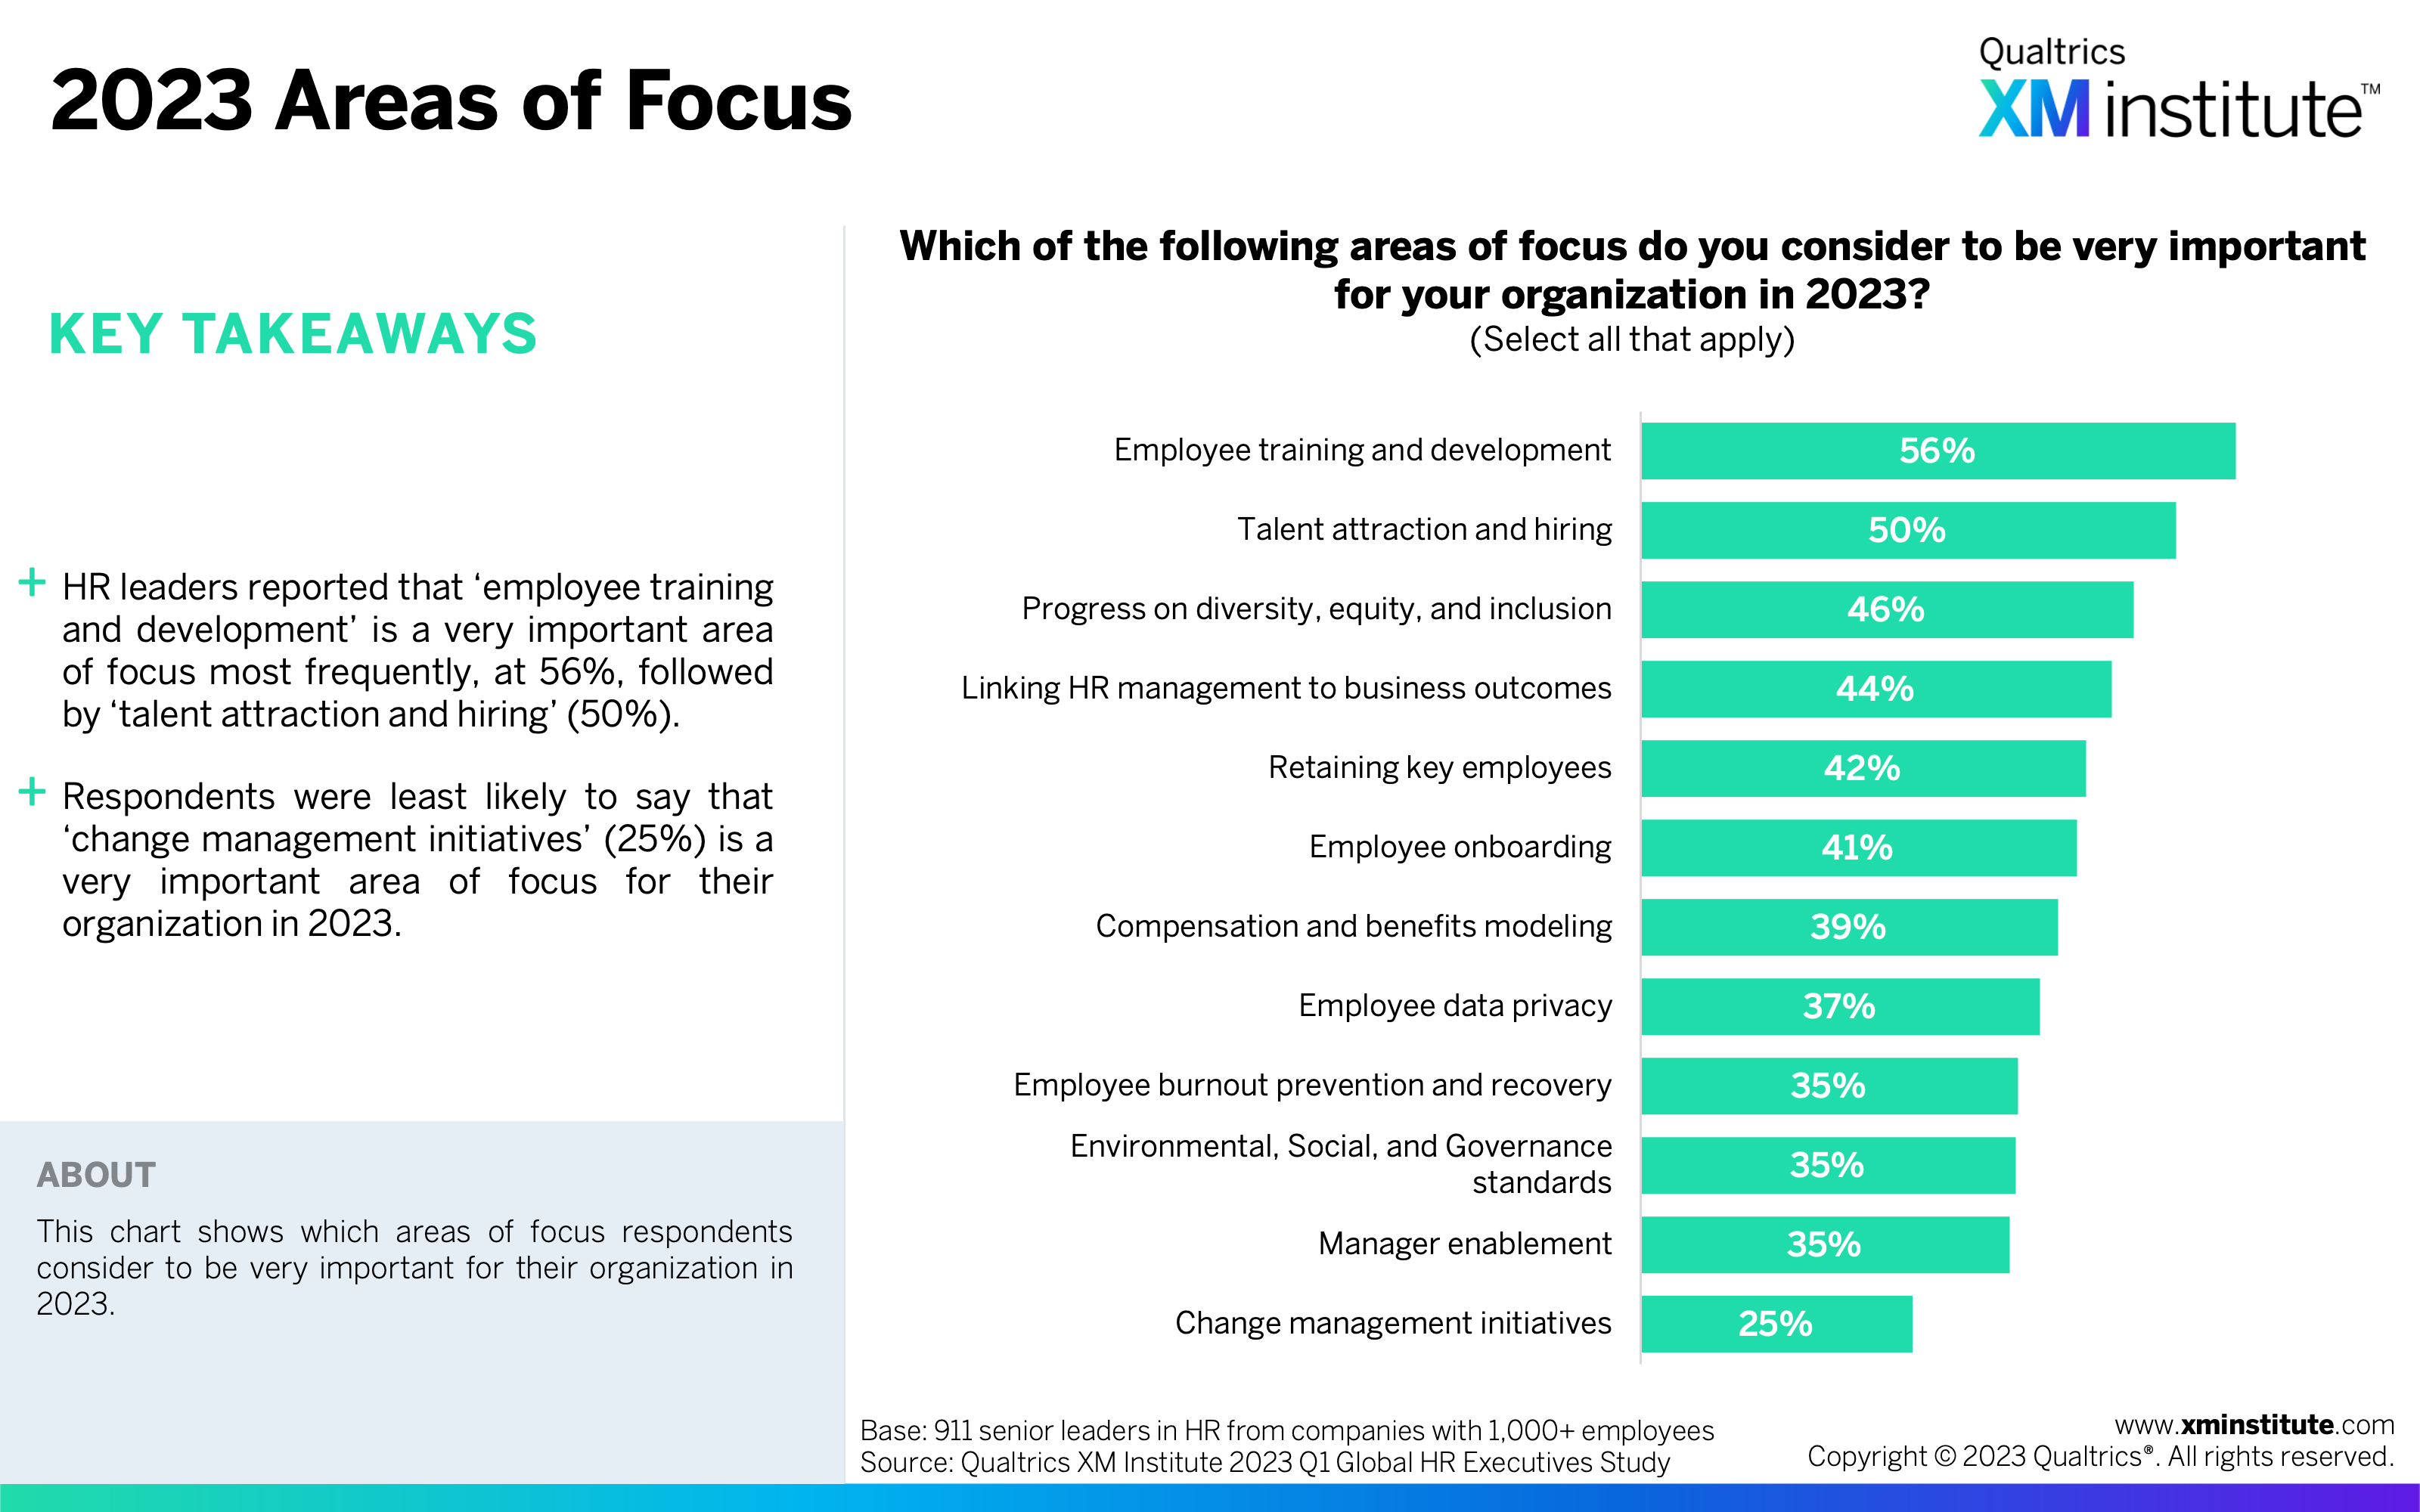
- 2023 Areas of Focus (see Figure 13)
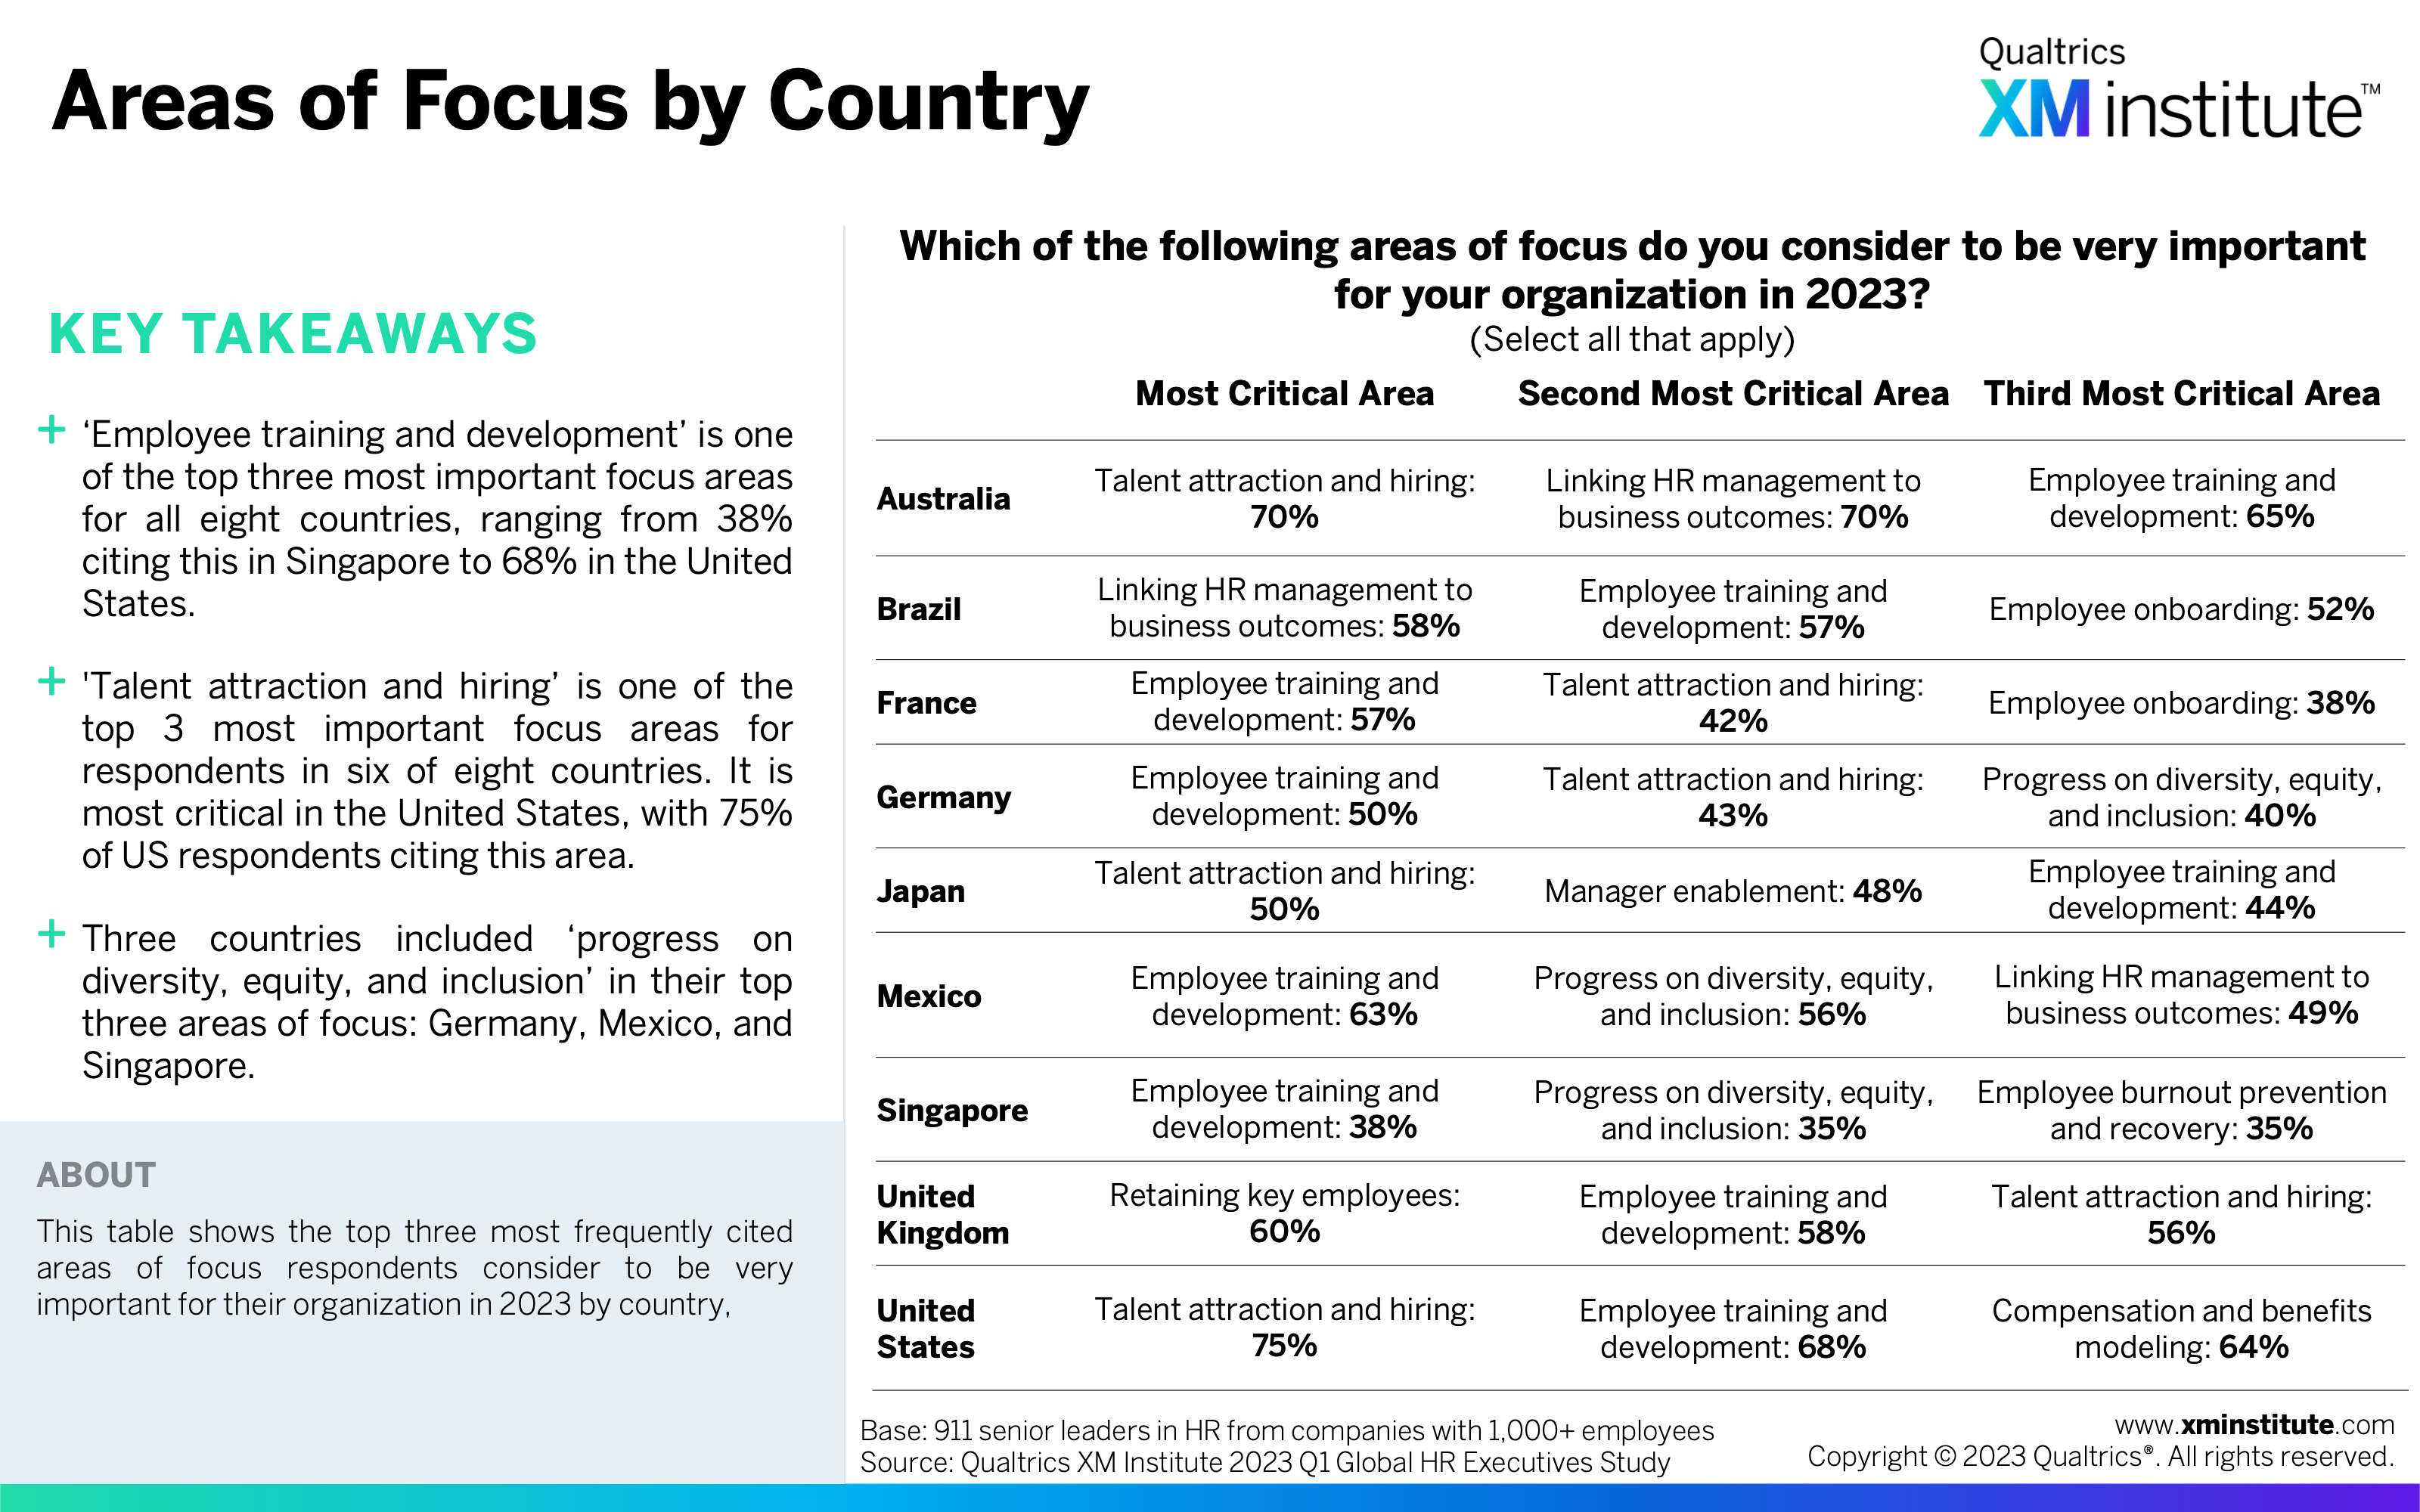
- Areas of Focus by Country (see Figure 14)
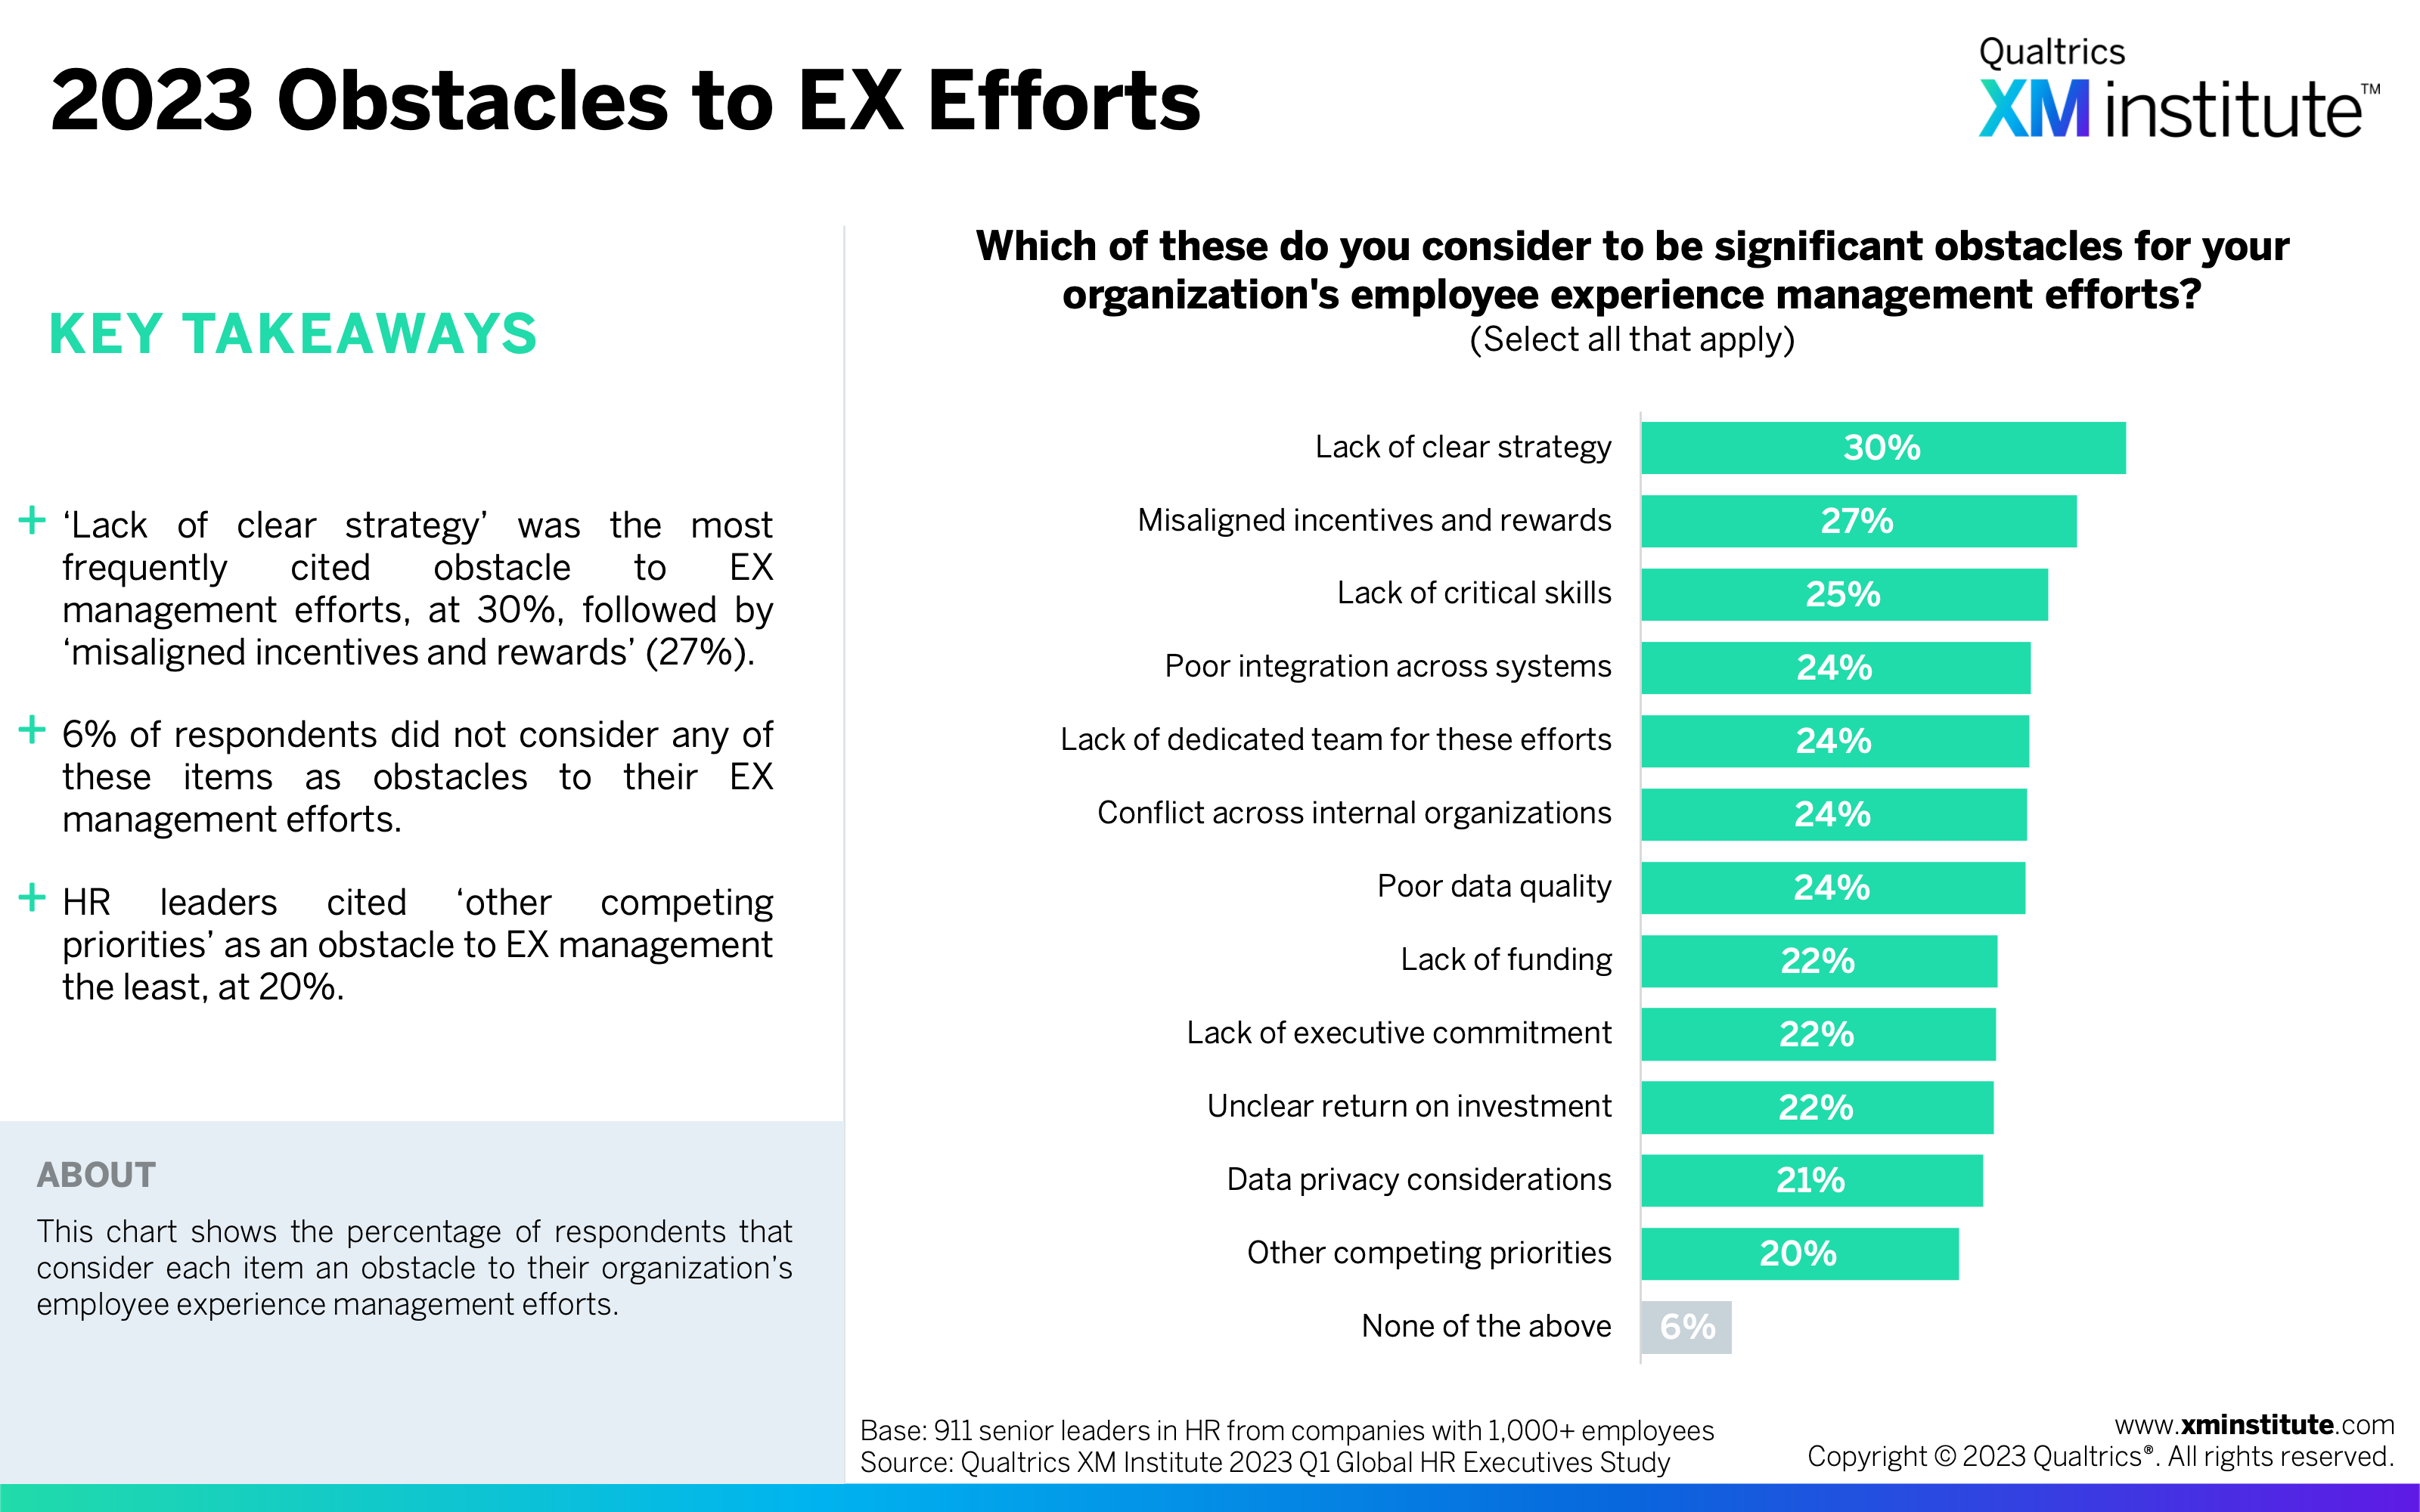
- 2023 Obstacles to EX Efforts (see Figure 15)
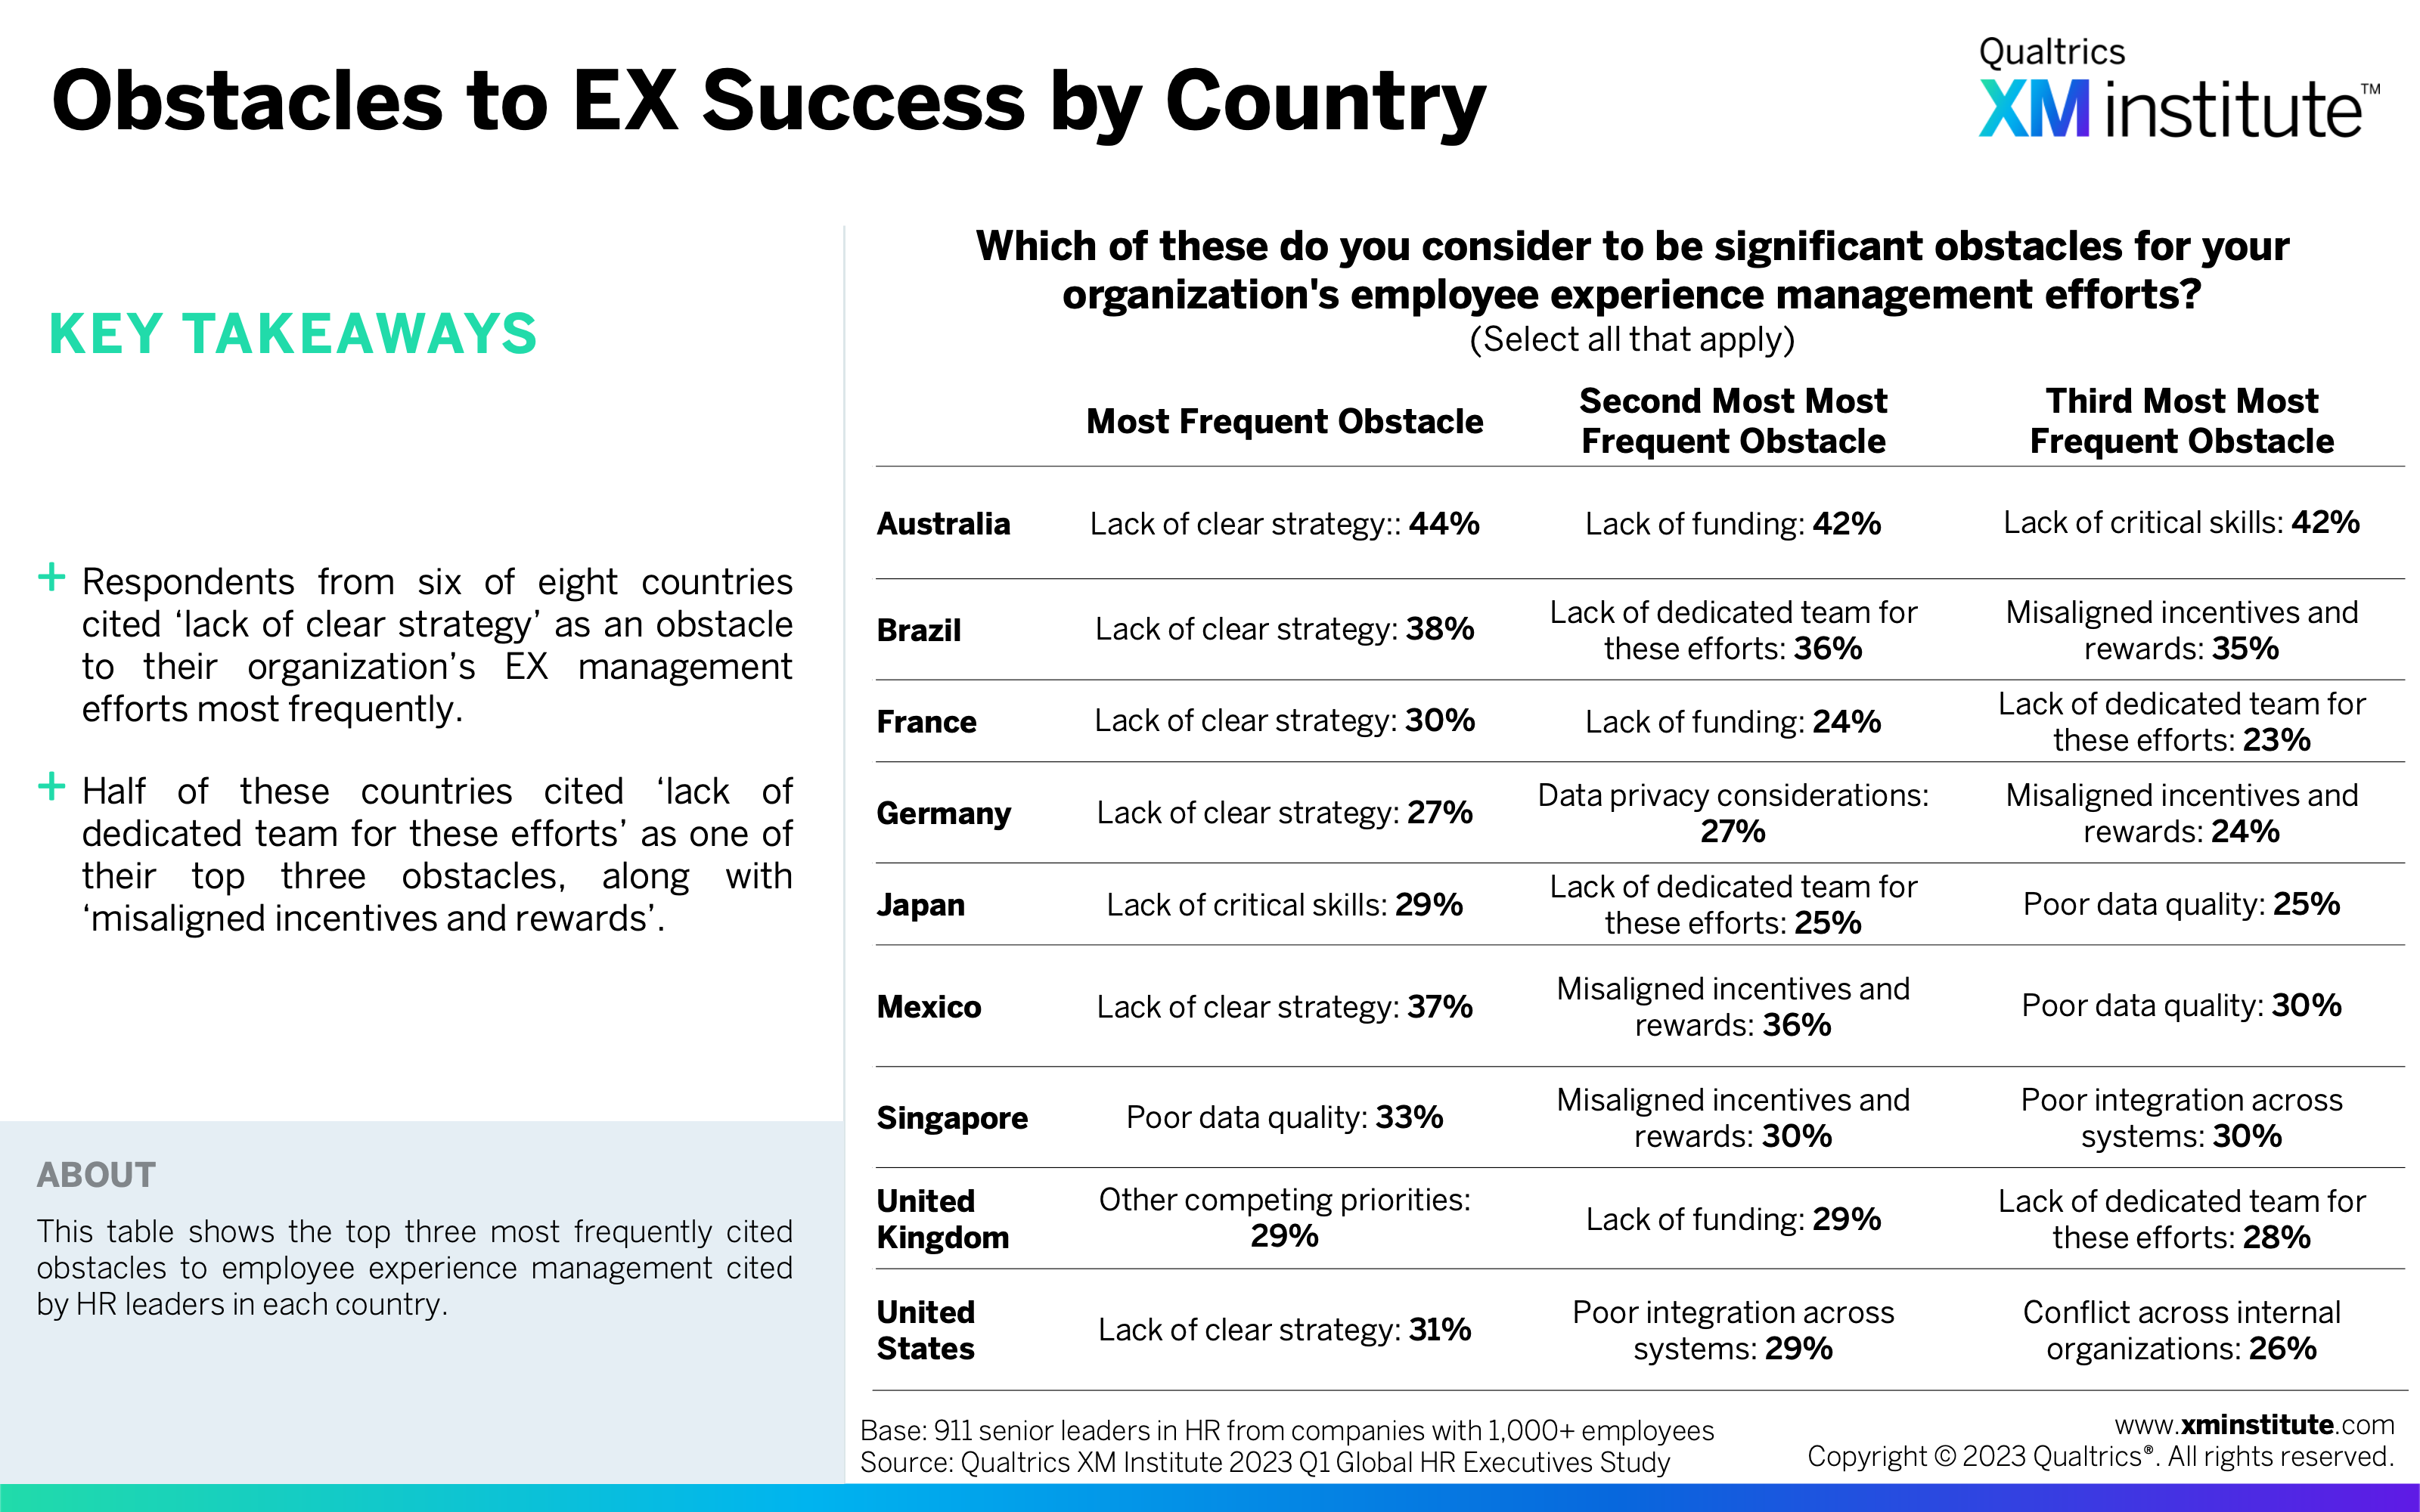
- Obstacles to EX Success by Country (see Figure 16)
- Value of Connecting Employee and Customer Experience (see Figure 17)
- Effectiveness at Connecting Employee and Customer Experience (see Figure 18)
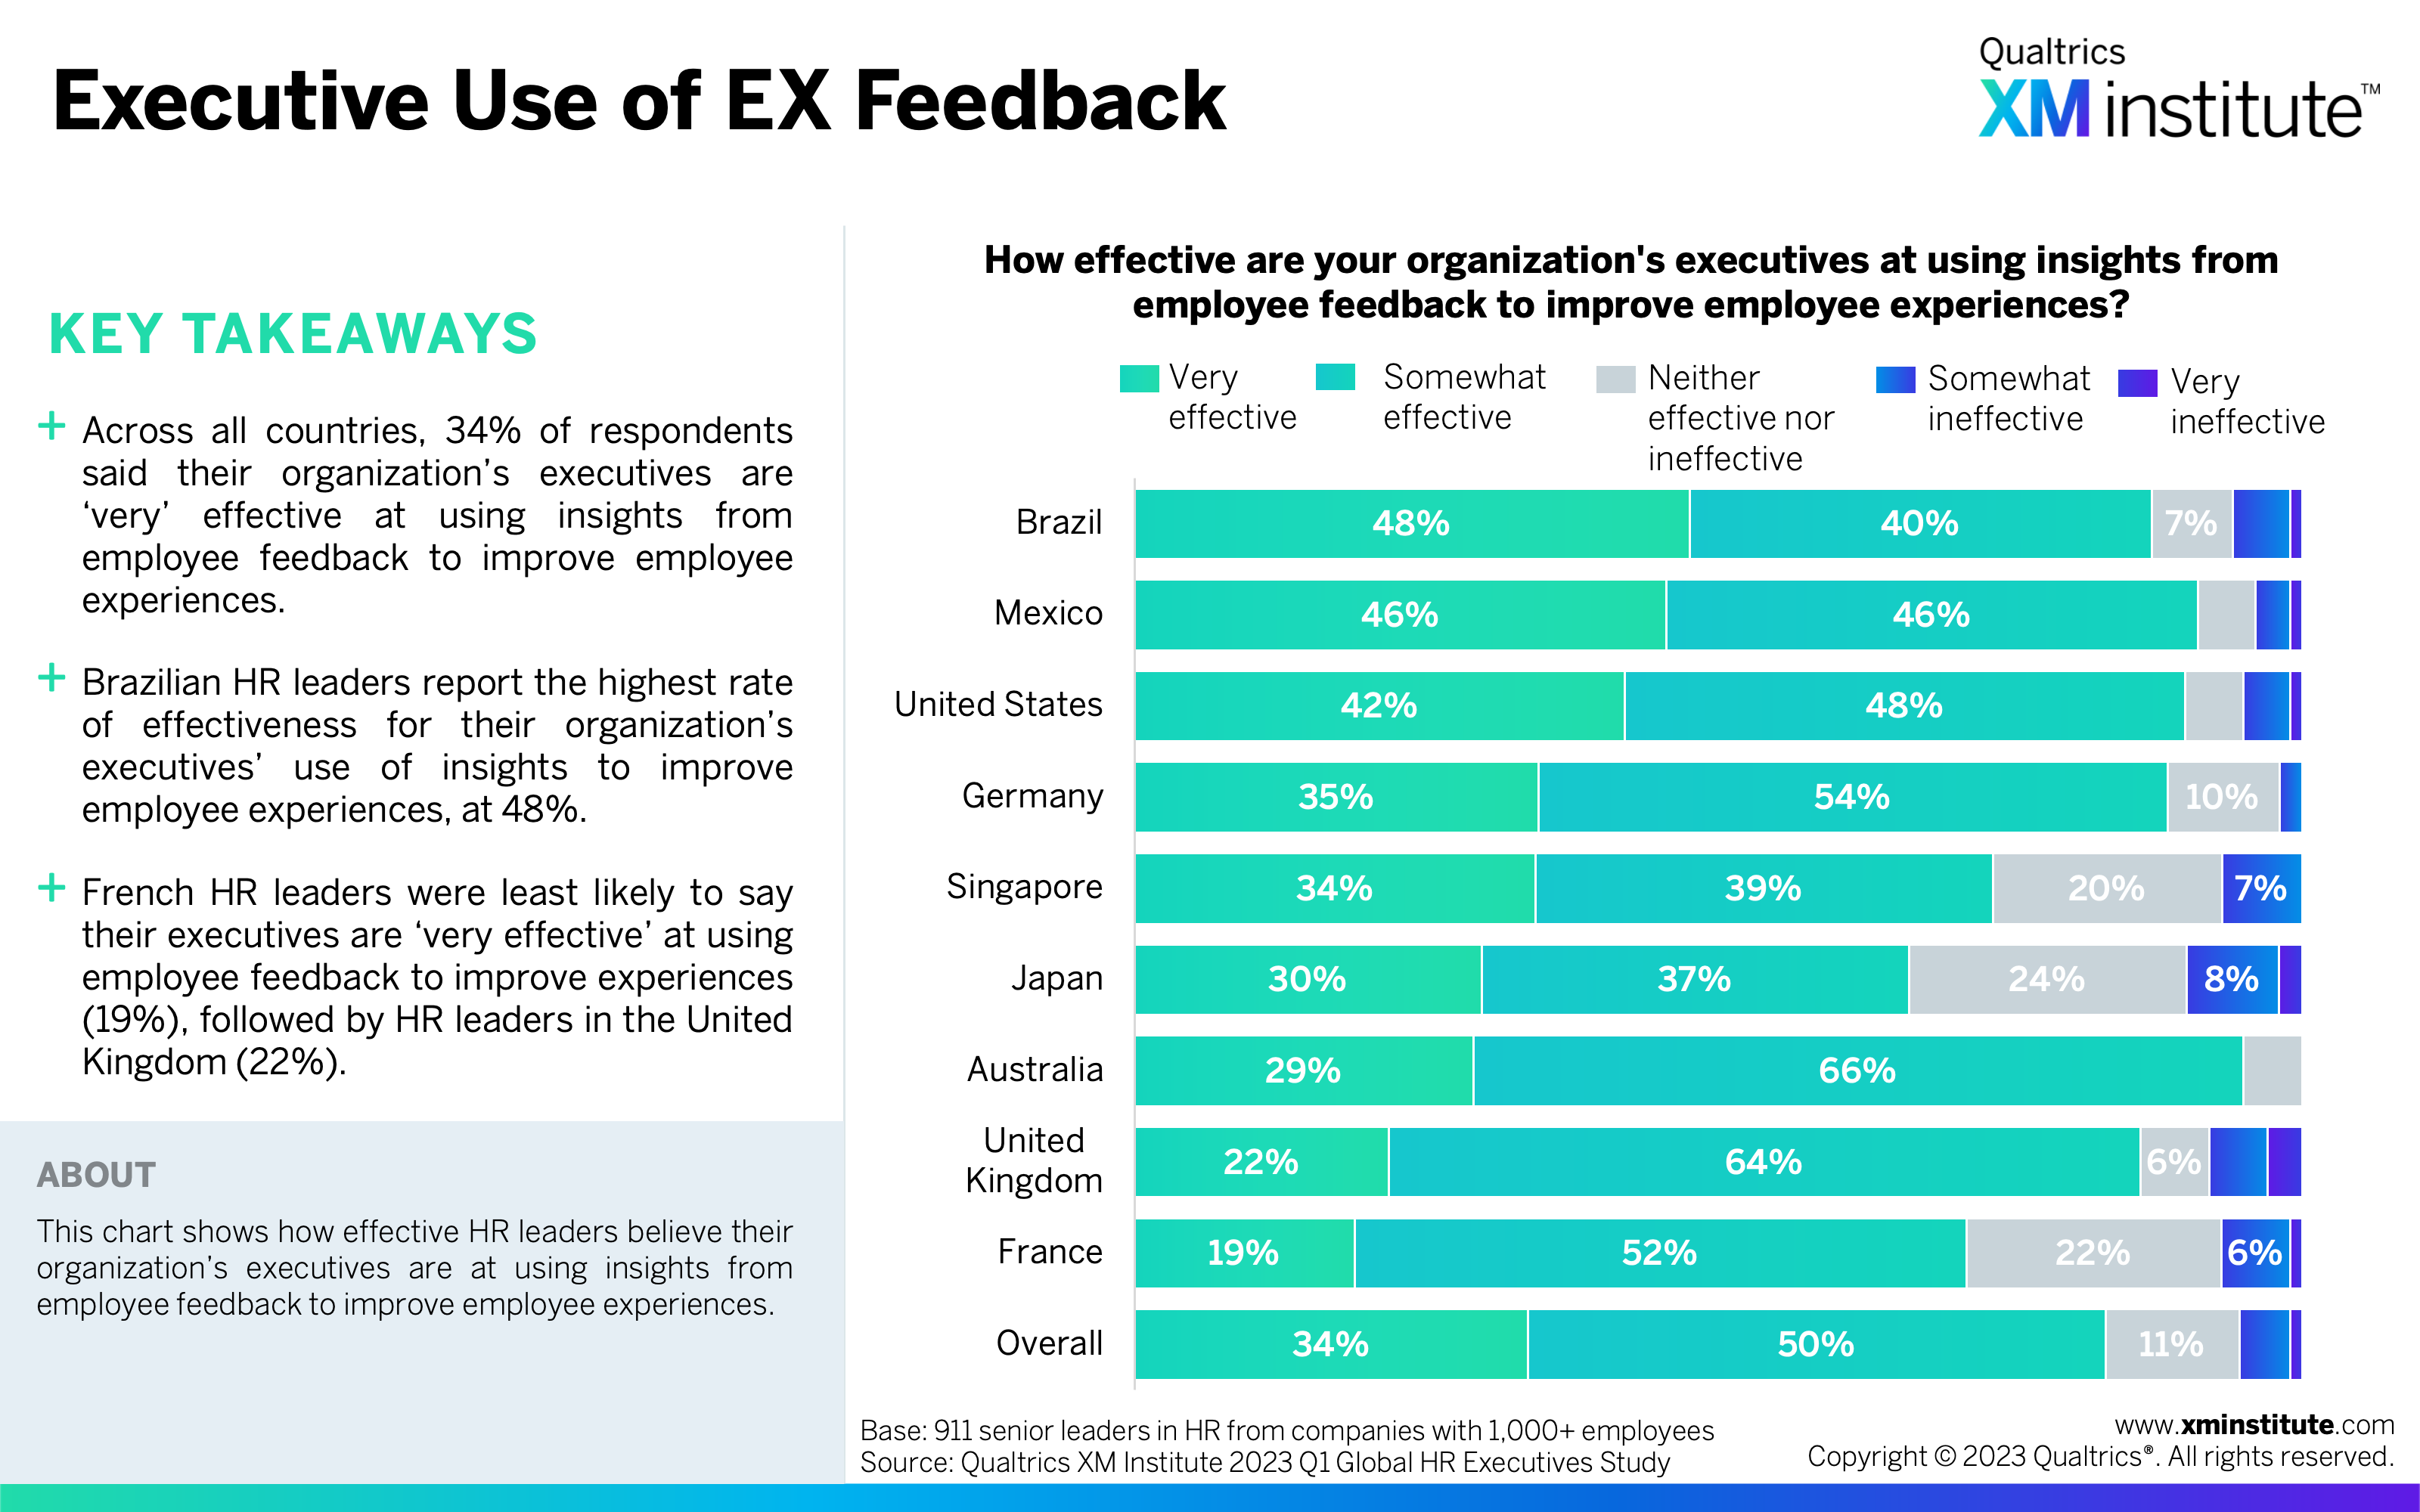
- Executive Use of EX Feedback (see Figure 19)
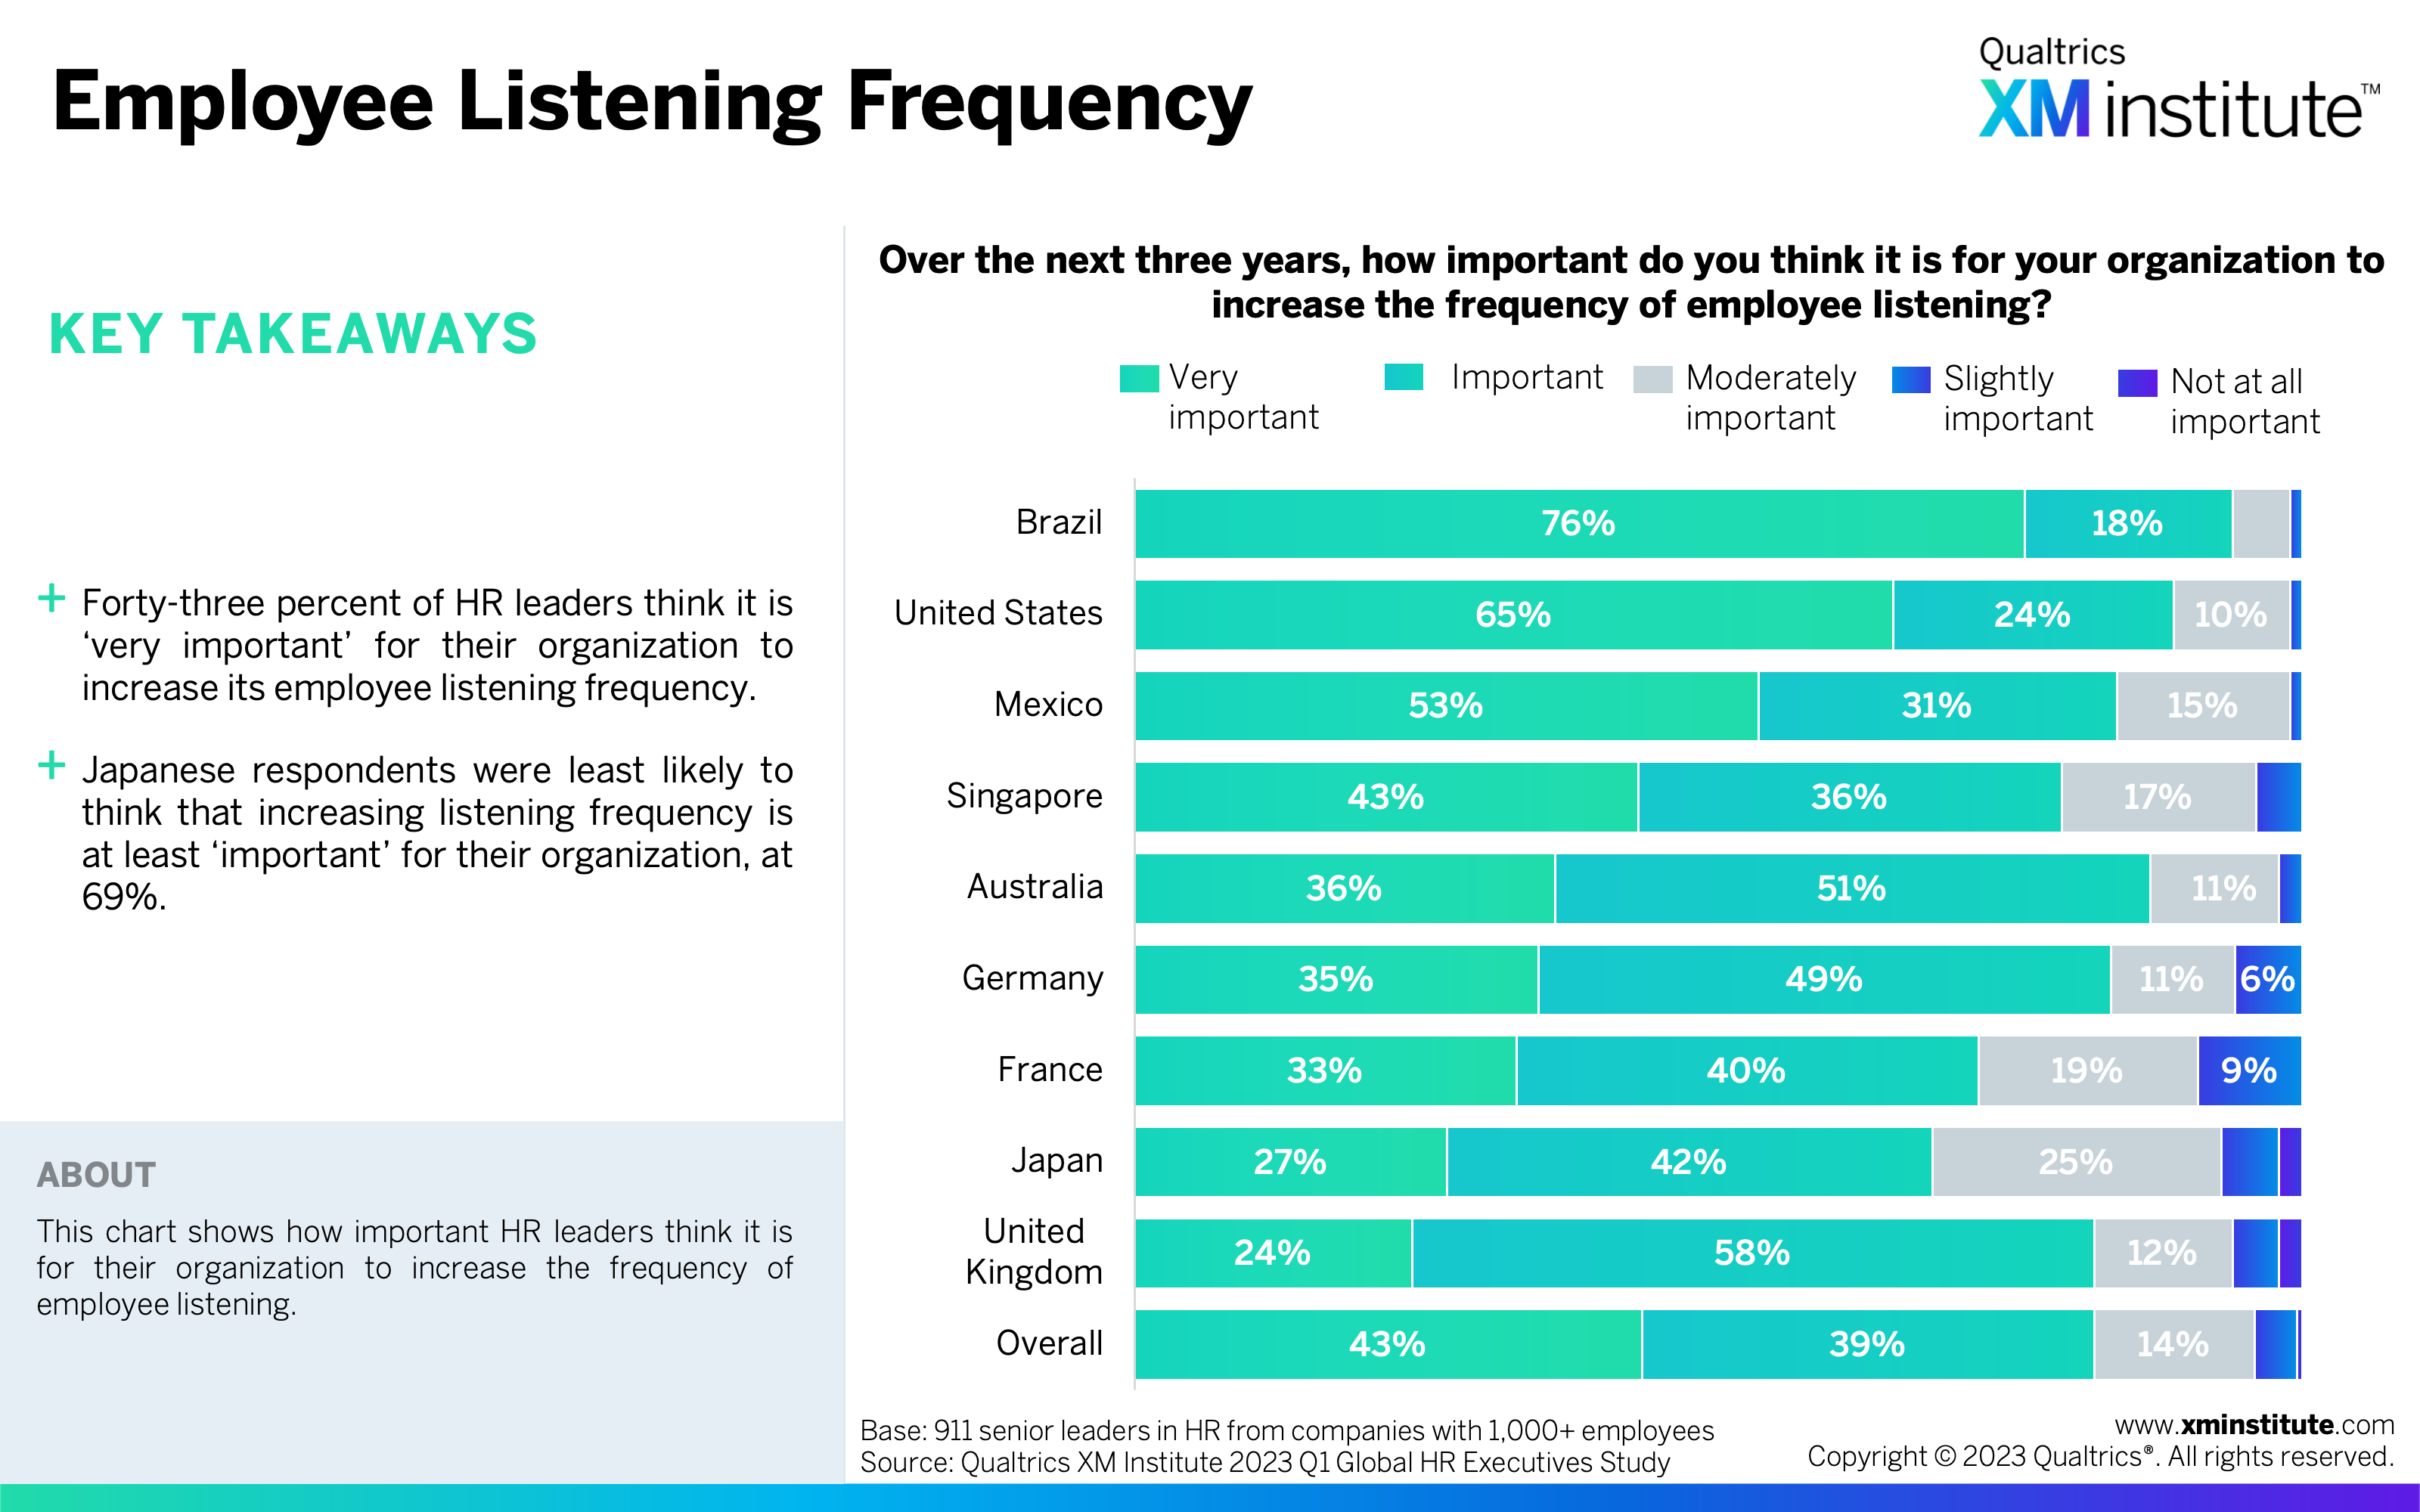
- Employee Listening Frequency (see Figure 20)
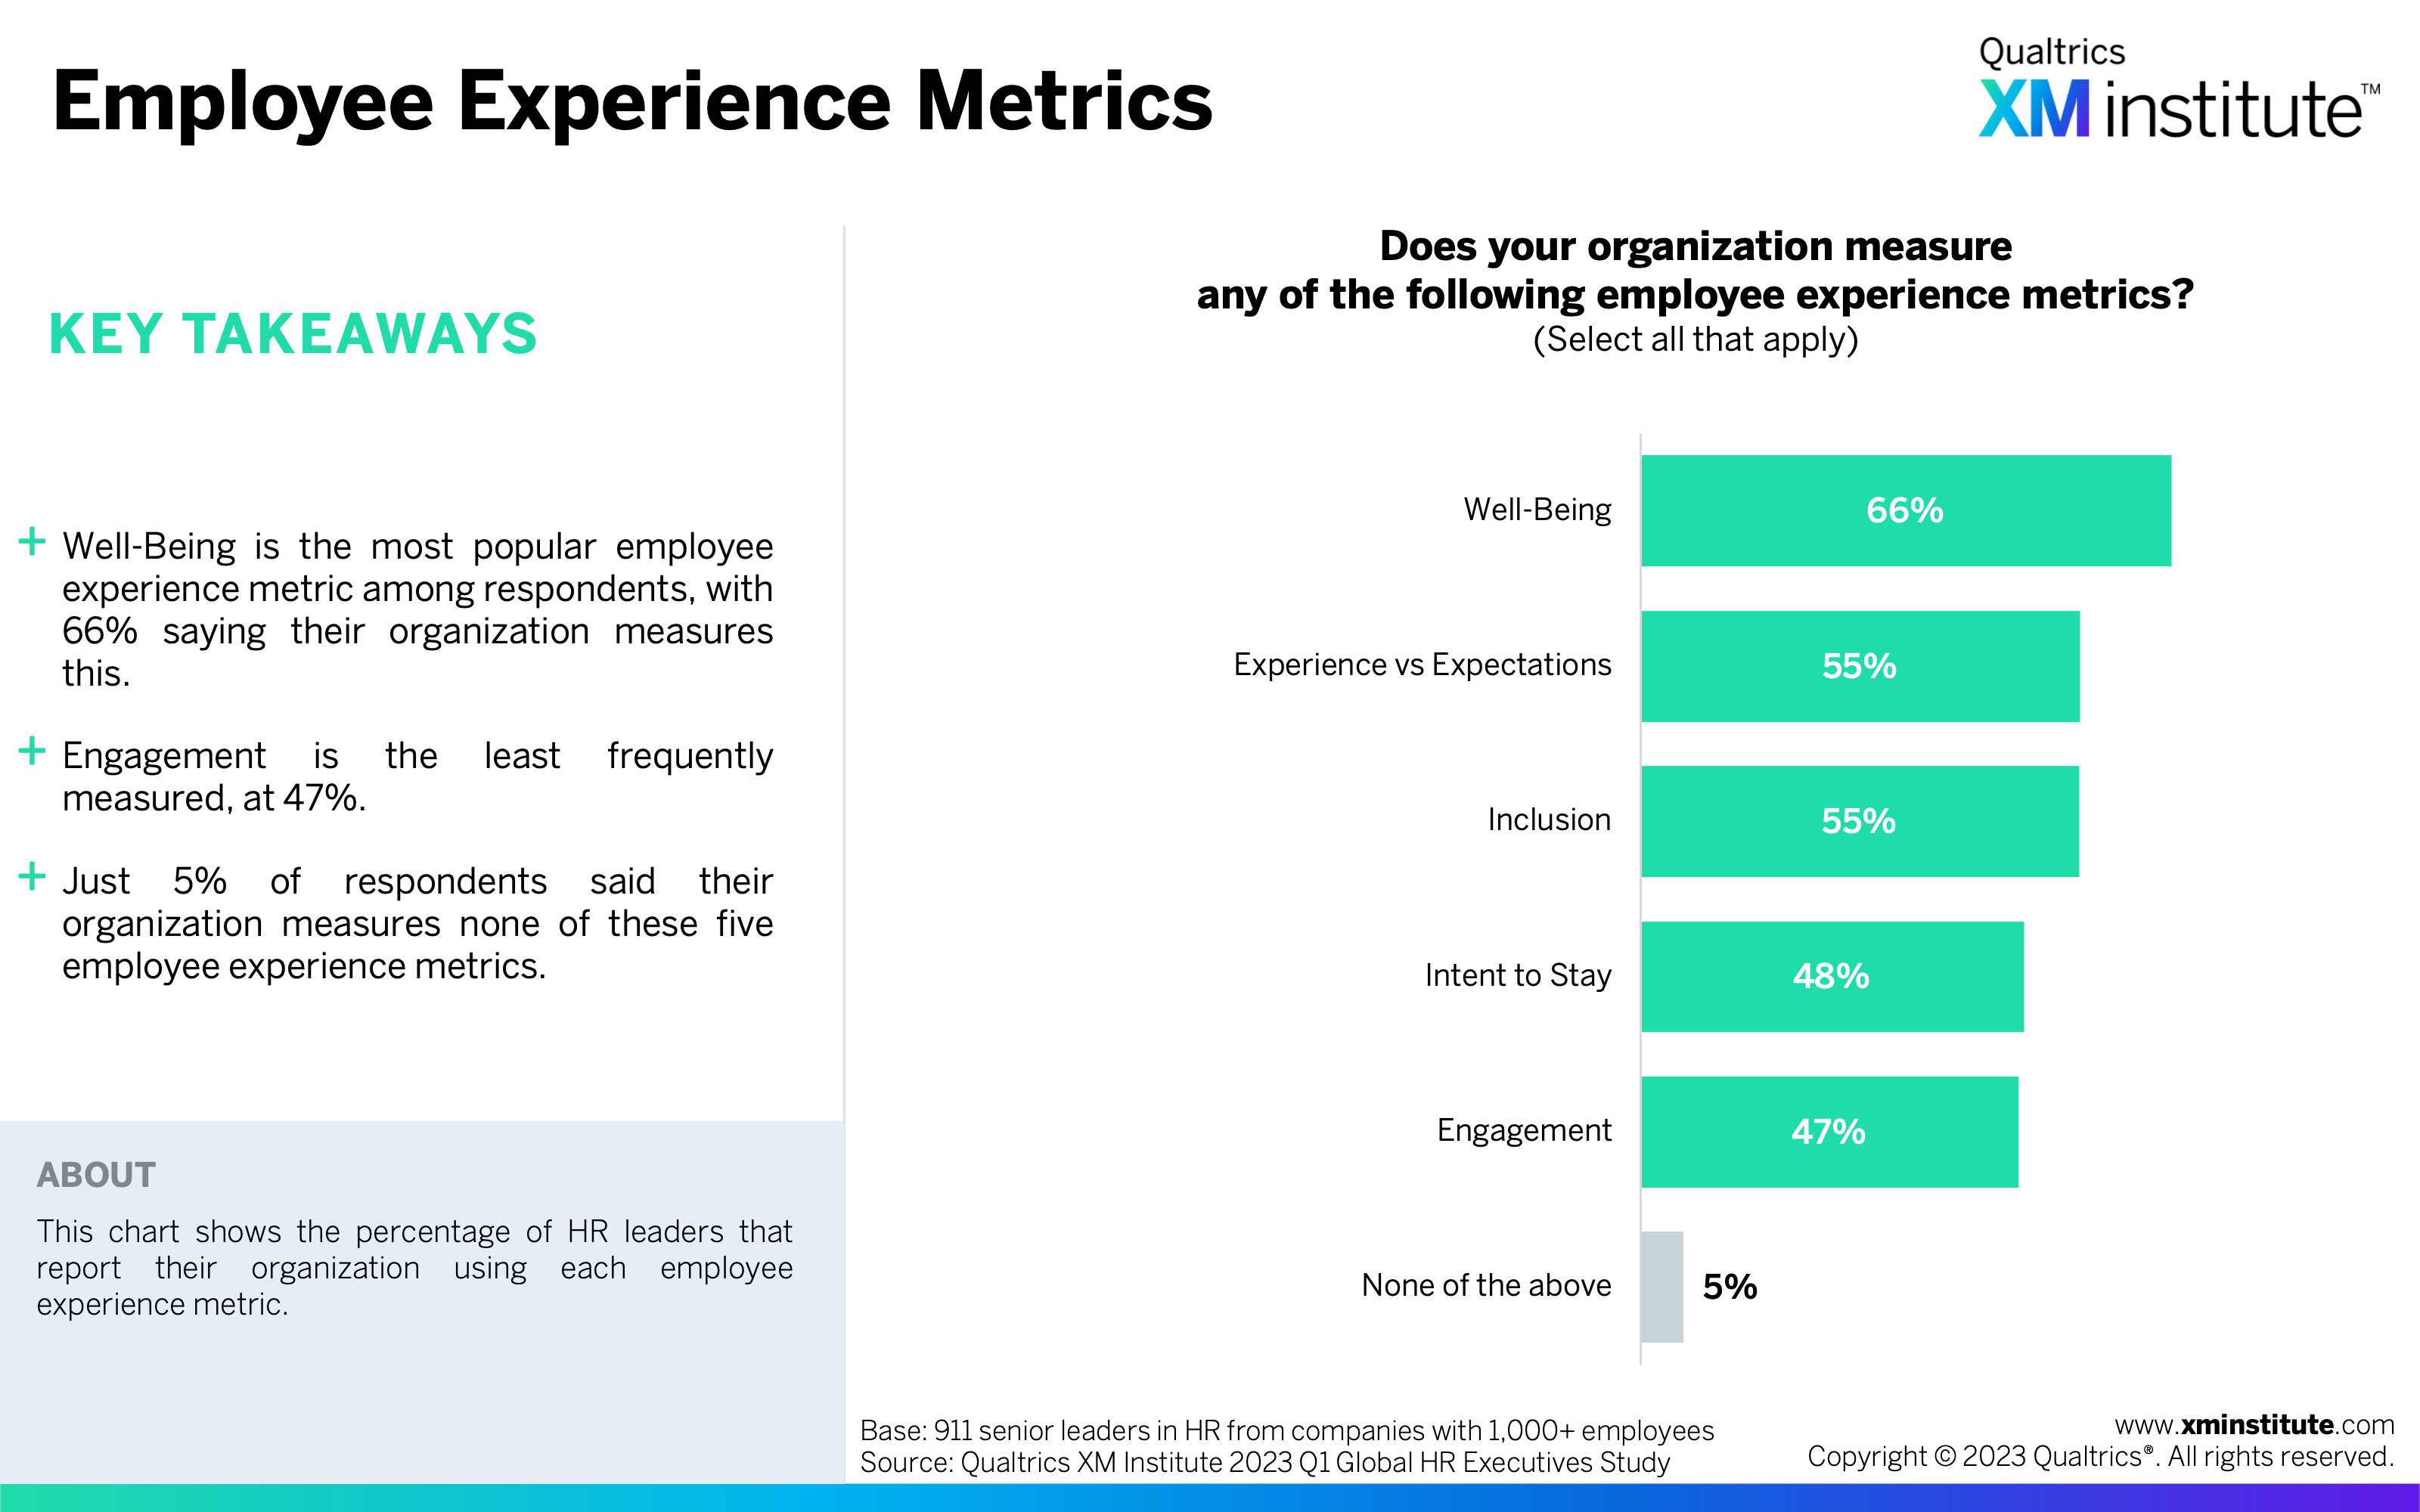
- Employee Experience Metrics (see Figure 21)
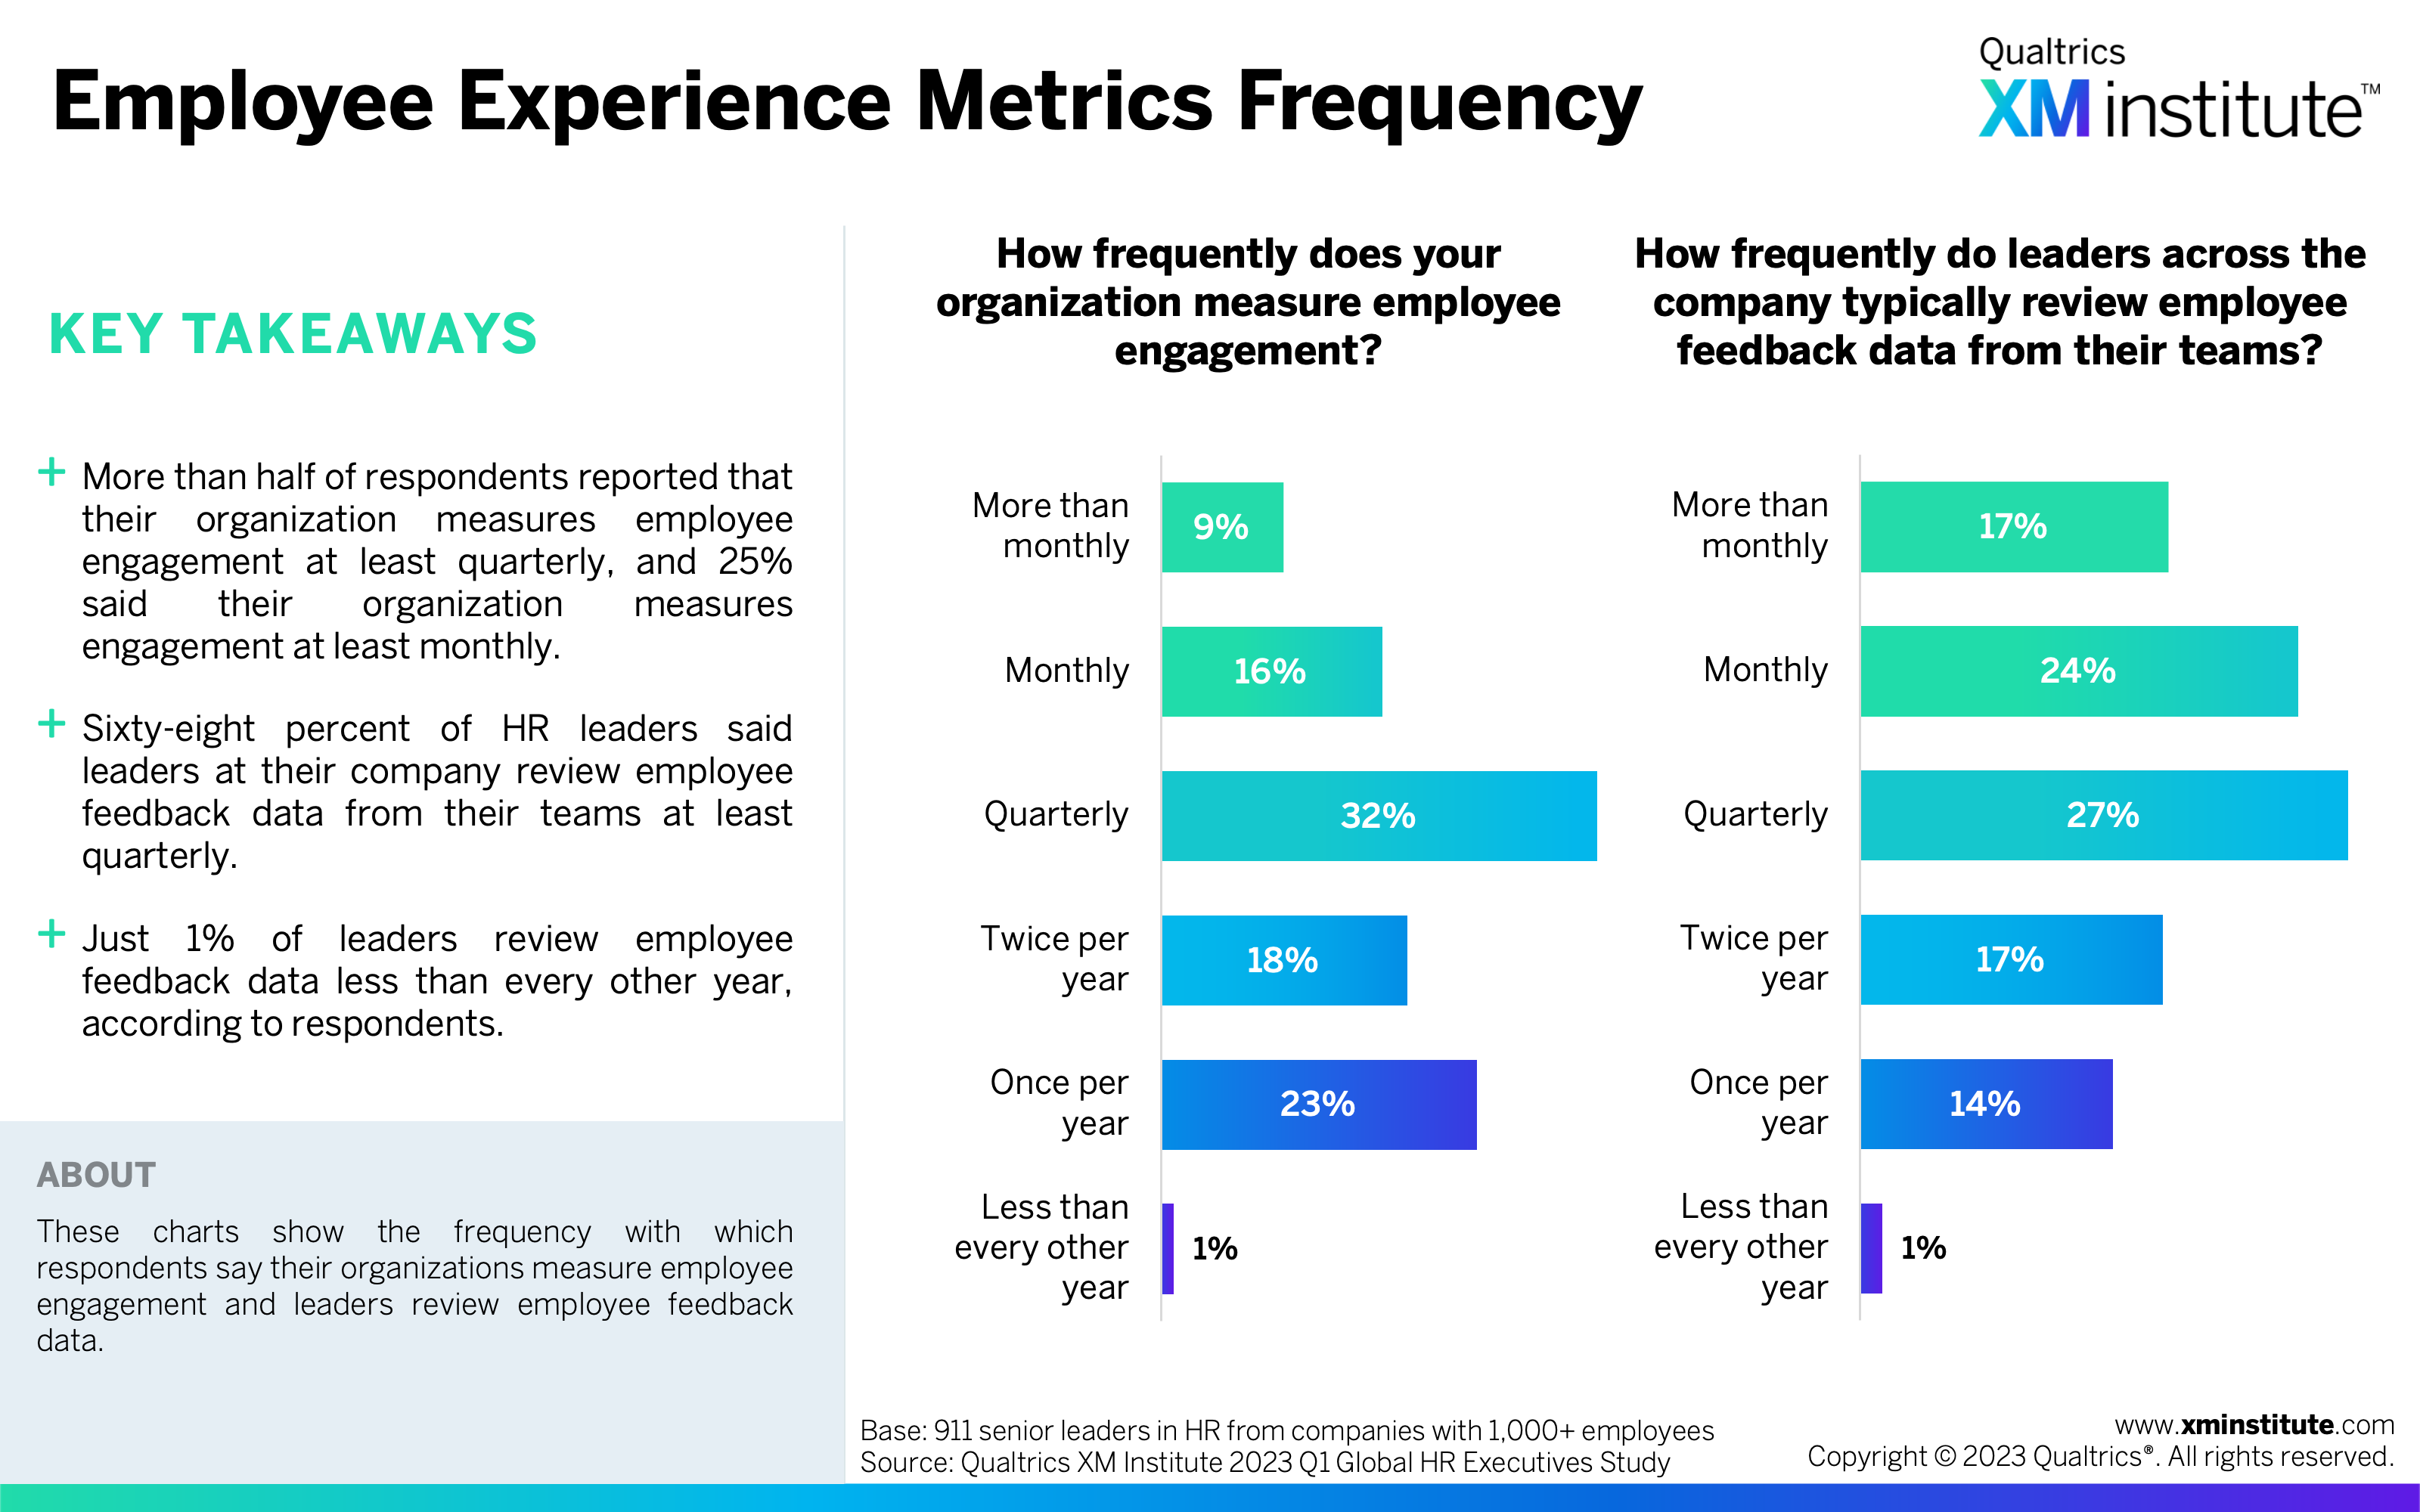
- Employee Experience Metrics Frequency (see Figure 22)
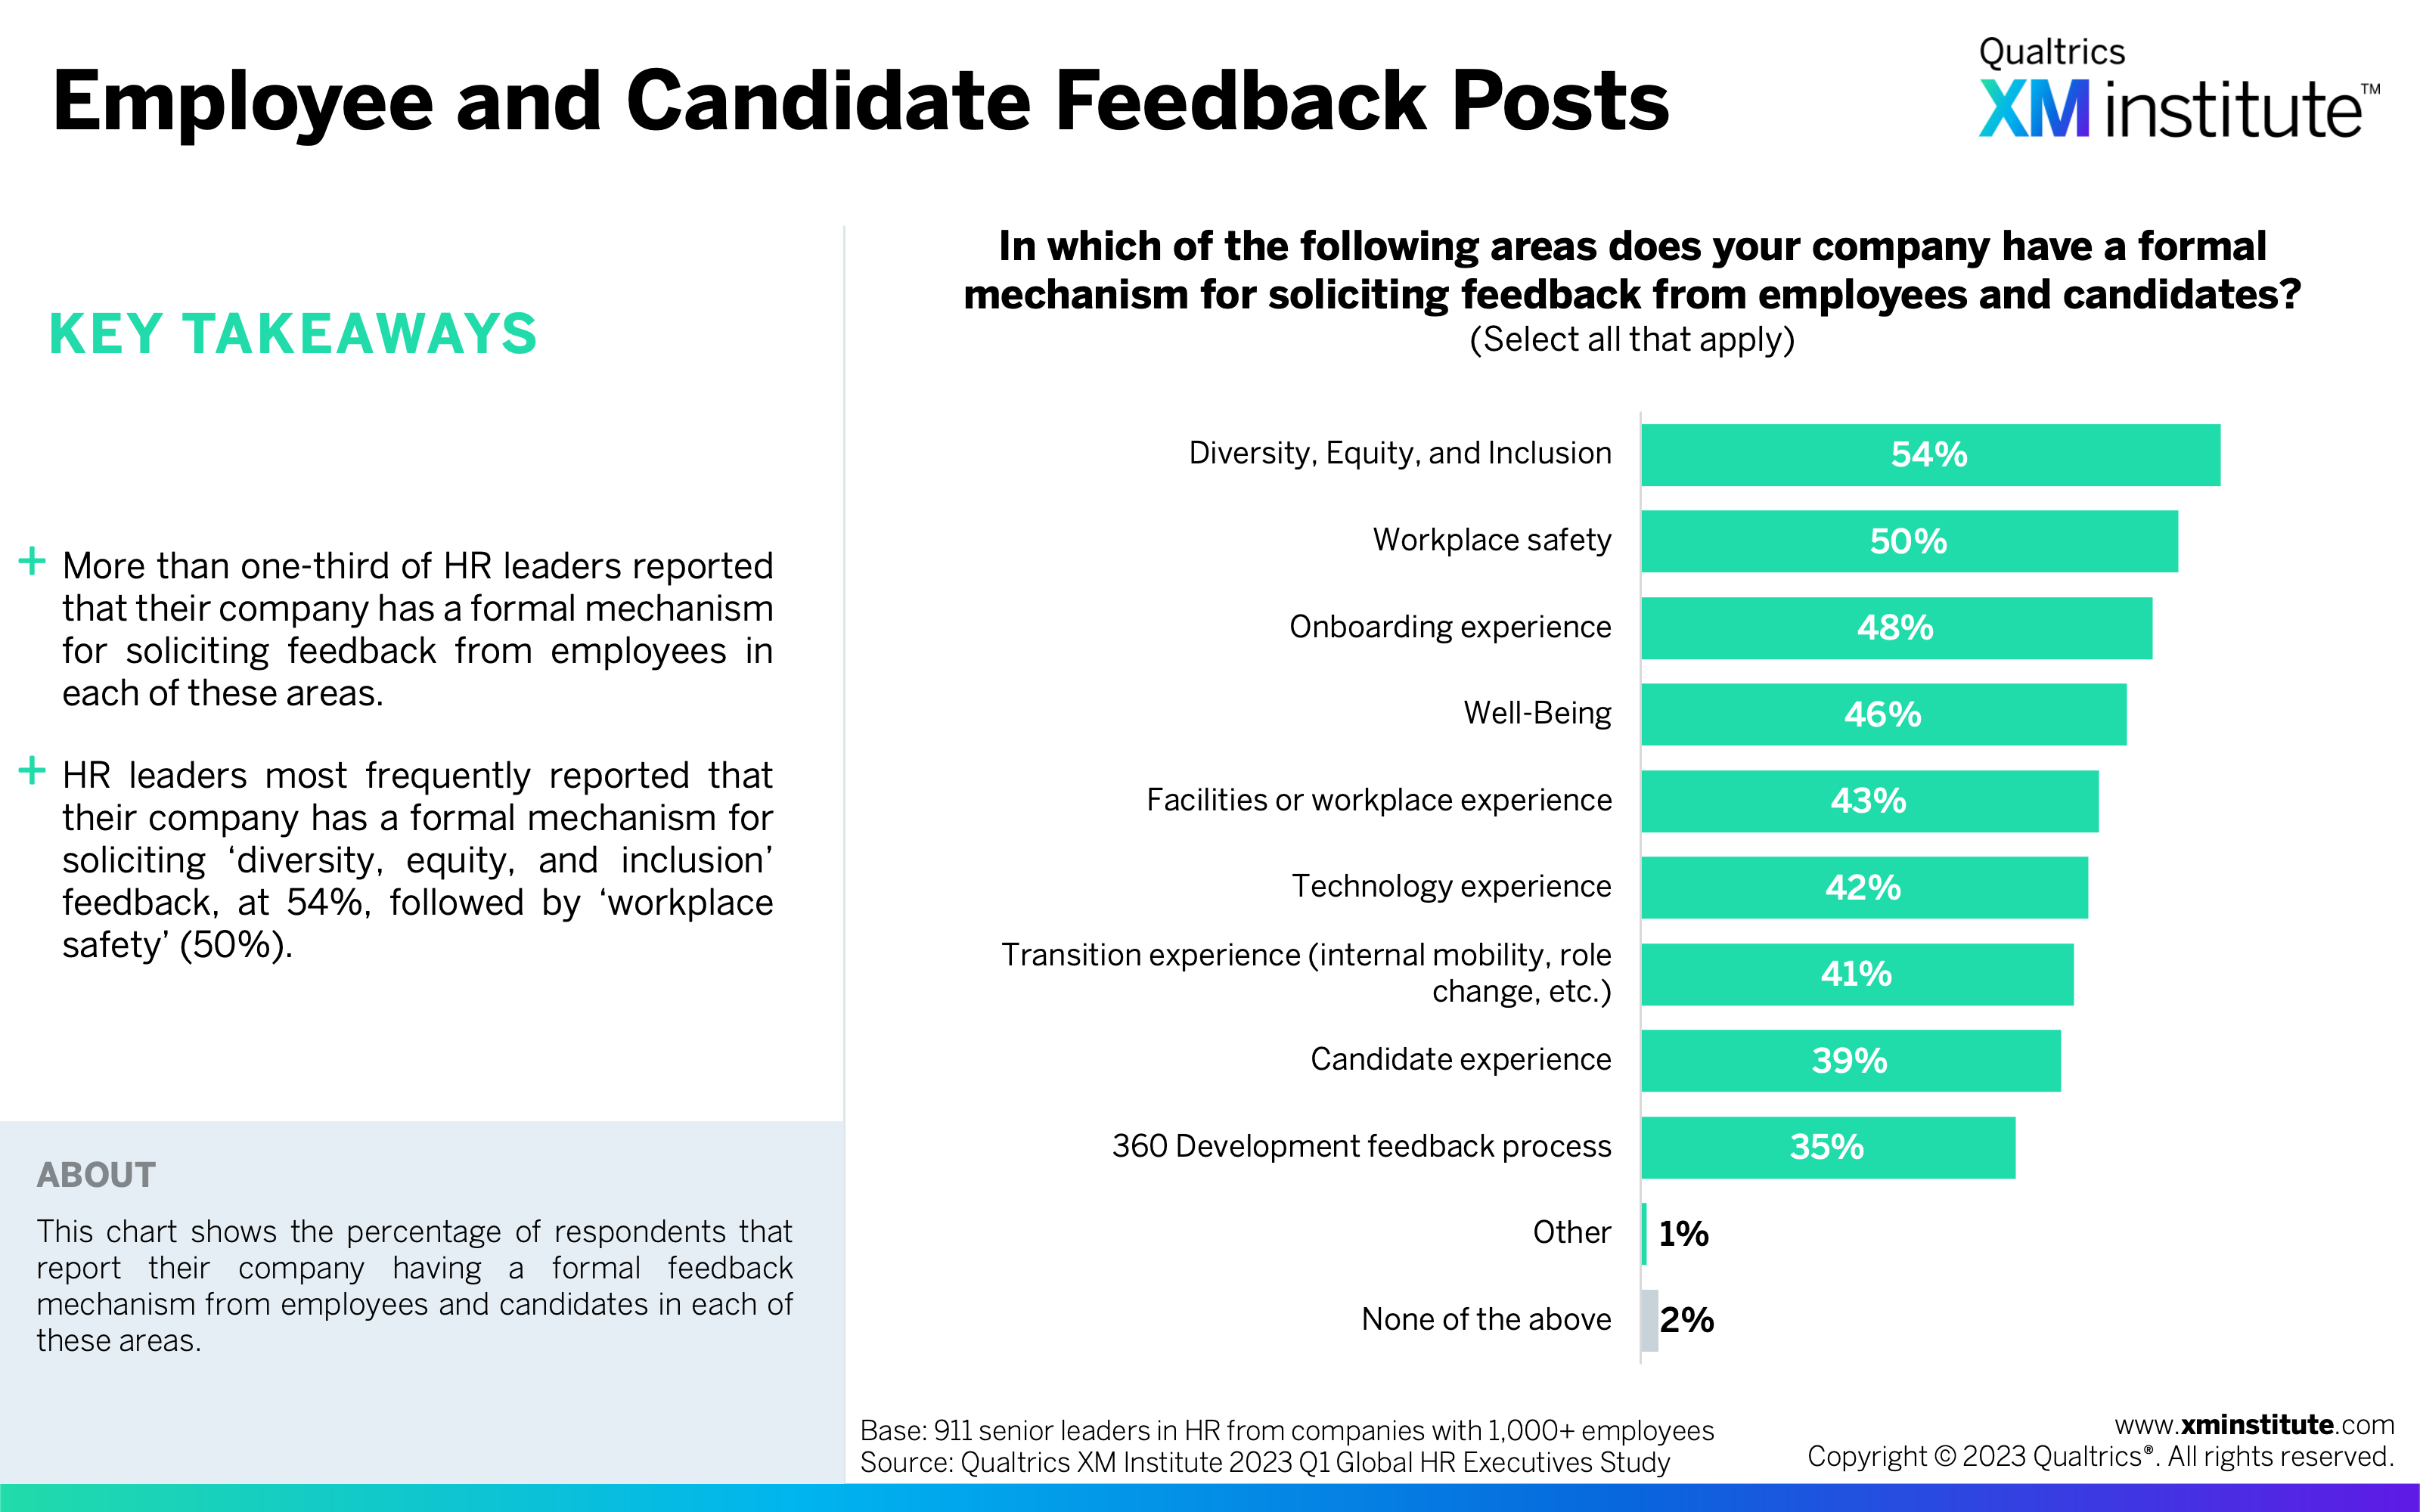
- Employee and Candidate Feedback Posts (see Figure 23)
- Risks of Disparate Data Storage (see Figure 24)
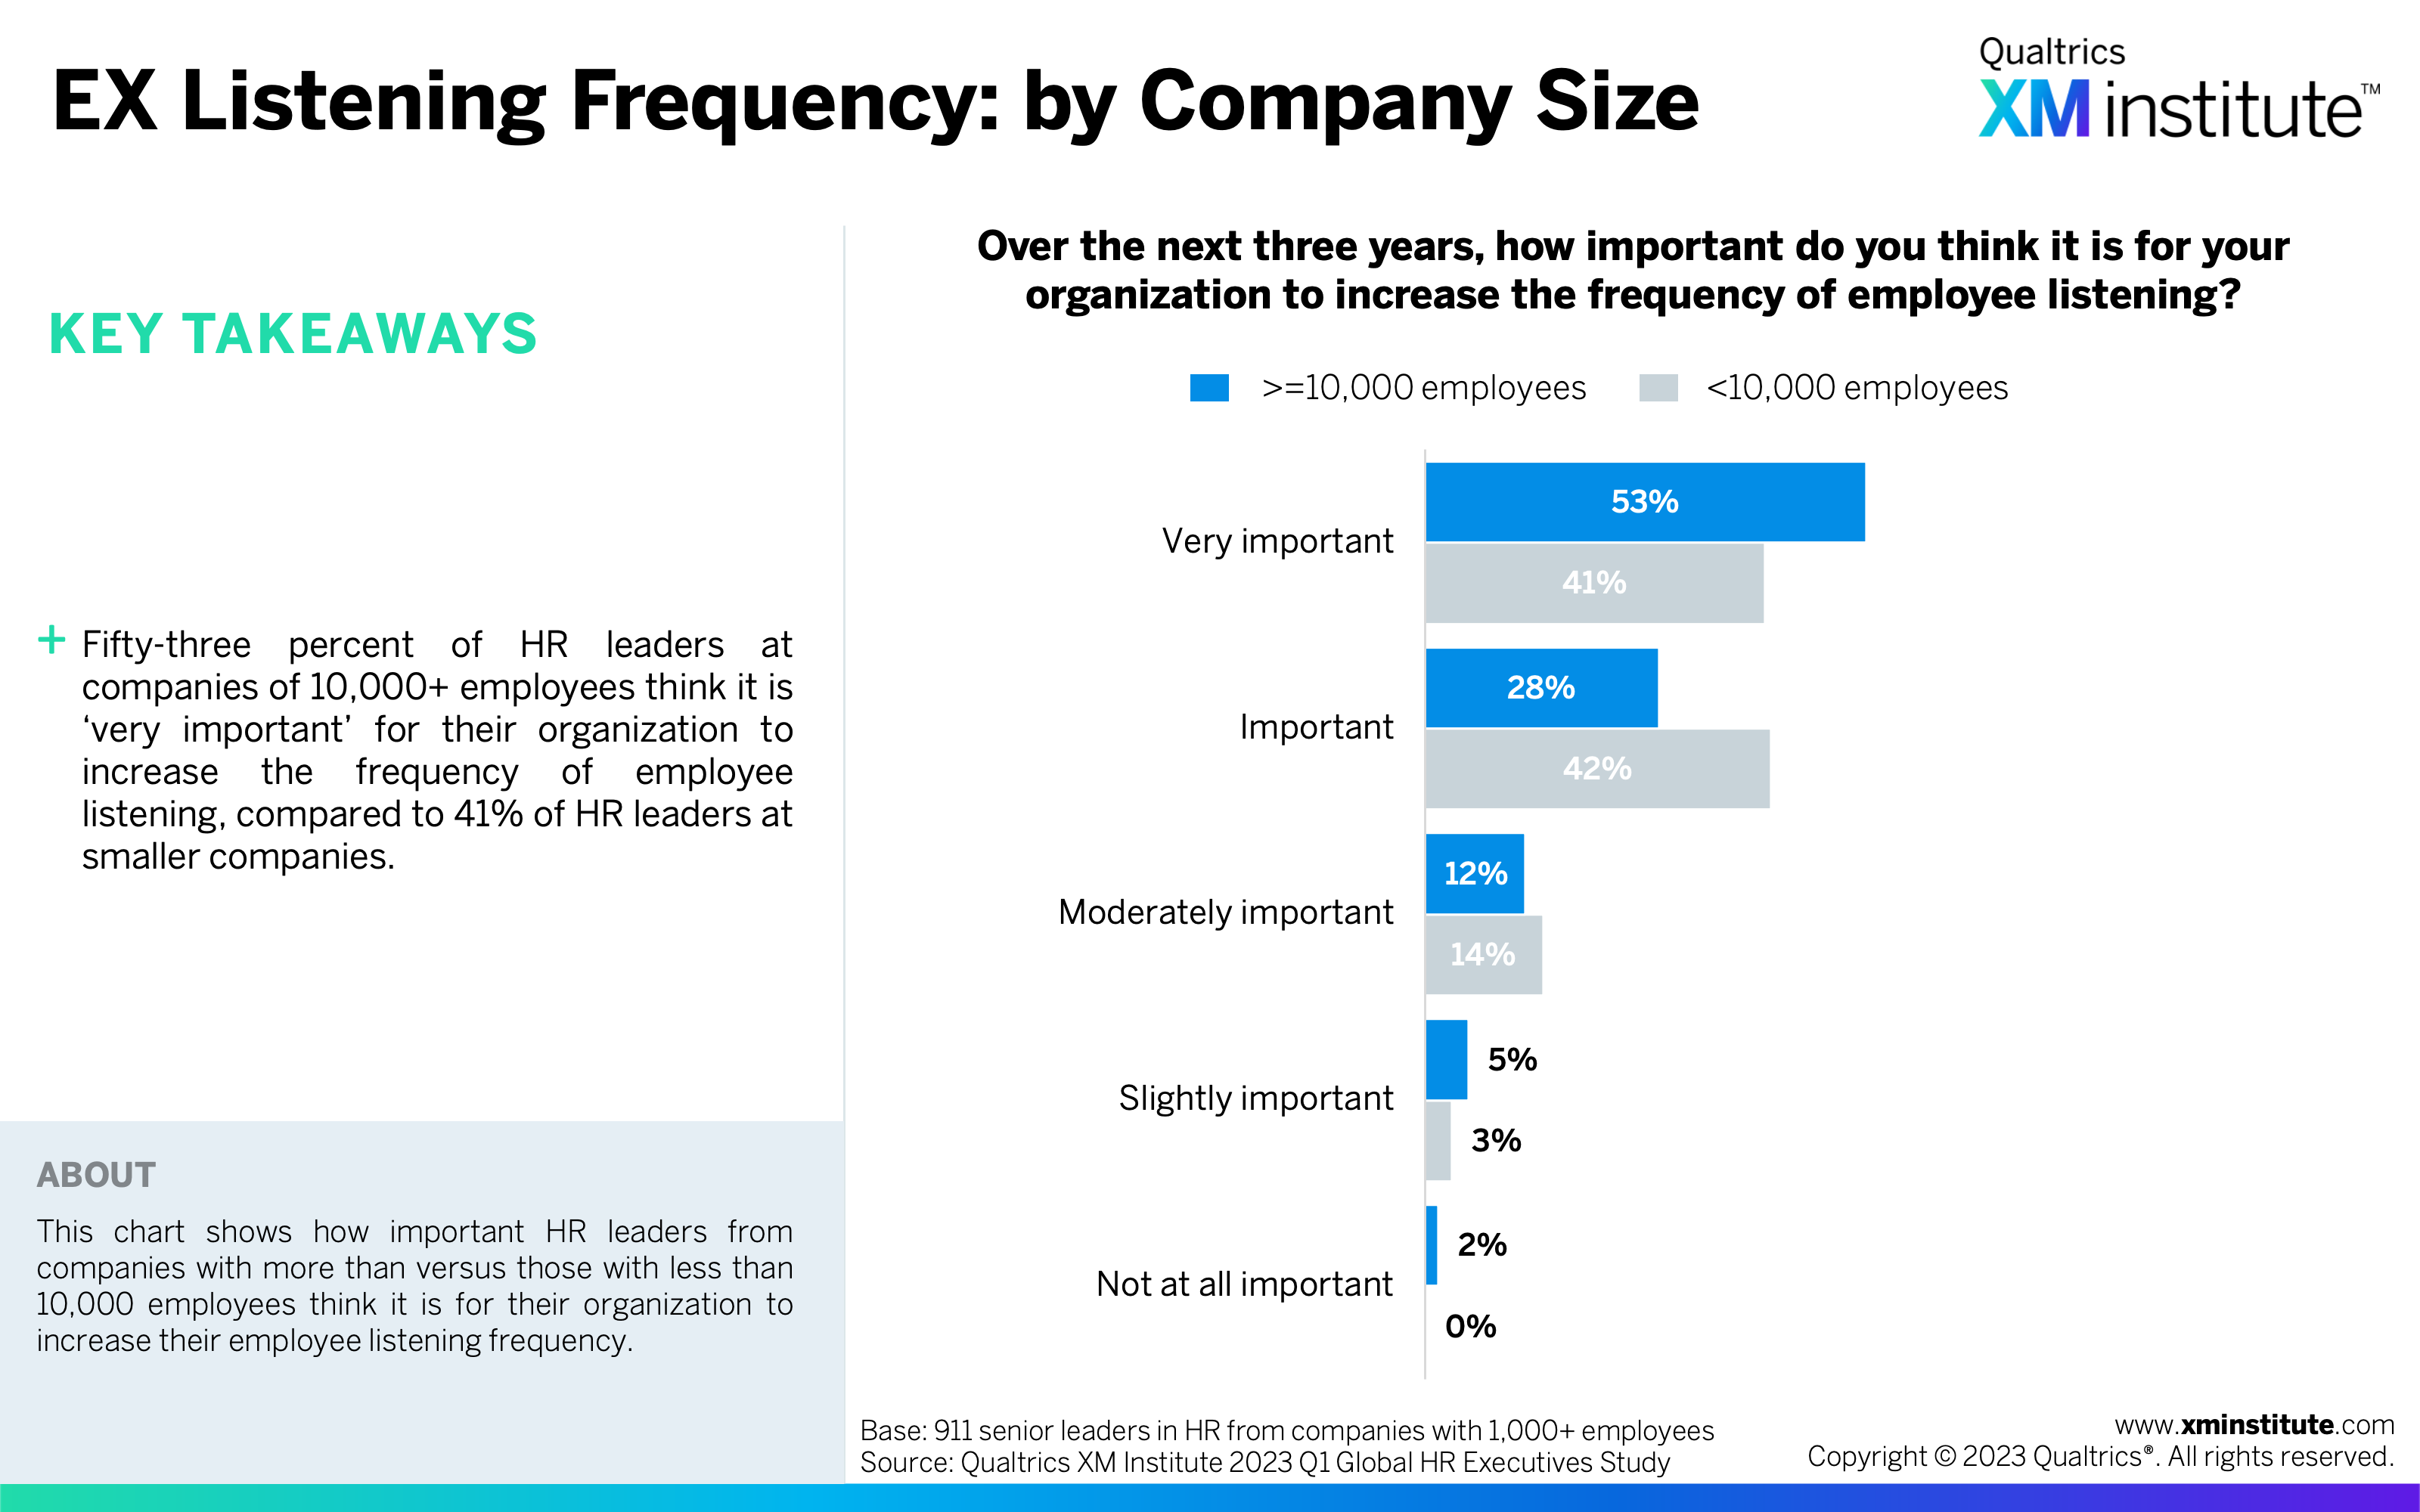
- EX Listening Frequency: by Company Size (see Figure 25)
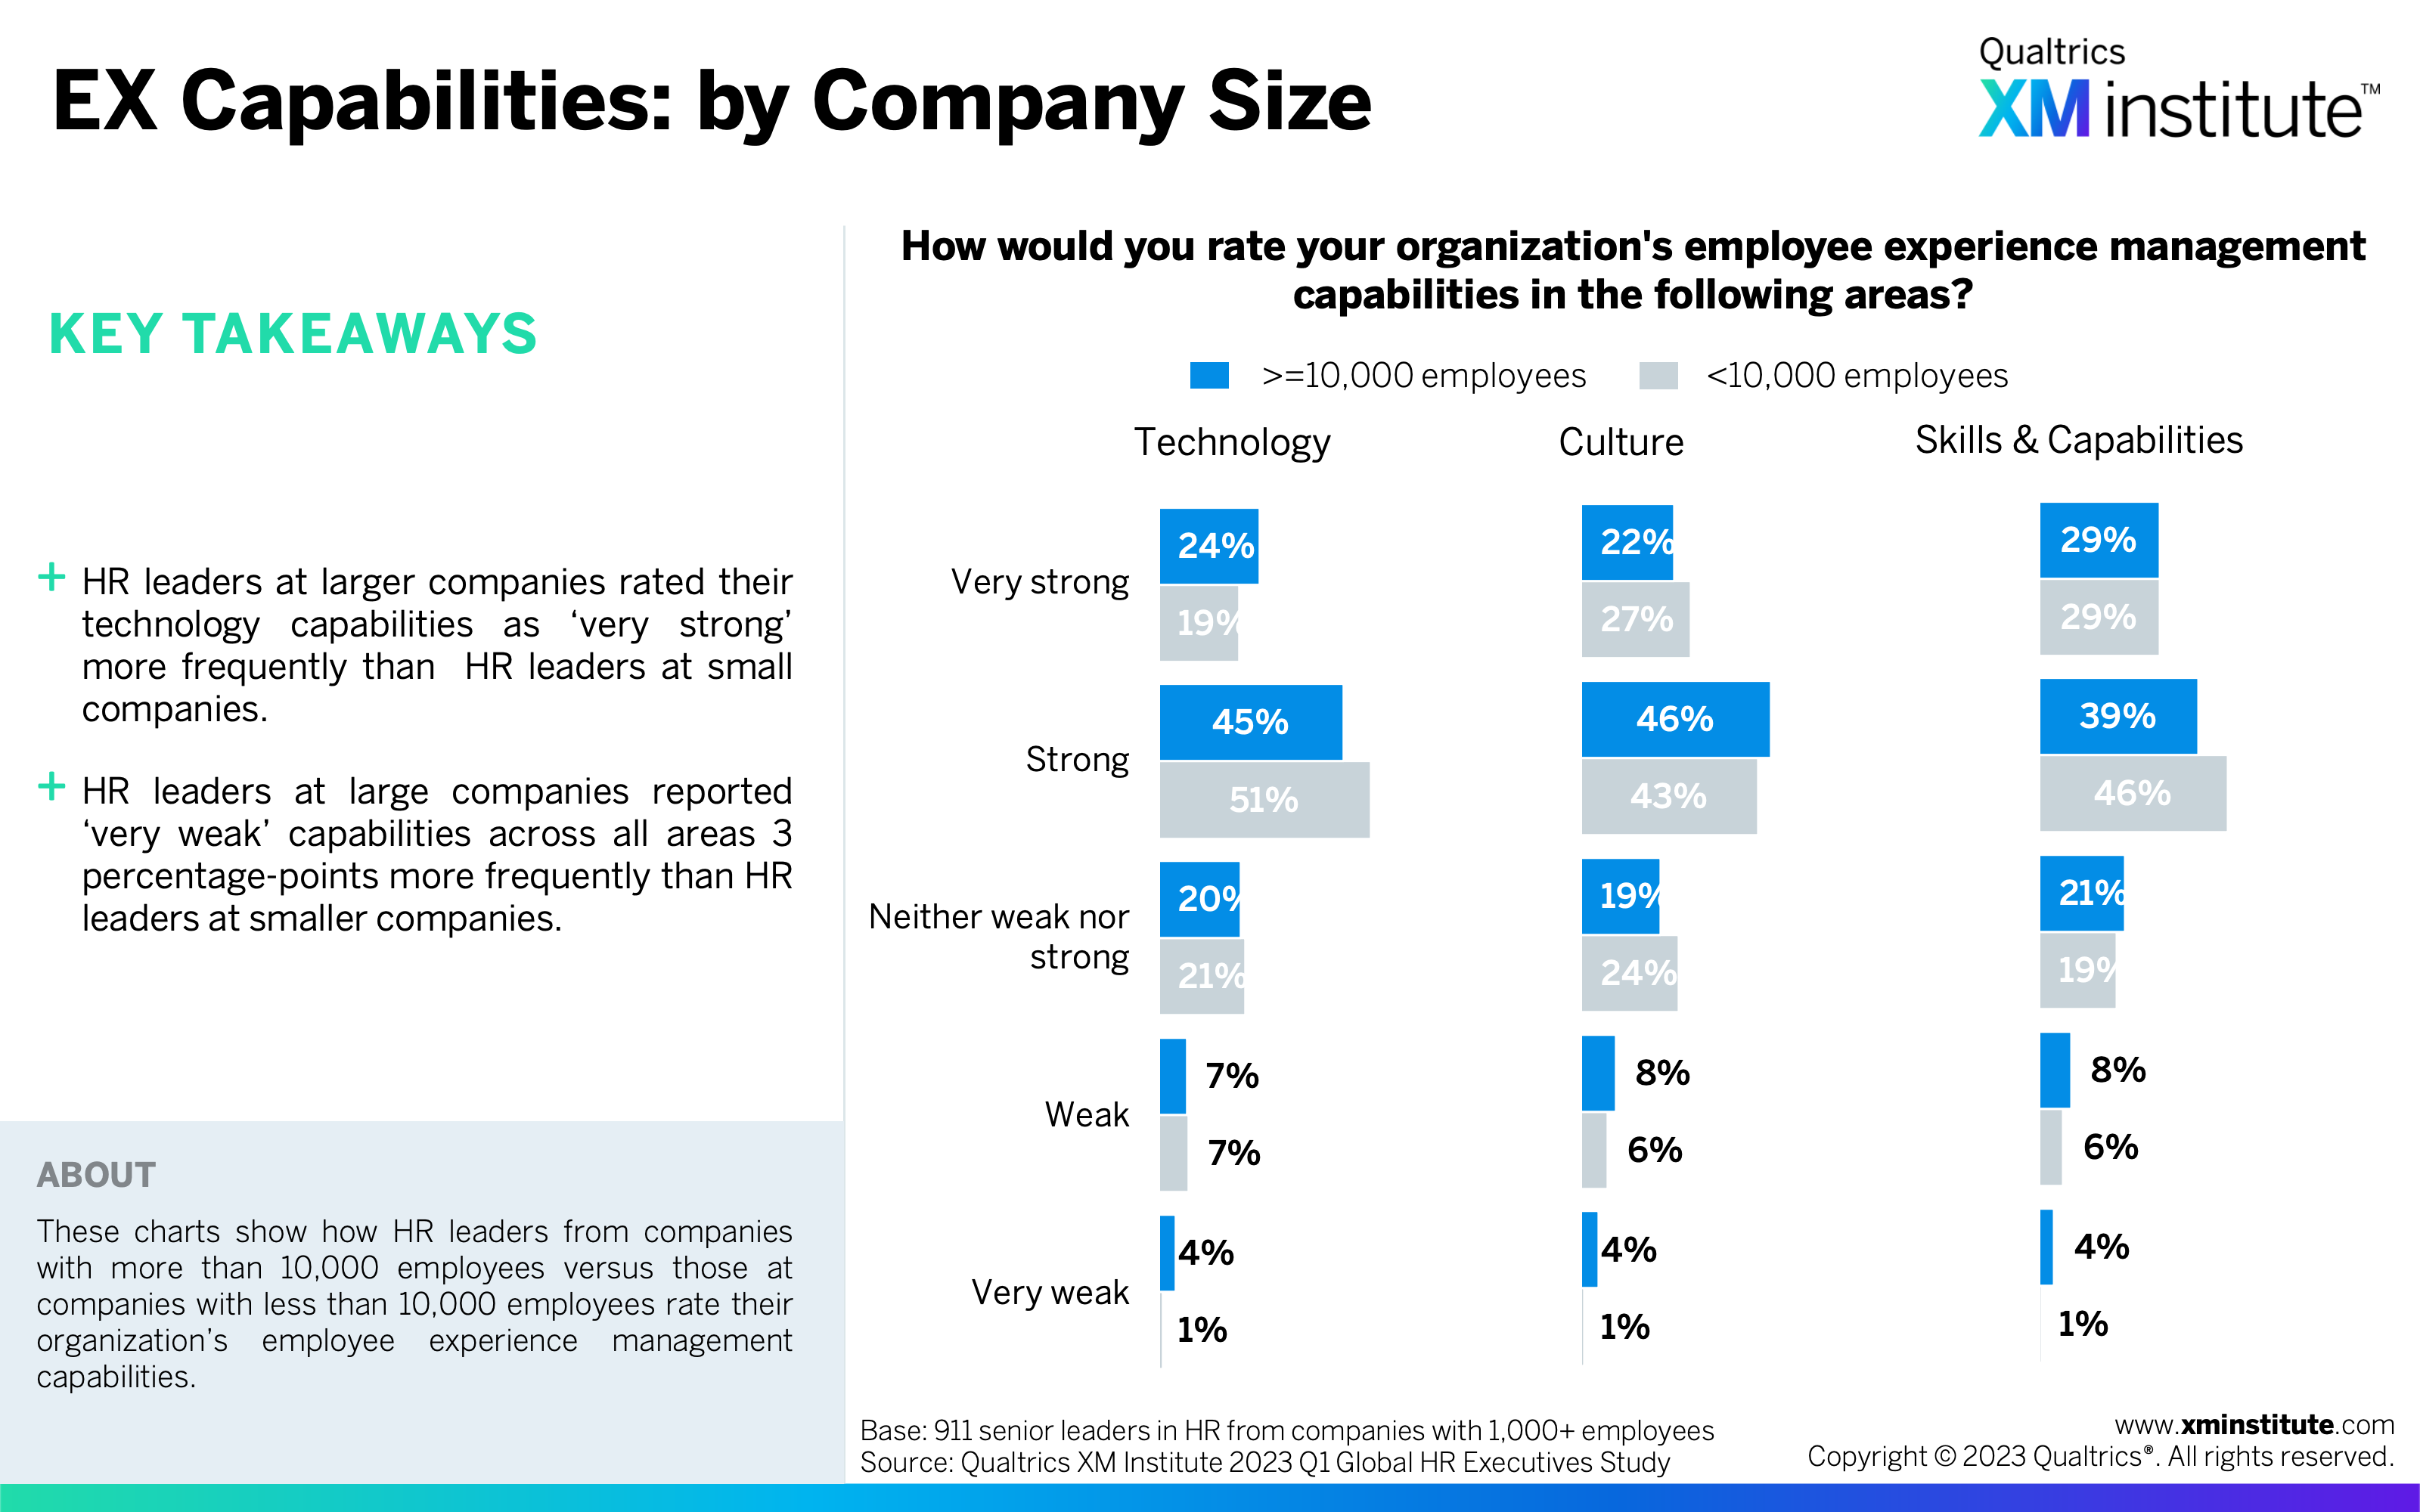
- EX Capabilities: by Company Size (see Figure 26)
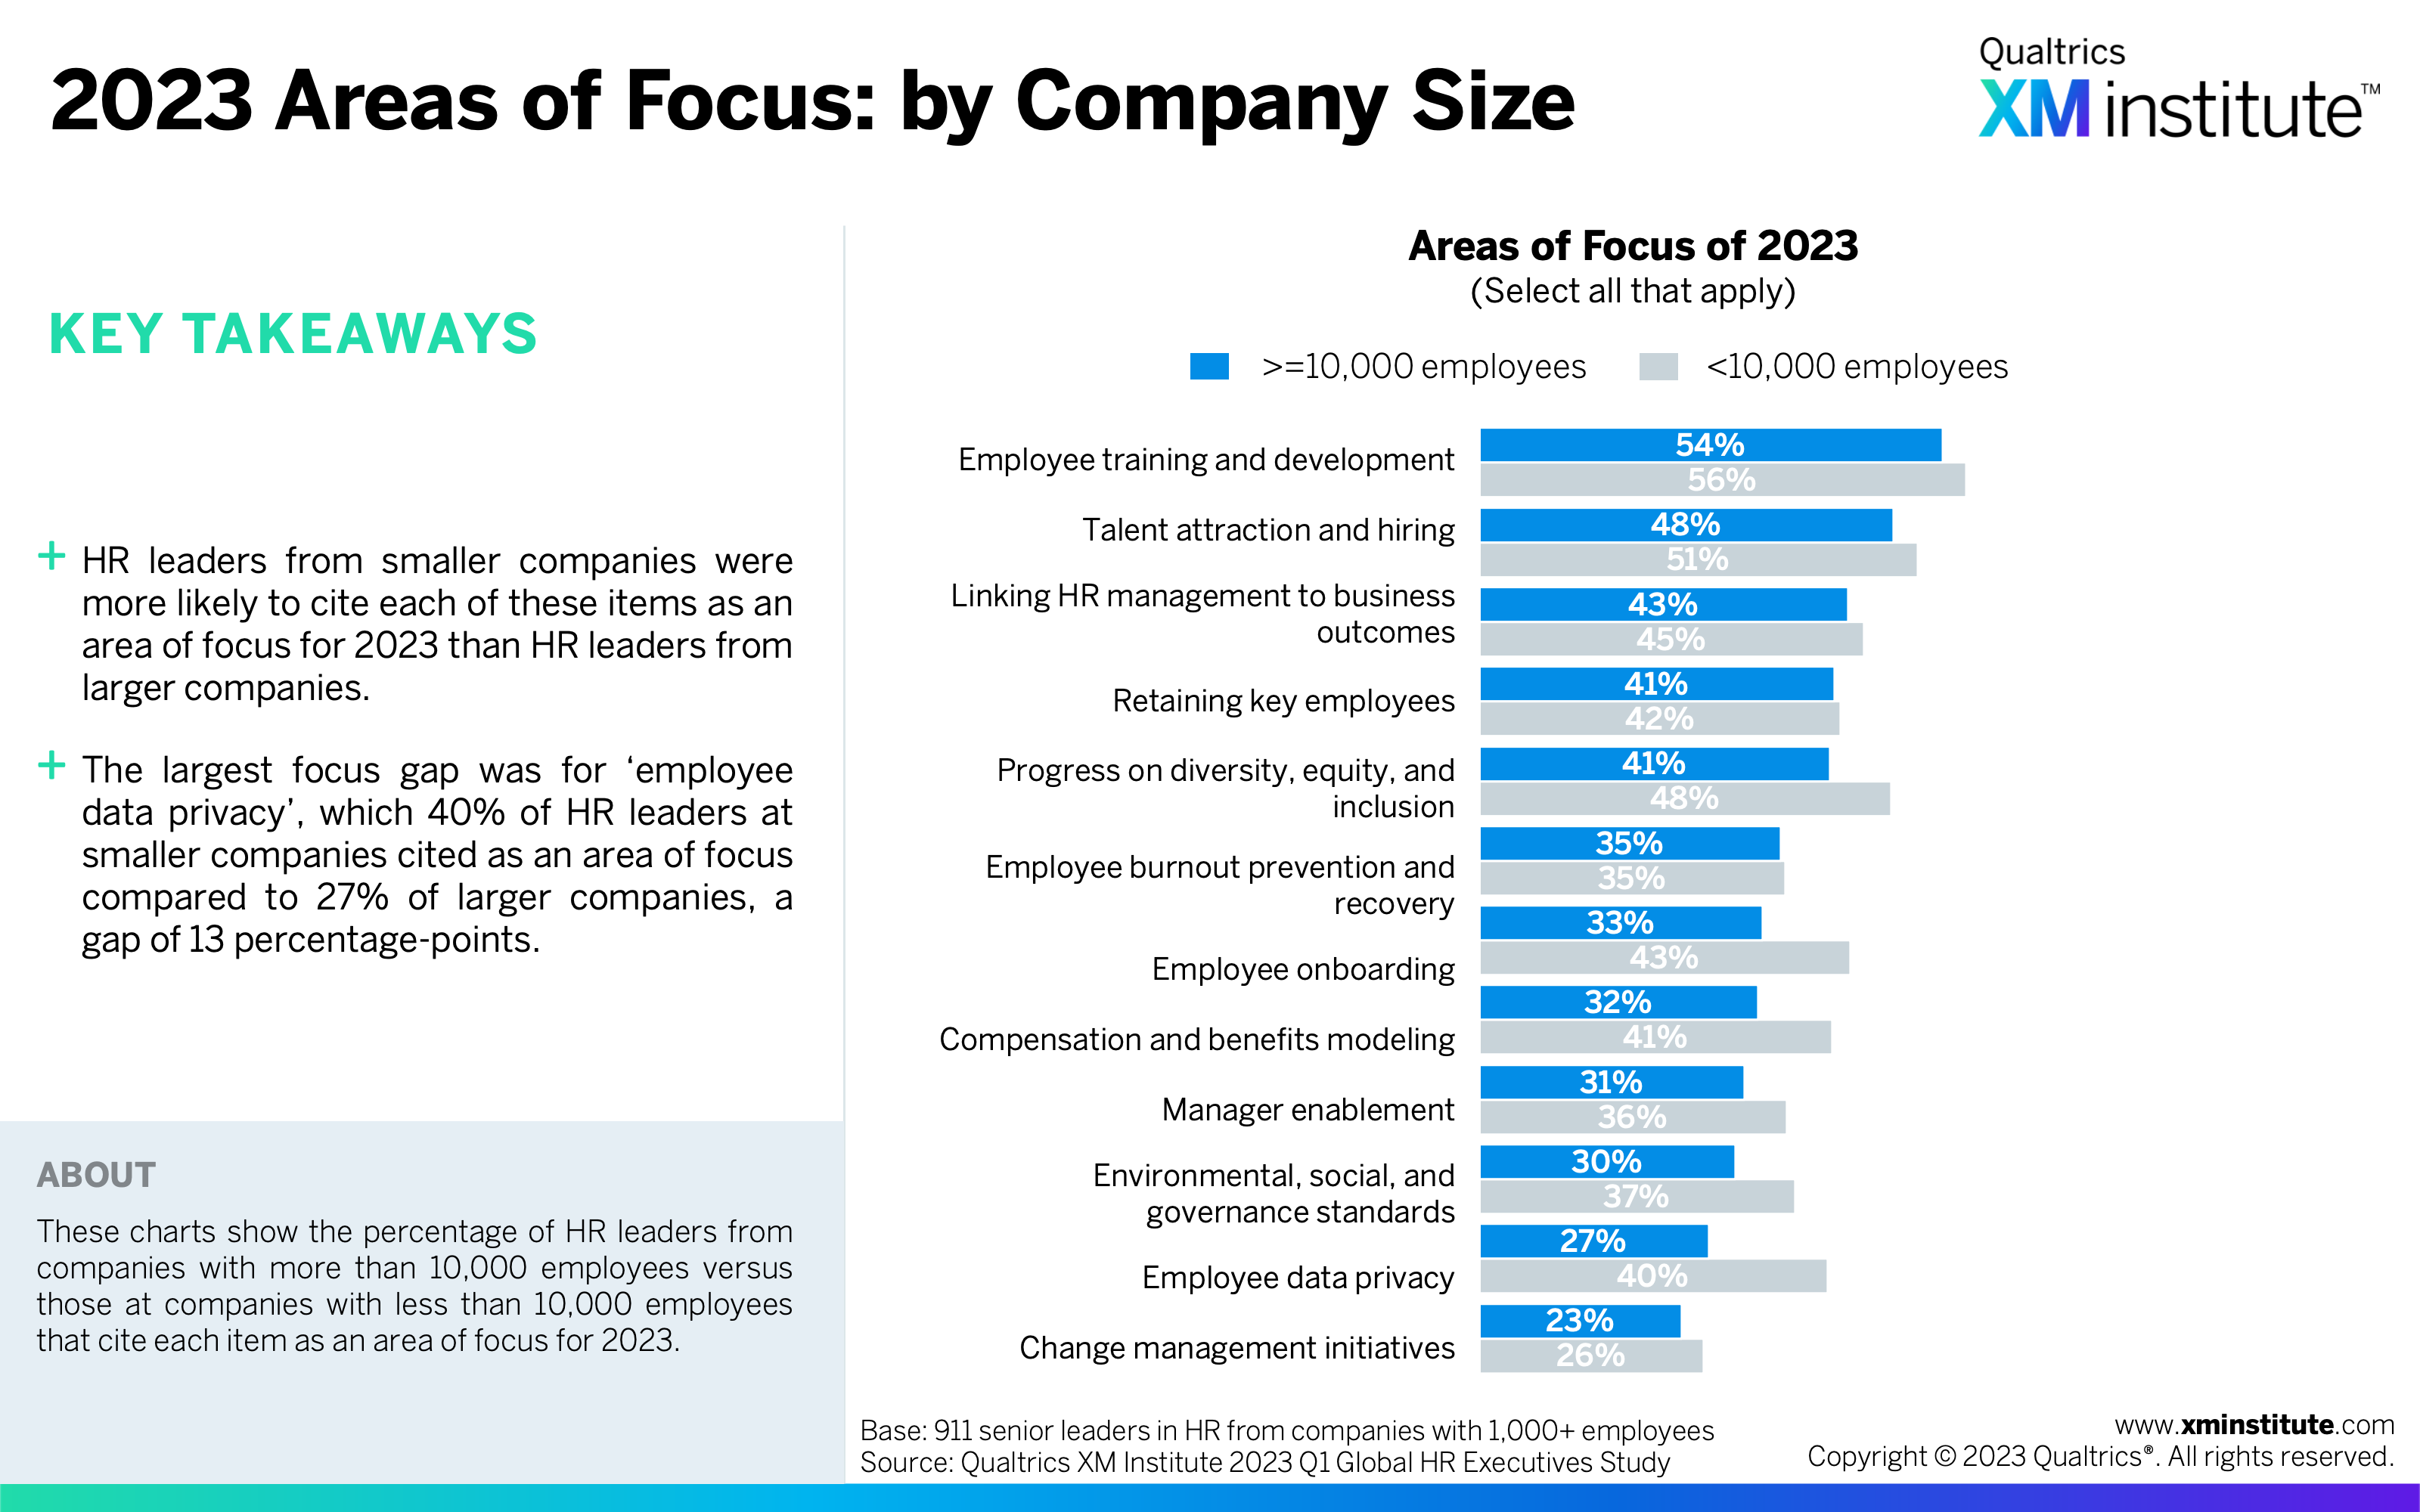
- 2023 Areas of Focus: by Company Size (see Figure 27)
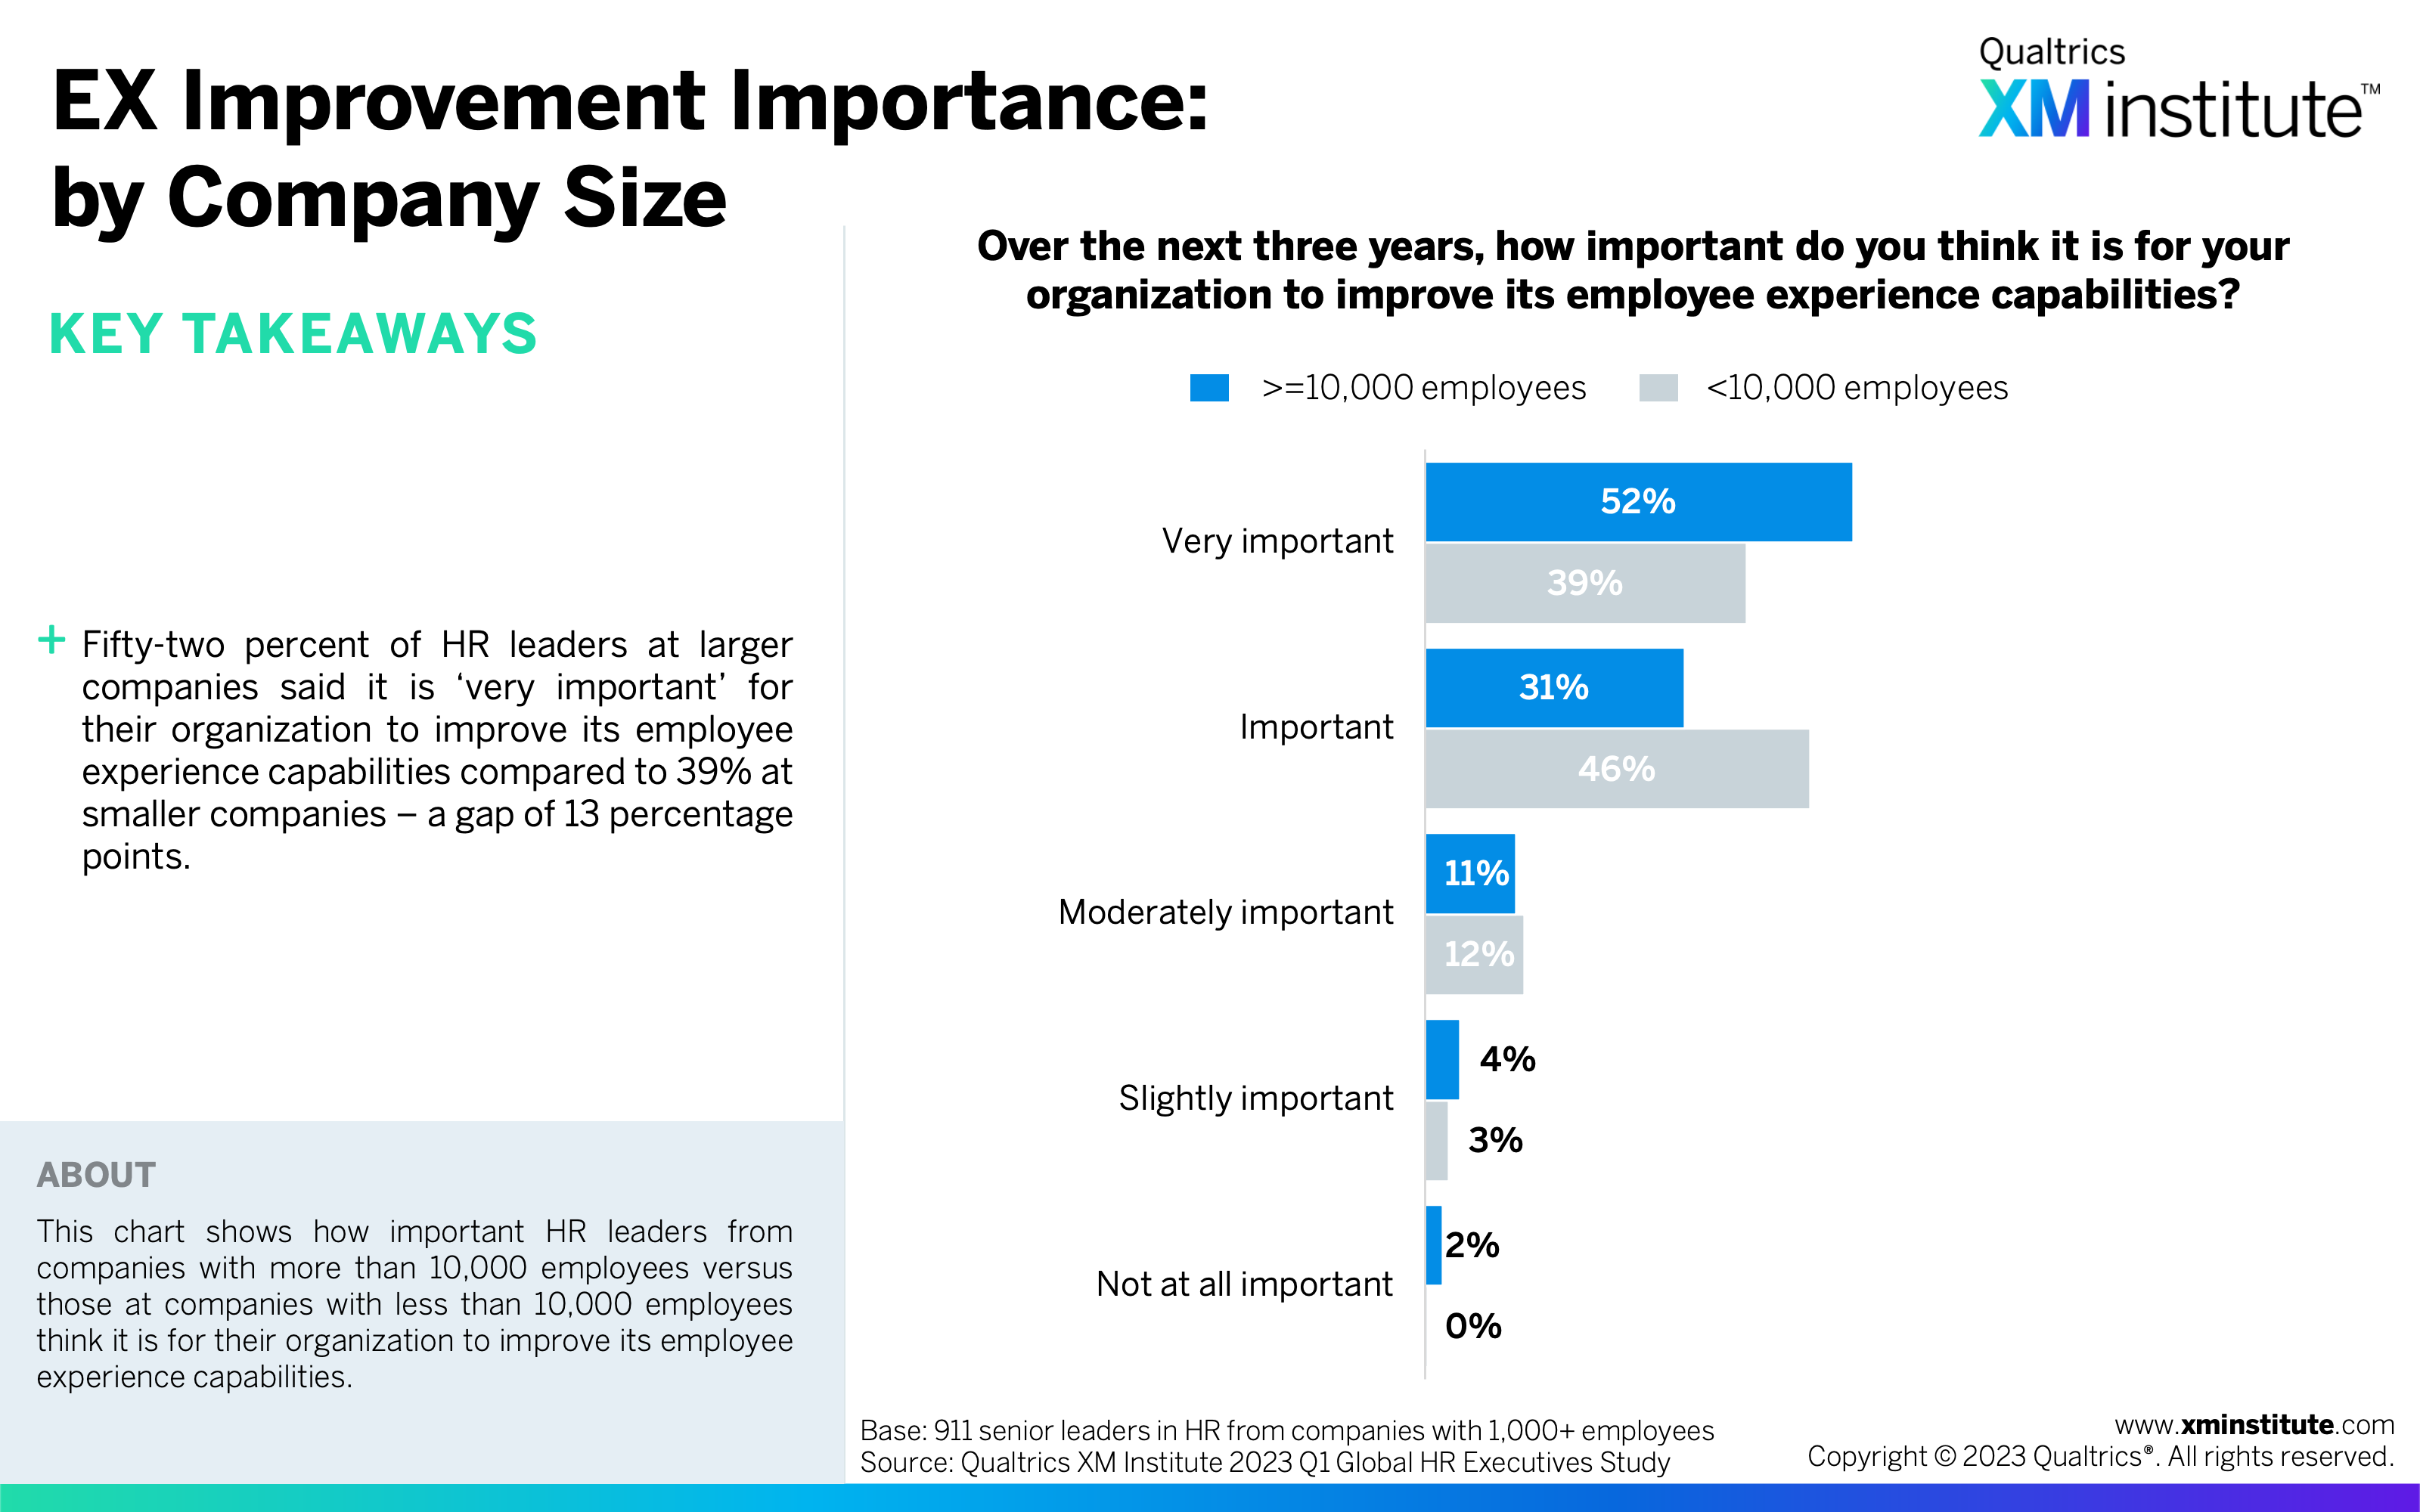
- EX Improvement Importance: by Company Size (see Figure 28)
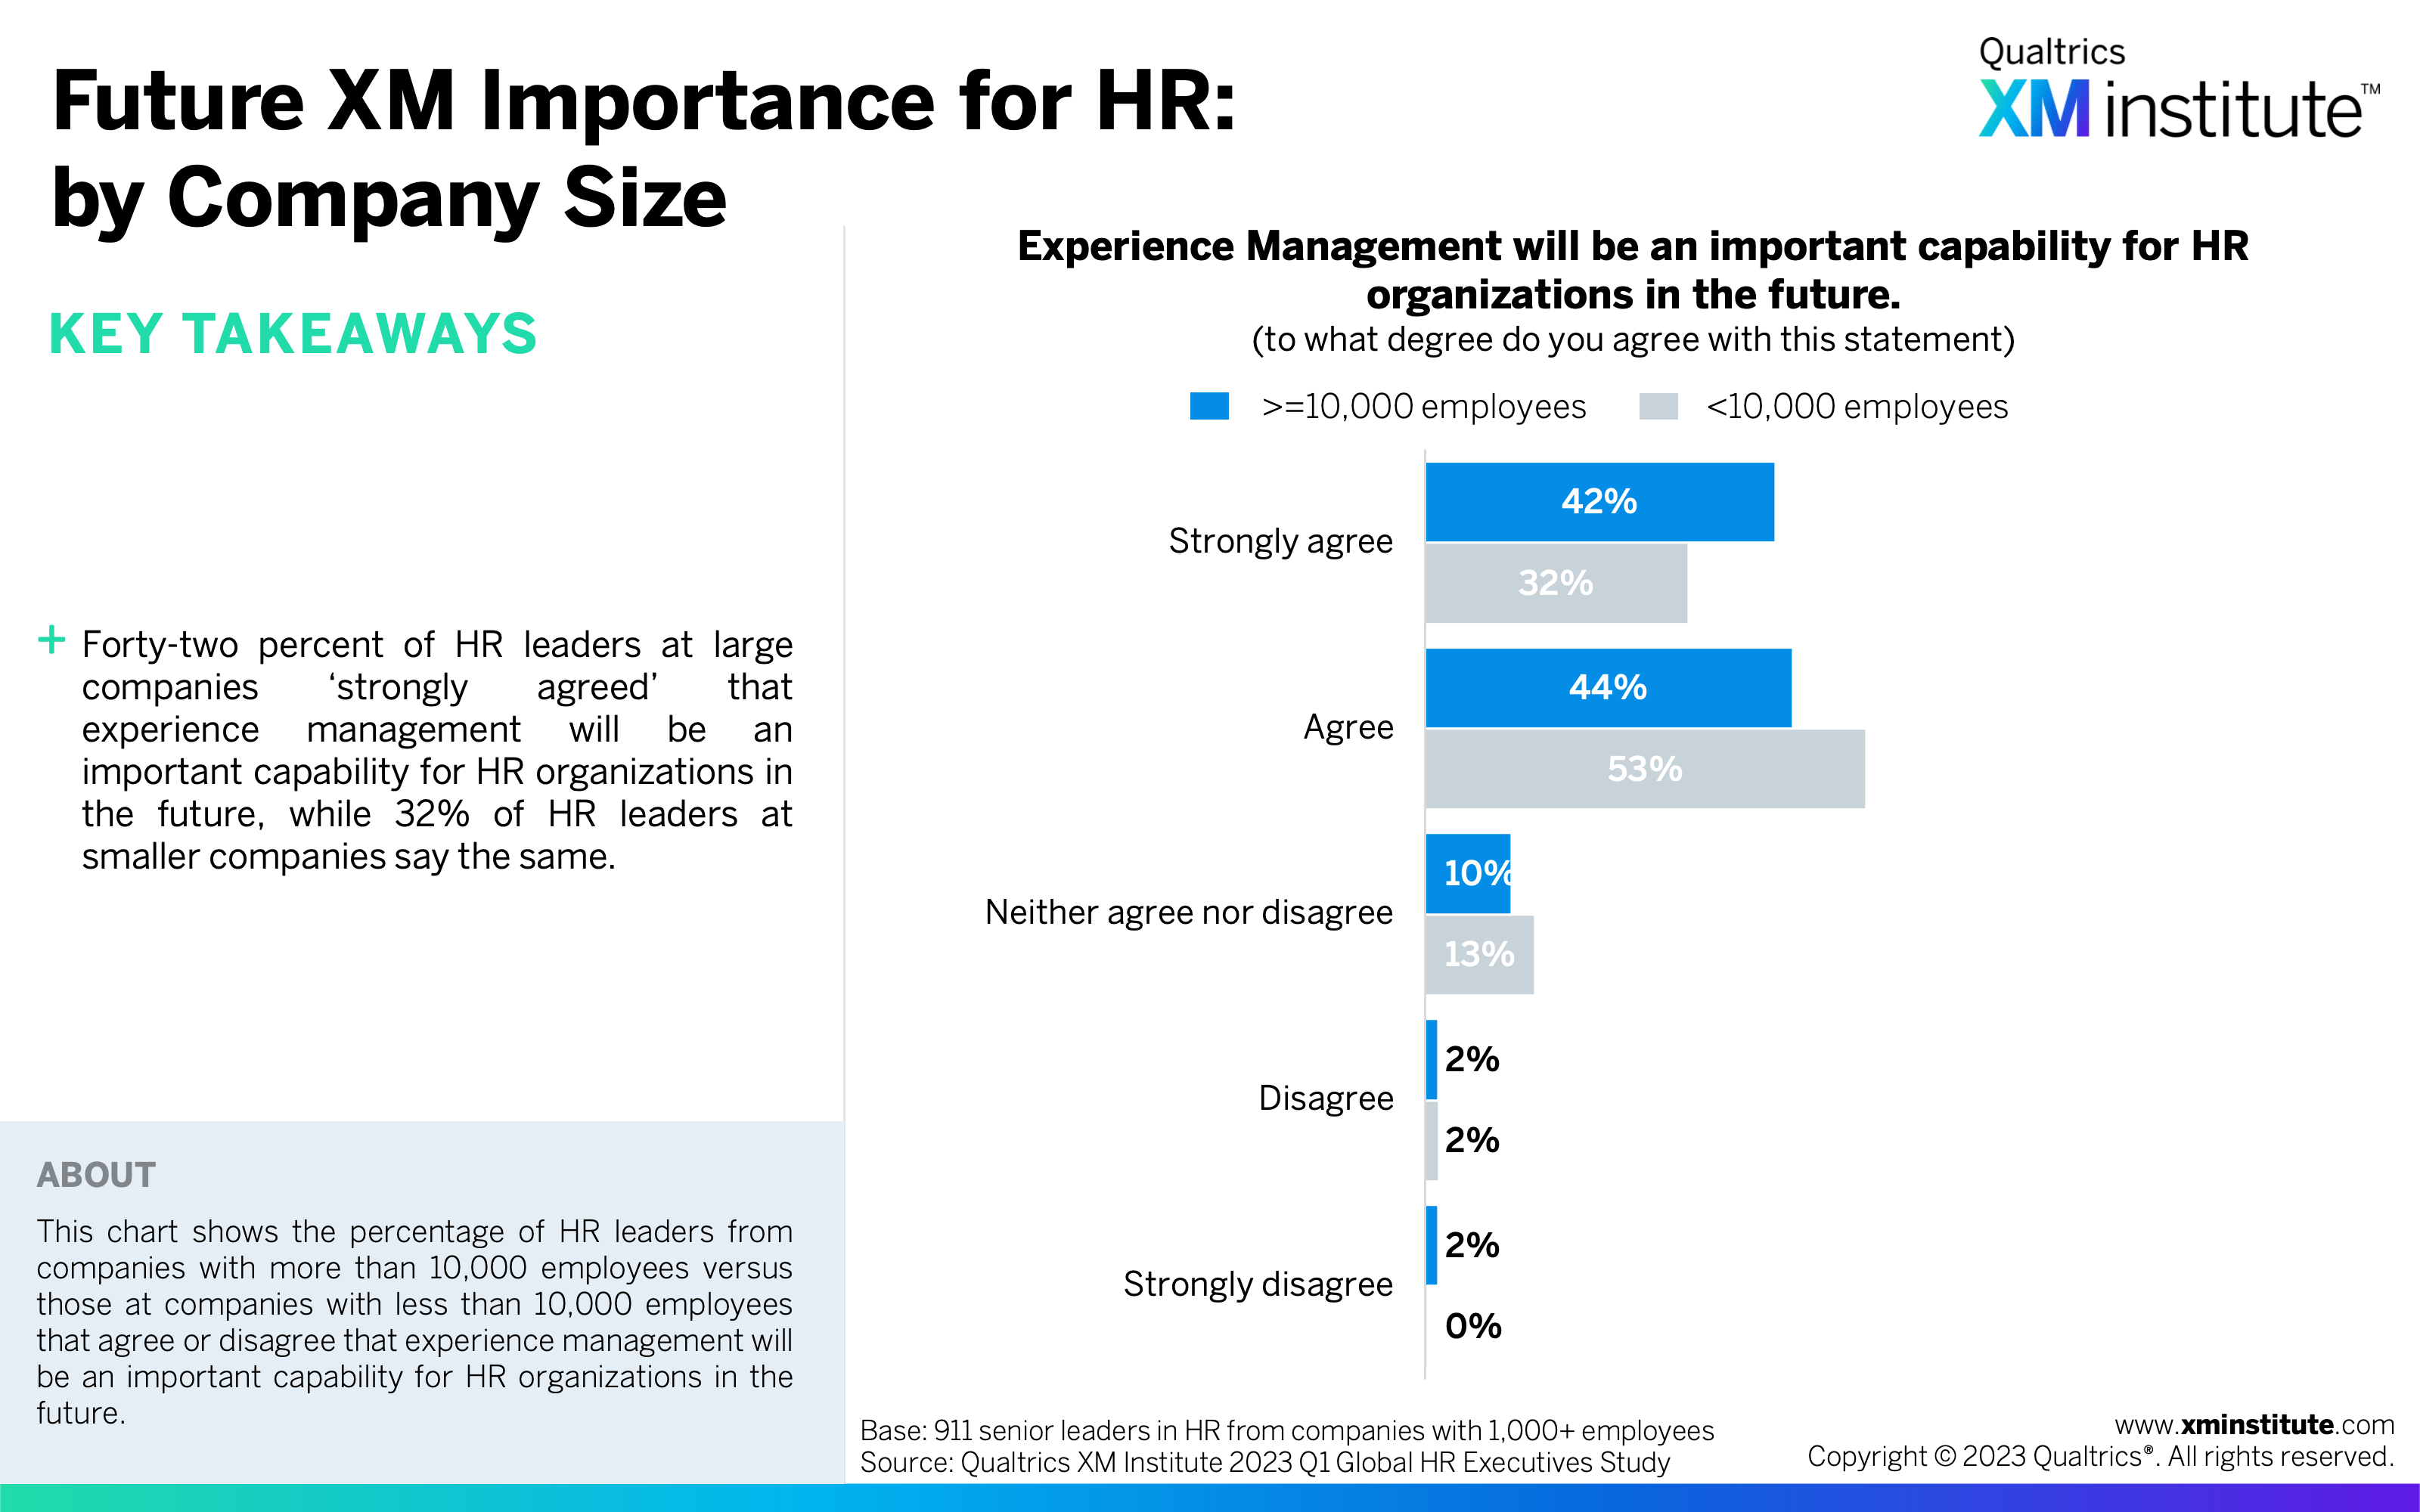
- Future XM Importance for HR: by Company Size (see Figure 29)
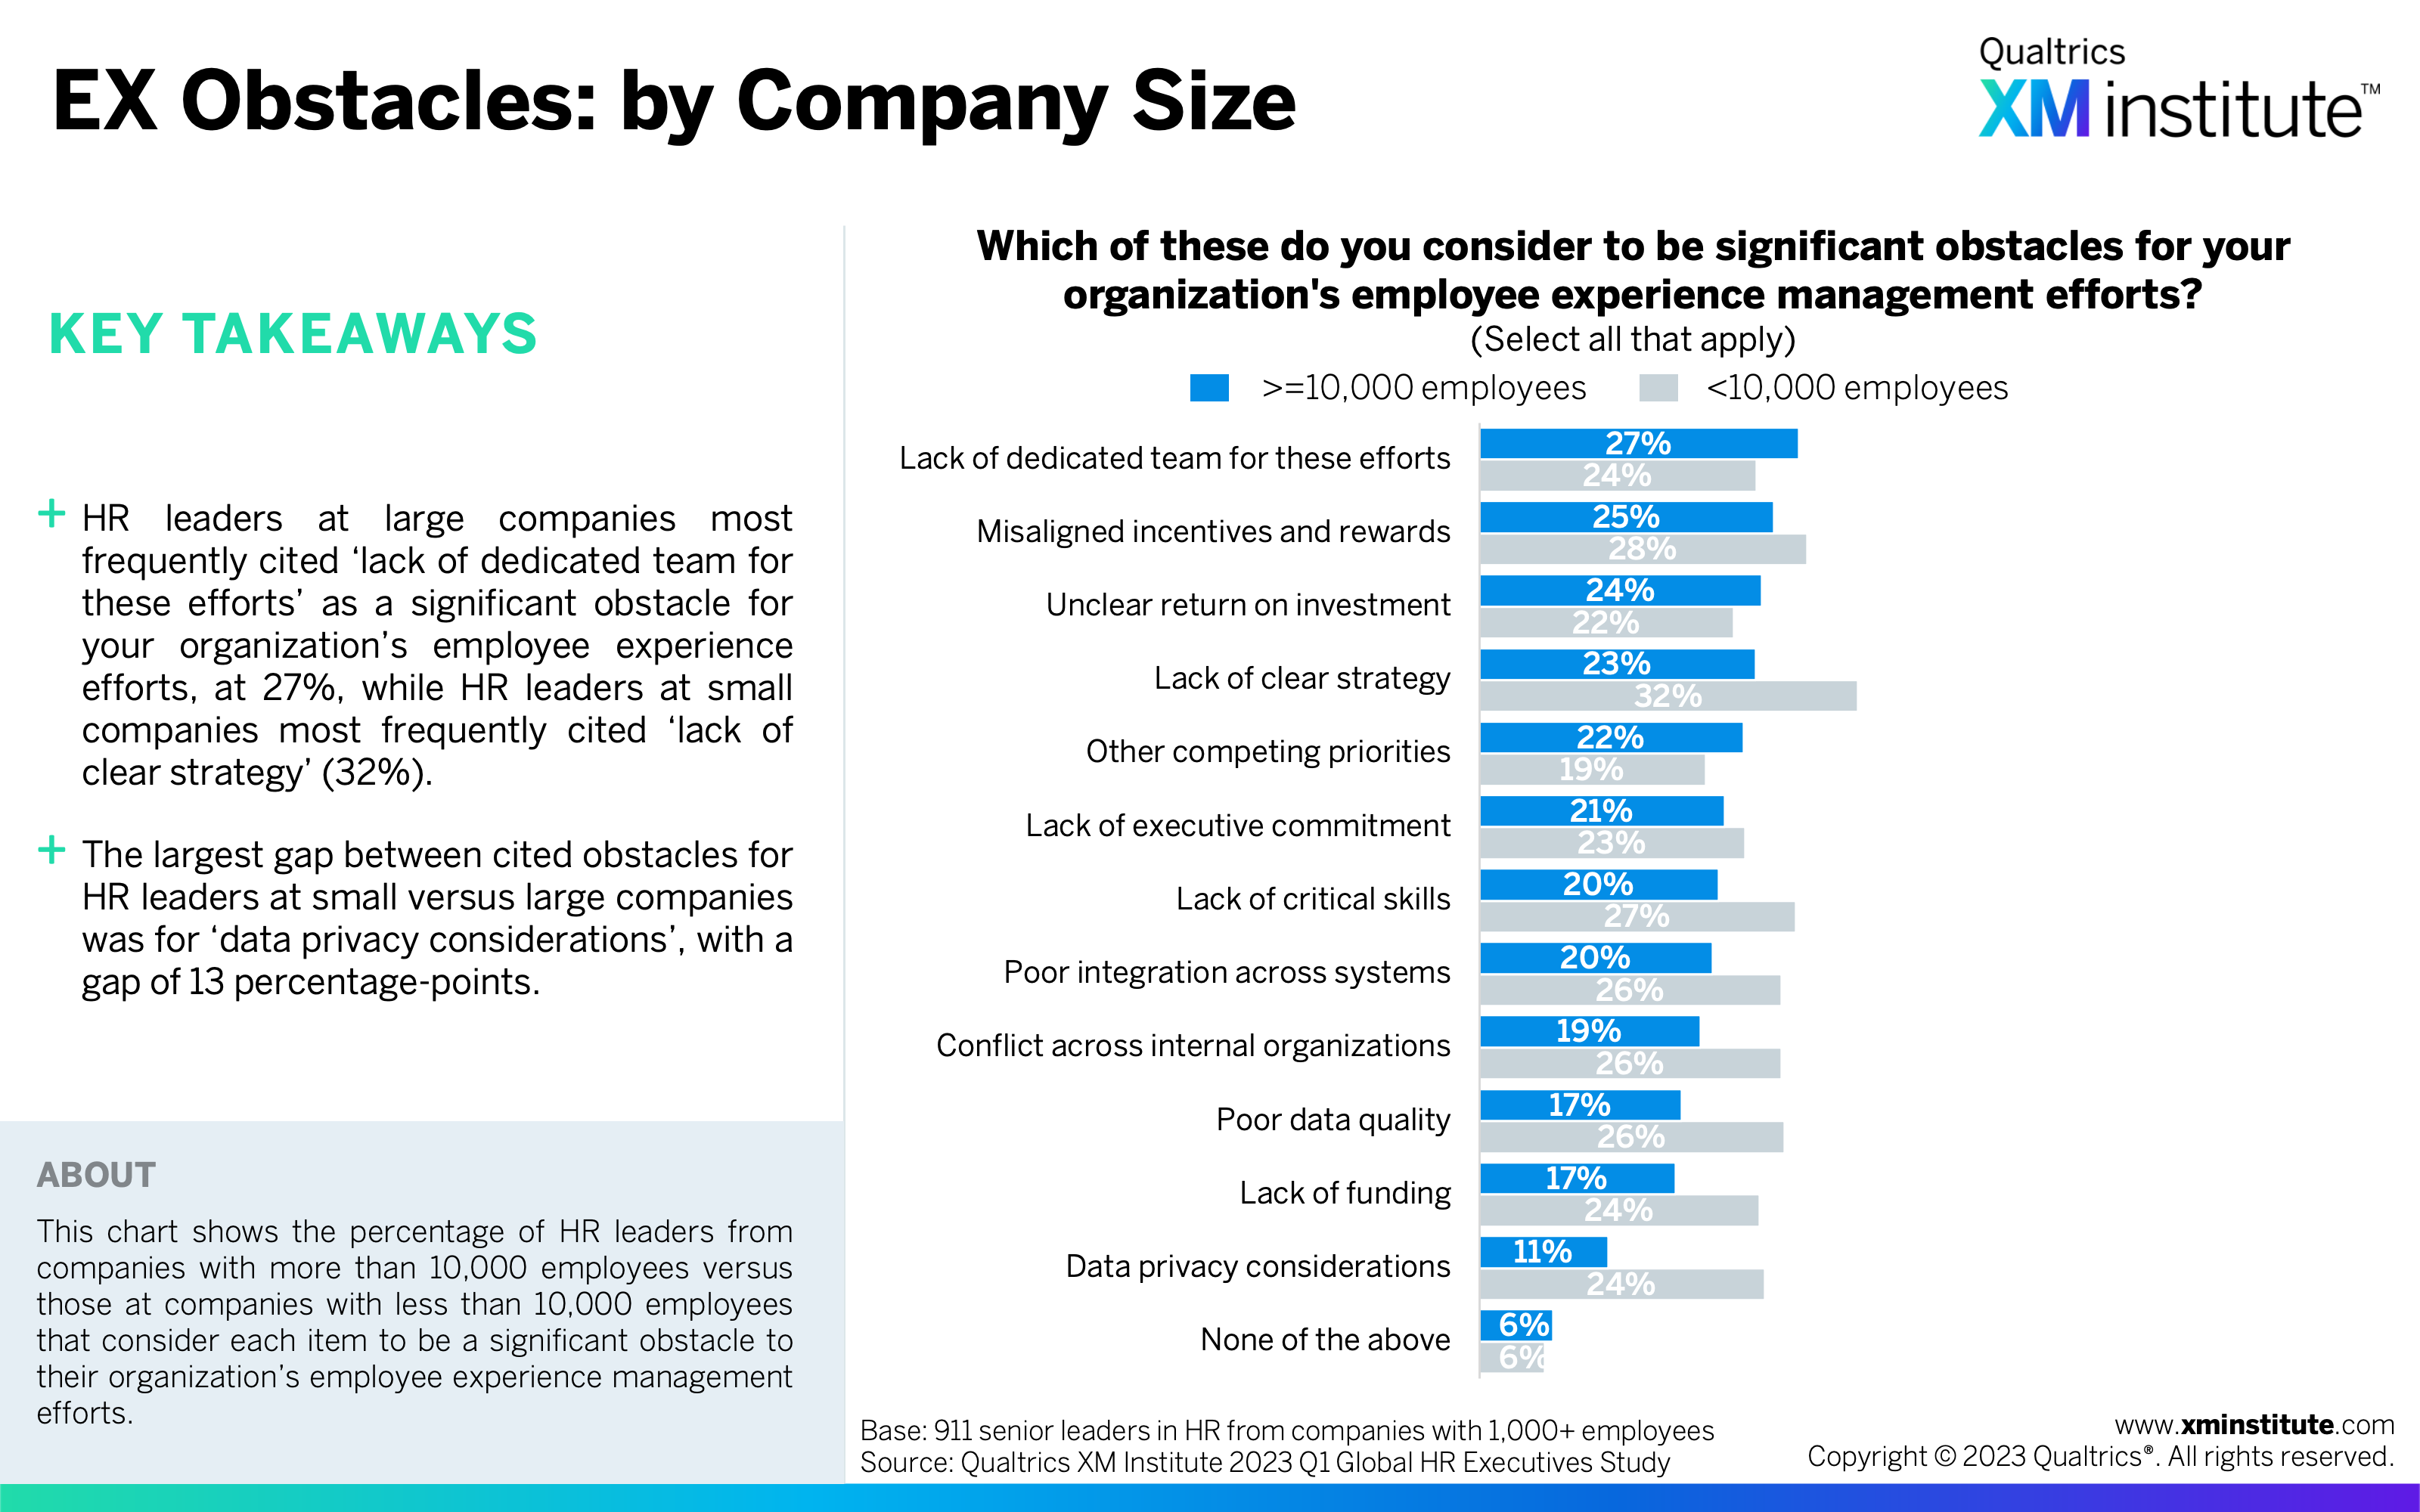
- EX Obstacles: by Company Size (see Figure 30)
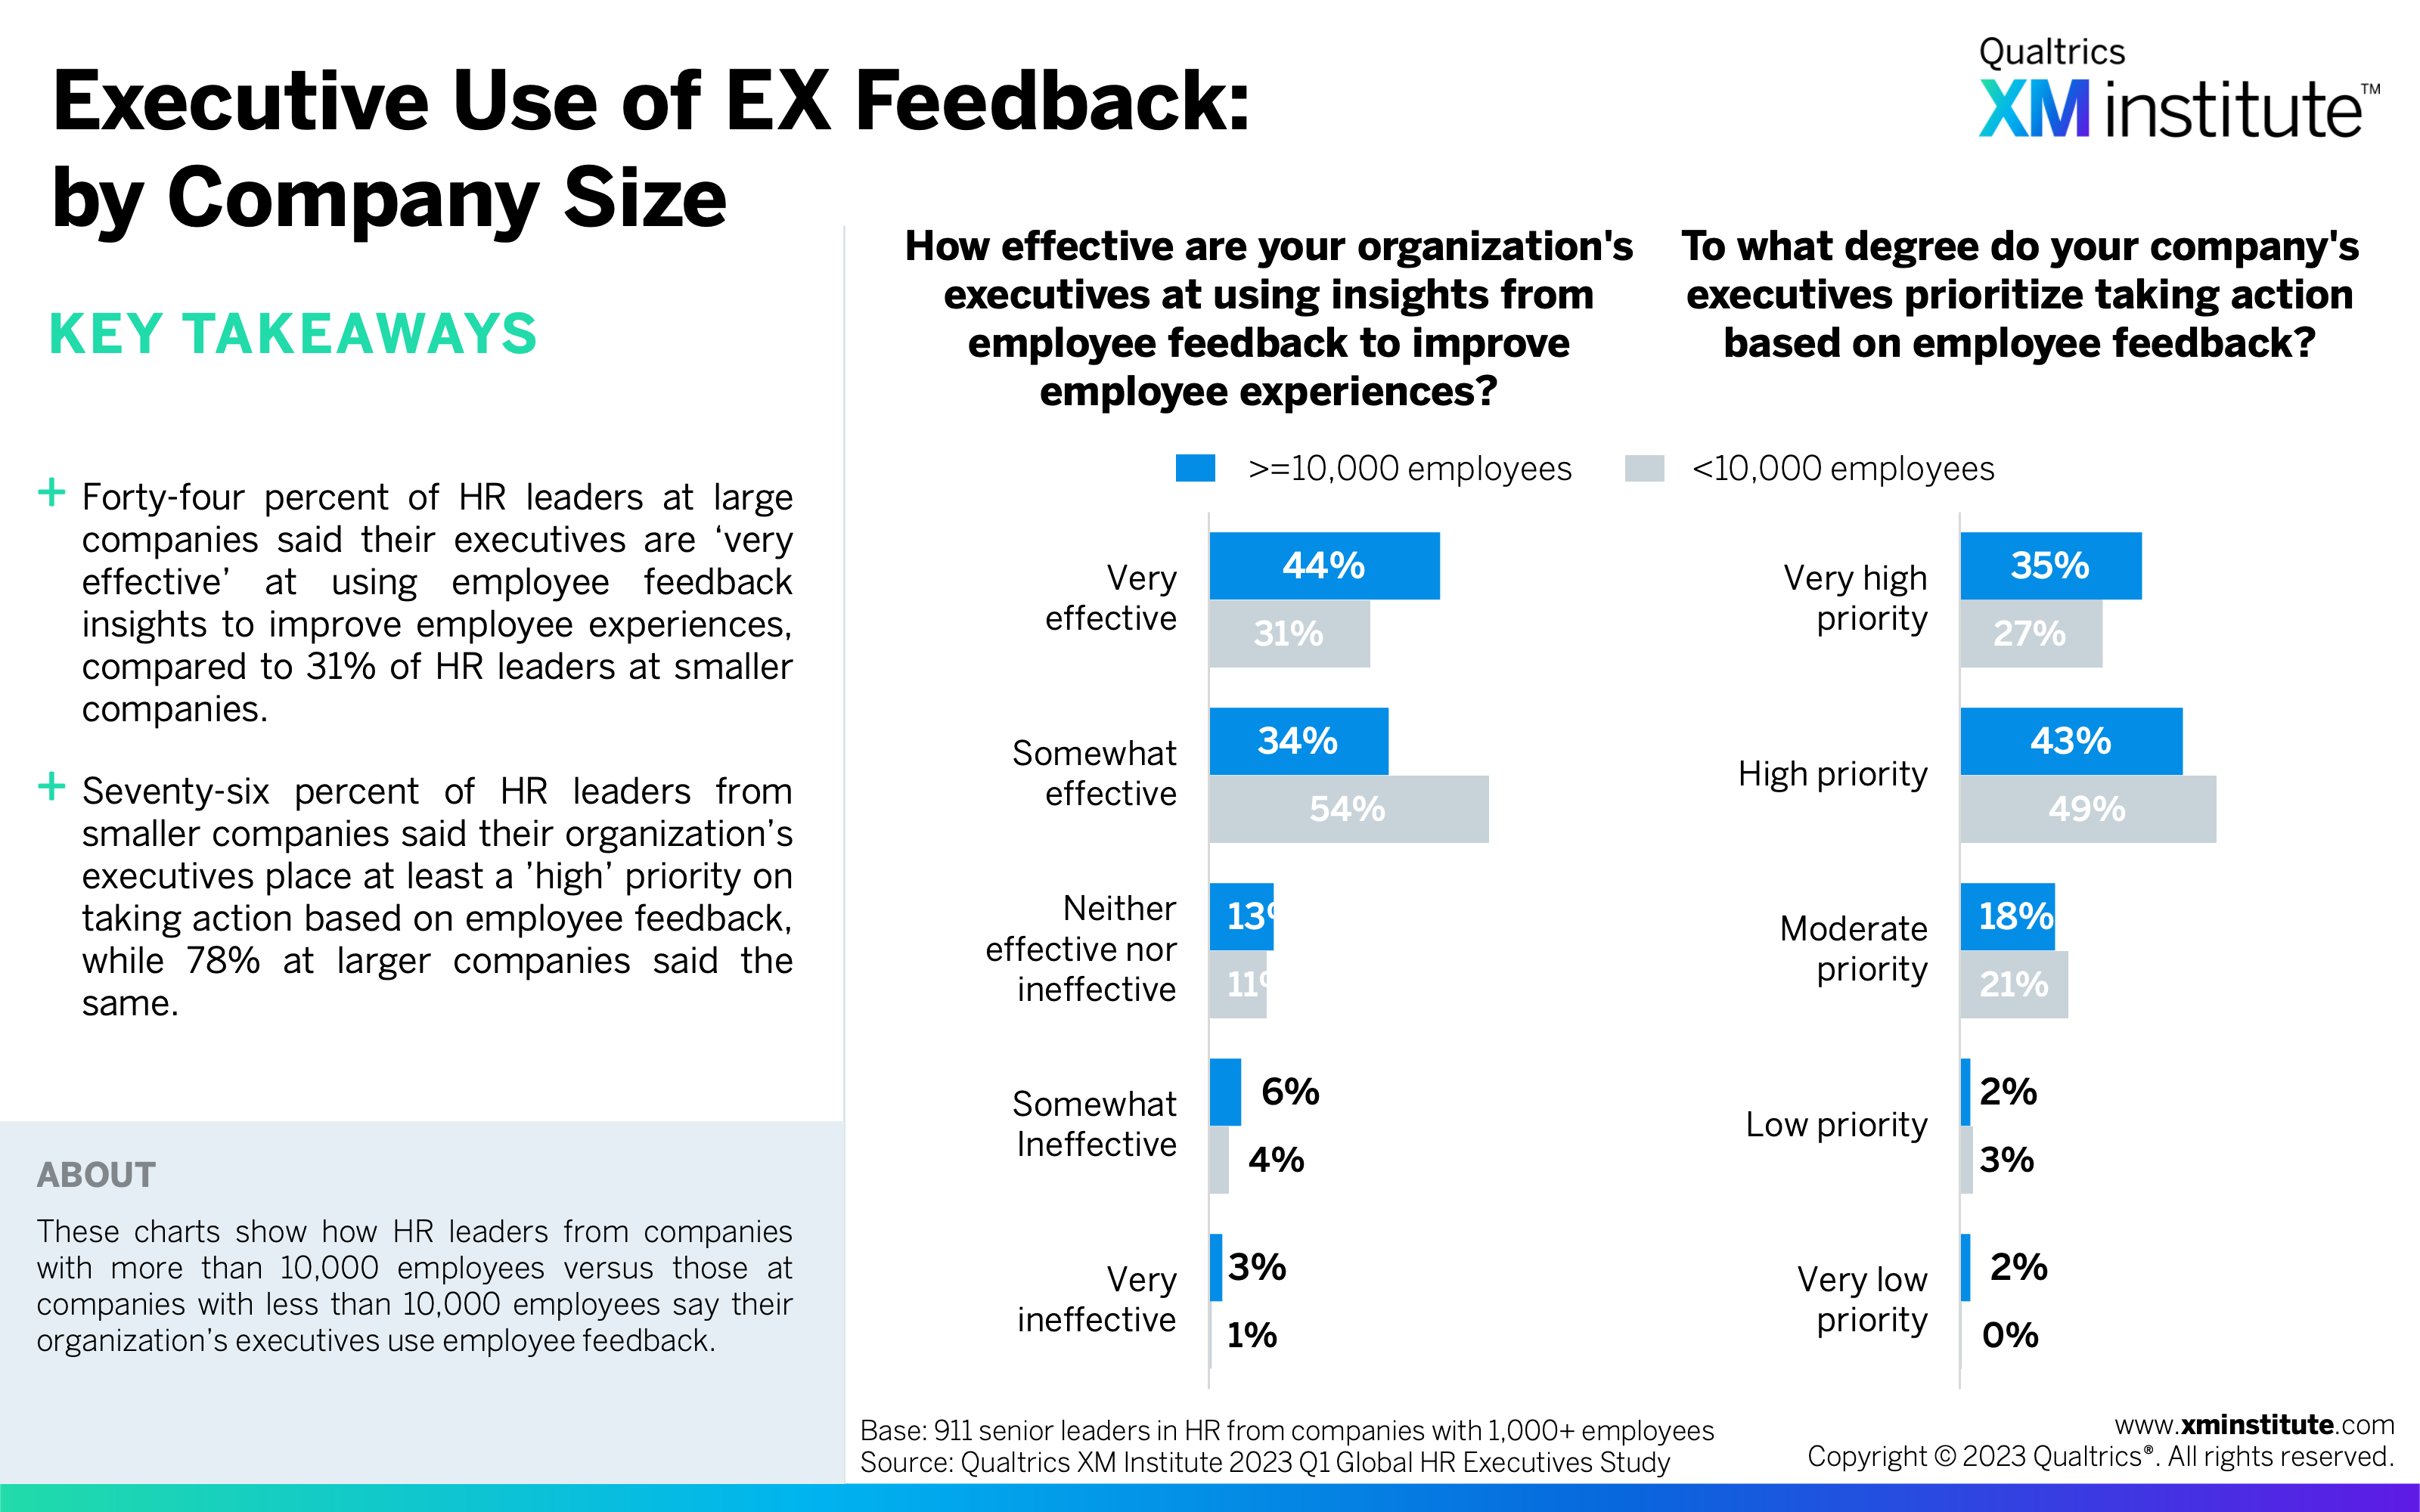
- Executive Use of EX Feedback: by Company Size (see Figure 31)
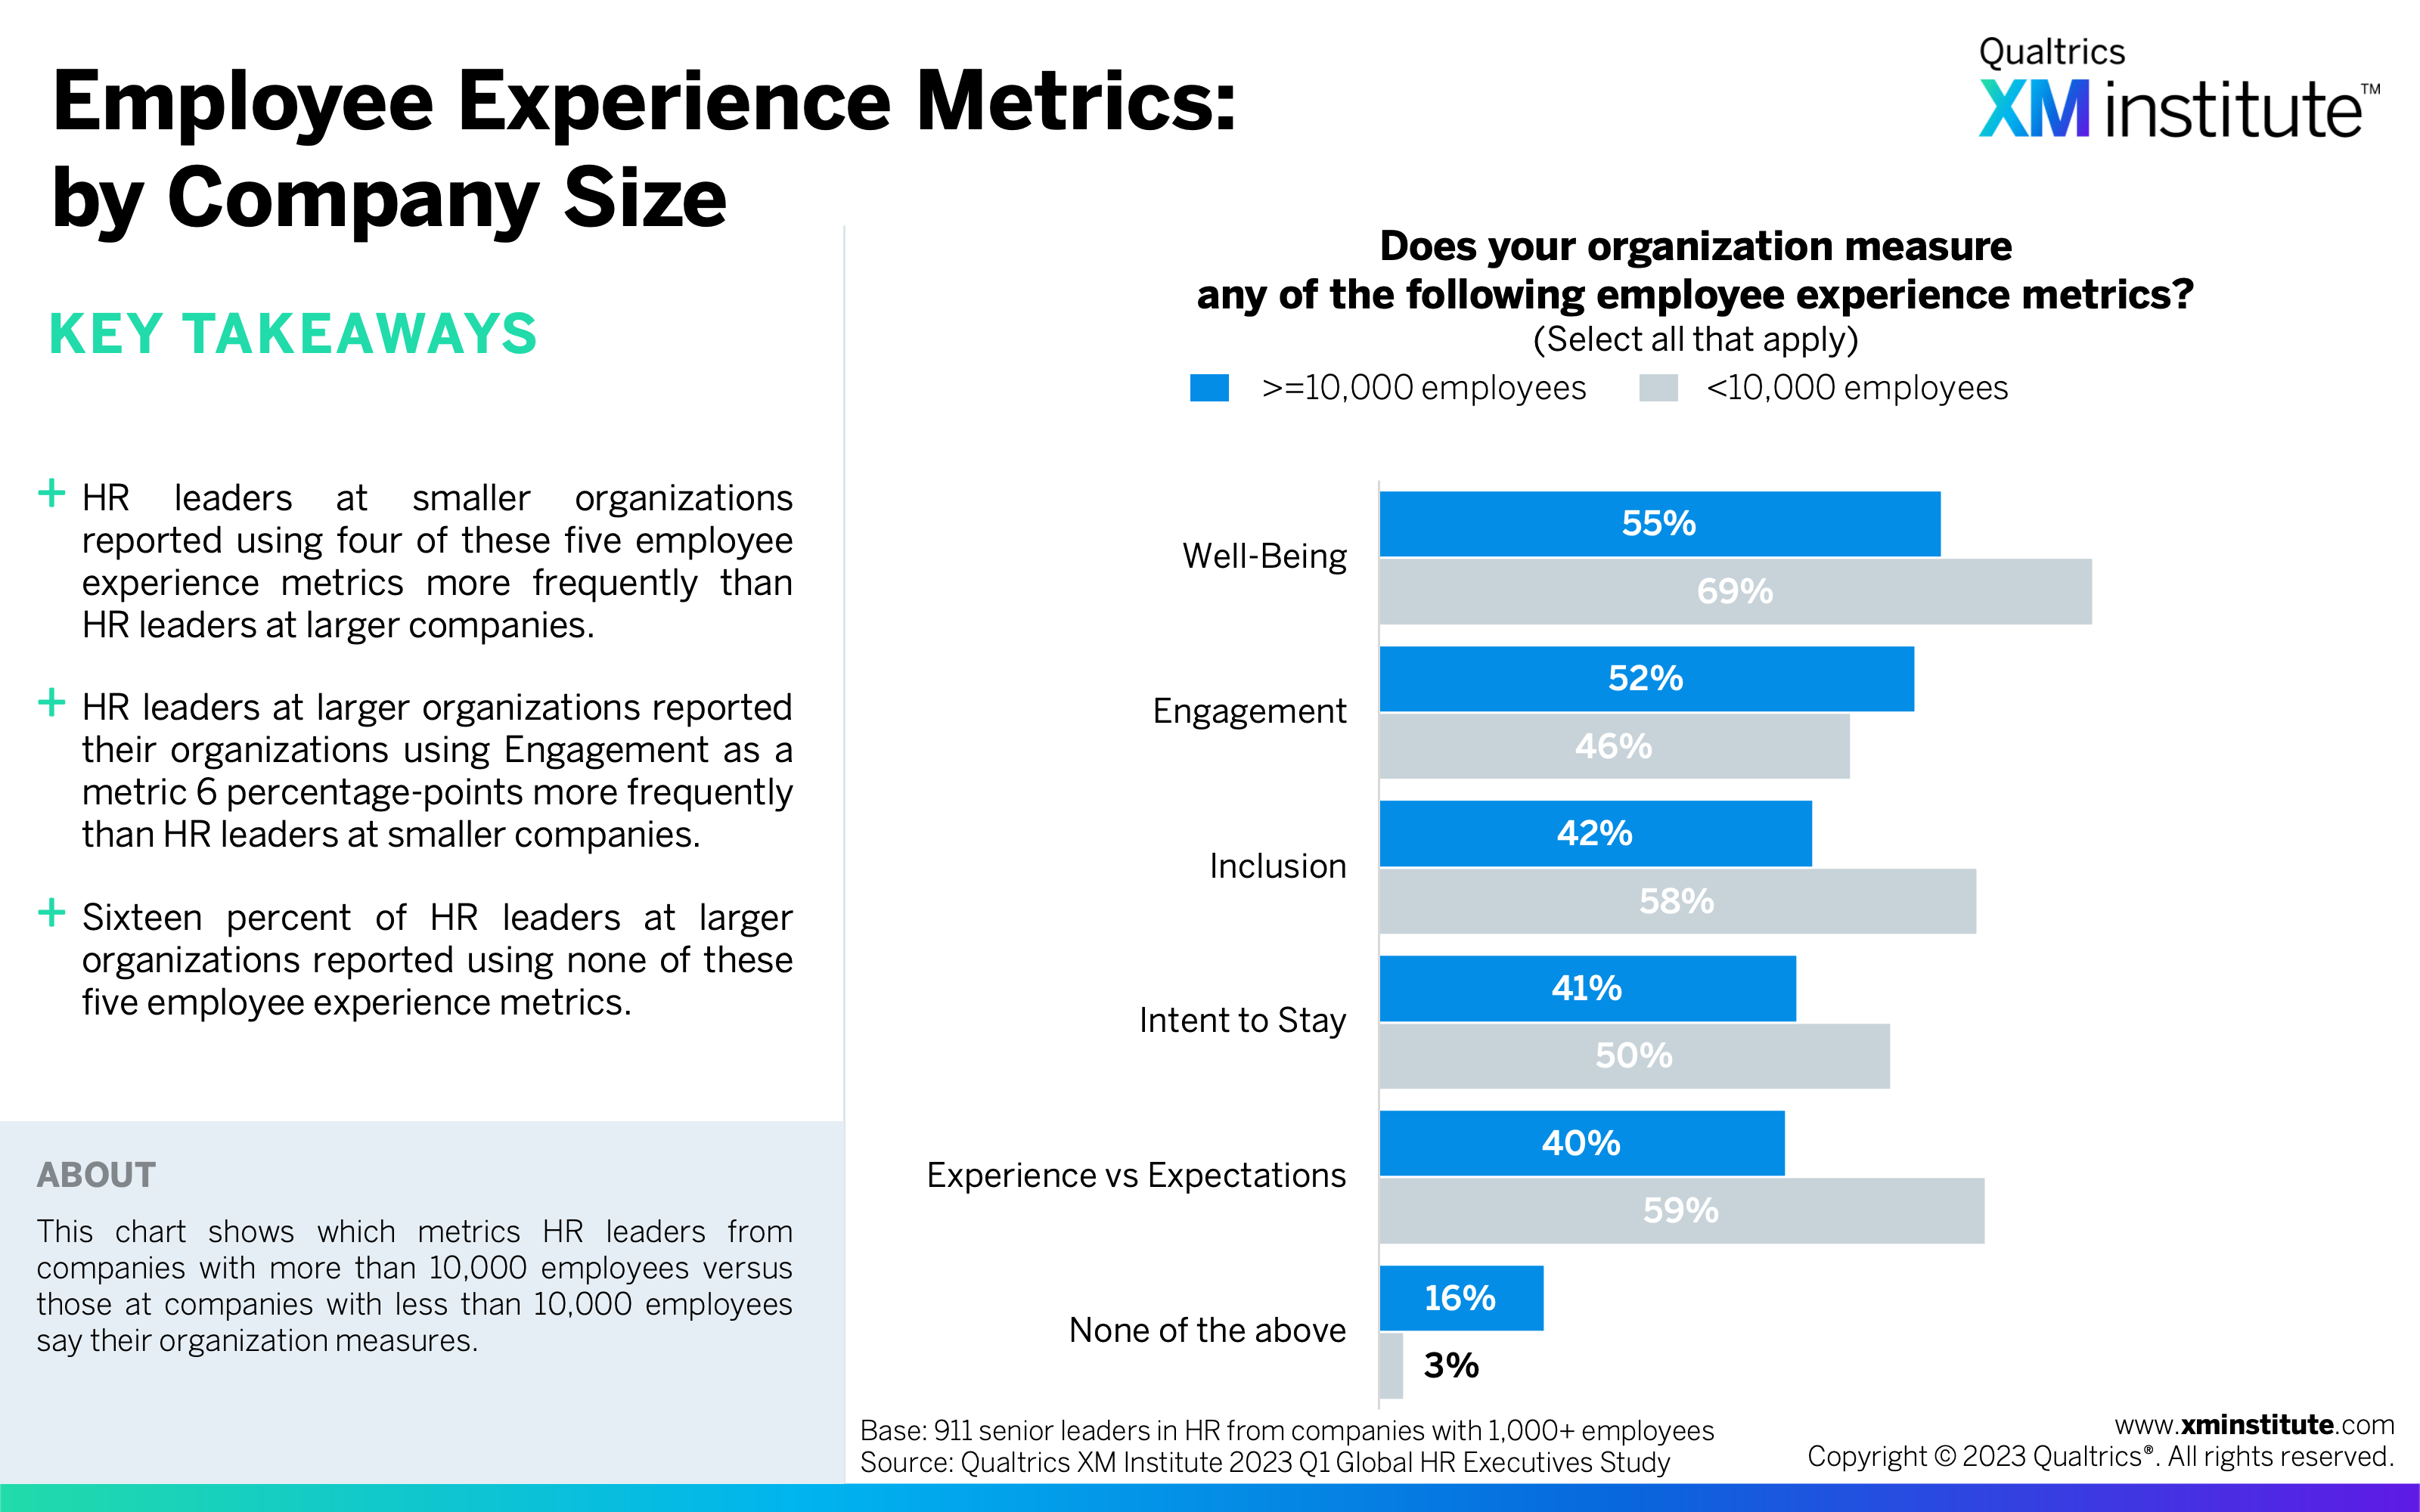
- Employee Experience Metrics: by Company Size (see Figure 32)
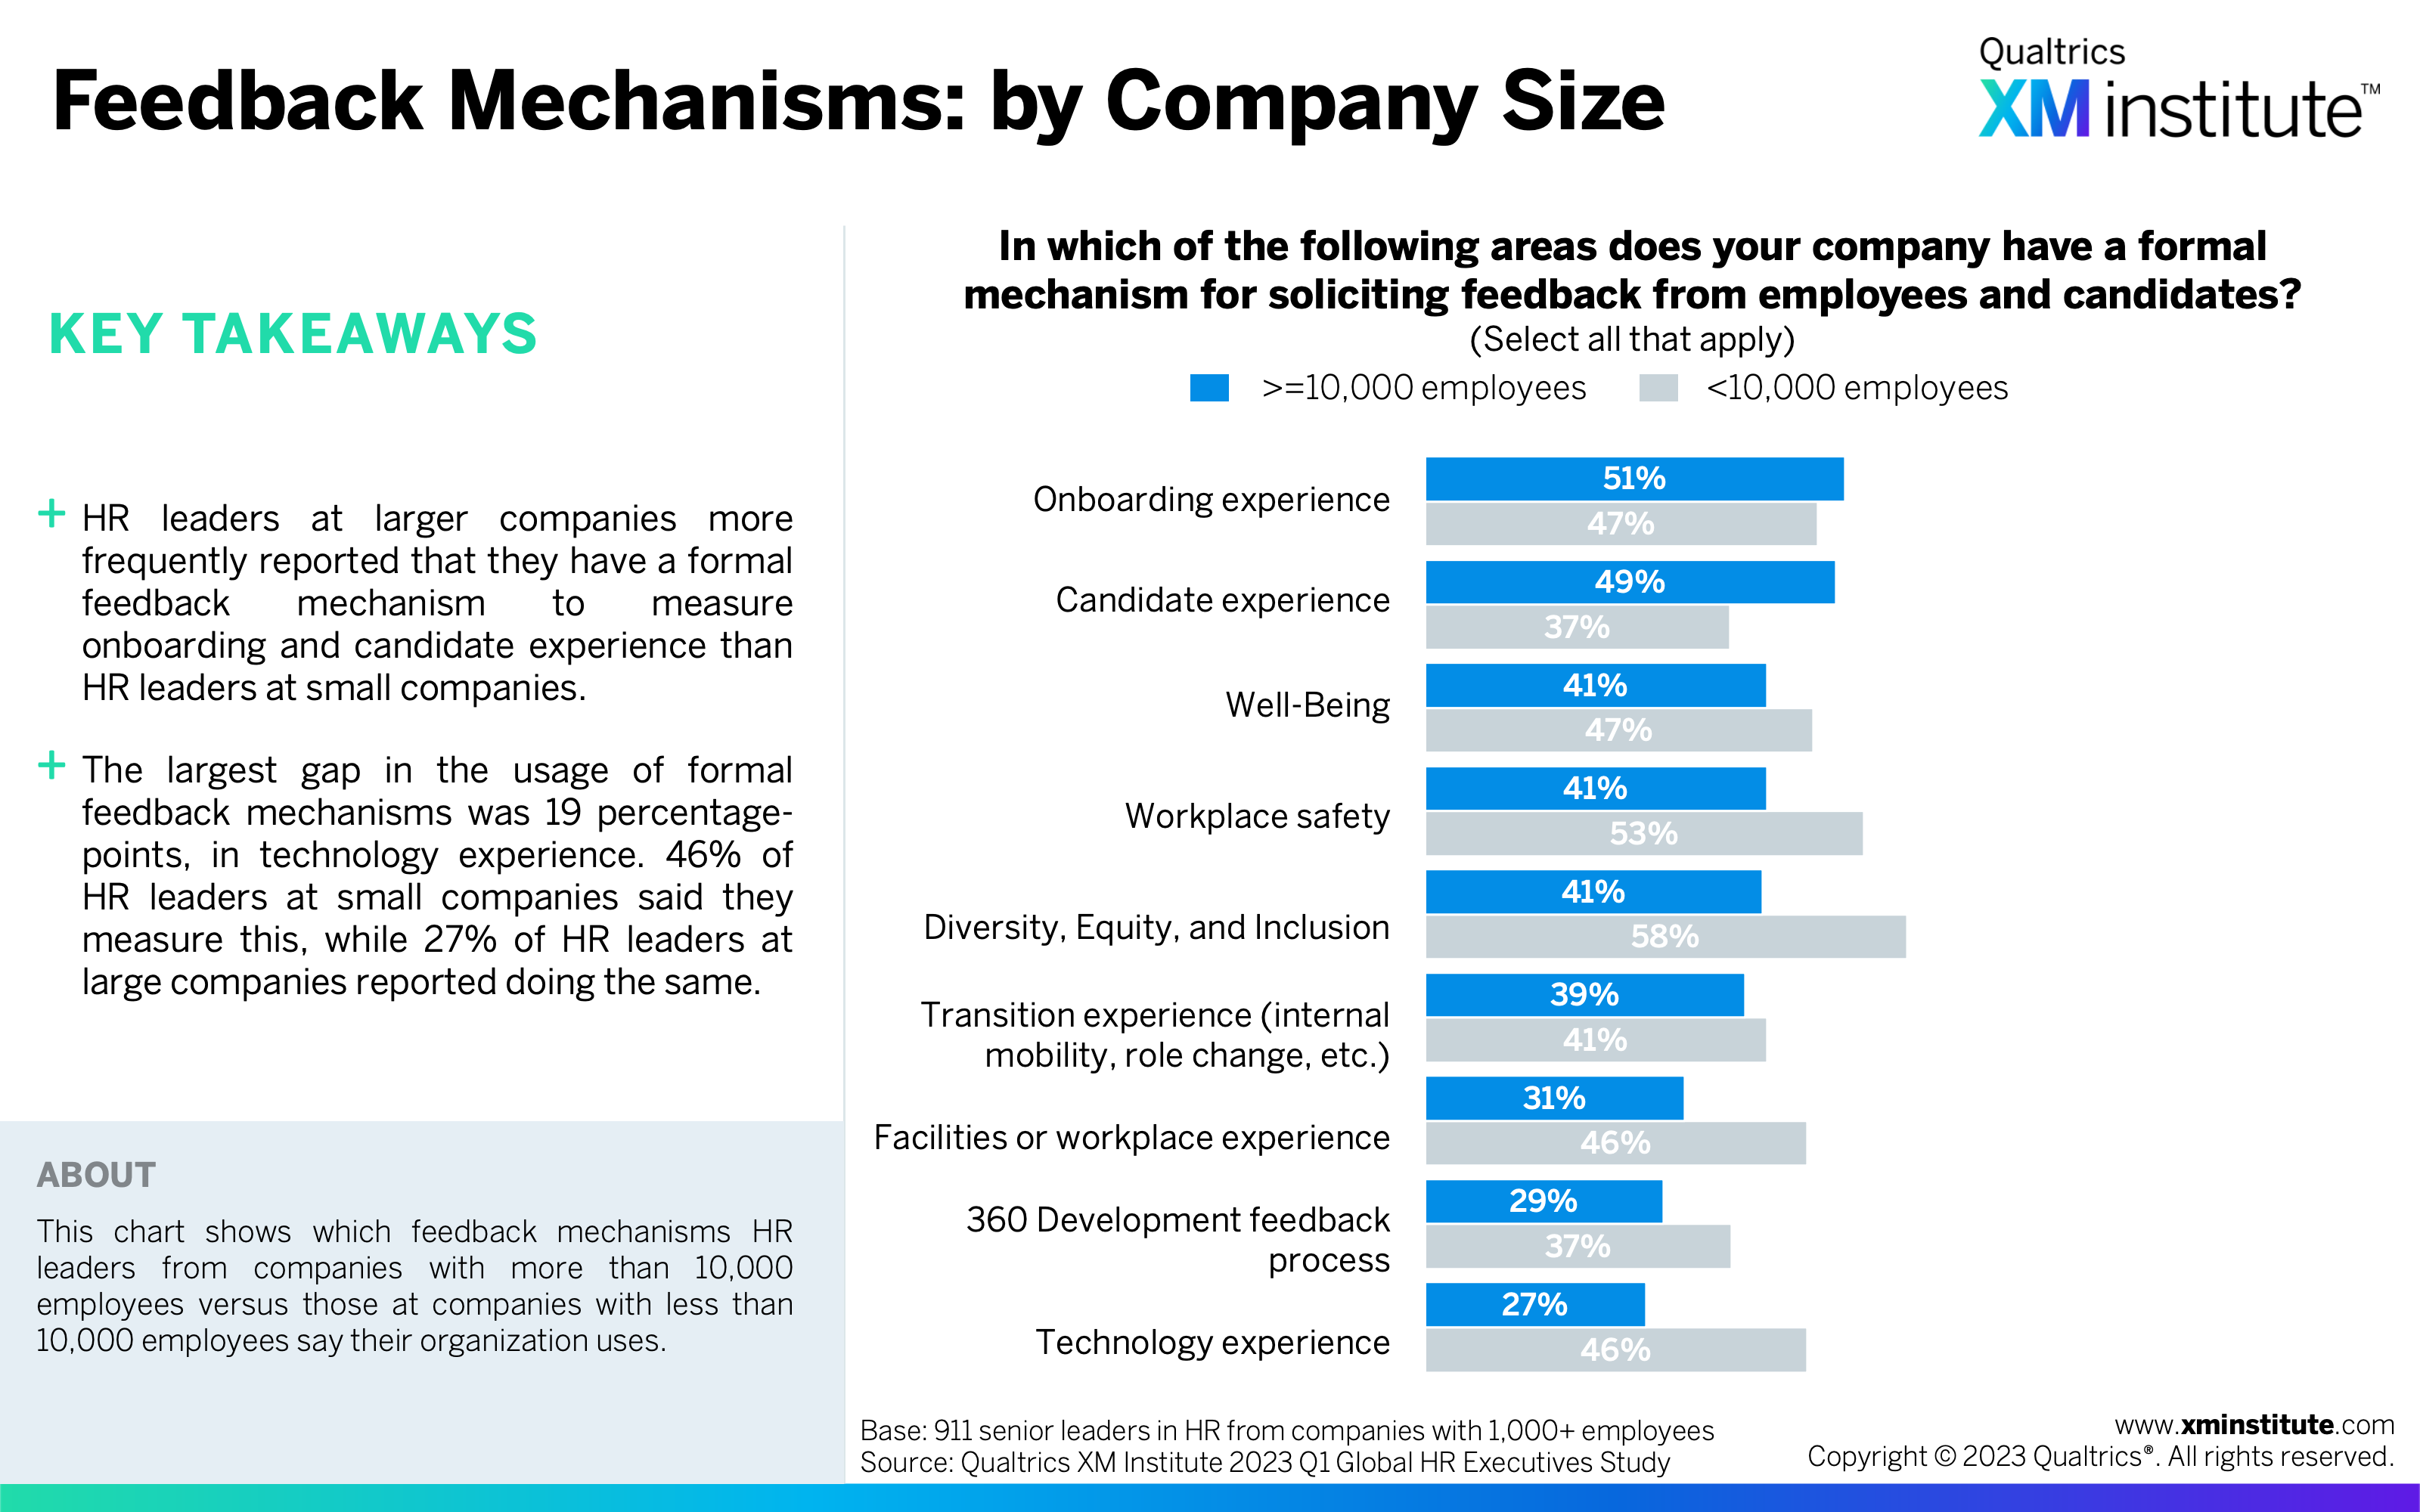
- Feedback Mechanisms: by Company Size (see Figure 33)
- Data Privacy Risks: by Company Size (see Figure 34)
- Methodology (see Figure 35)