Key Findings
As part of Qualtrics XM Institute’s 2023 Global Consumer Study, 28,400 consumers rated their recent experiences with 20 industries on a satisfaction scale of 1-5 stars and told us how likely they are to trust, recommend, and purchase more after that experience. From their responses, we examined the ROI of customer experience. Through our analysis, we learned that:
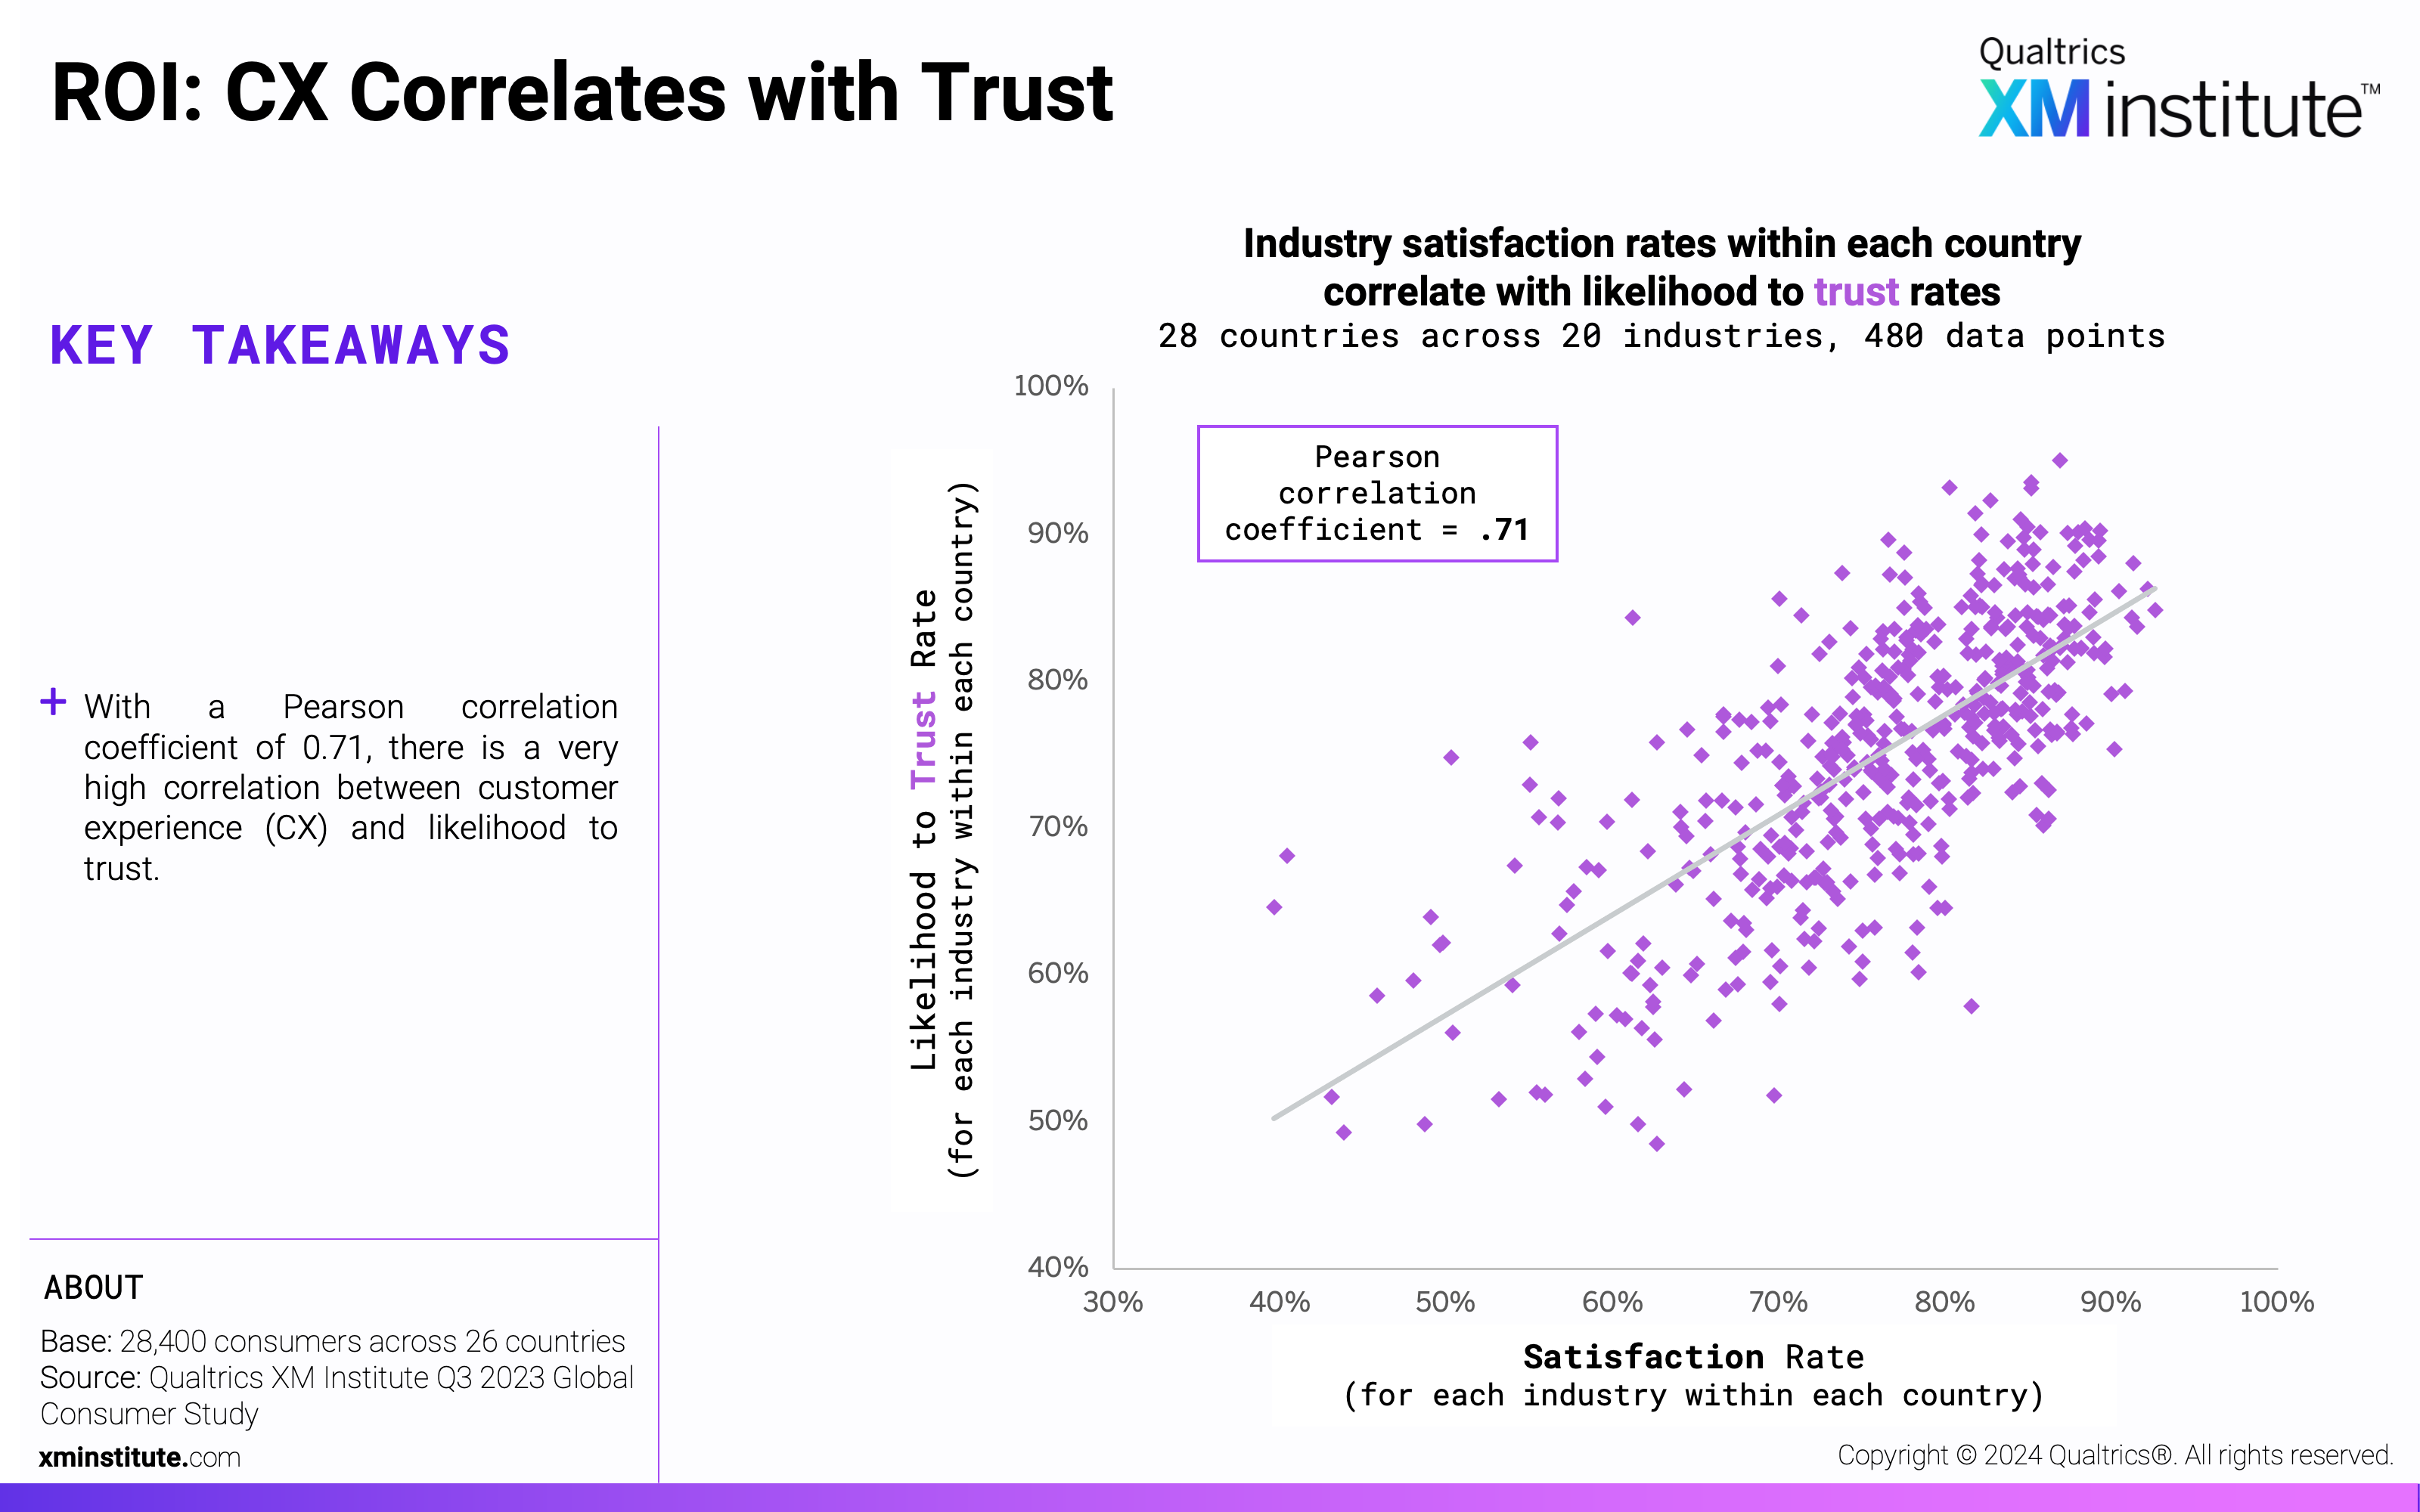
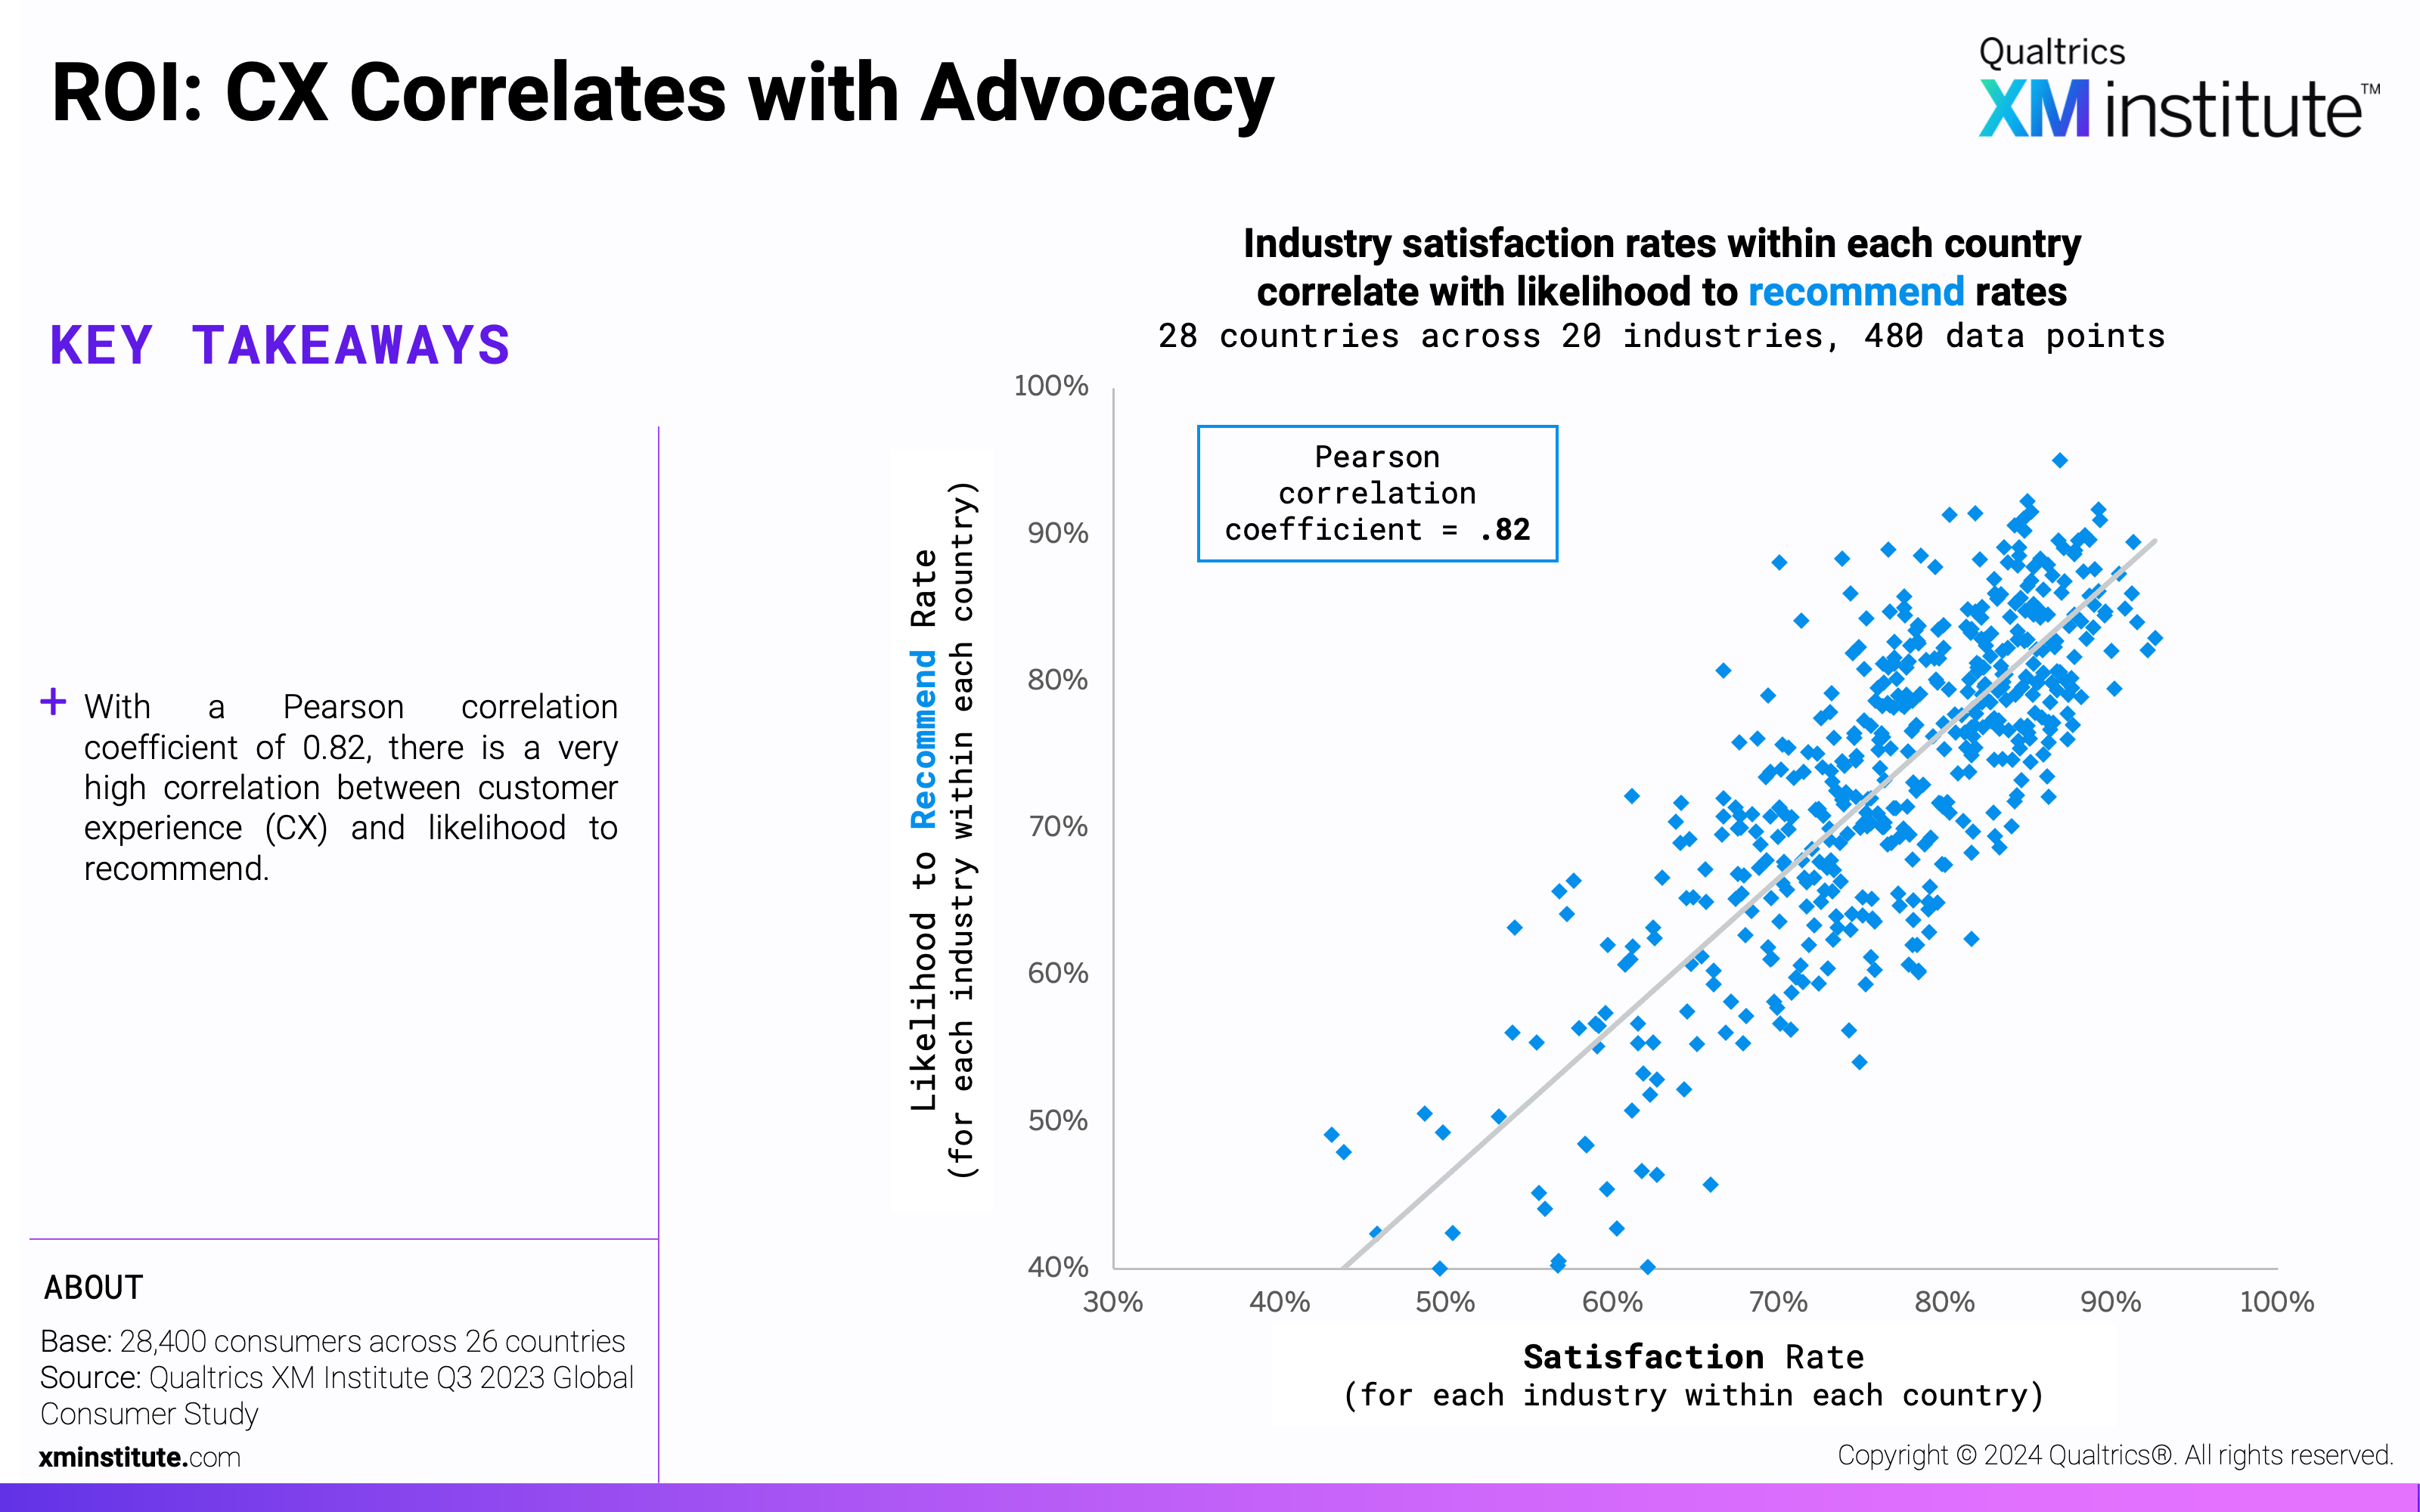
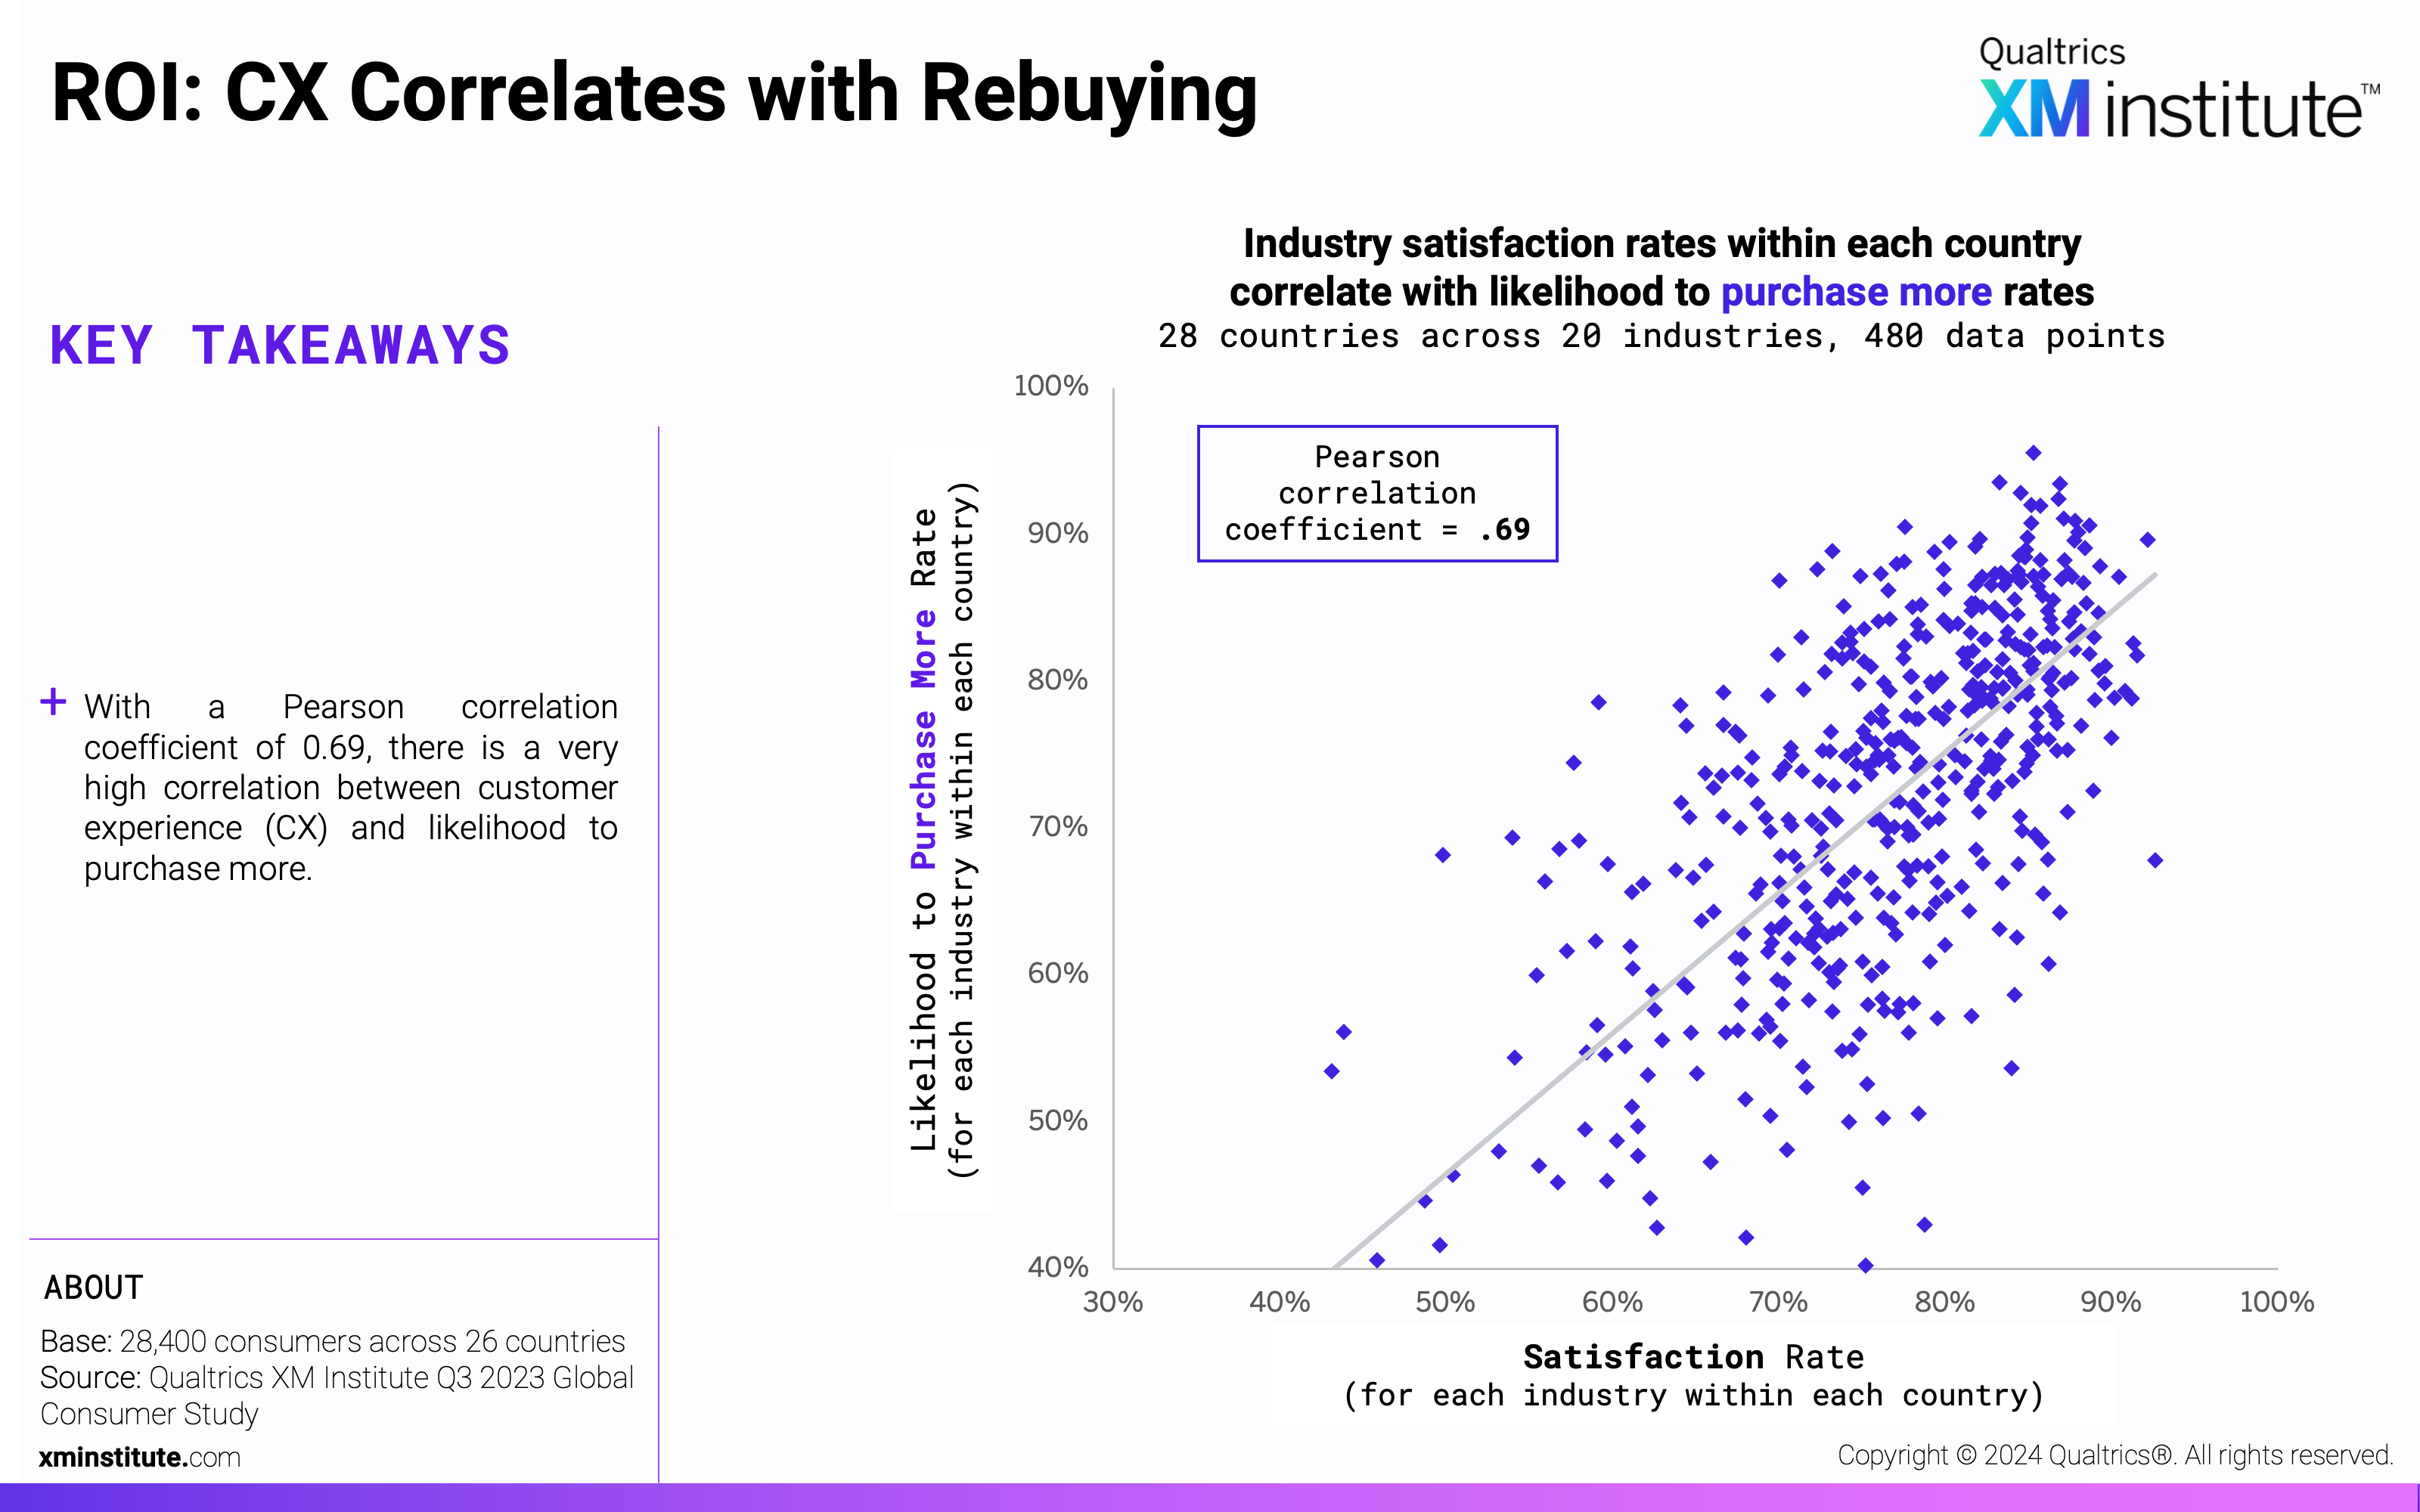
- Consumer satisfaction impacts key loyalty behaviors. Satisfaction has a very high correlation with consumers’ likelihood to trust, recommend, and purchase more.
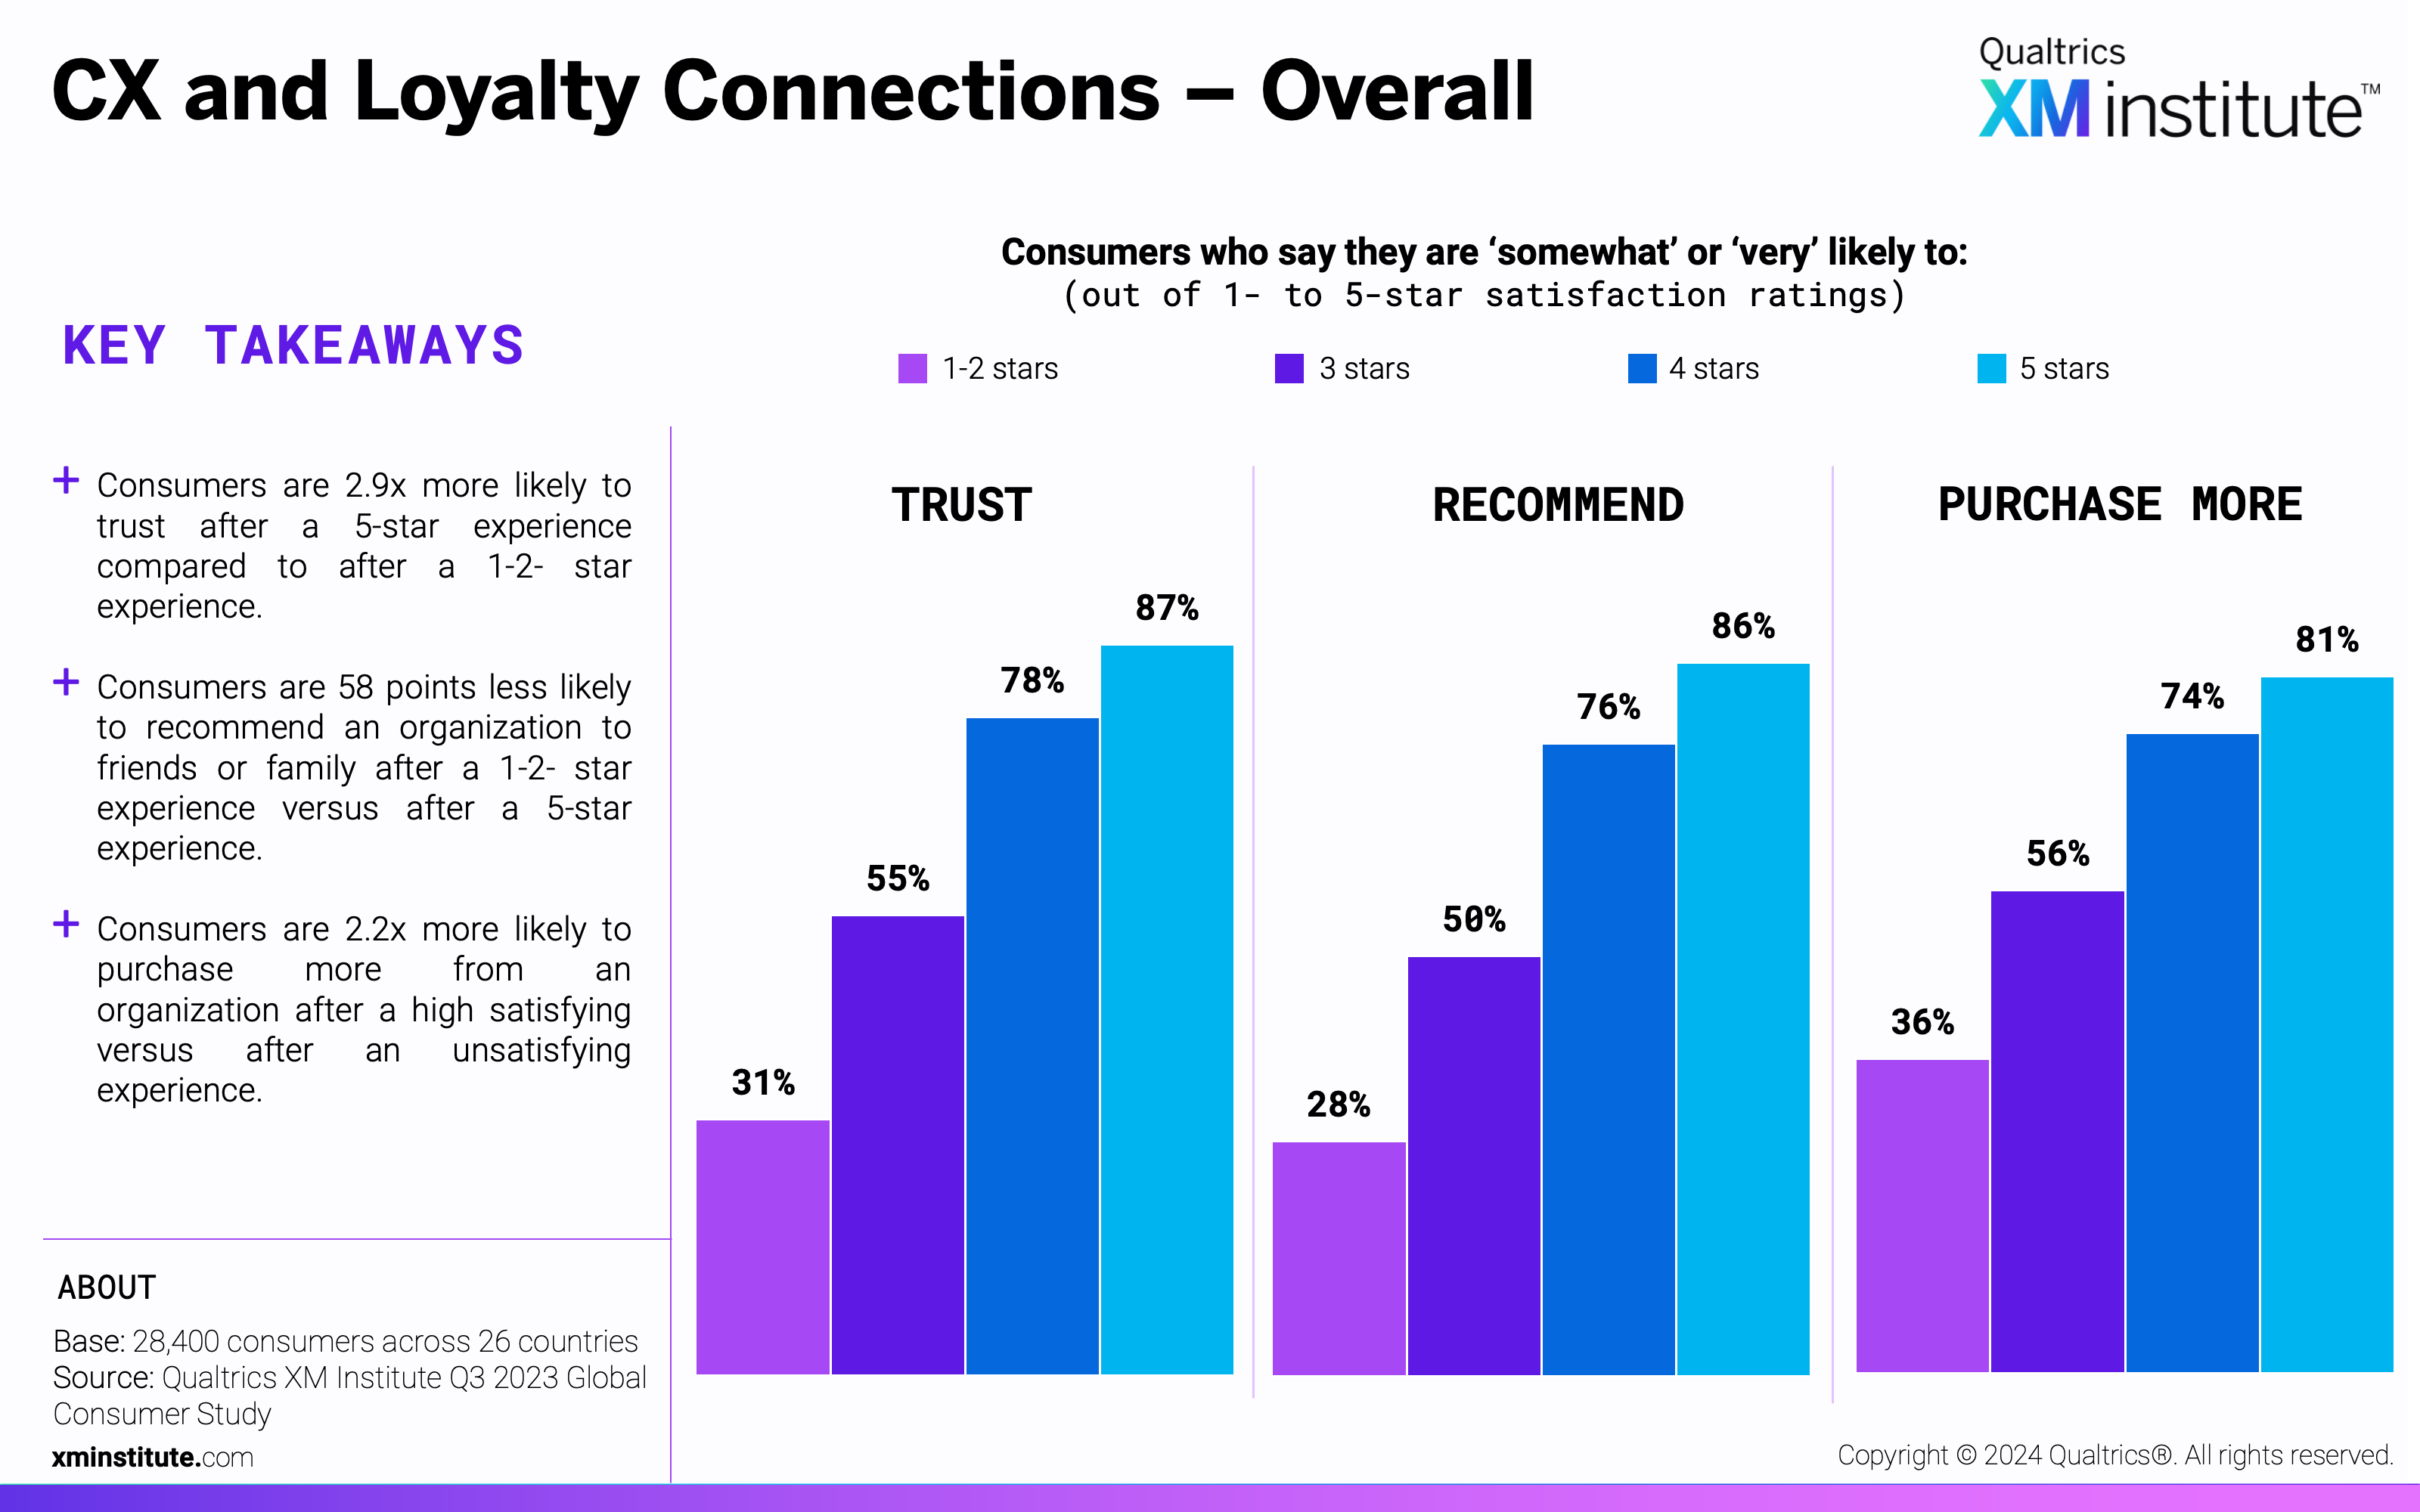
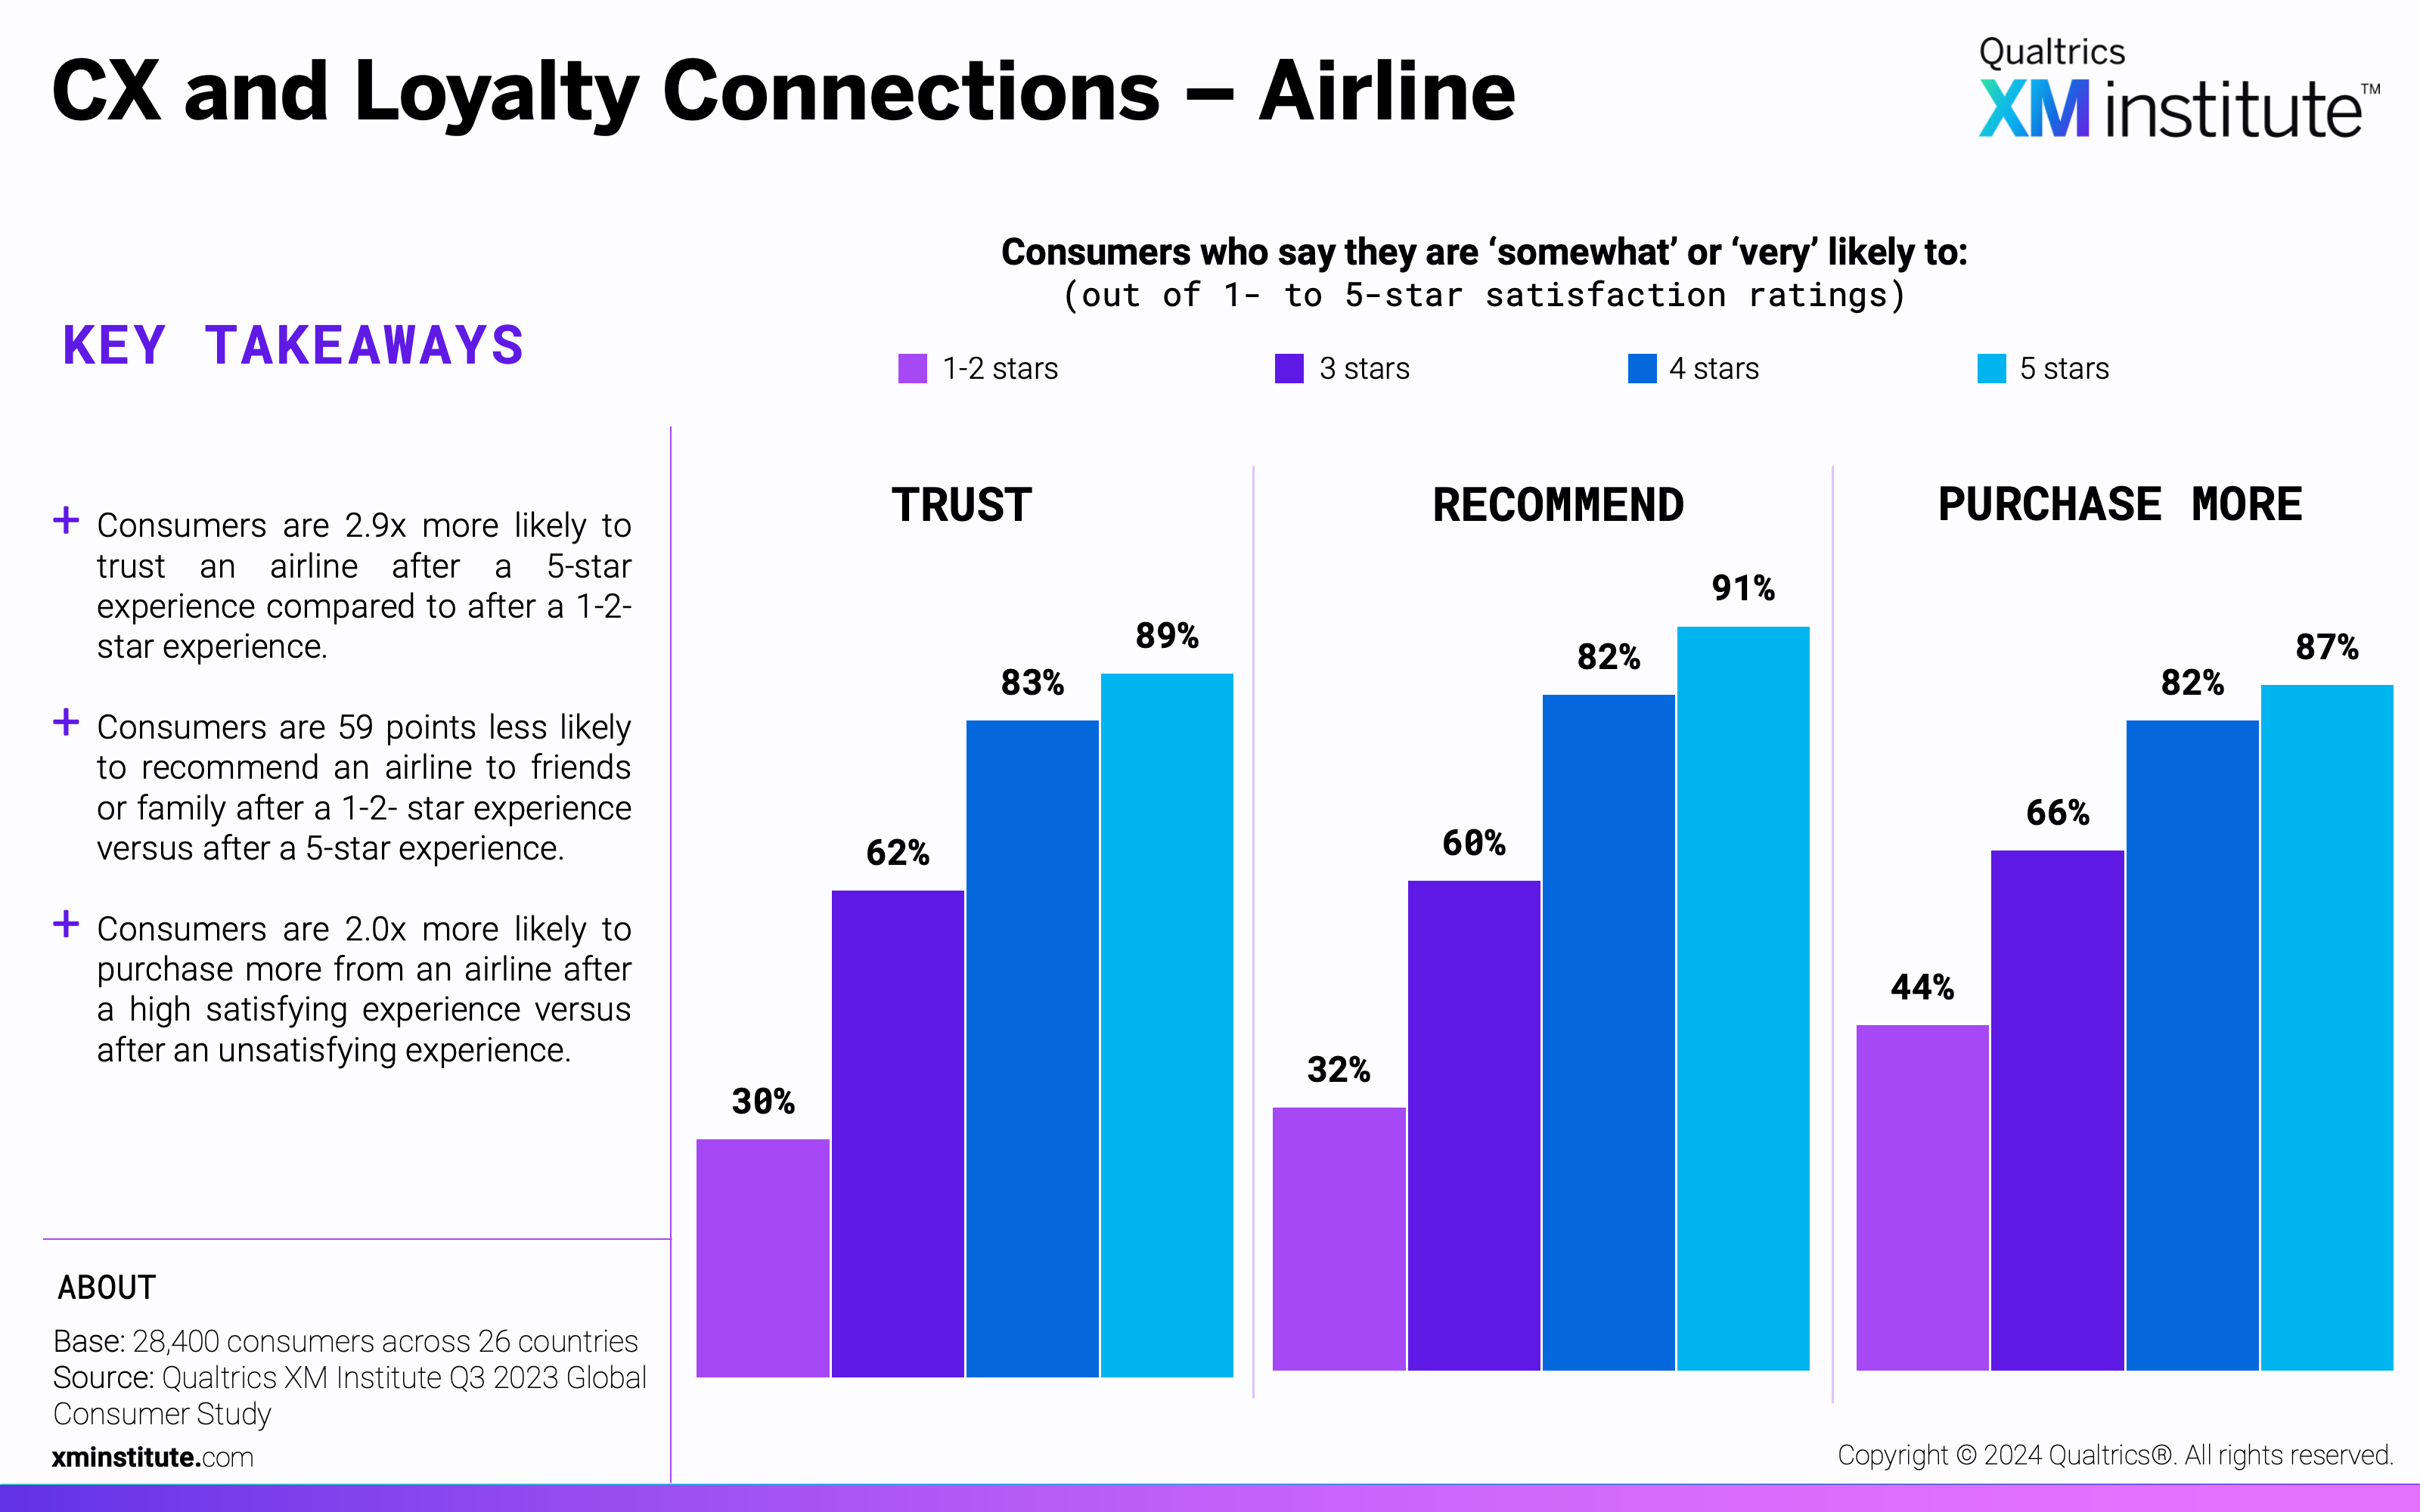
- Consumers’ likelihood to recommend and trust similarly relate to consumer satisfaction. Compared to after a 1-2- star experience, after a 5-star experience, consumers are 2.9x more likely to trust and 3.0x more likely to recommend an organization yet are only 2.2x more likely to purchase more.
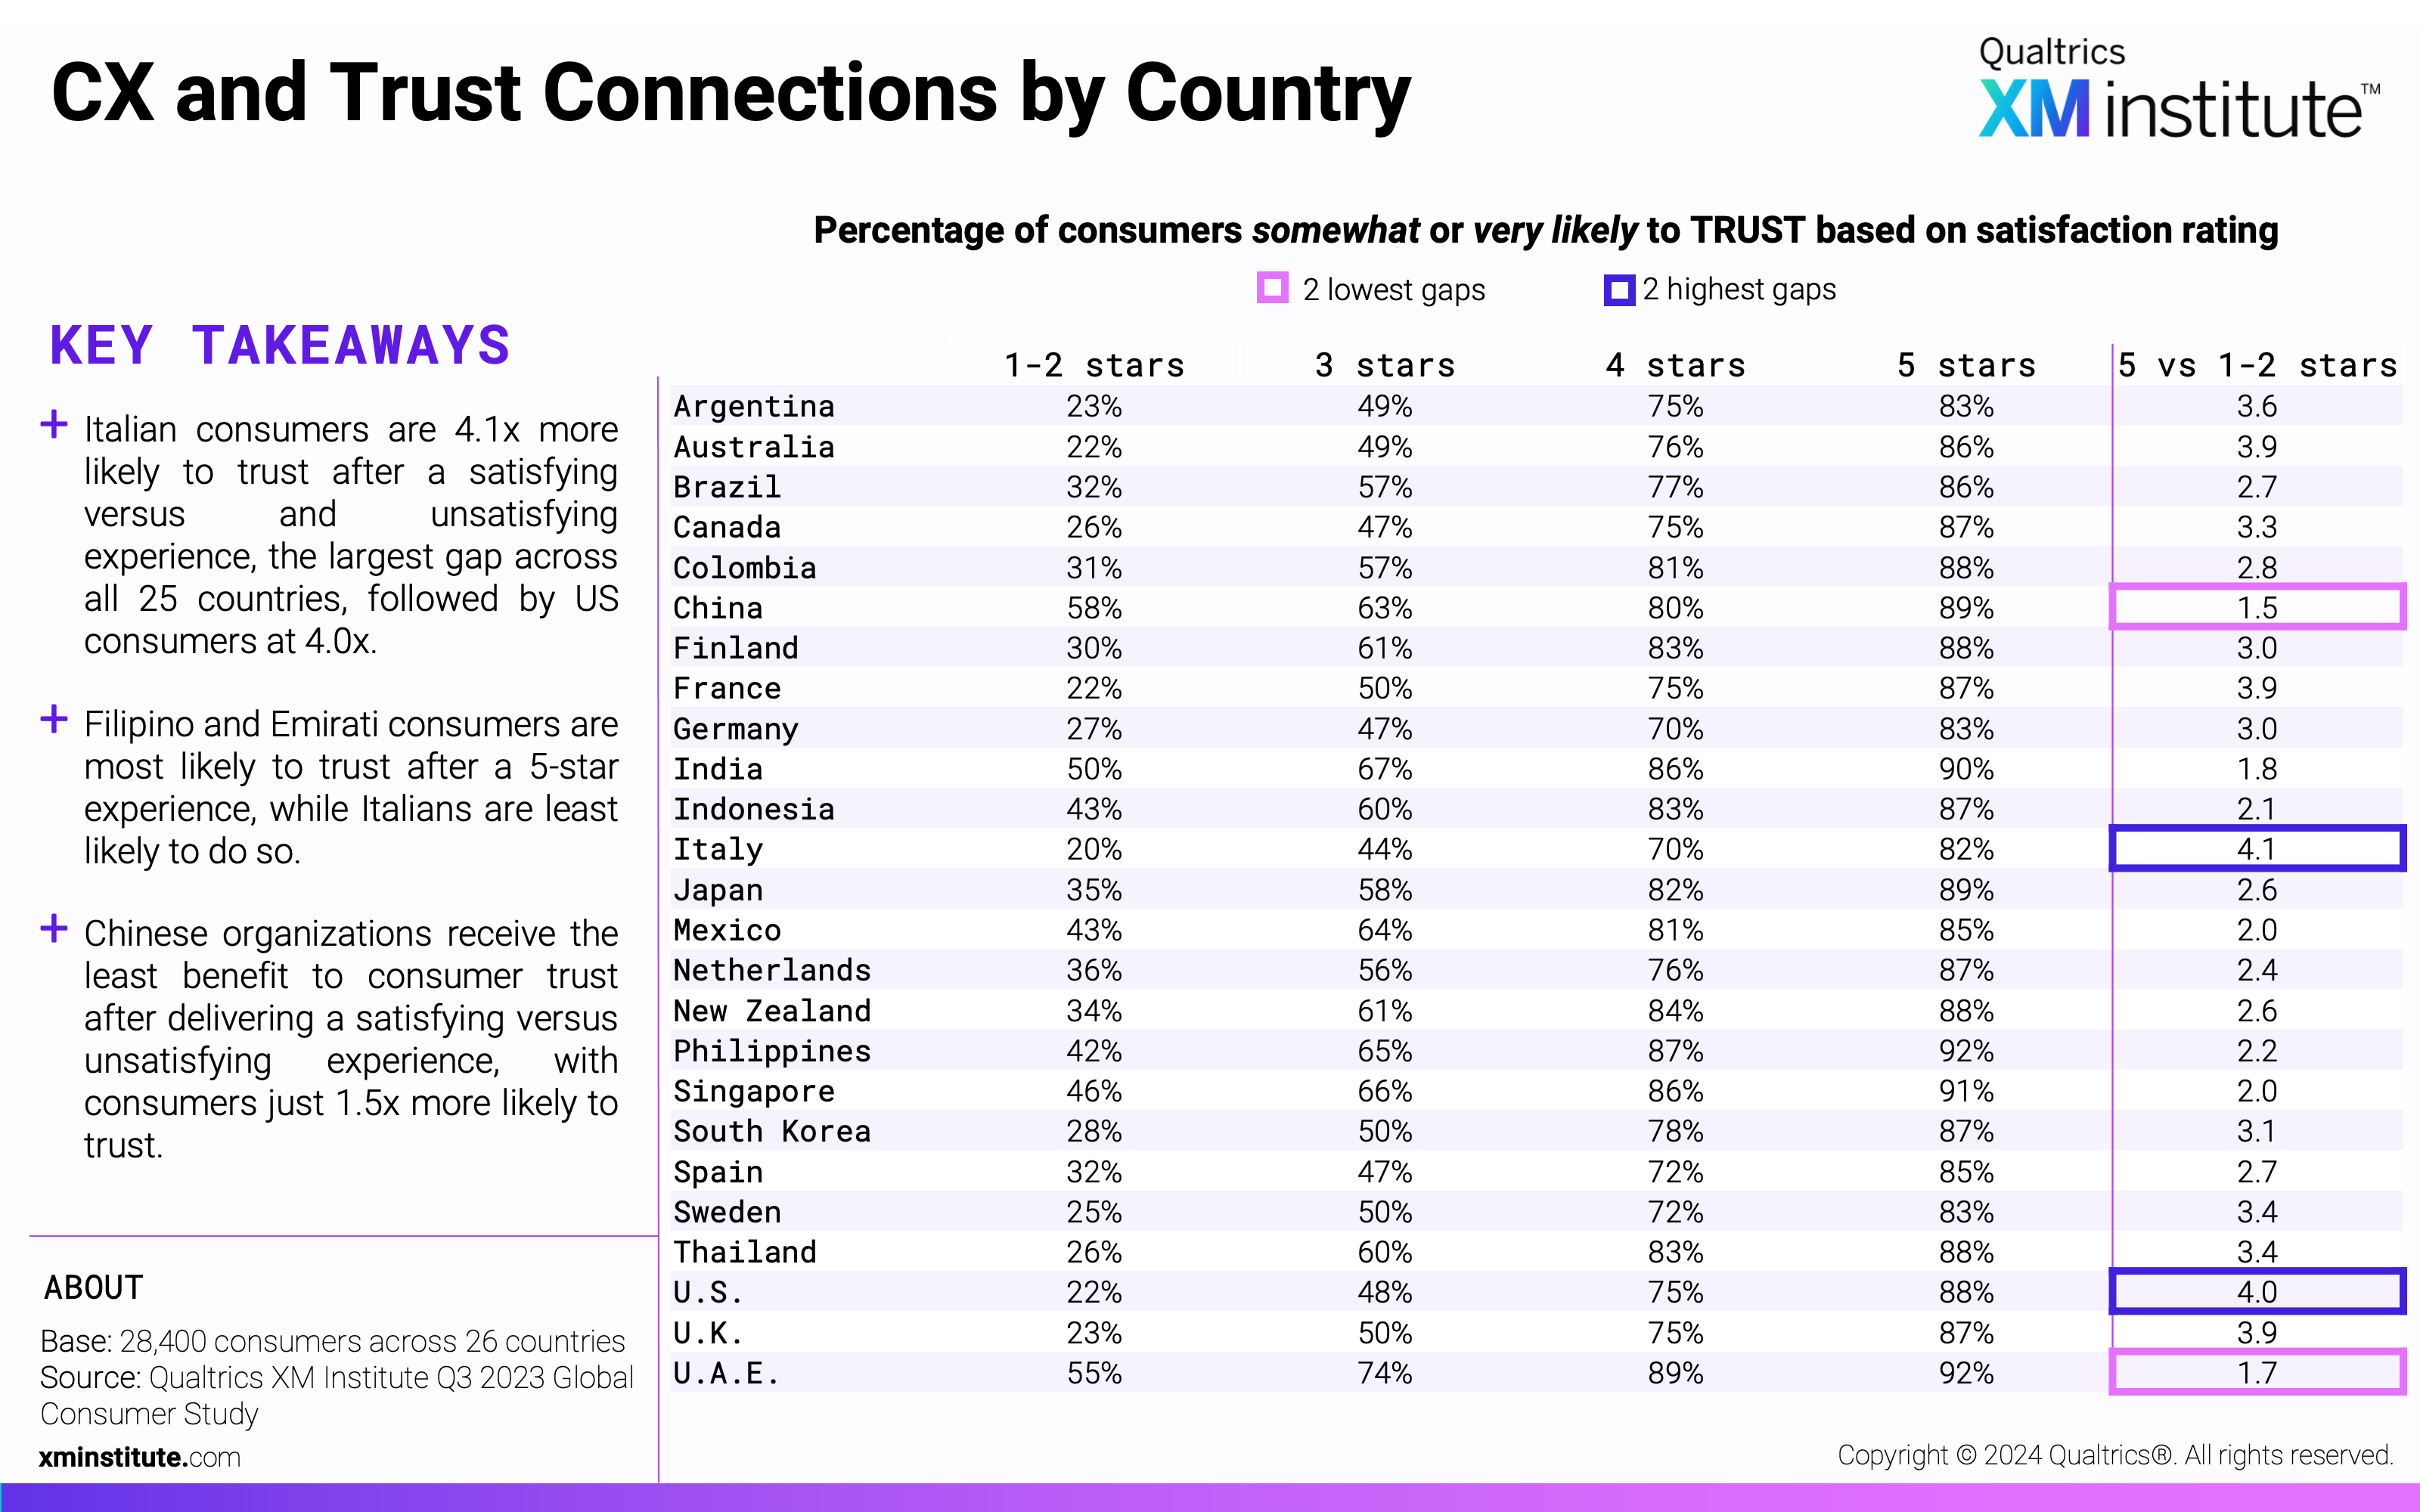
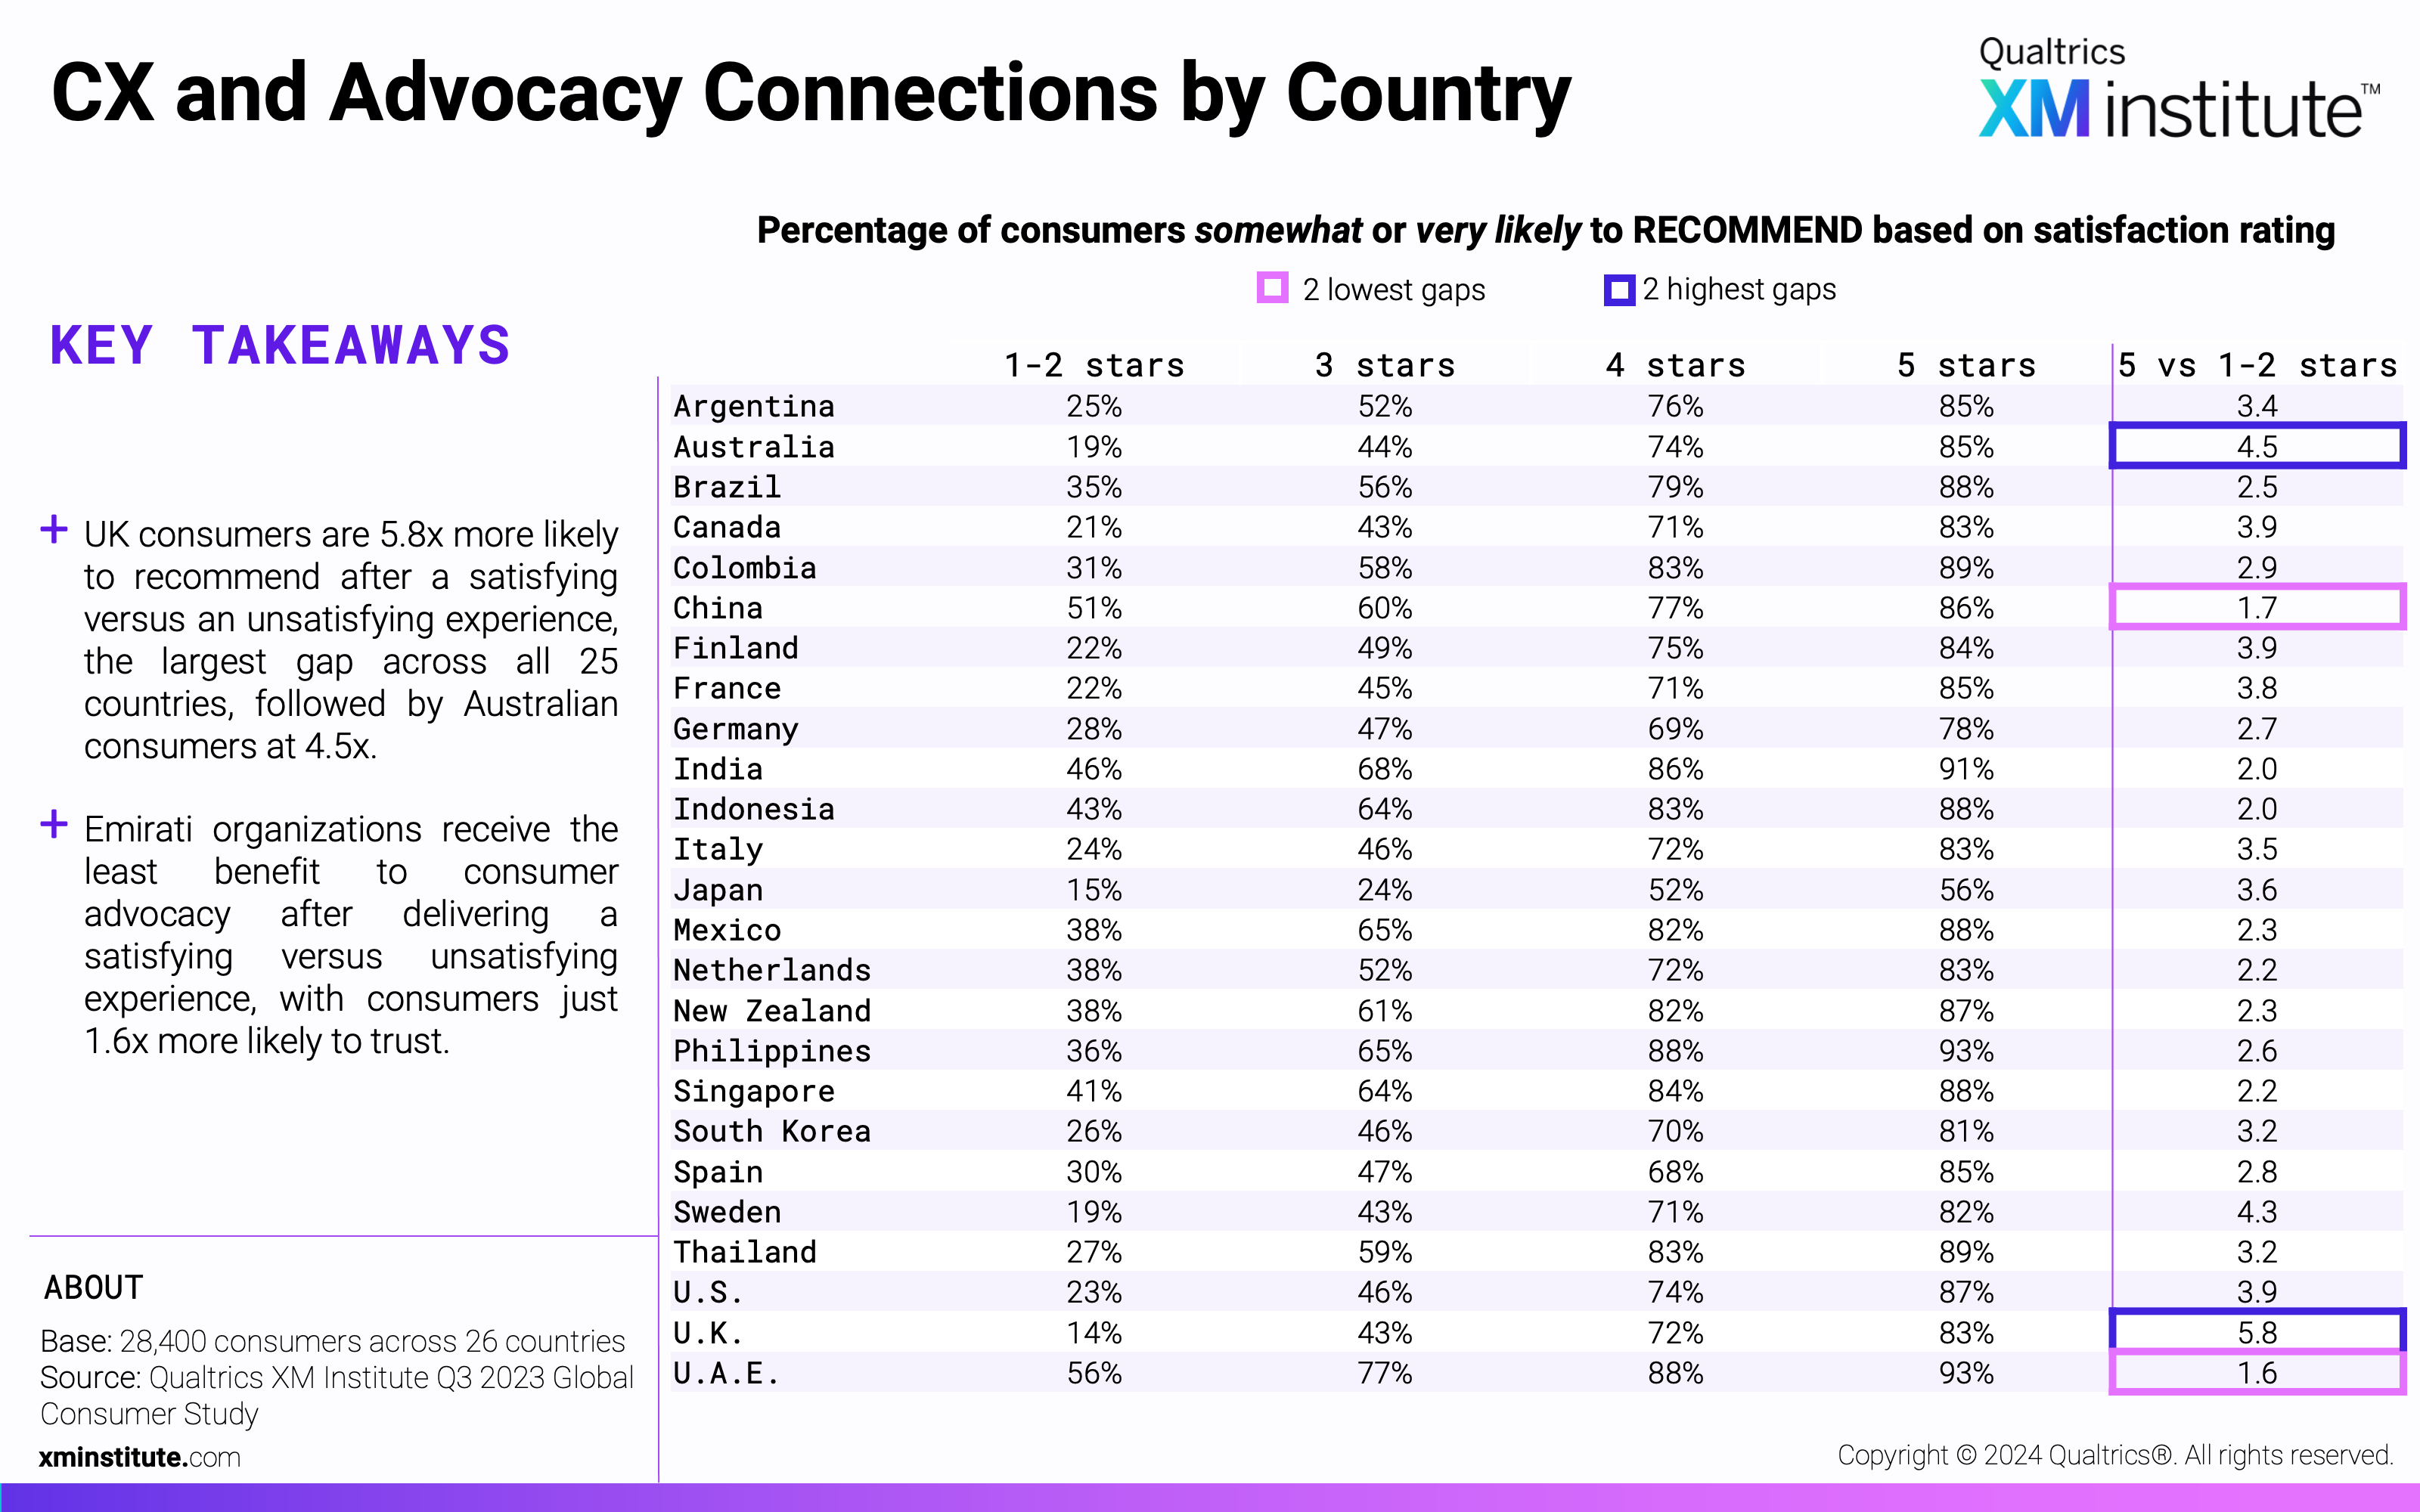
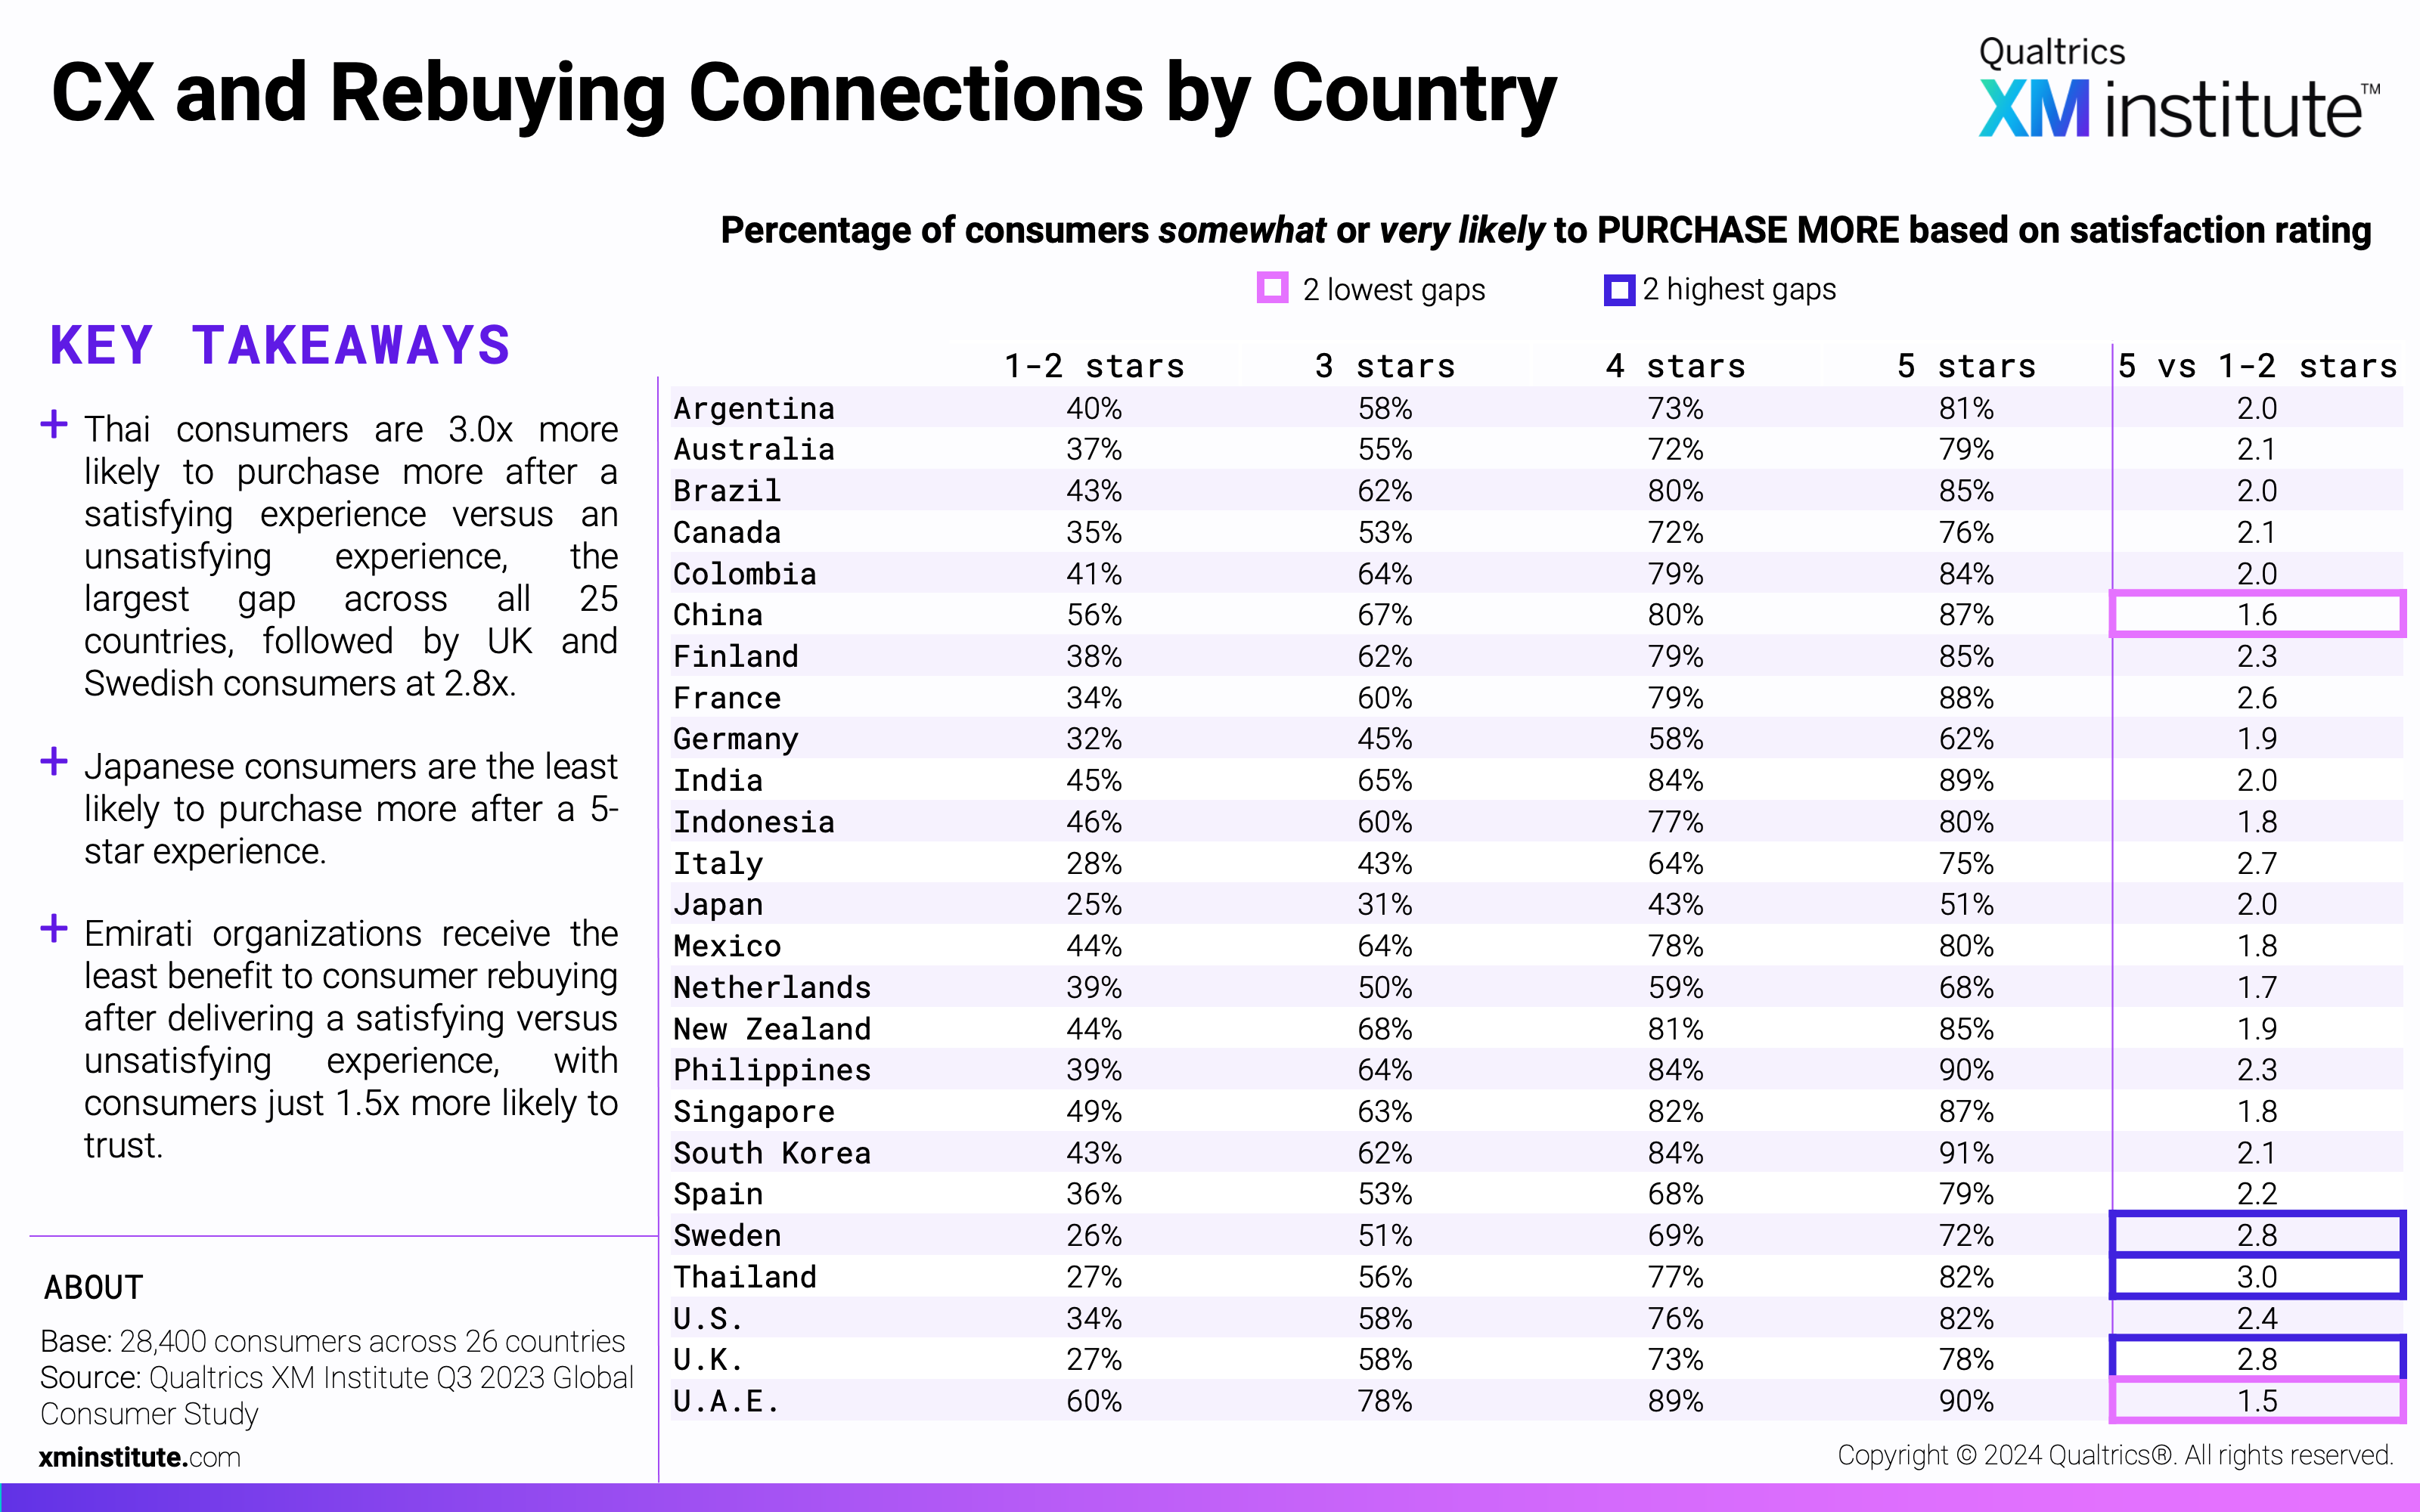
- The impact of satisfaction on loyalty varies by country. Satisfaction has the least impact on loyalty in the United Arab Emirates, where after a 5-star experience consumers are only 1.5x more likely to recommend and purchase more, and only 1.7x more likely to trust compared to their dissatisfied peers. Comparatively, after a very satisfying experience Italian consumers are 4.1x more likely to trust, UK consumers are 5.8x more likely to recommend, and Thai consumers are 2.8x more likely to purchase more.
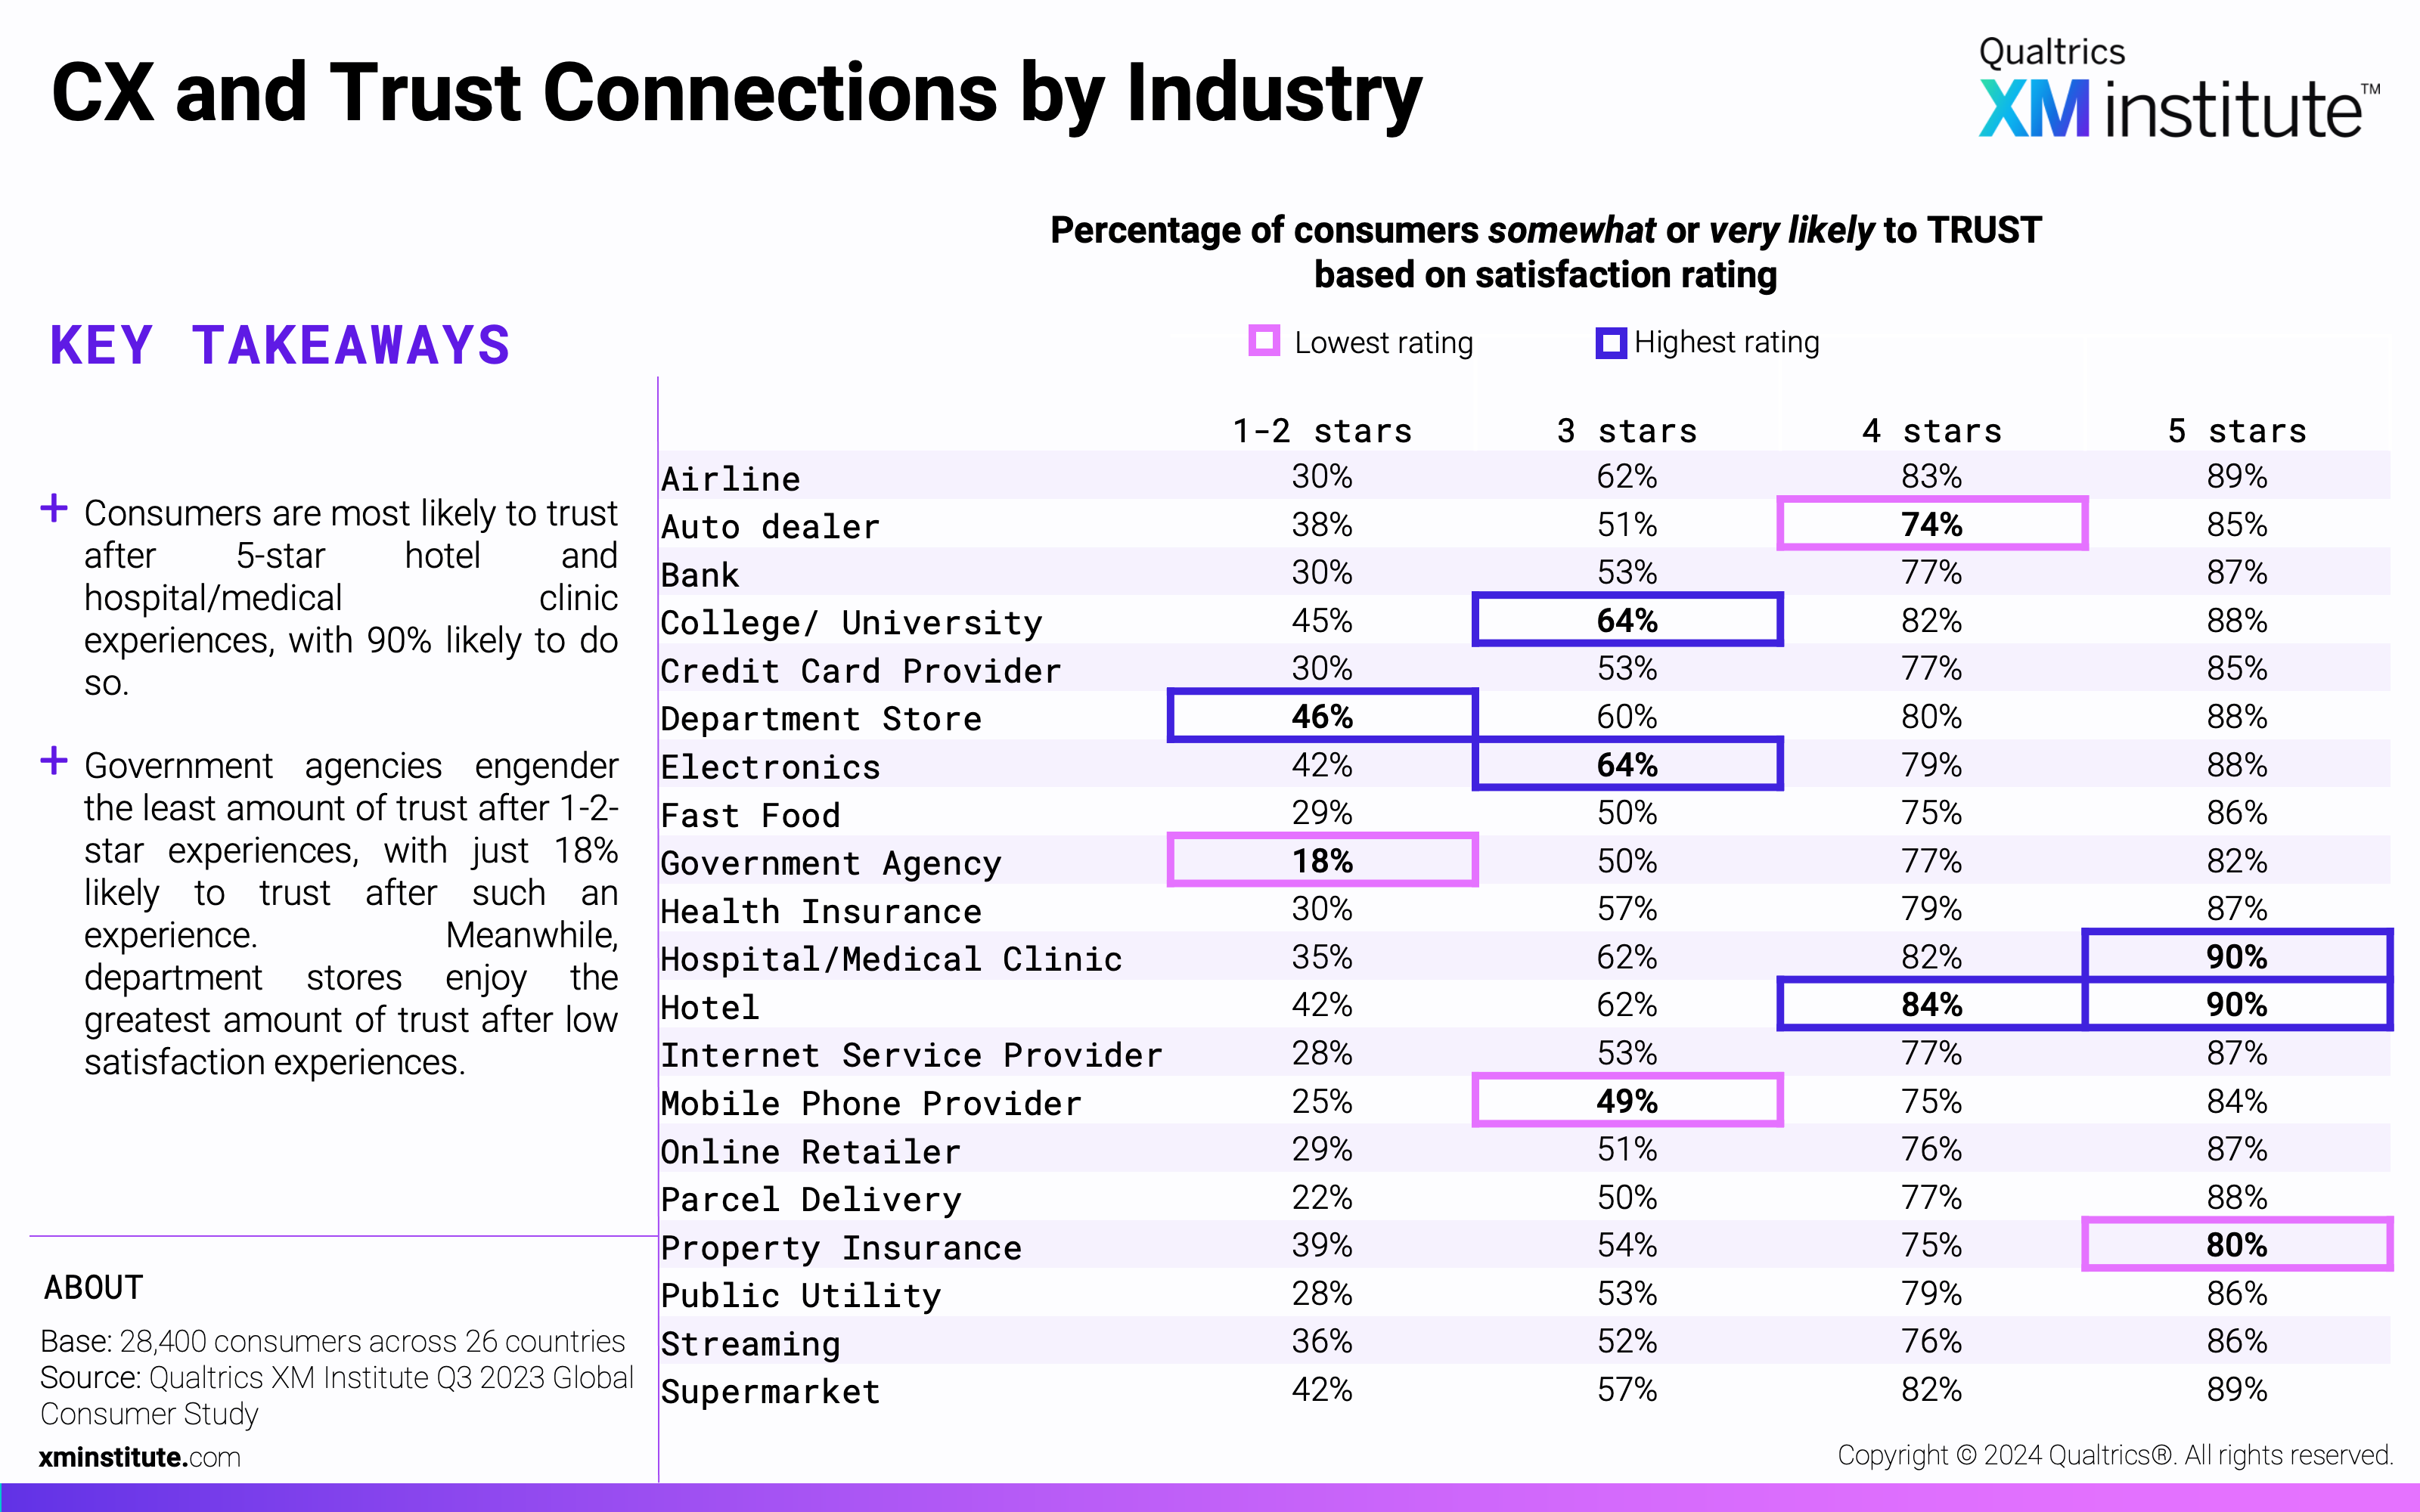
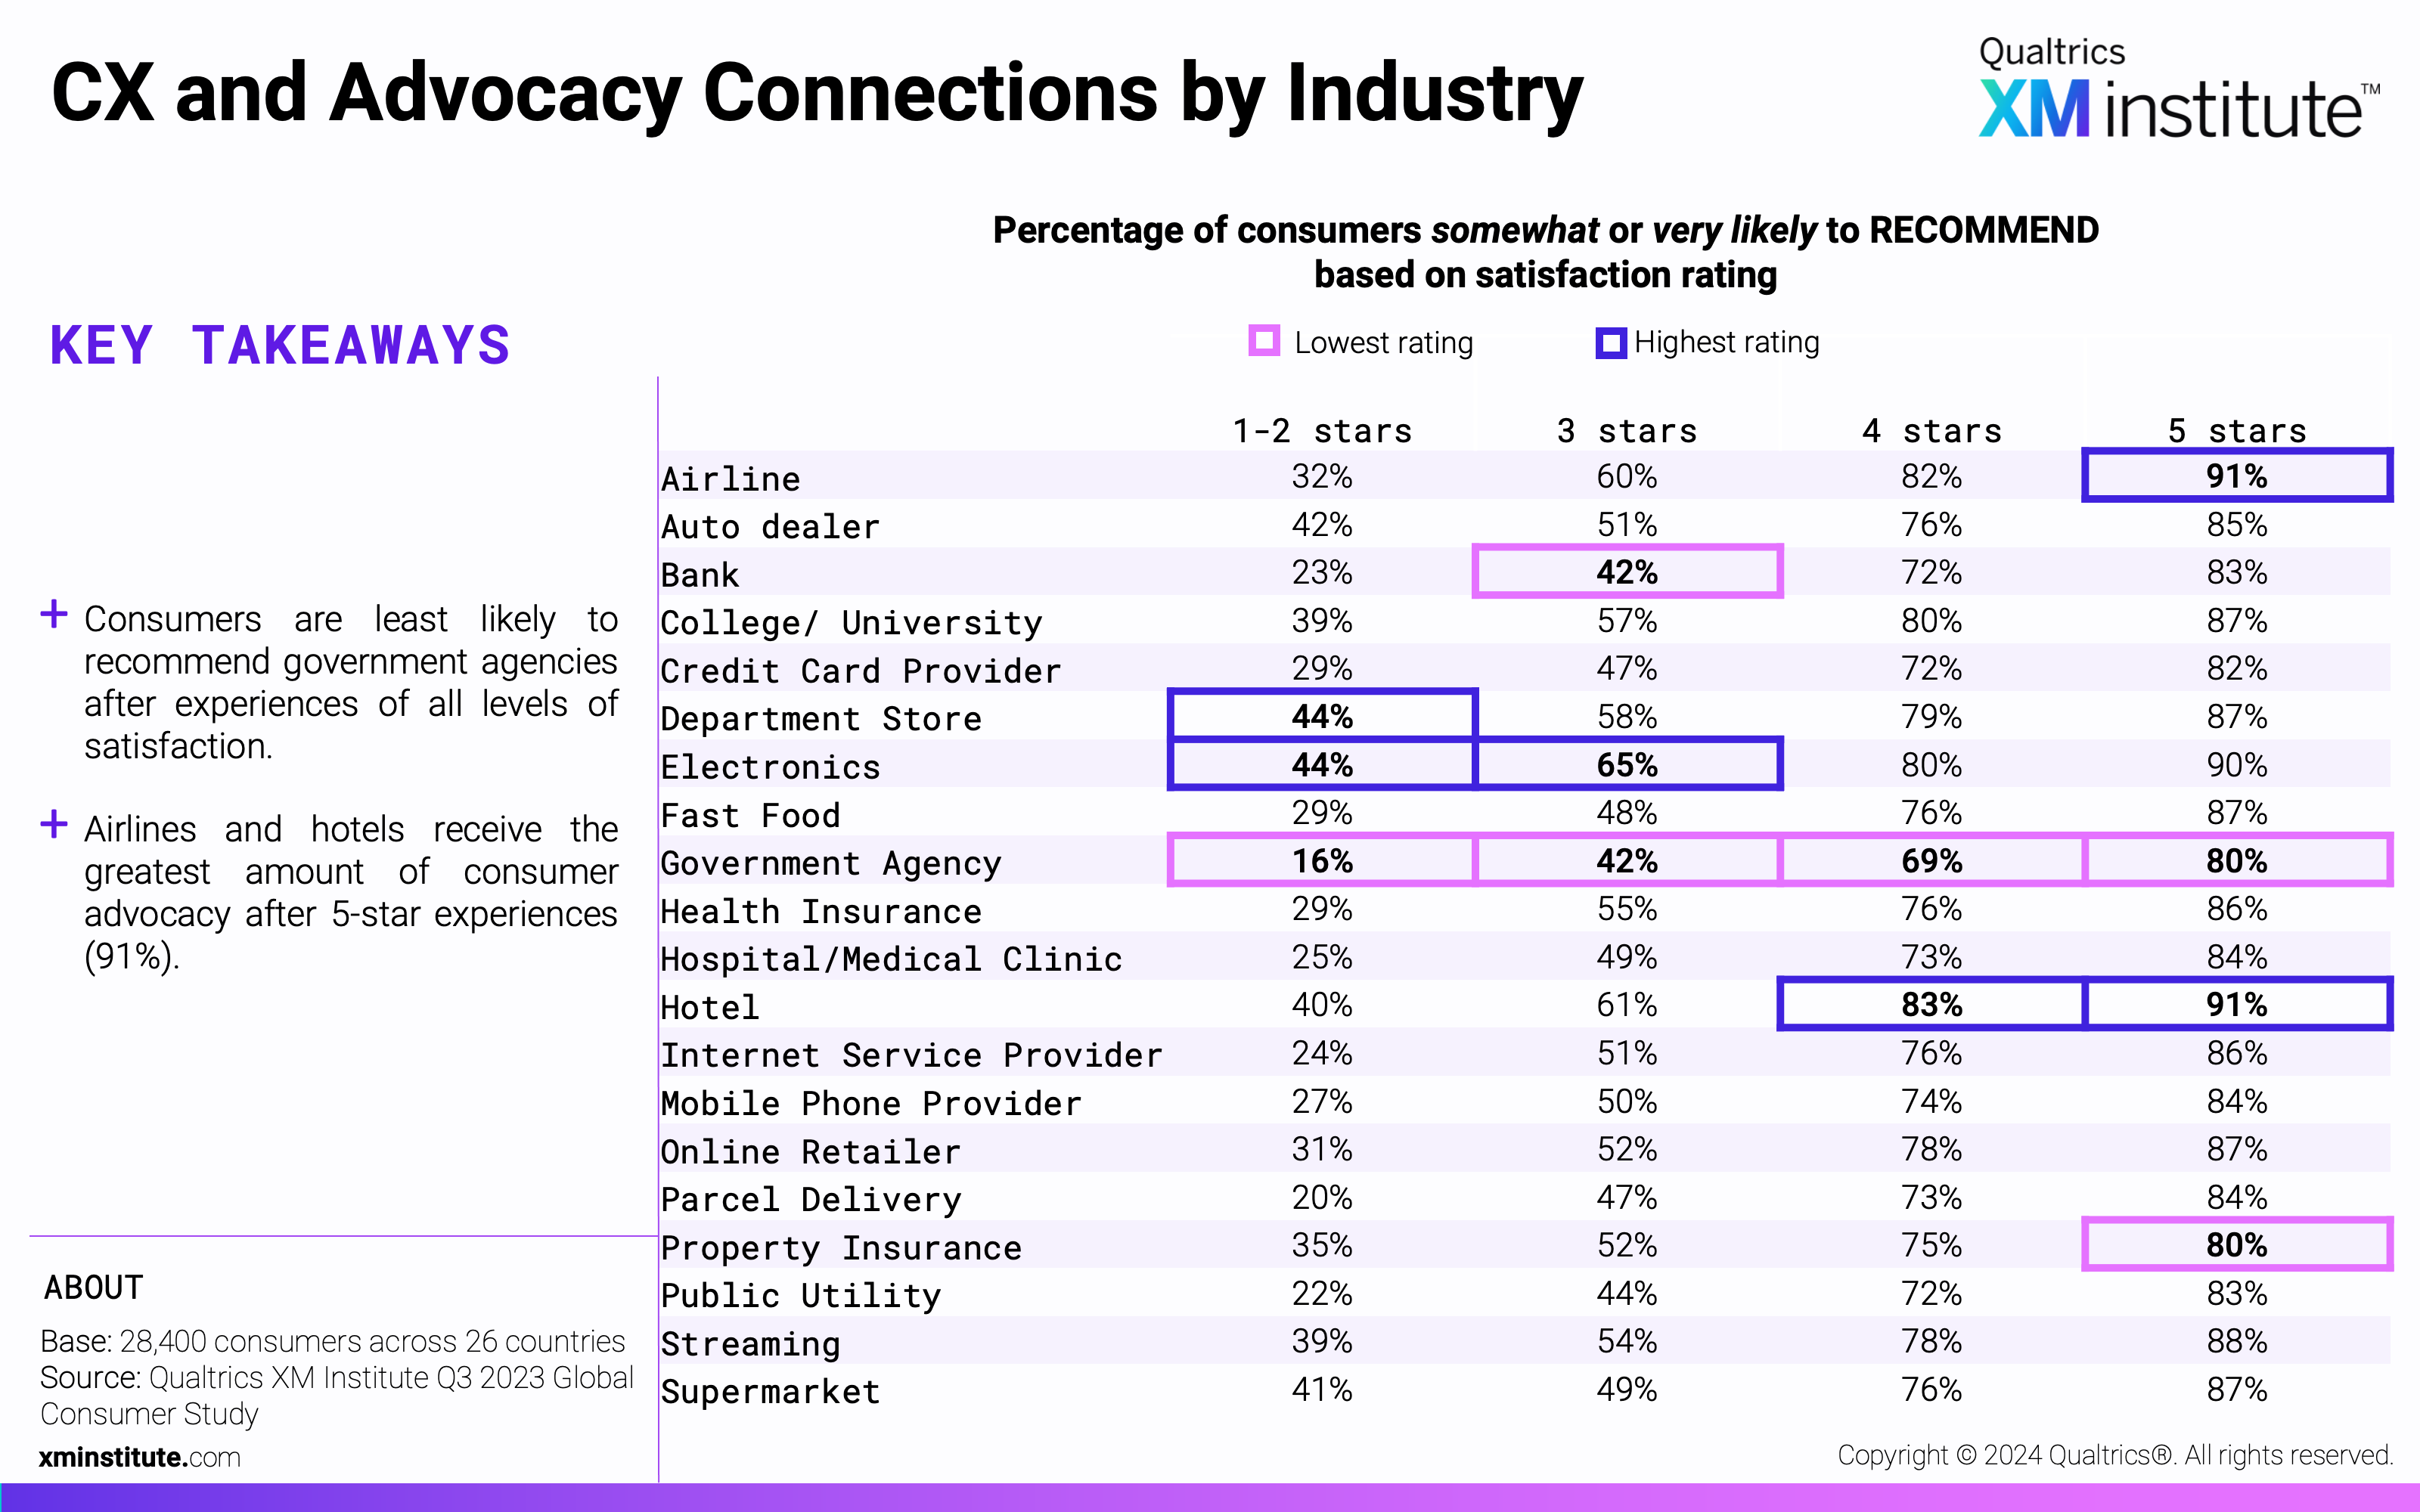
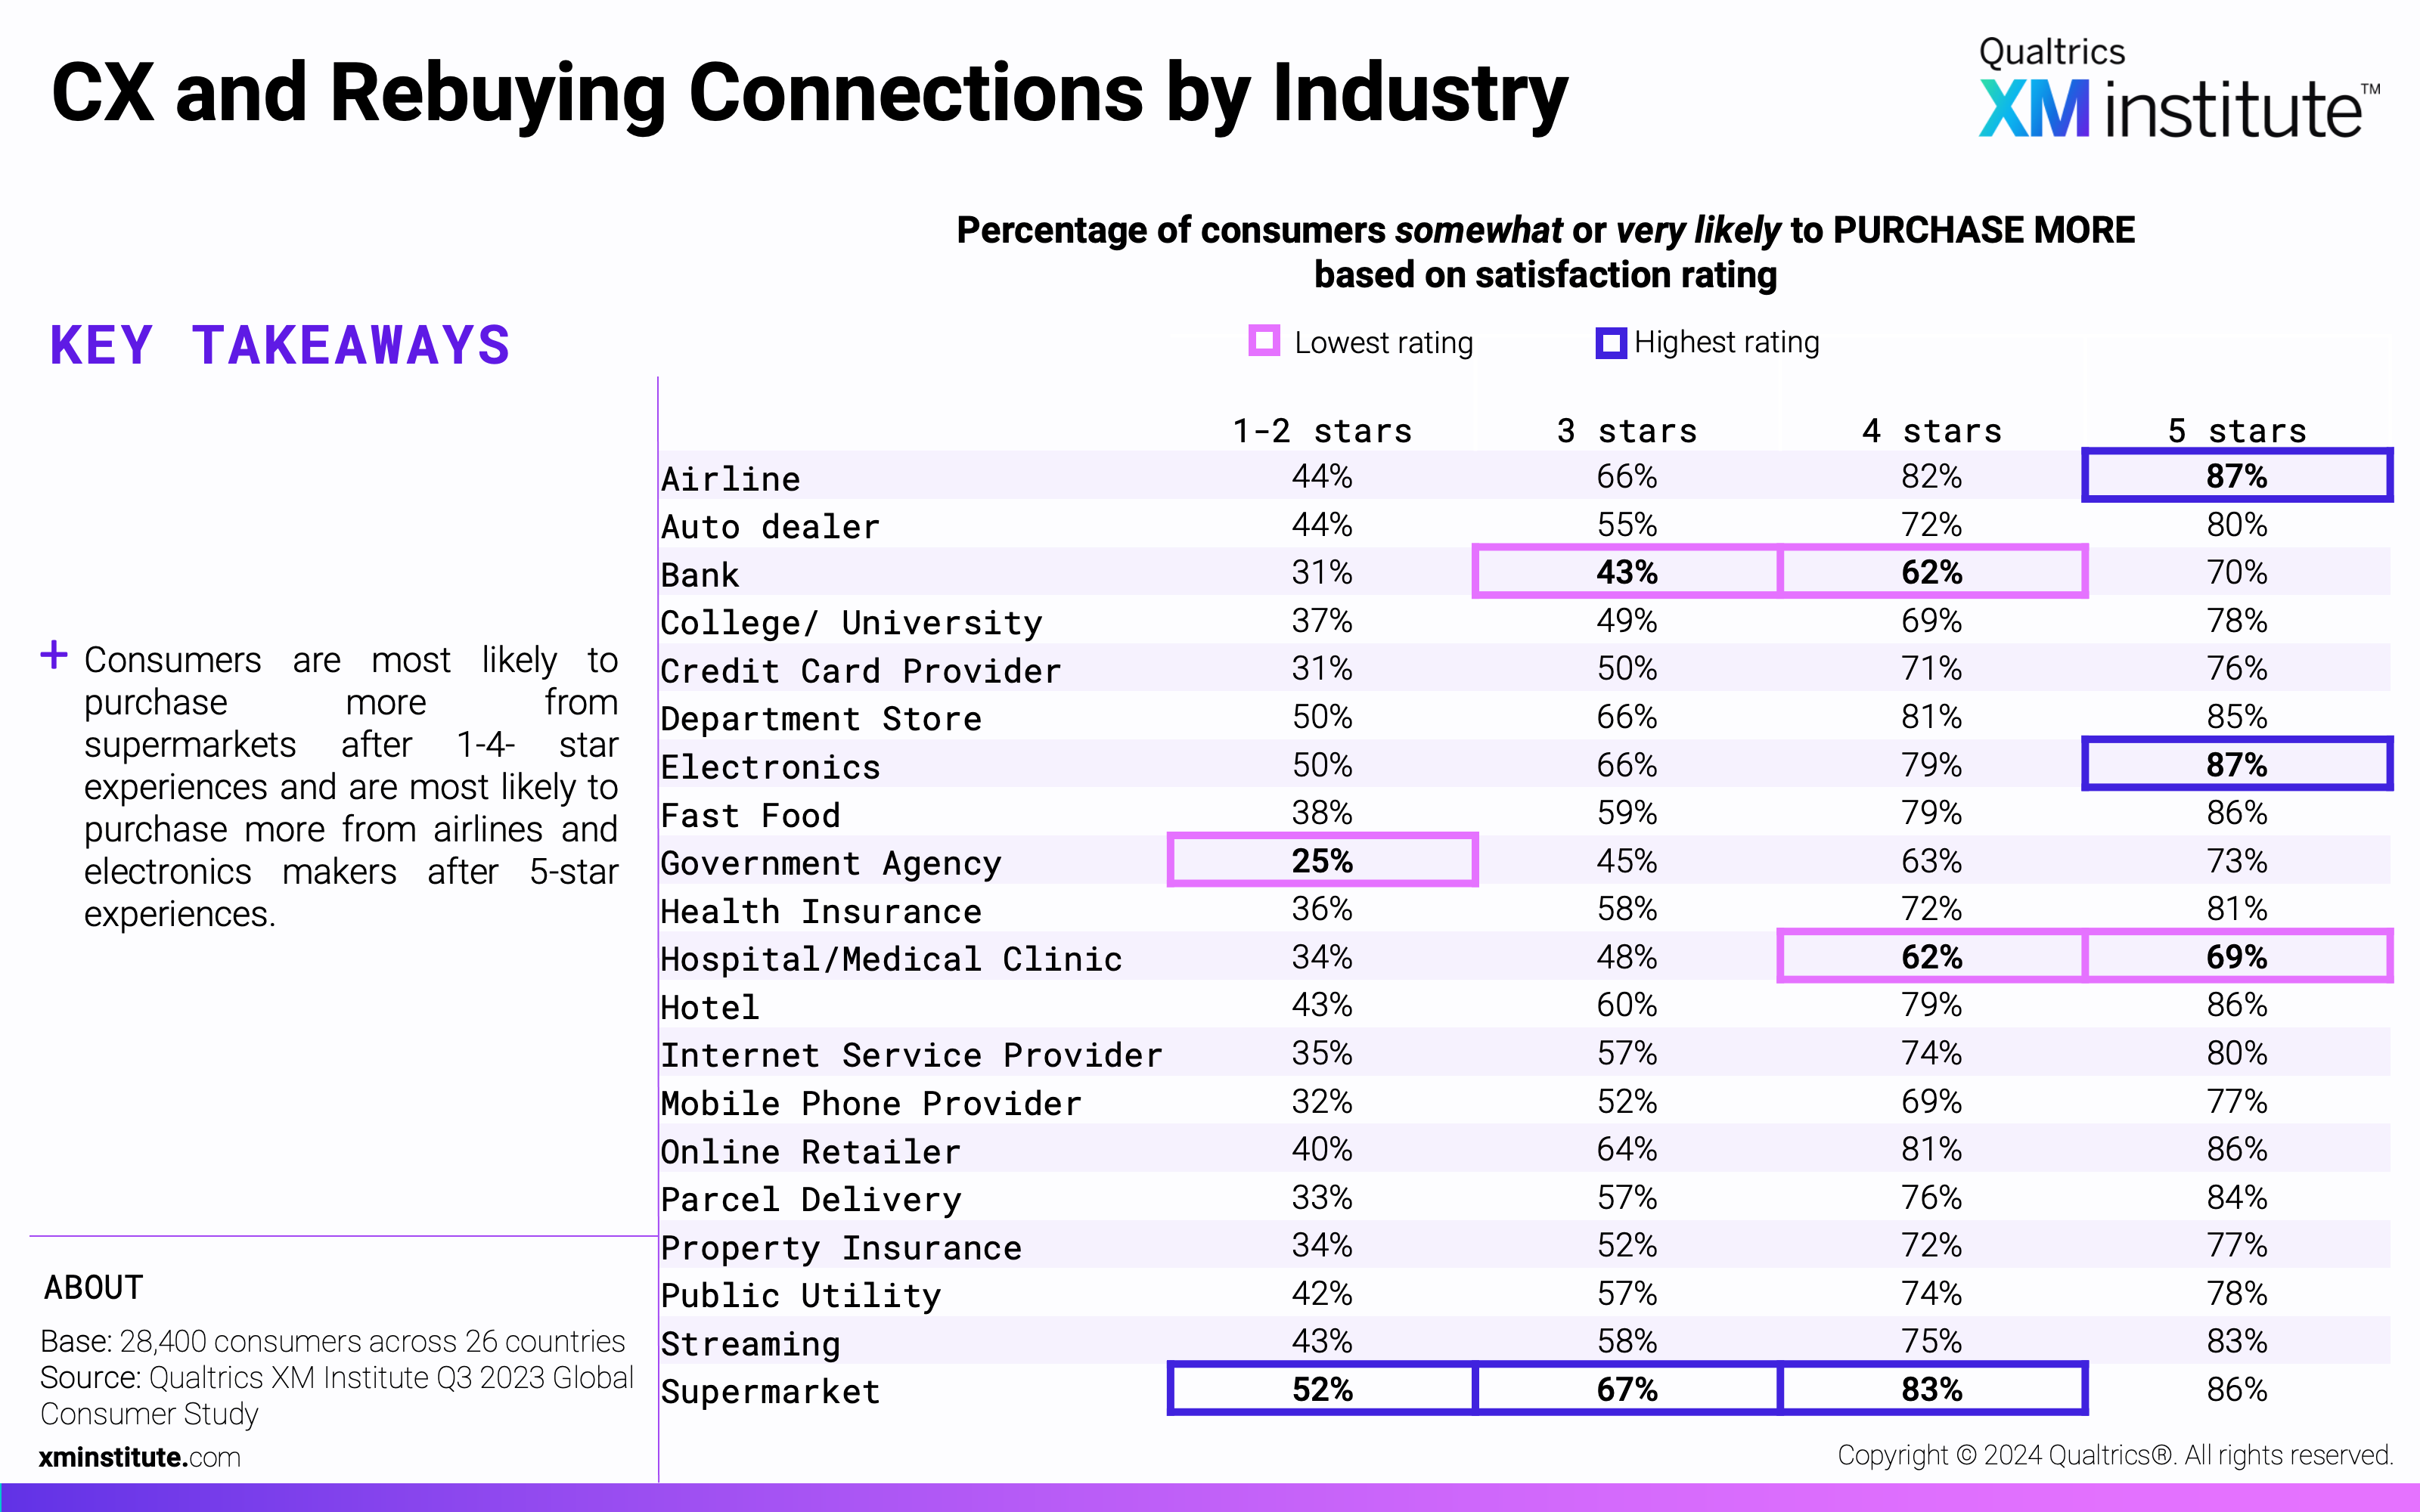
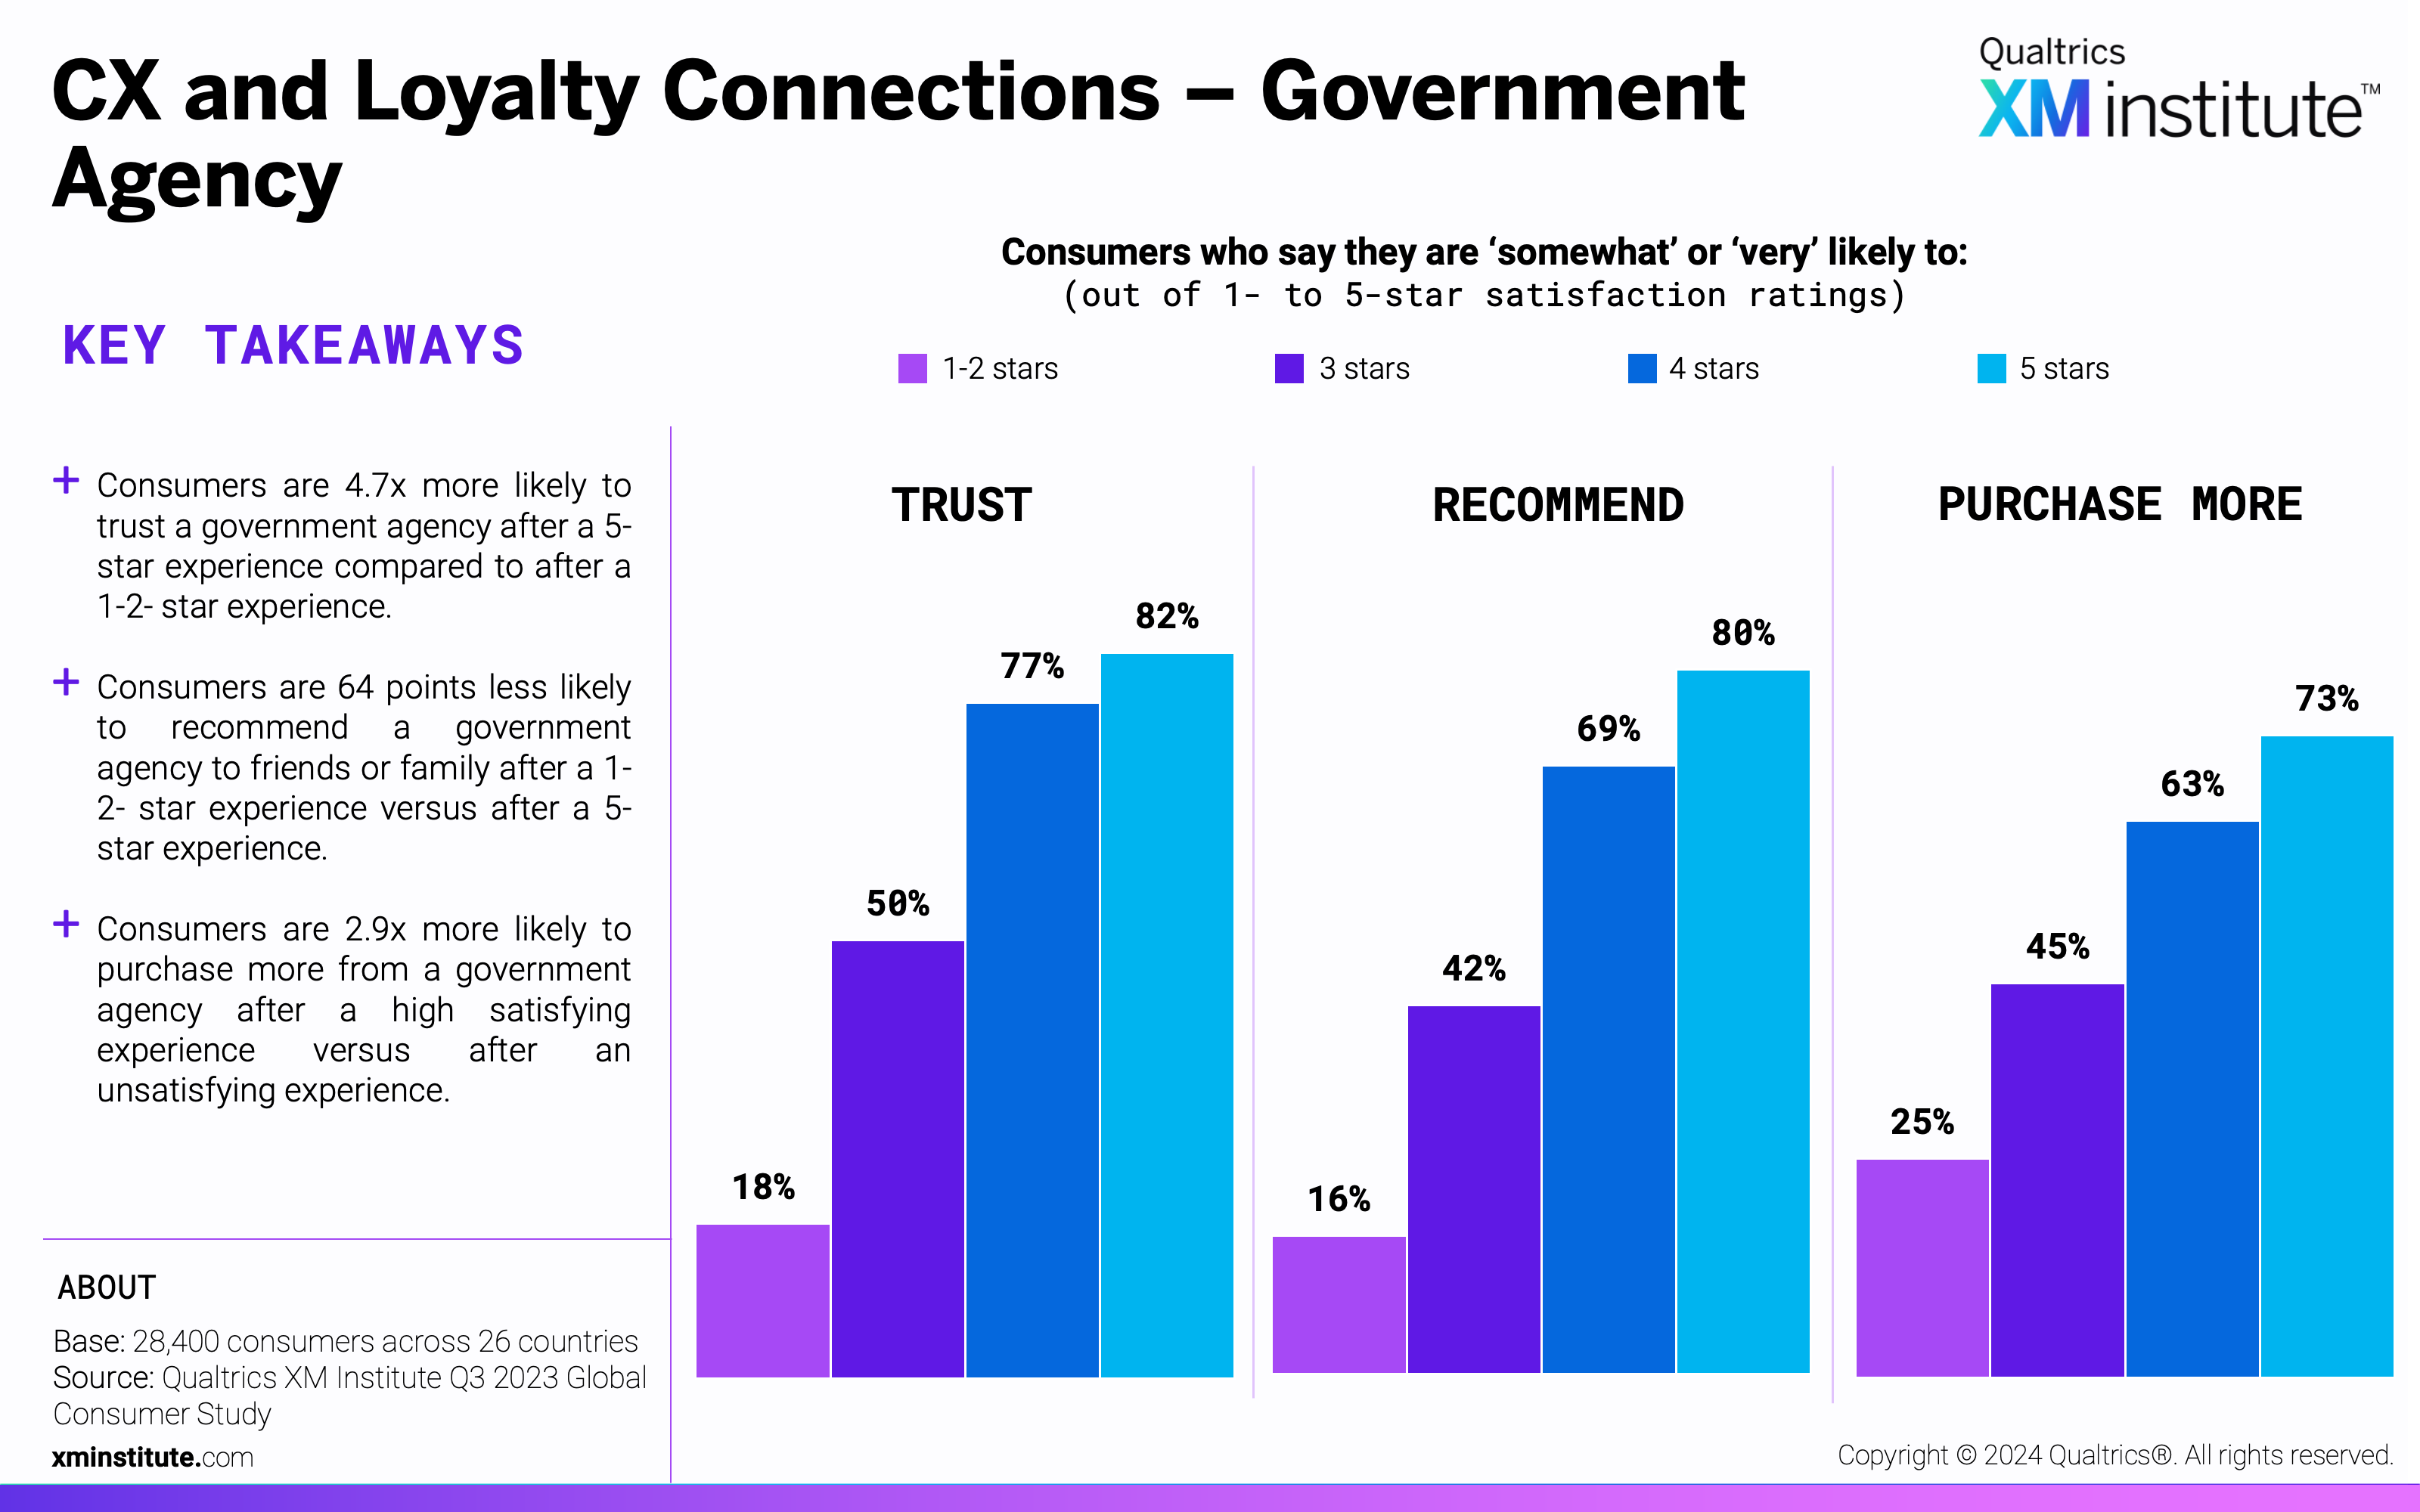
- Unsatisfying experiences impact government agencies’ loyalty metrics the most. Across all industries, consumers are least likely to trust, recommend, and purchase more after 1-2- star government agency experiences, with 25% or fewer likely to perform any of these activities.
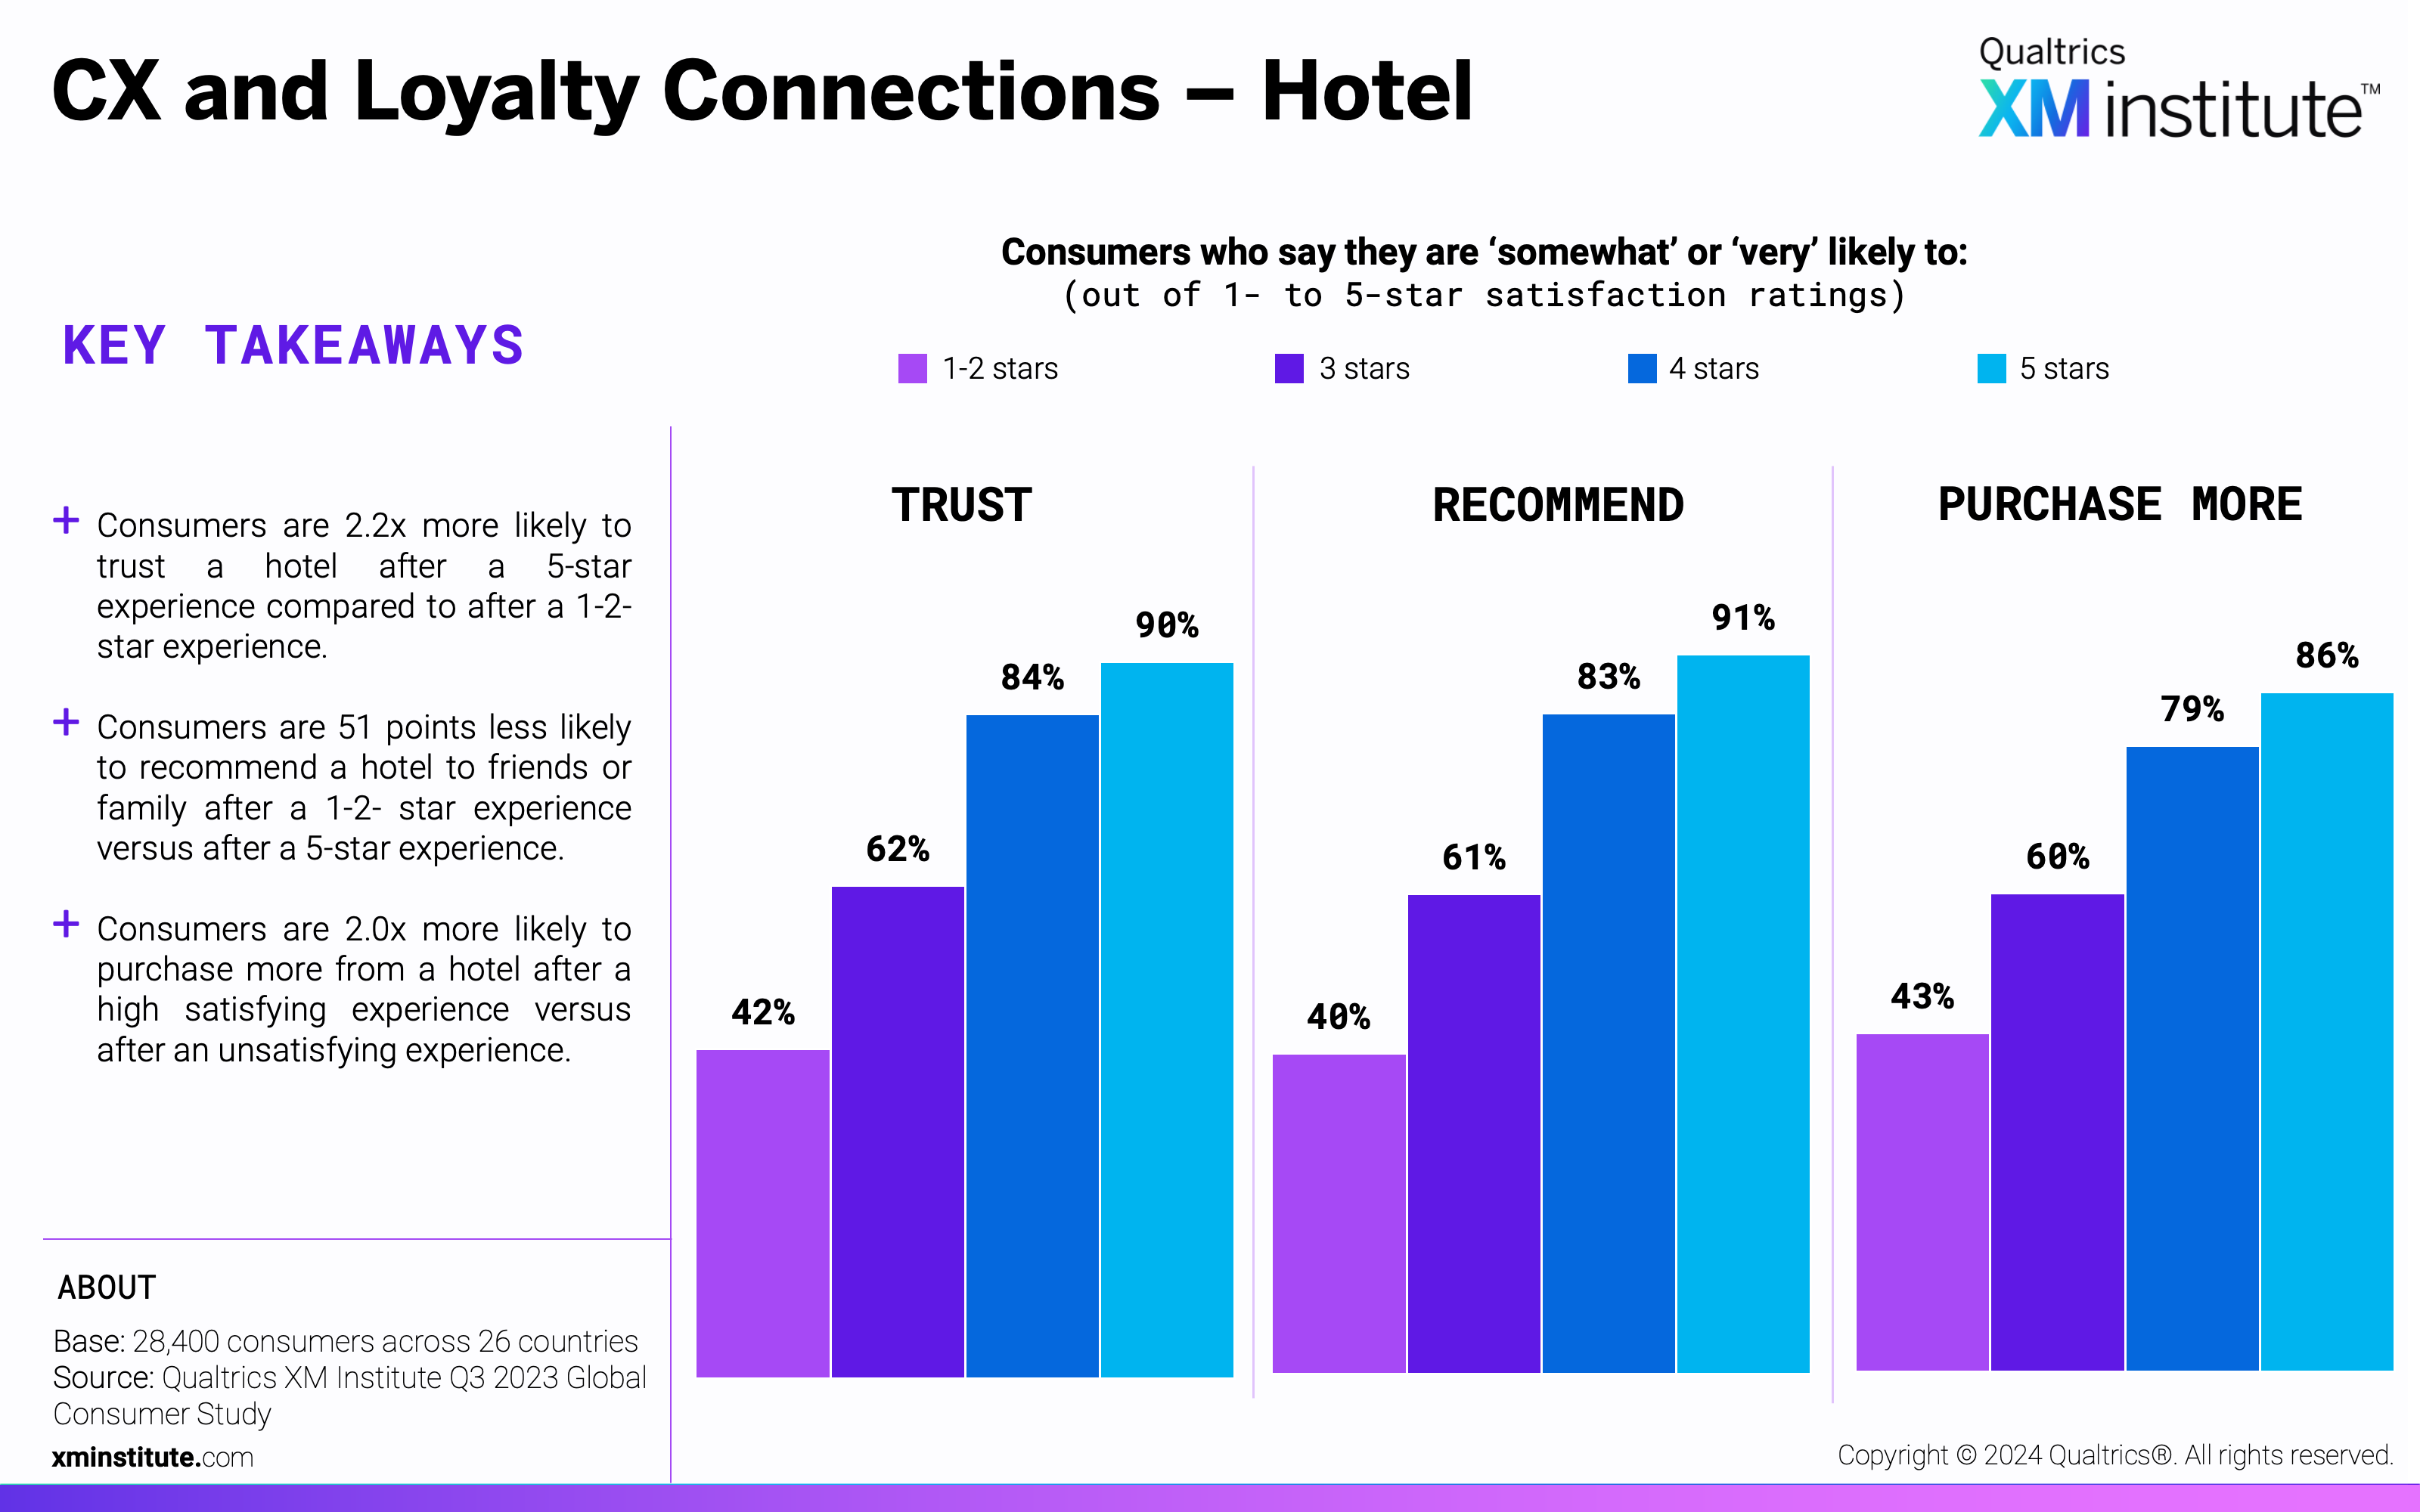
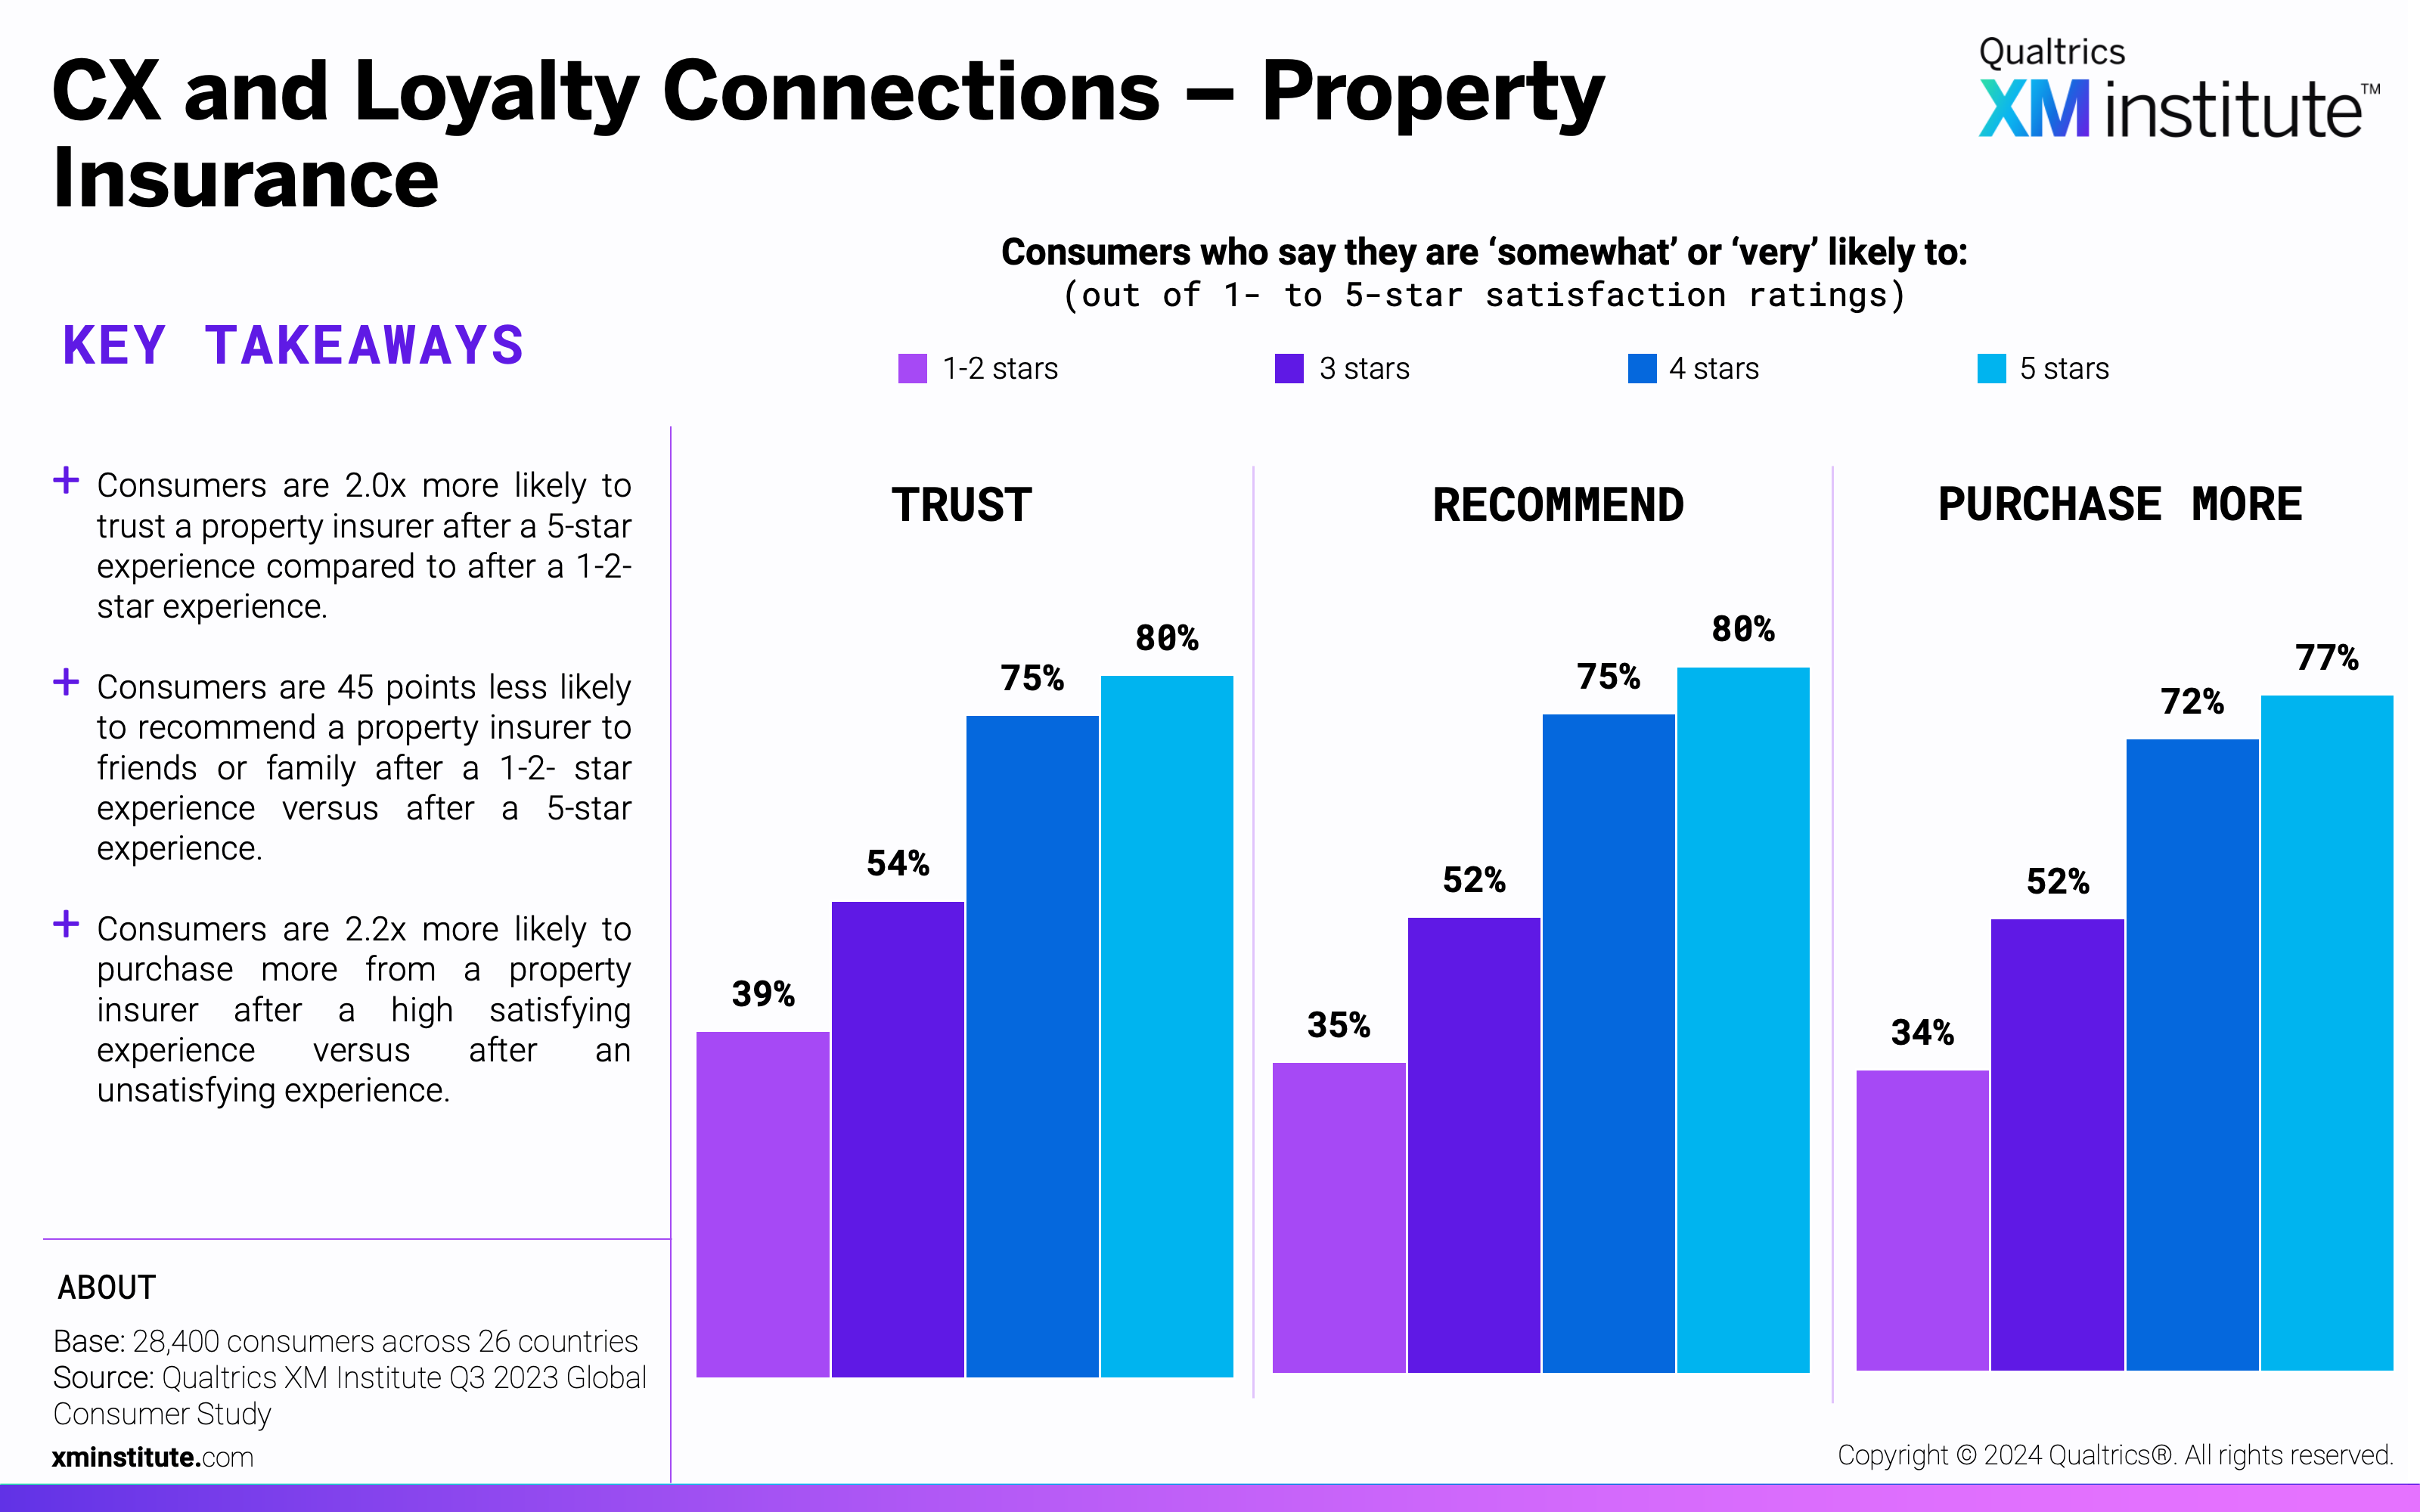
- Hotels earn loyalty after very satisfying experiences. After 5-star experiences, consumers are most likely to trust (90%) and recommend (91%) a hotel. On the other end of the spectrum, just 80% of property insurance consumers are likely to say the same.
Figures
Here are the figures in this data snapshot:
- ROI: CX Correlates with Trust (see Figure 1)
- ROI: CX Correlates with Advocacy (see Figure 2)
- ROI: CX Correlates with Rebuying (see Figure 3)
- CX and Loyalty Connections – Overall (see Figure 4)
- CX and Trust Connections by Industry (see Figure 5)
- CX and Advocacy Connections by Industry (see Figure 6)
- CX and Rebuying Connections by Industry (see Figure 7)
- CX and Loyalty Connections – Airline (see Figure 8)
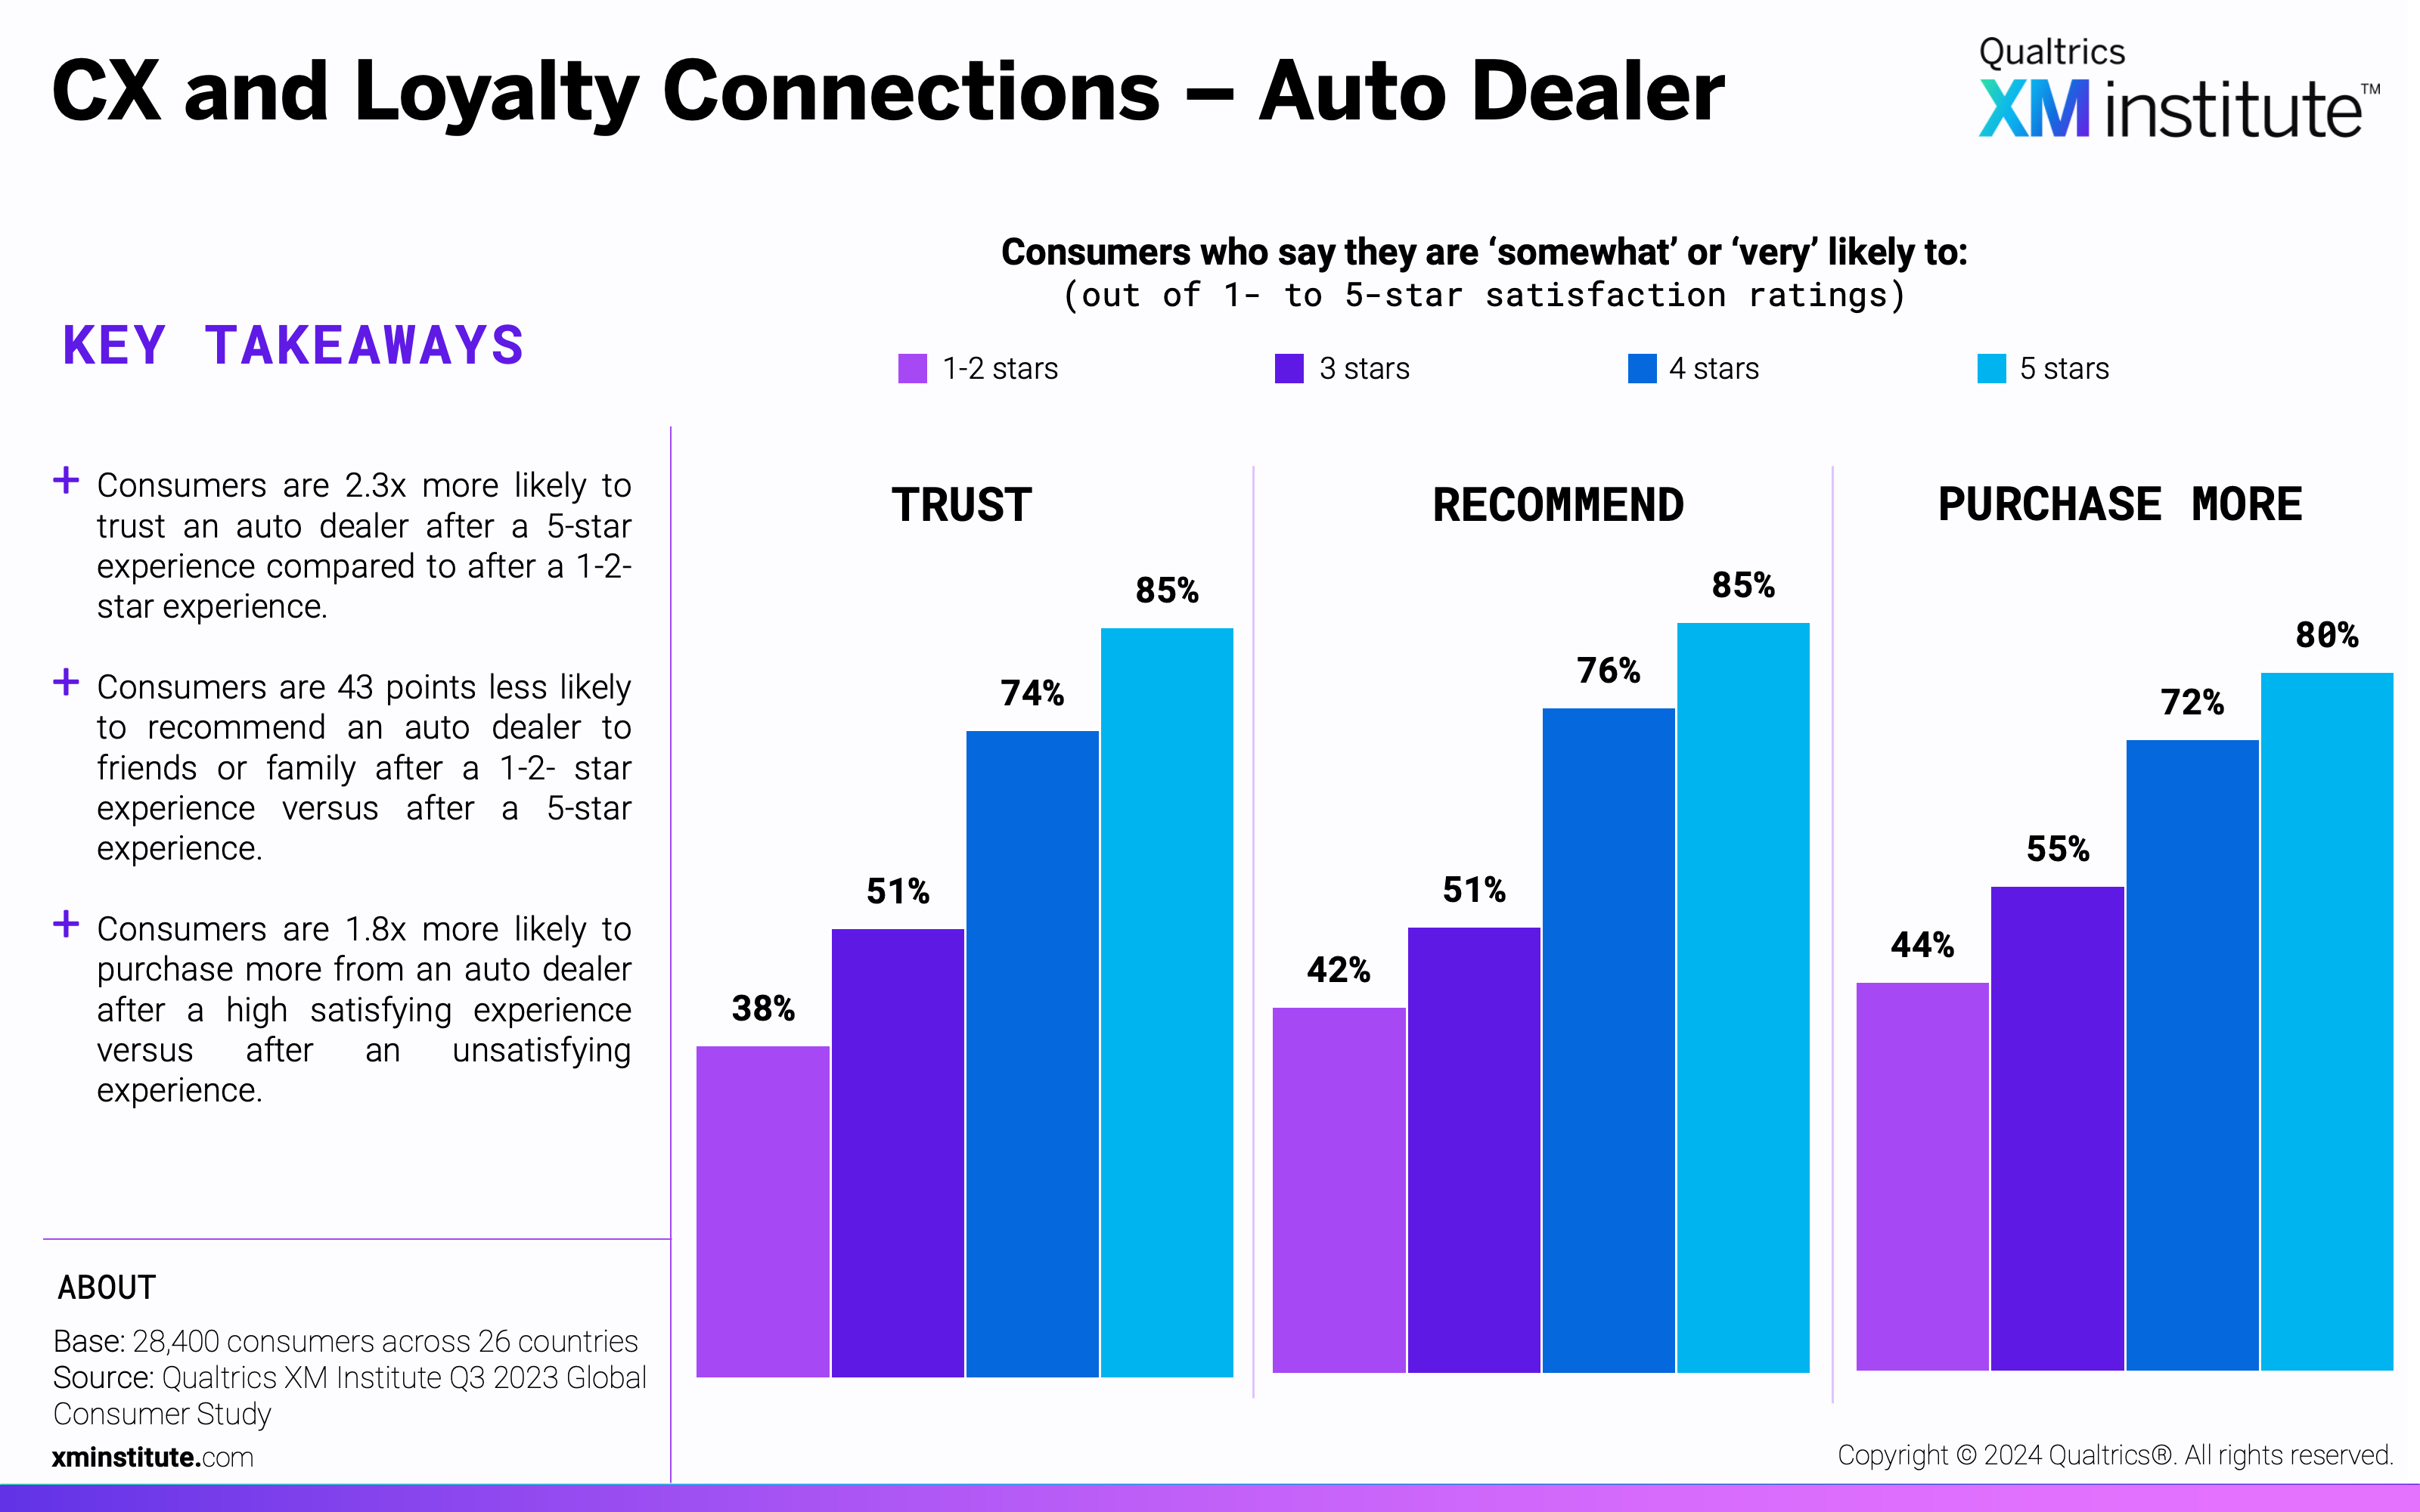
- CX and Loyalty Connections – Auto Dealer (see Figure 9)
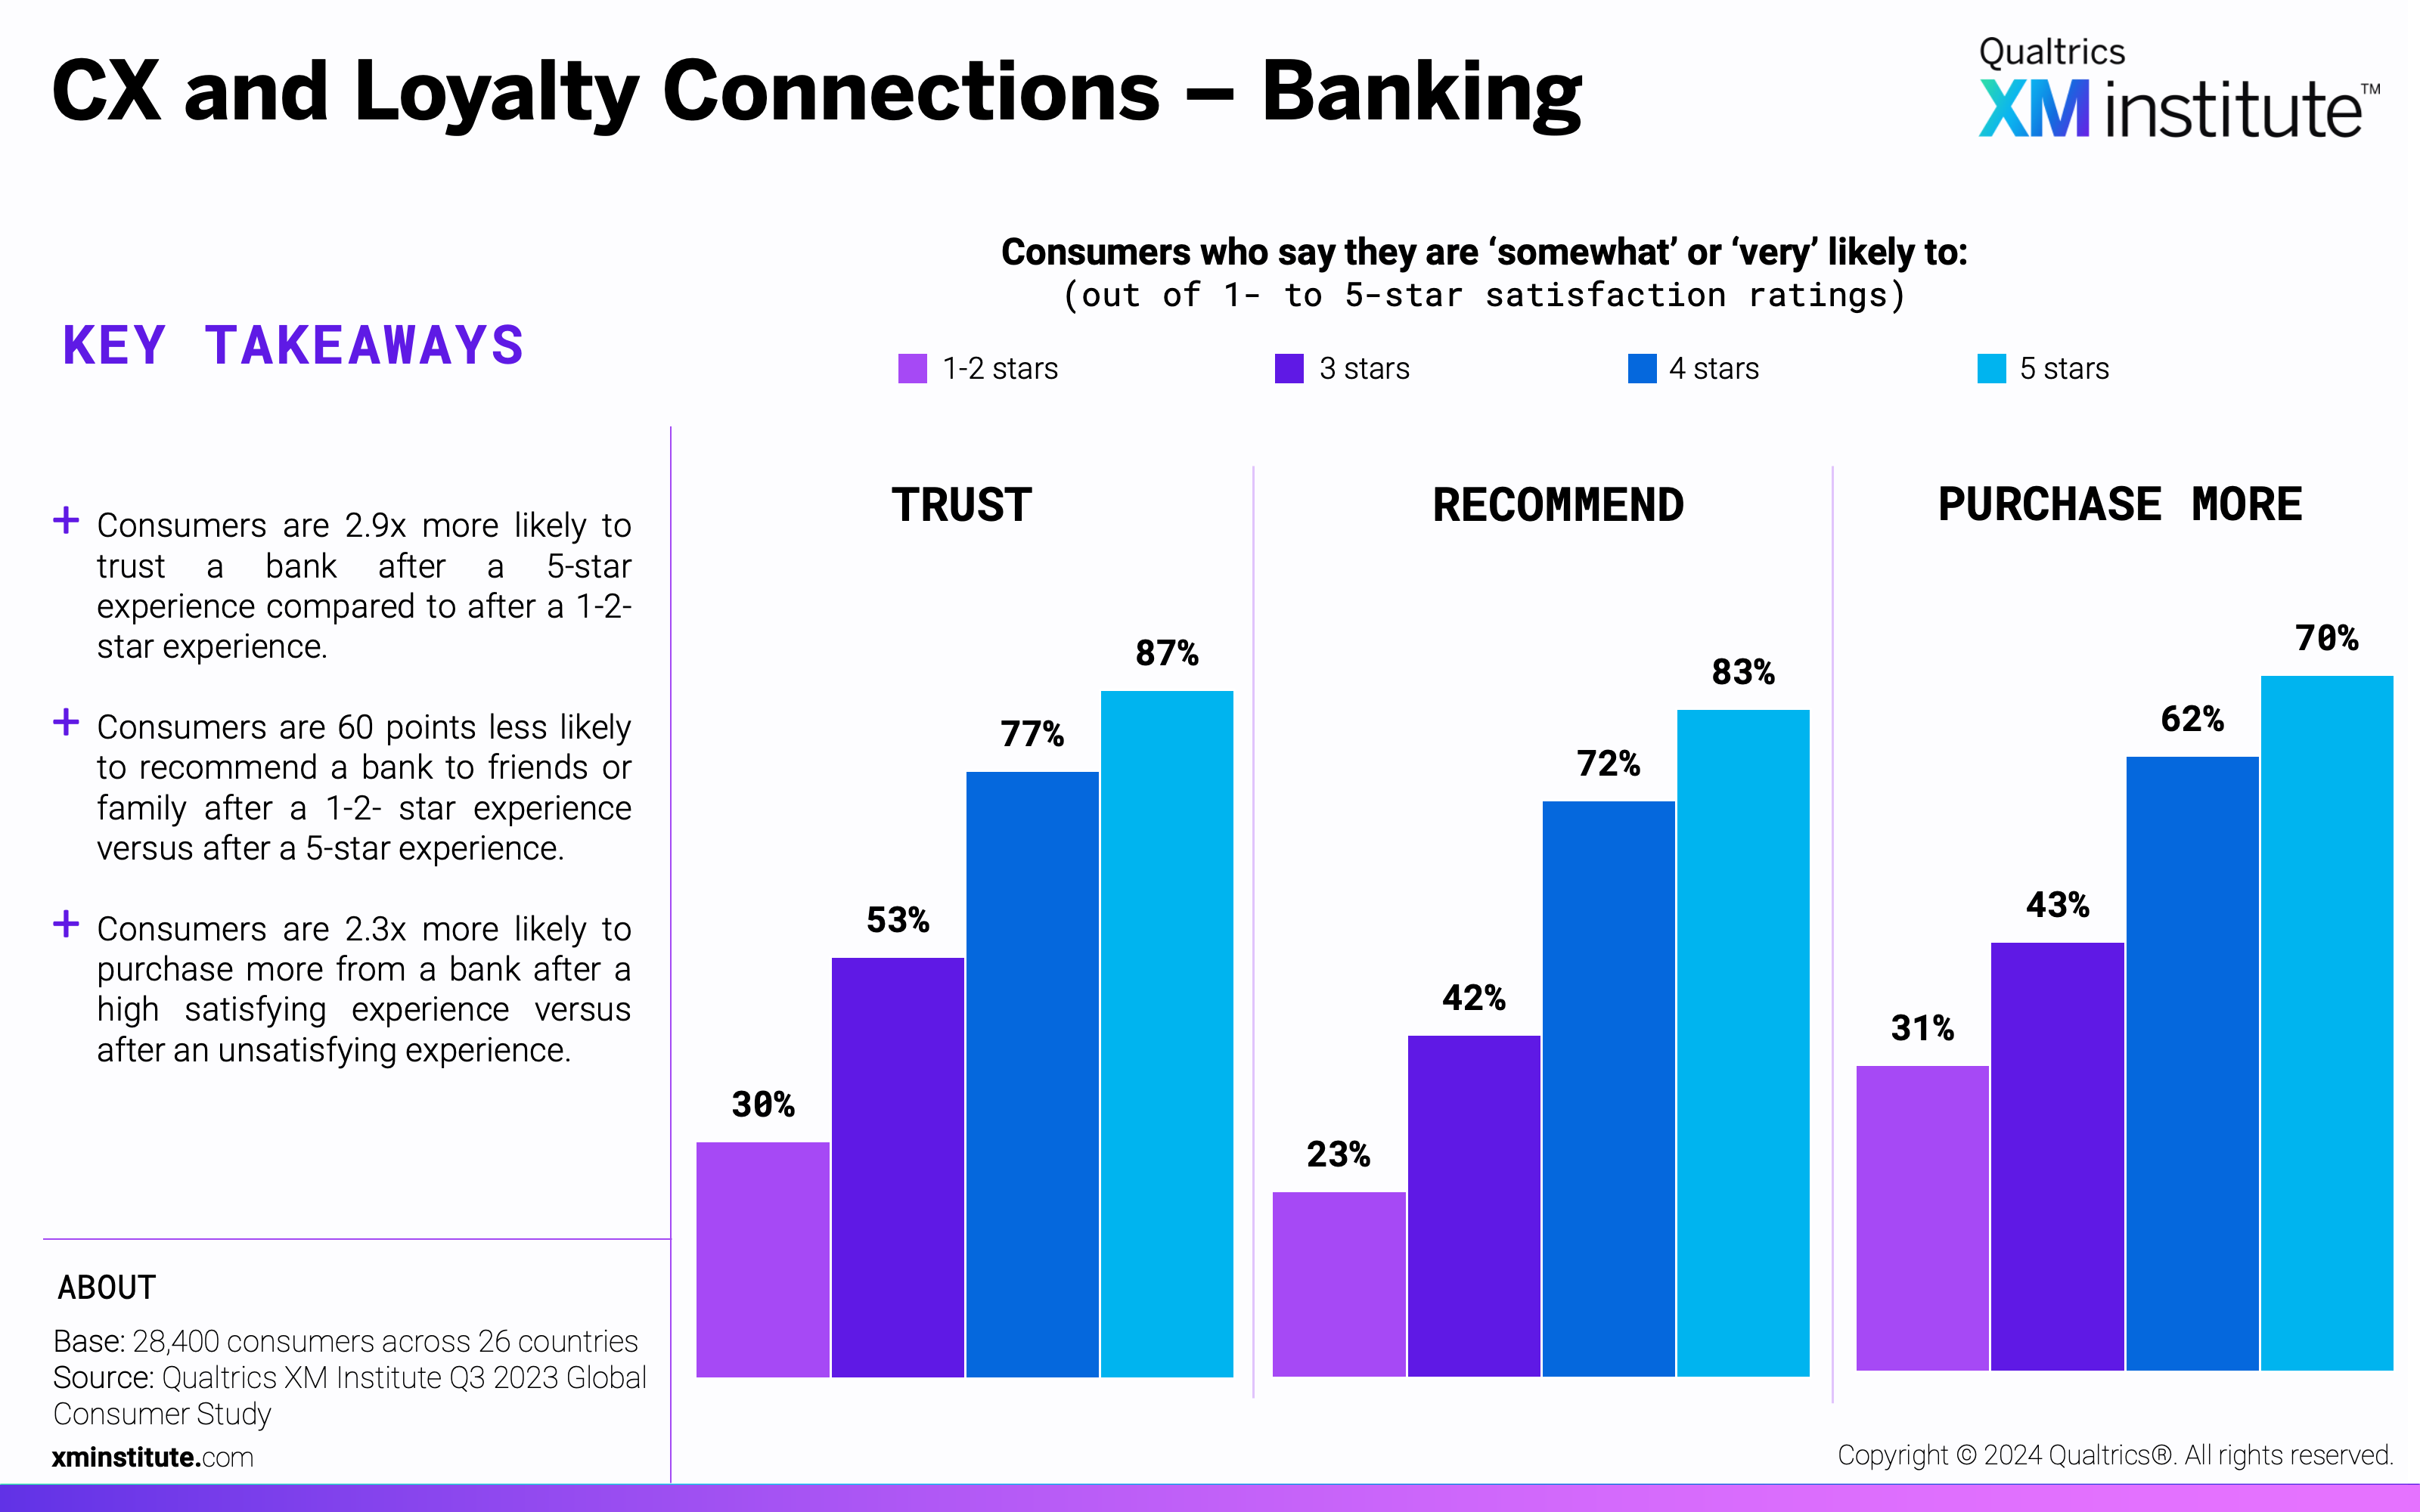
- CX and Loyalty Connections – Banking (see Figure 10)
- CX and Loyalty Connections – College/University (see Figure 11)
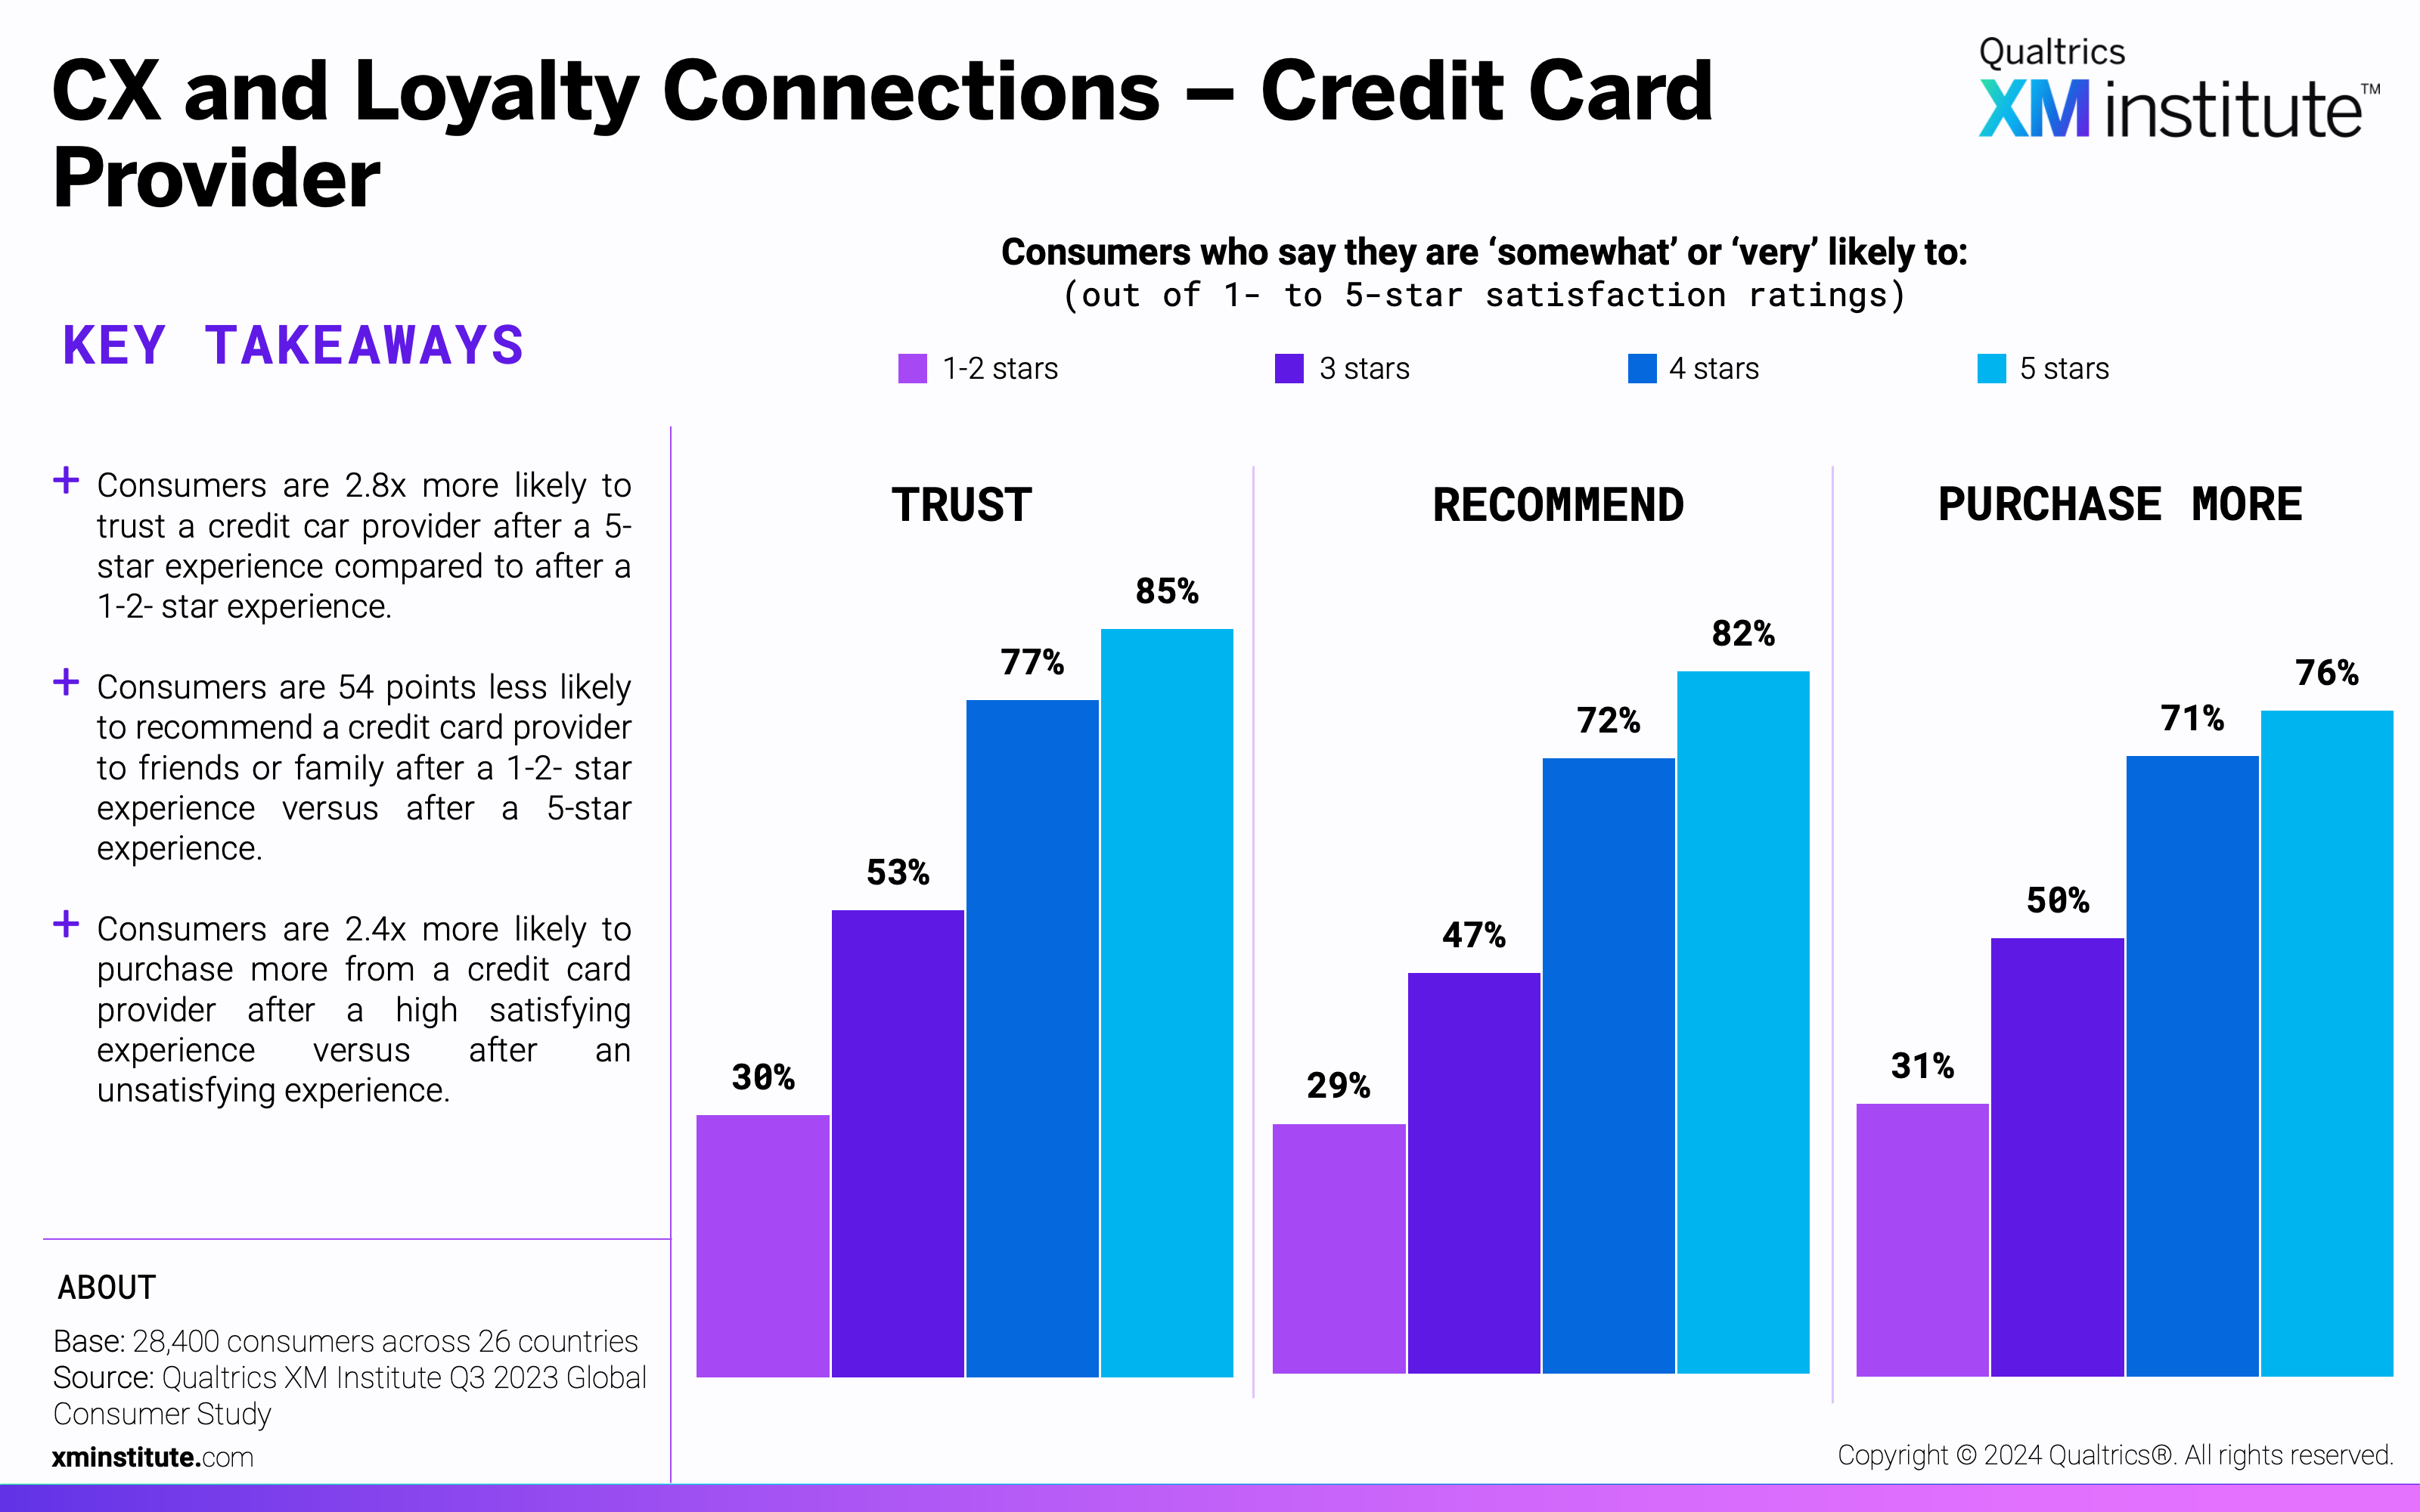
- CX and Loyalty Connections – Credit Card Provider (see Figure 12)
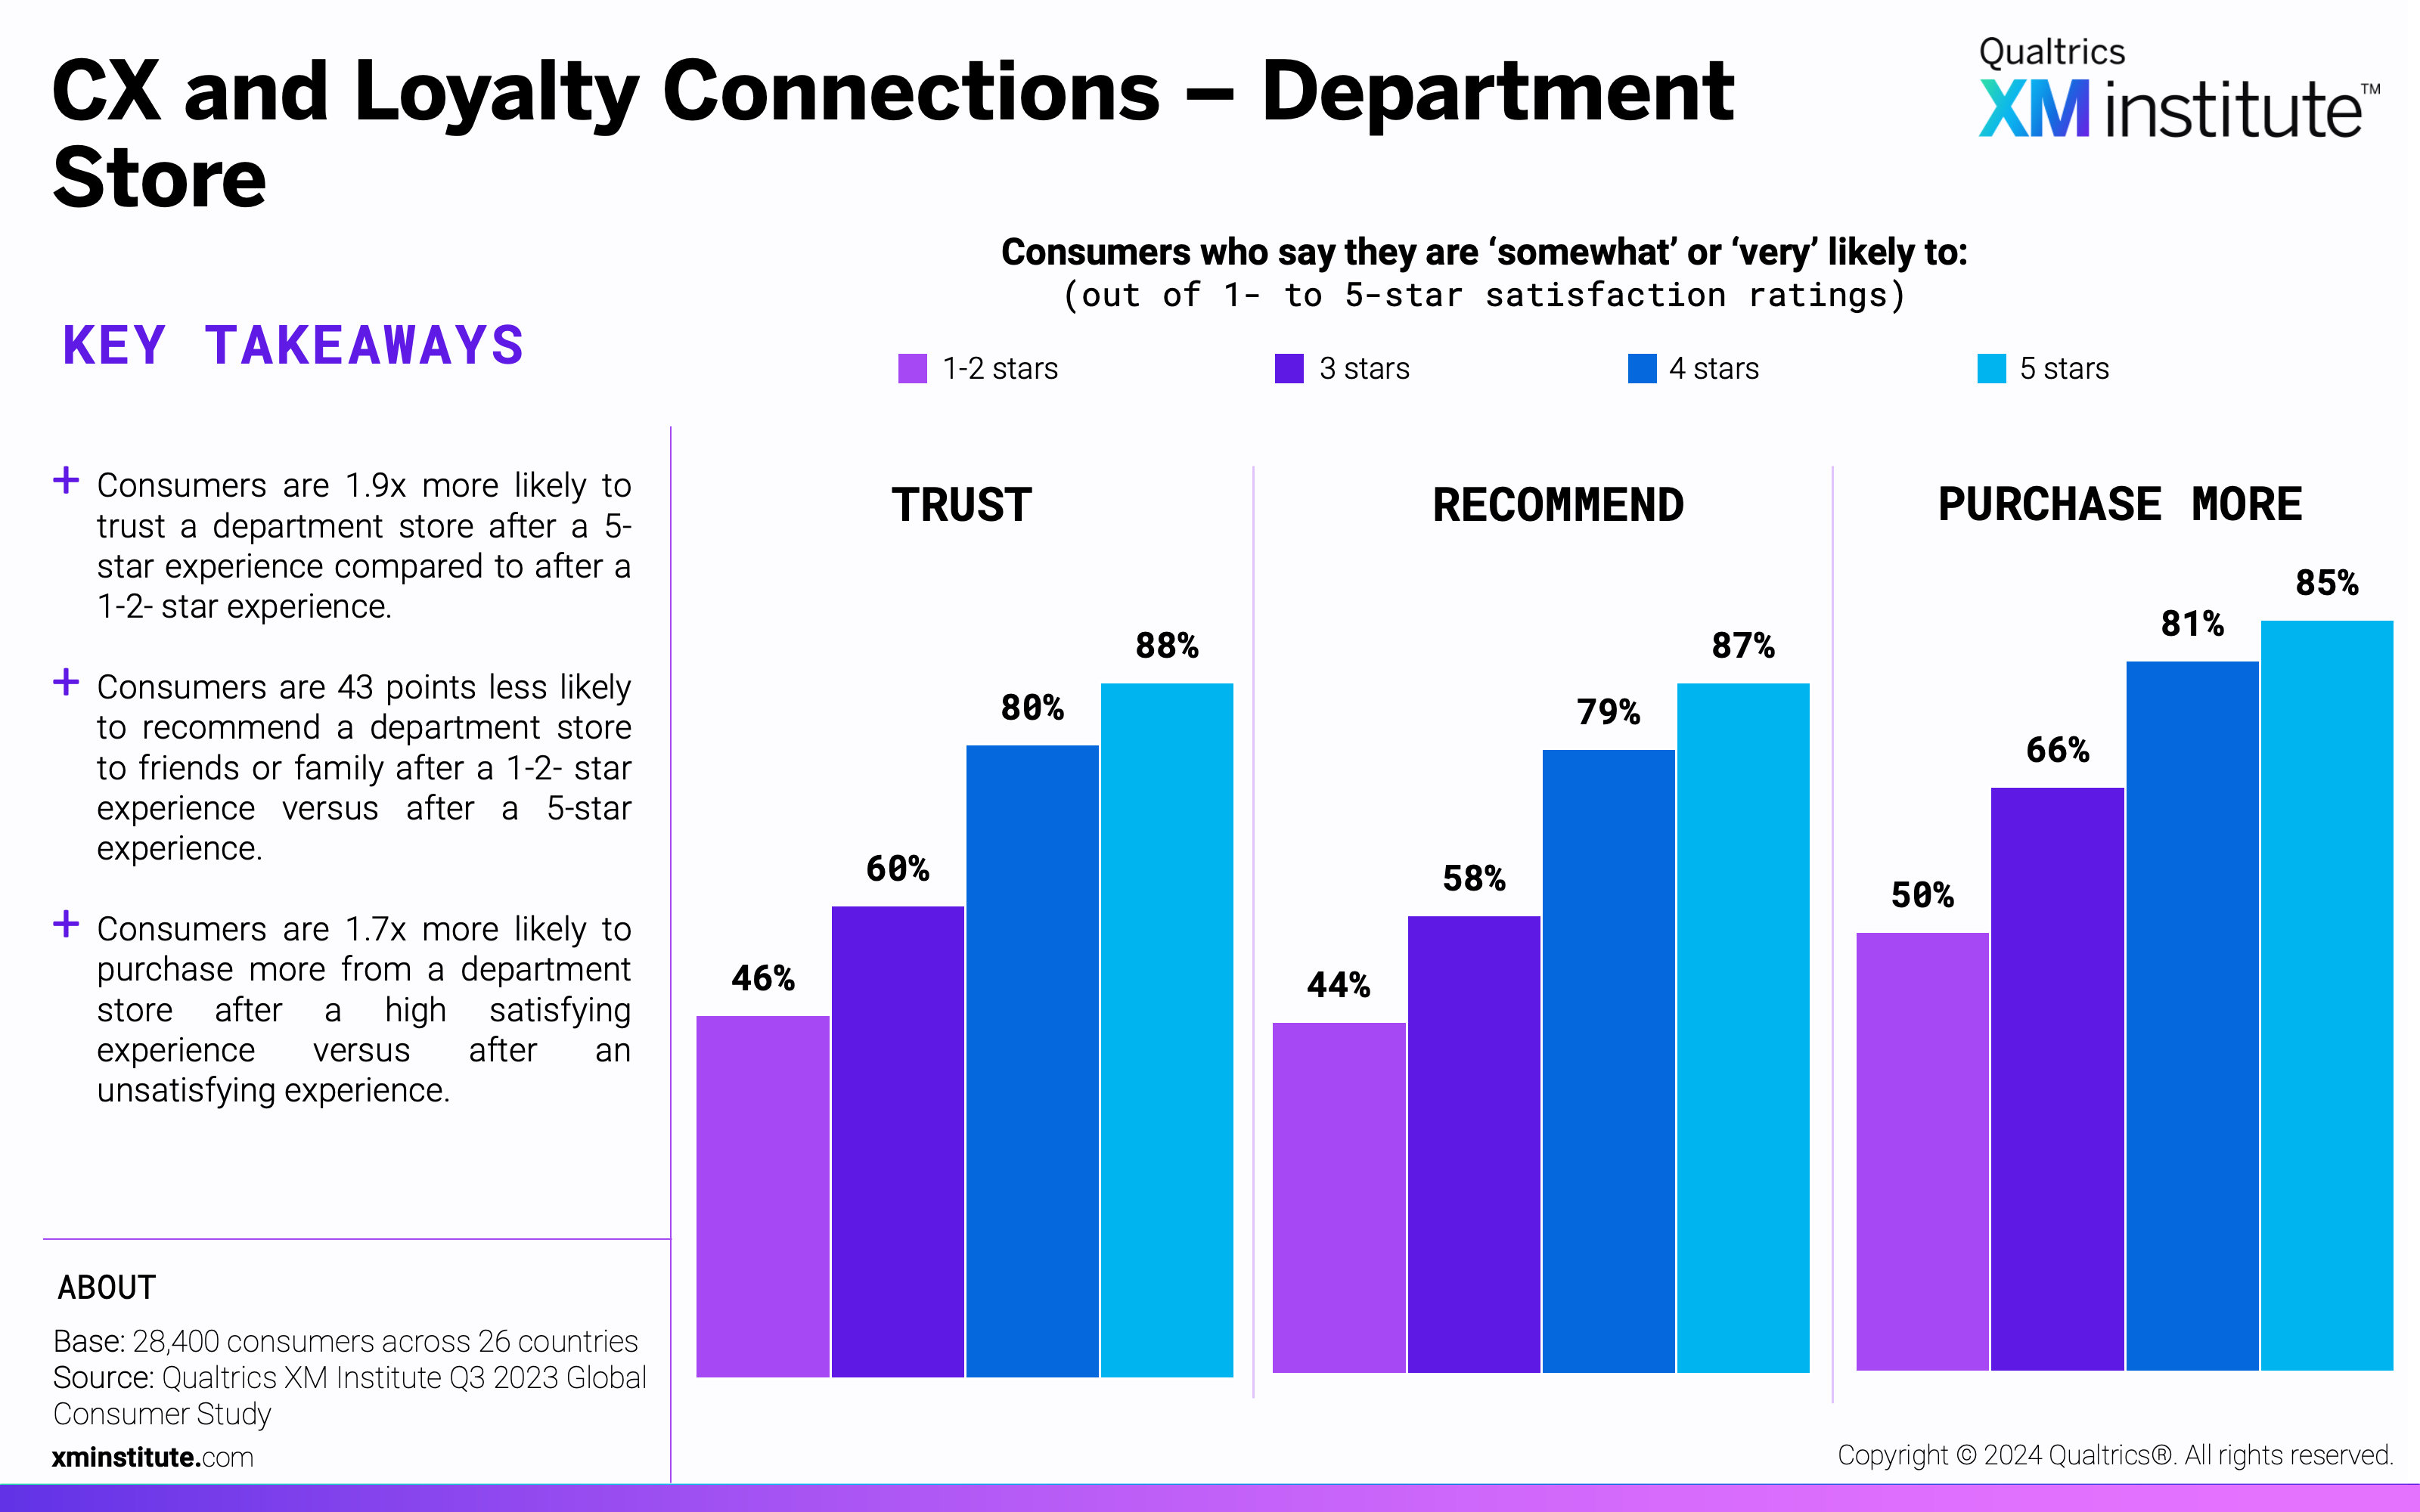
- CX and Loyalty Connections – Department Store (see Figure 13)
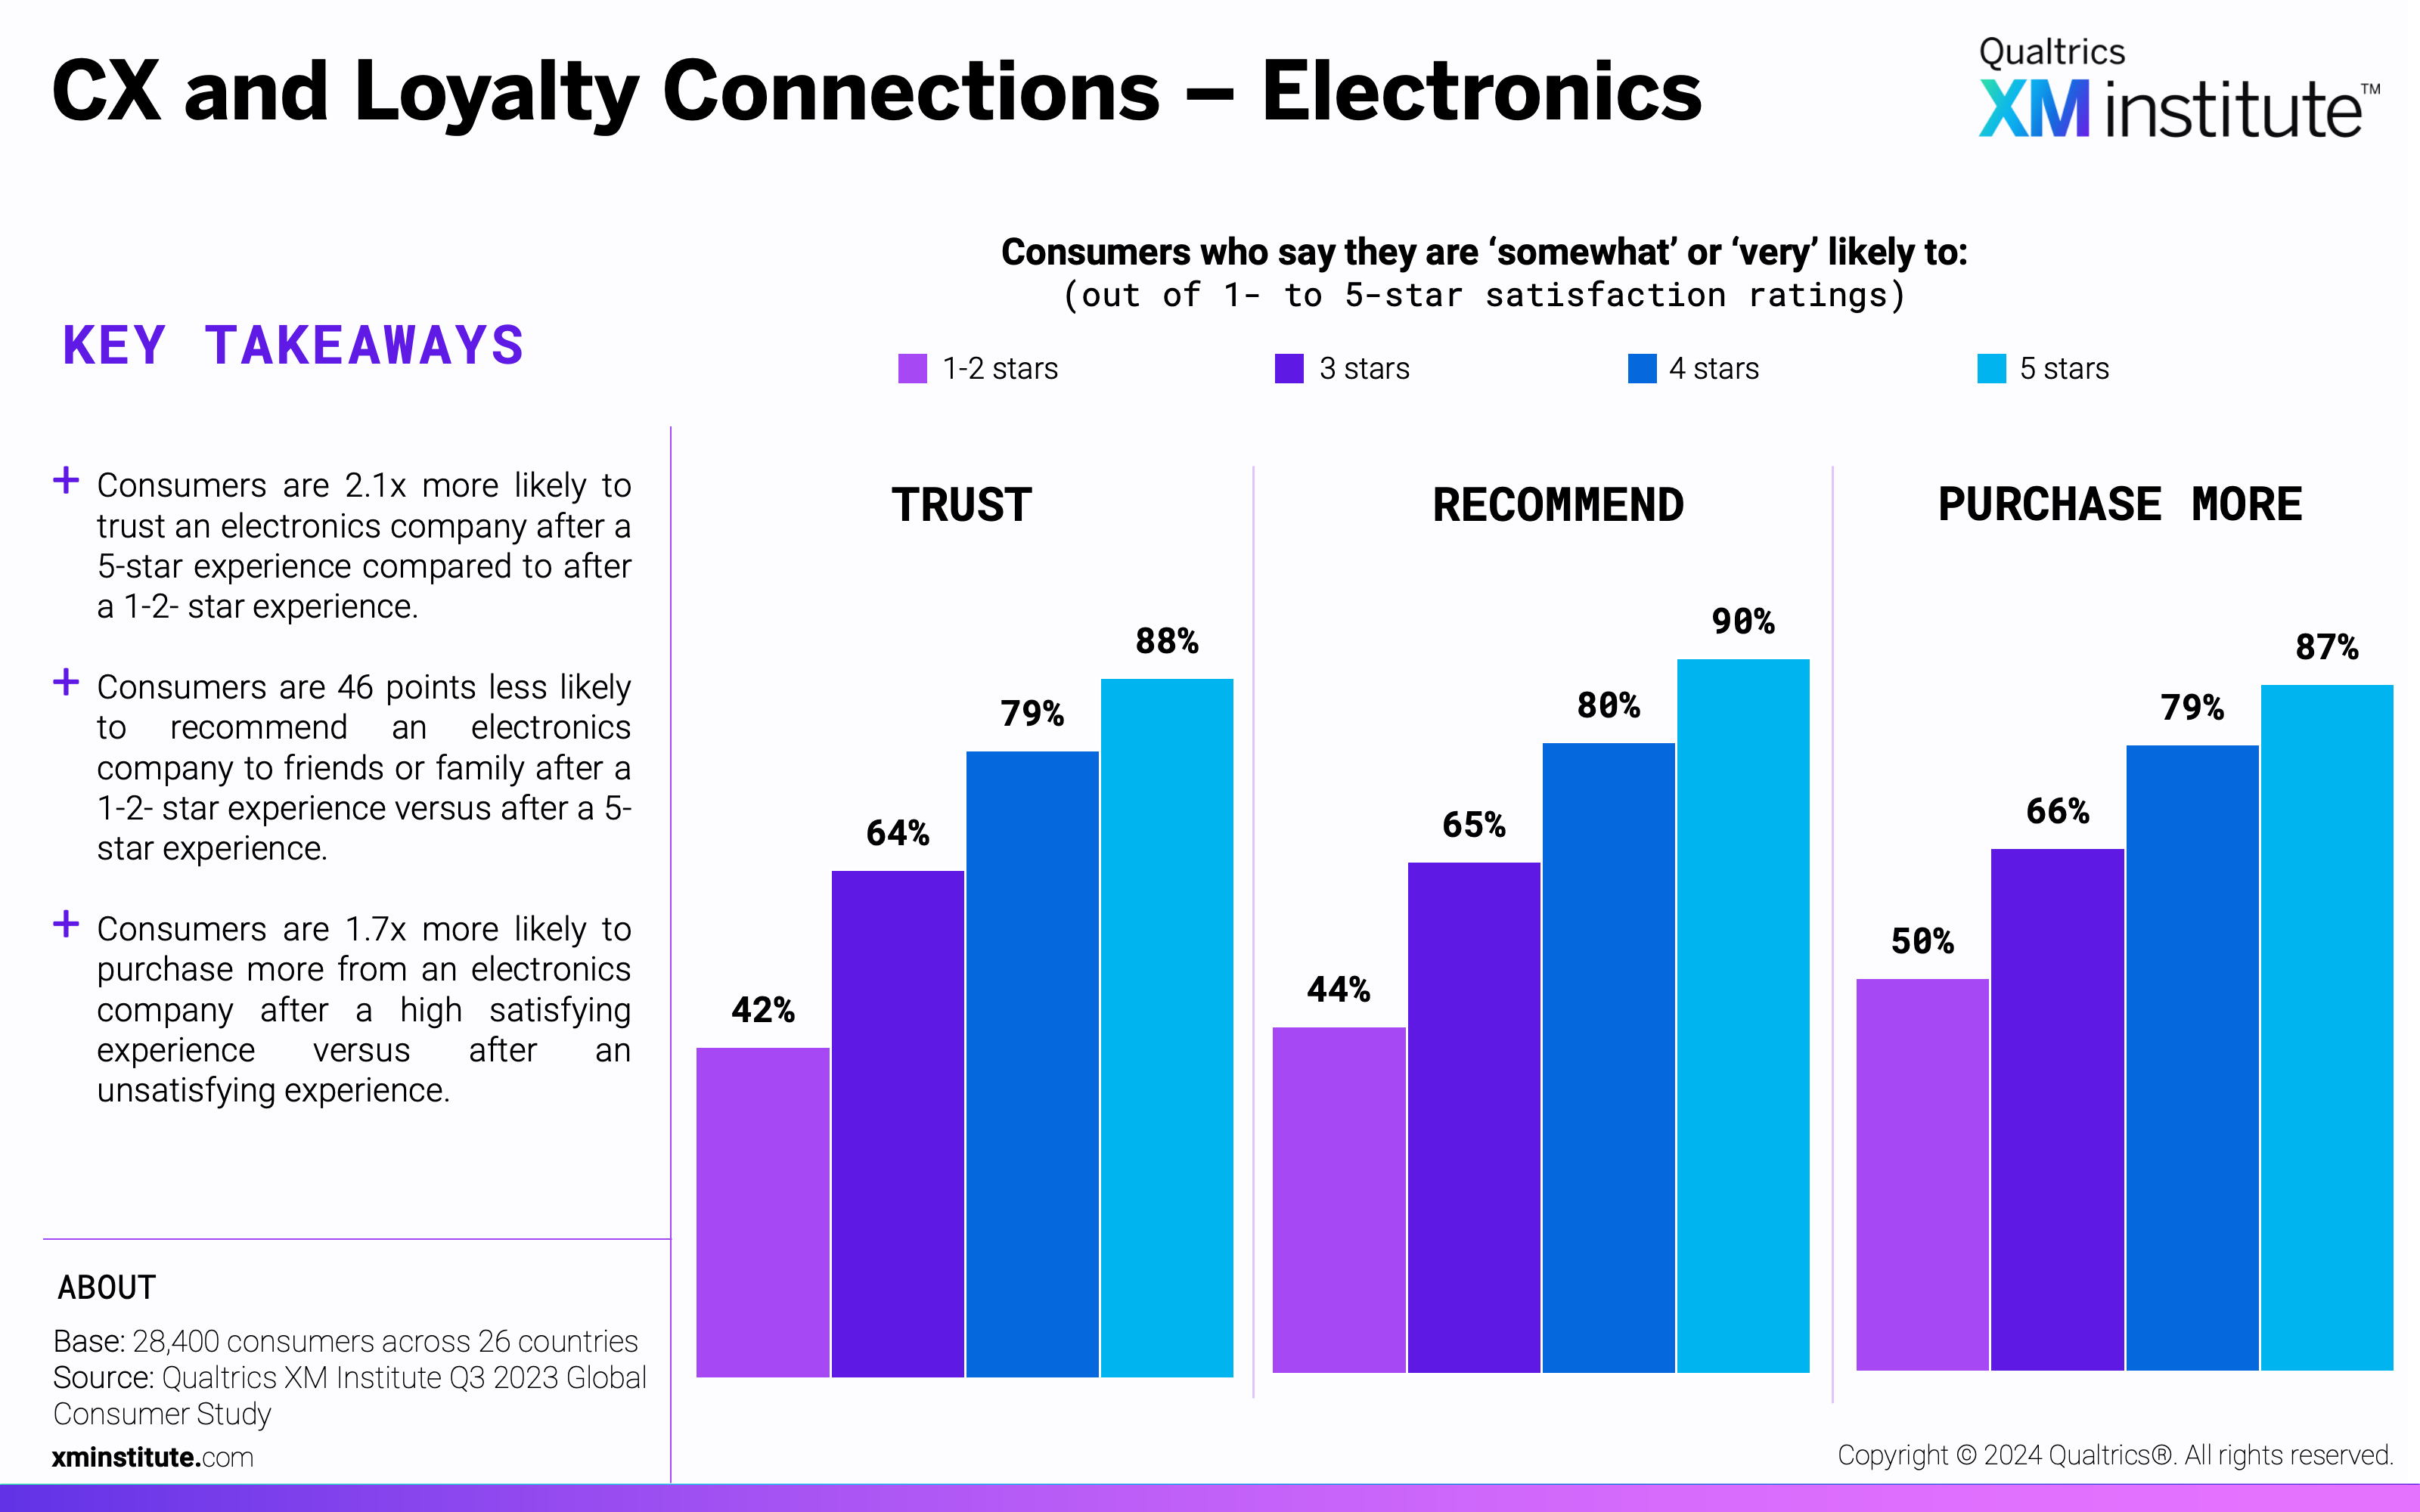
- CX and Loyalty Connections – Electronics (see Figure 14)
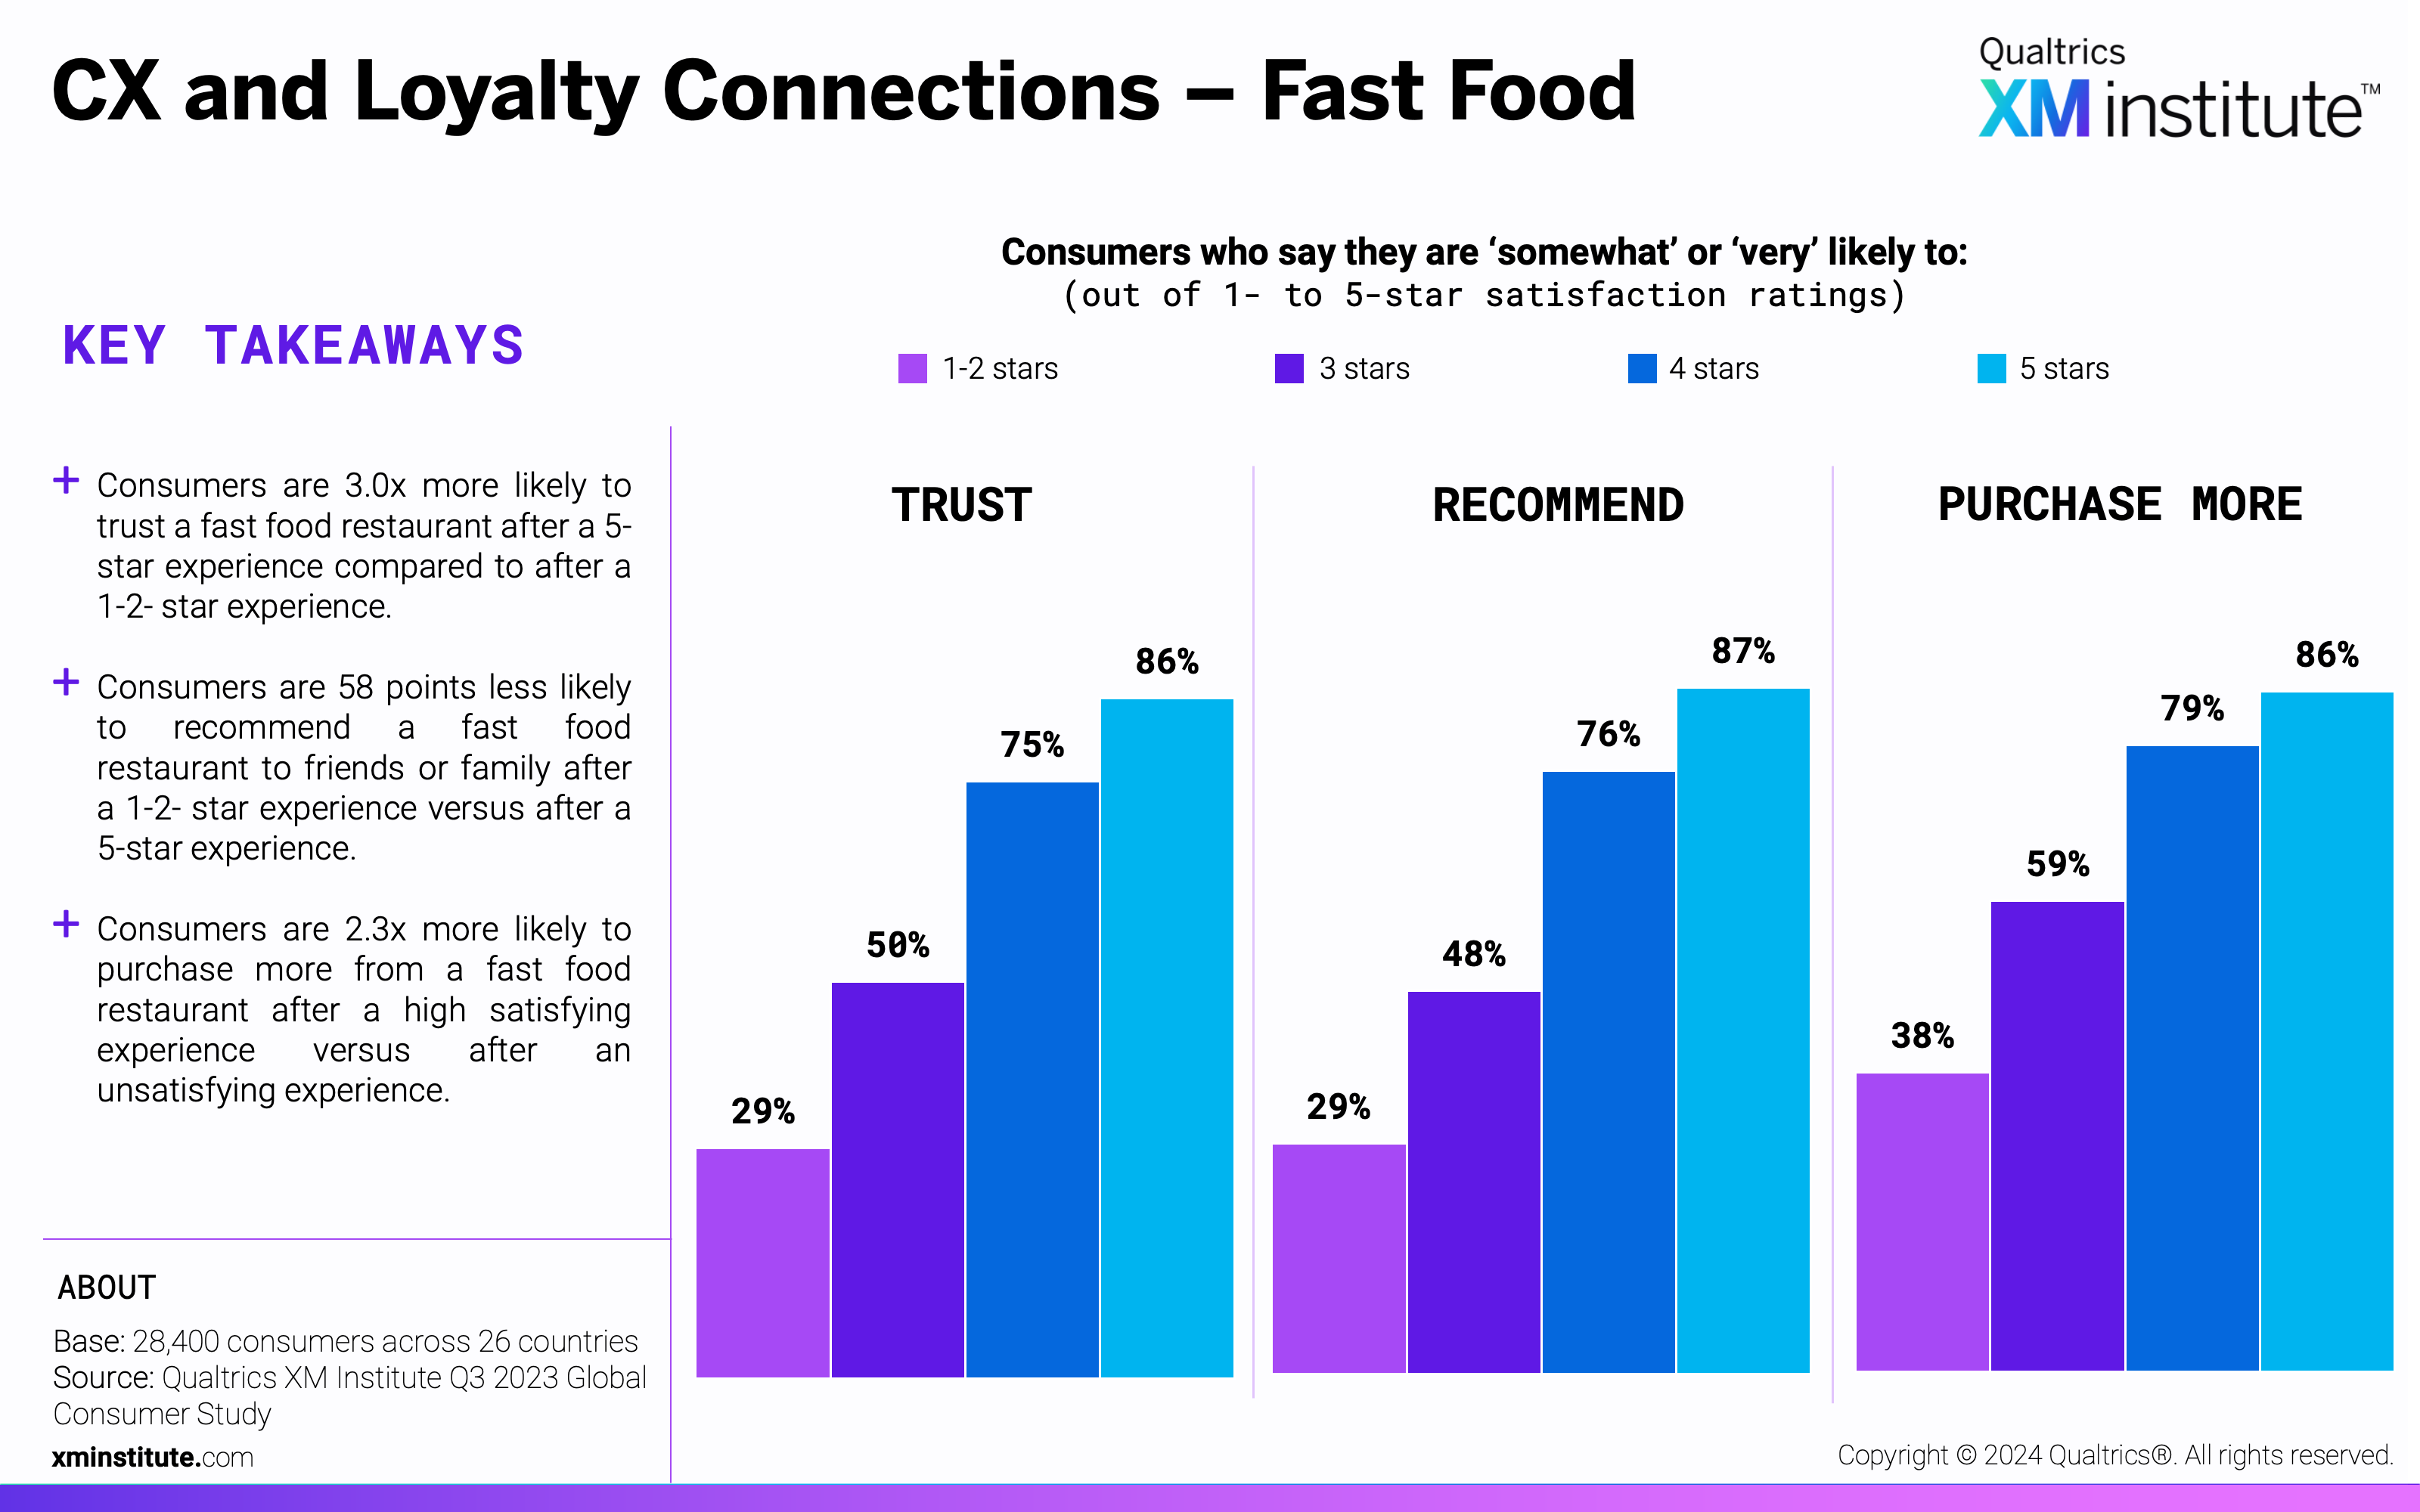
- CX and Loyalty Connections – Fast Food (see Figure 15)
- CX and Loyalty Connections – Government Agency (see Figure 16)
- CX and Loyalty Connections – Health Insurance (see Figure 17)
- CX and Loyalty Connections – Hospital/Medical Clinic (see Figure 18)
- CX and Loyalty Connections – Hotel (see Figure 19)
- CX and Loyalty Connections – Internet Service Provider (see Figure 20)
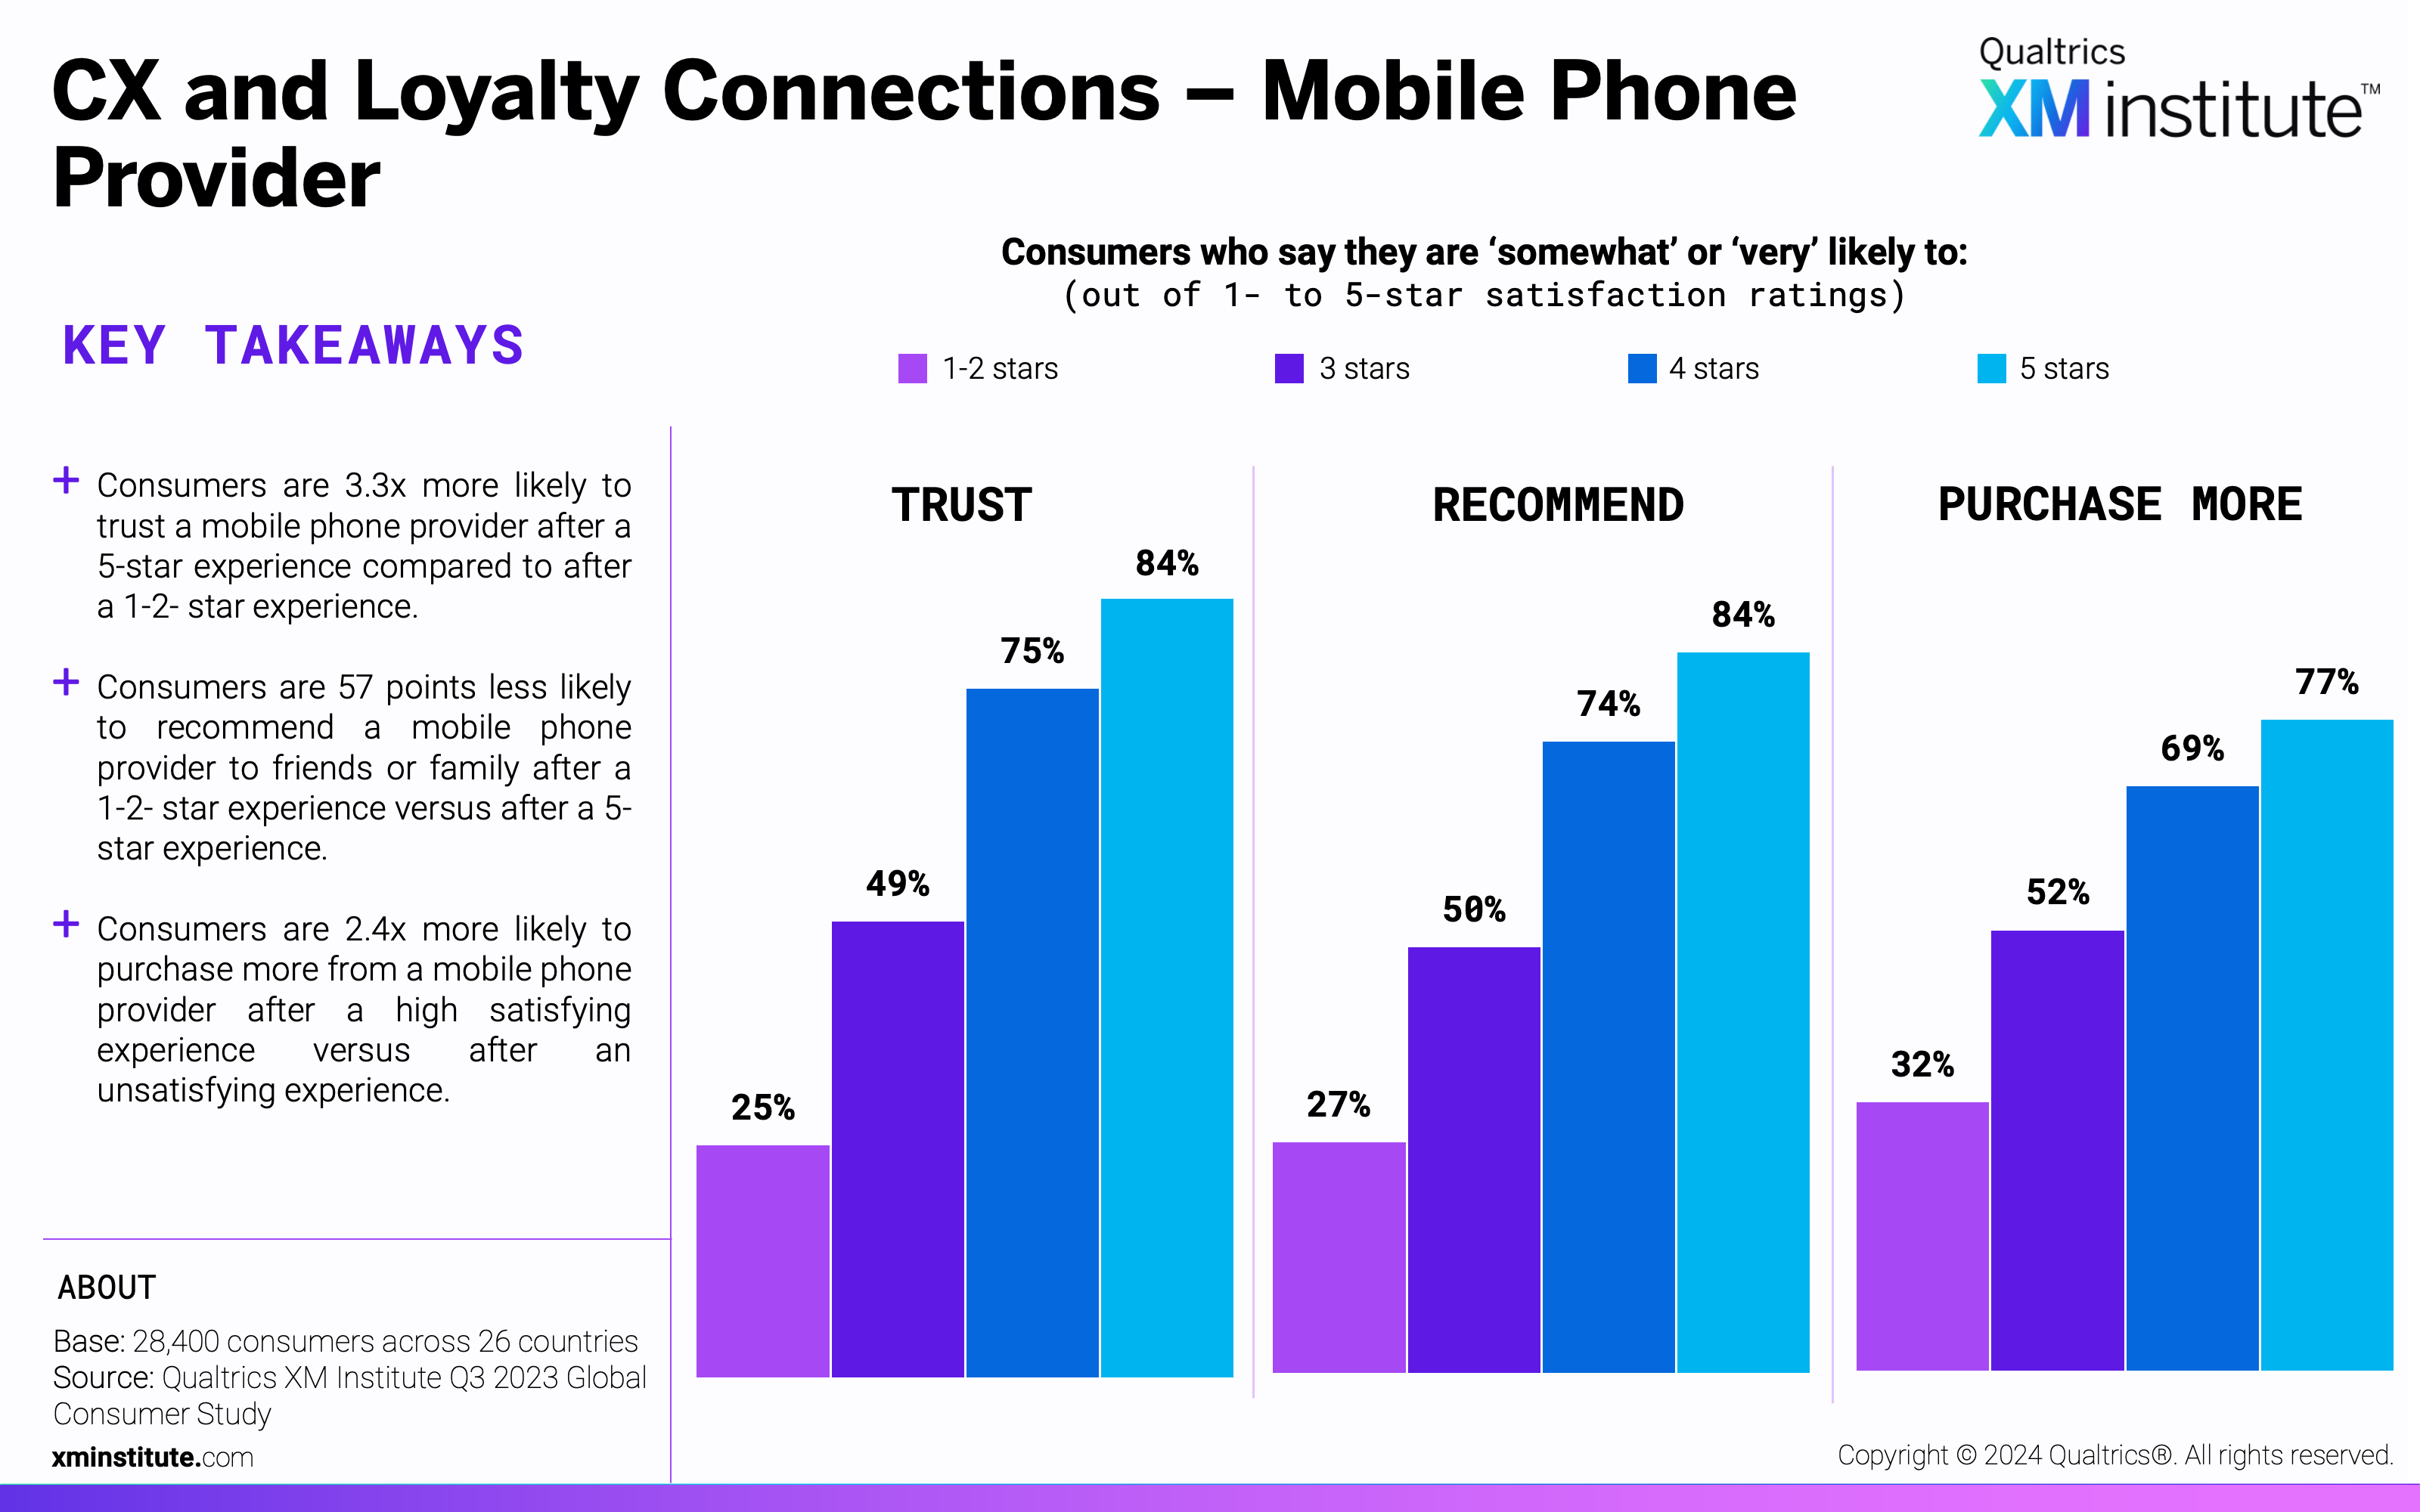
- CX and Loyalty Connections – Mobile Phone Provider (see Figure 21)
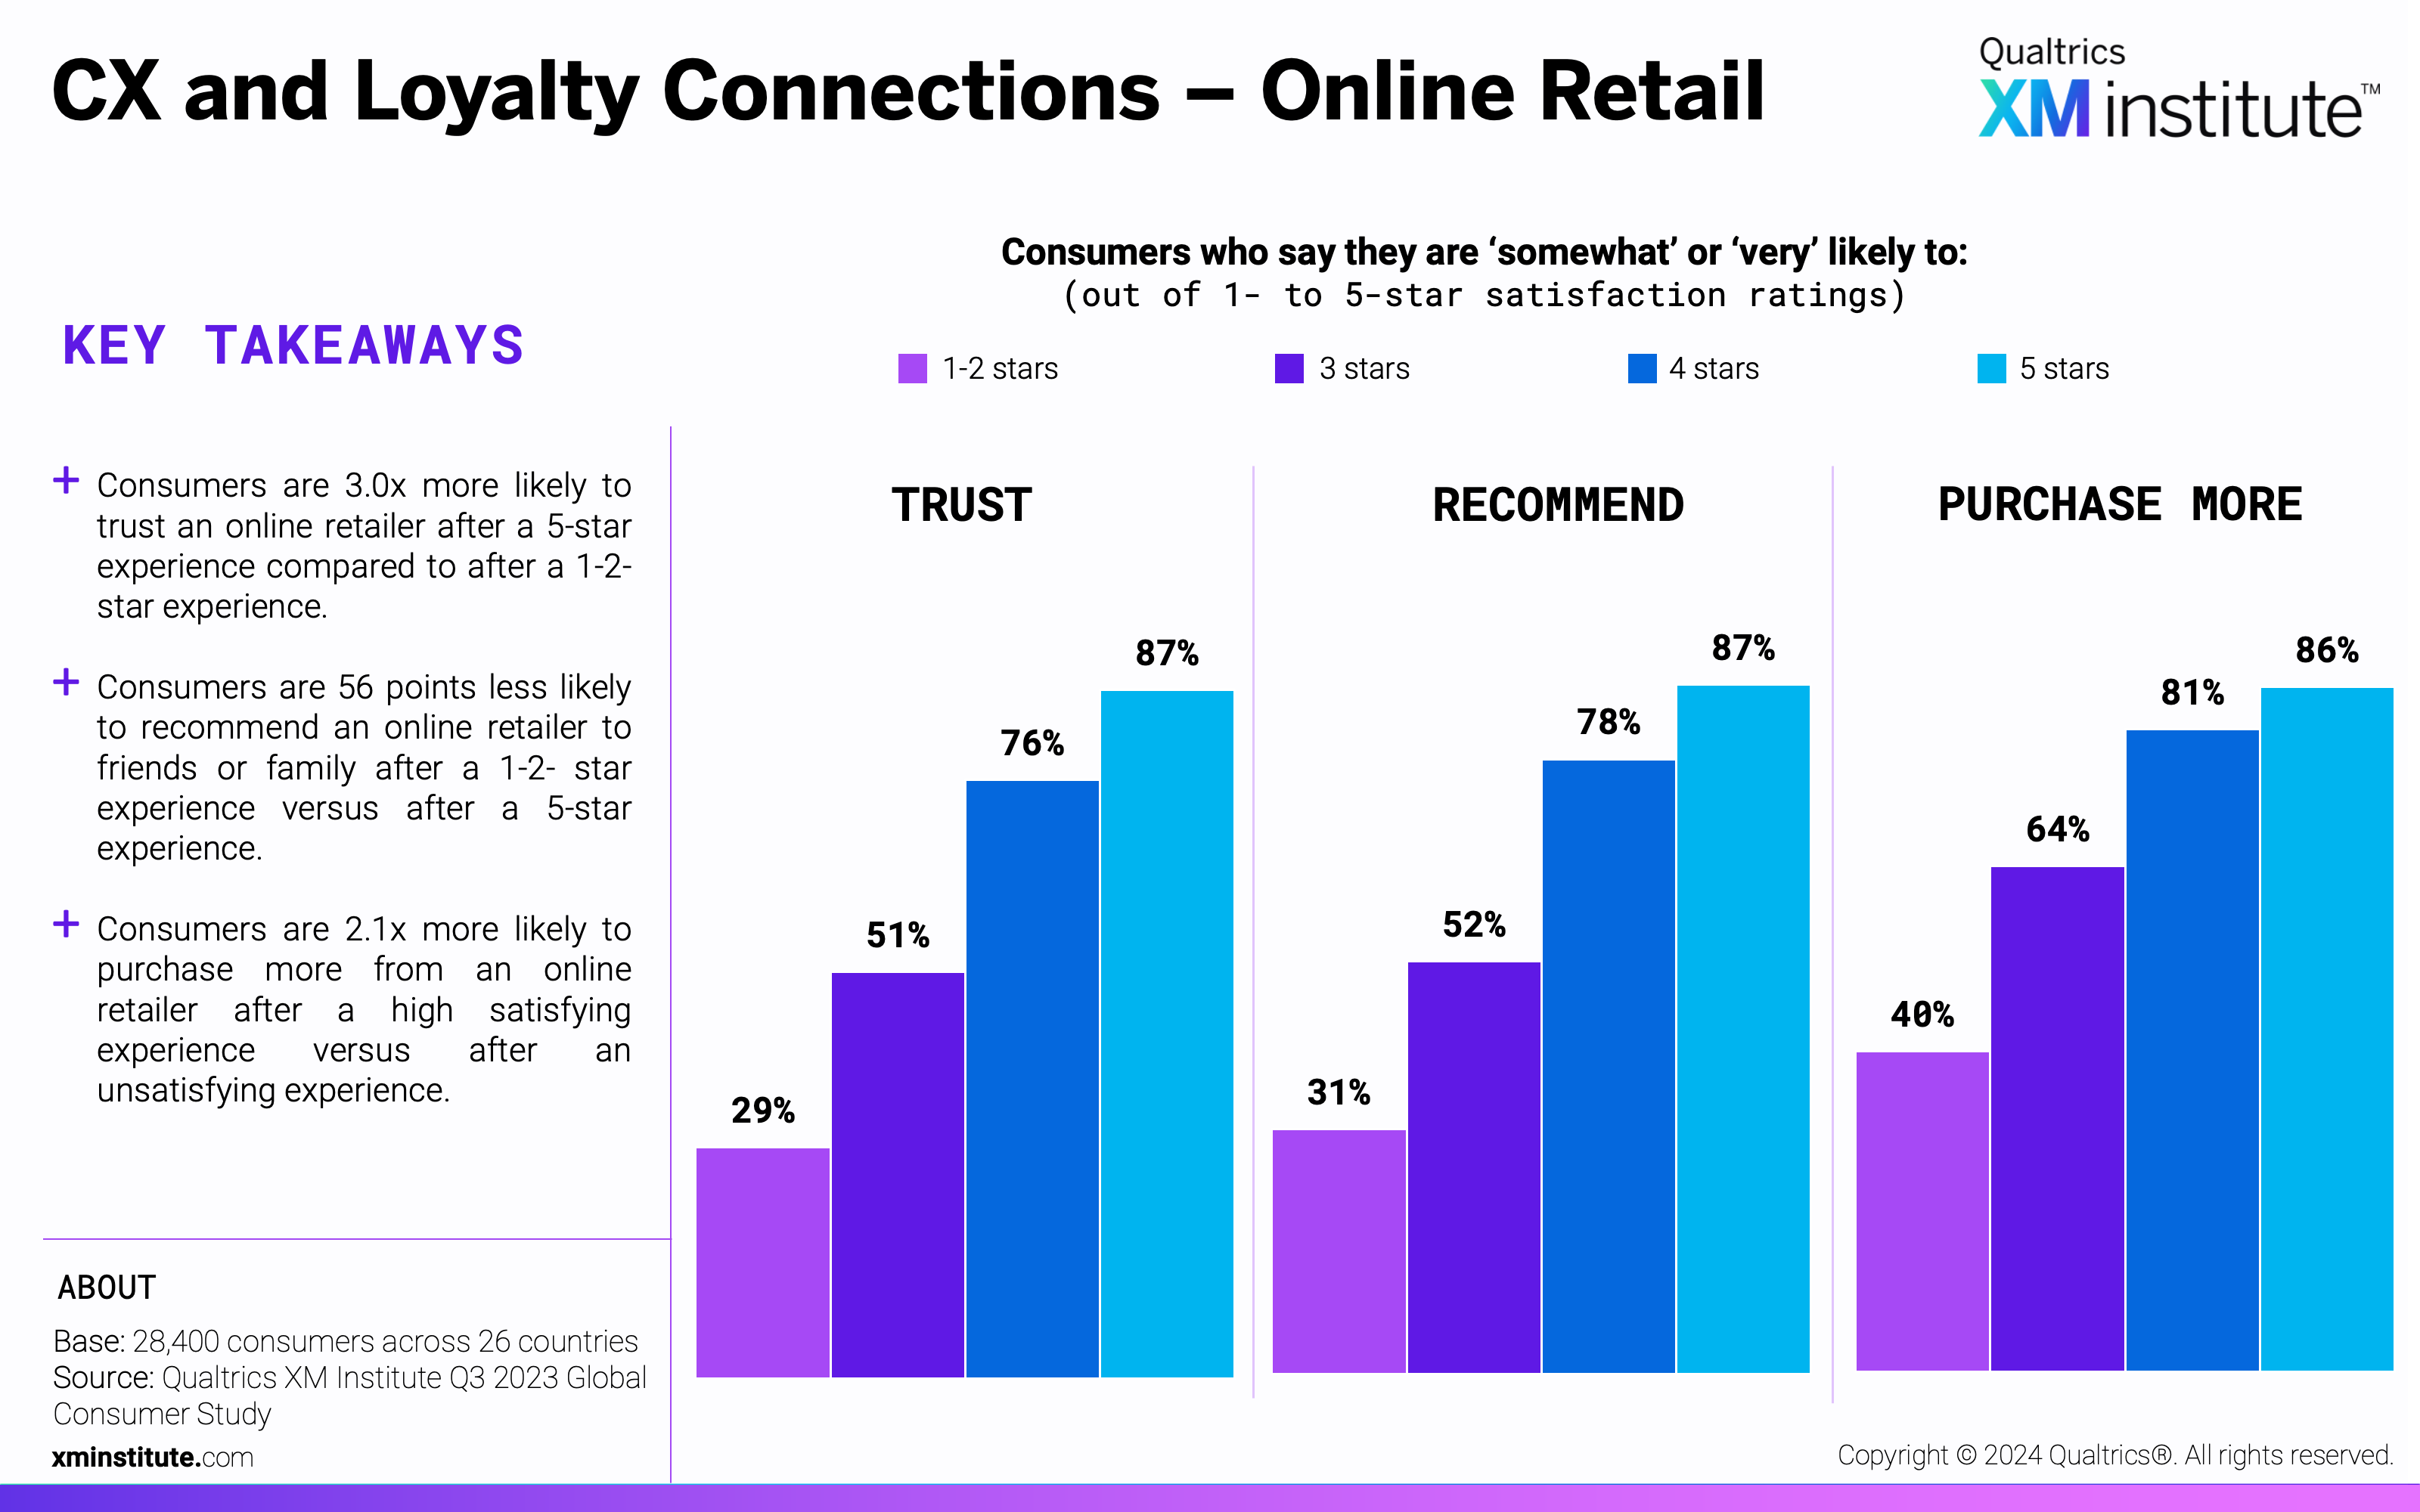
- CX and Loyalty Connections – Online Retail (see Figure 22)
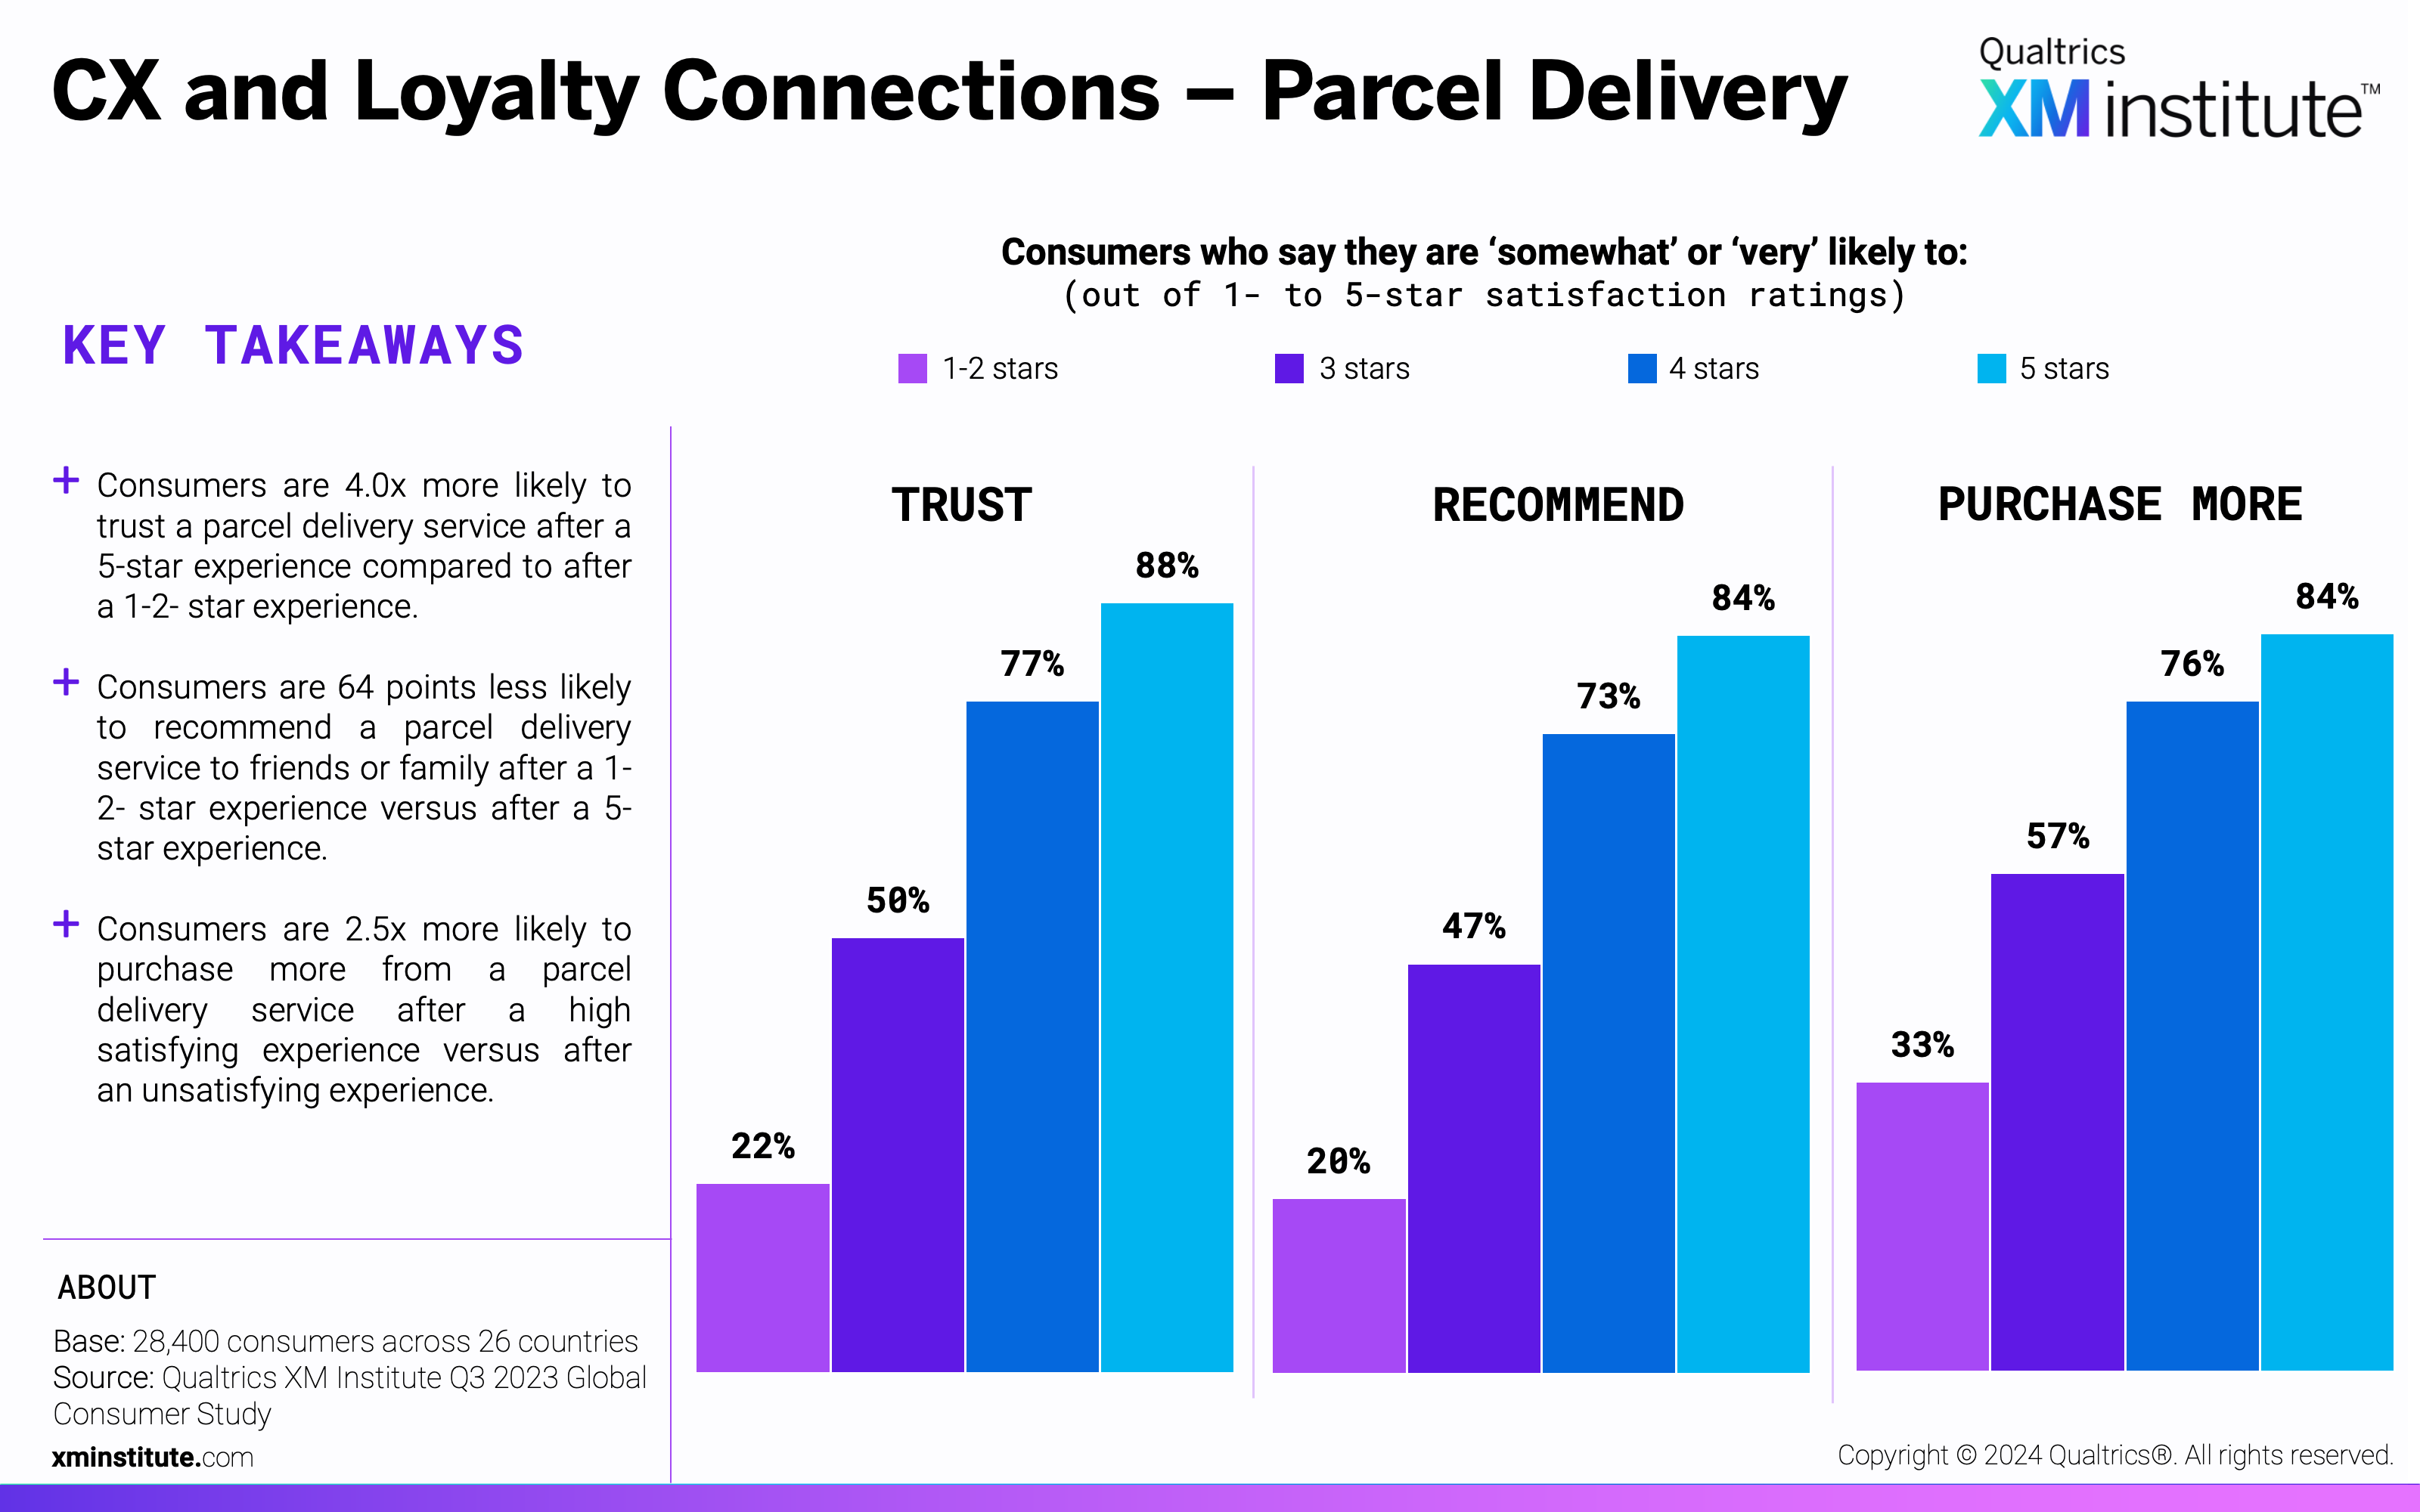
- CX and Loyalty Connections – Parcel Delivery (see Figure 23)
- CX and Loyalty Connections – Property Insurance (see Figure 24)
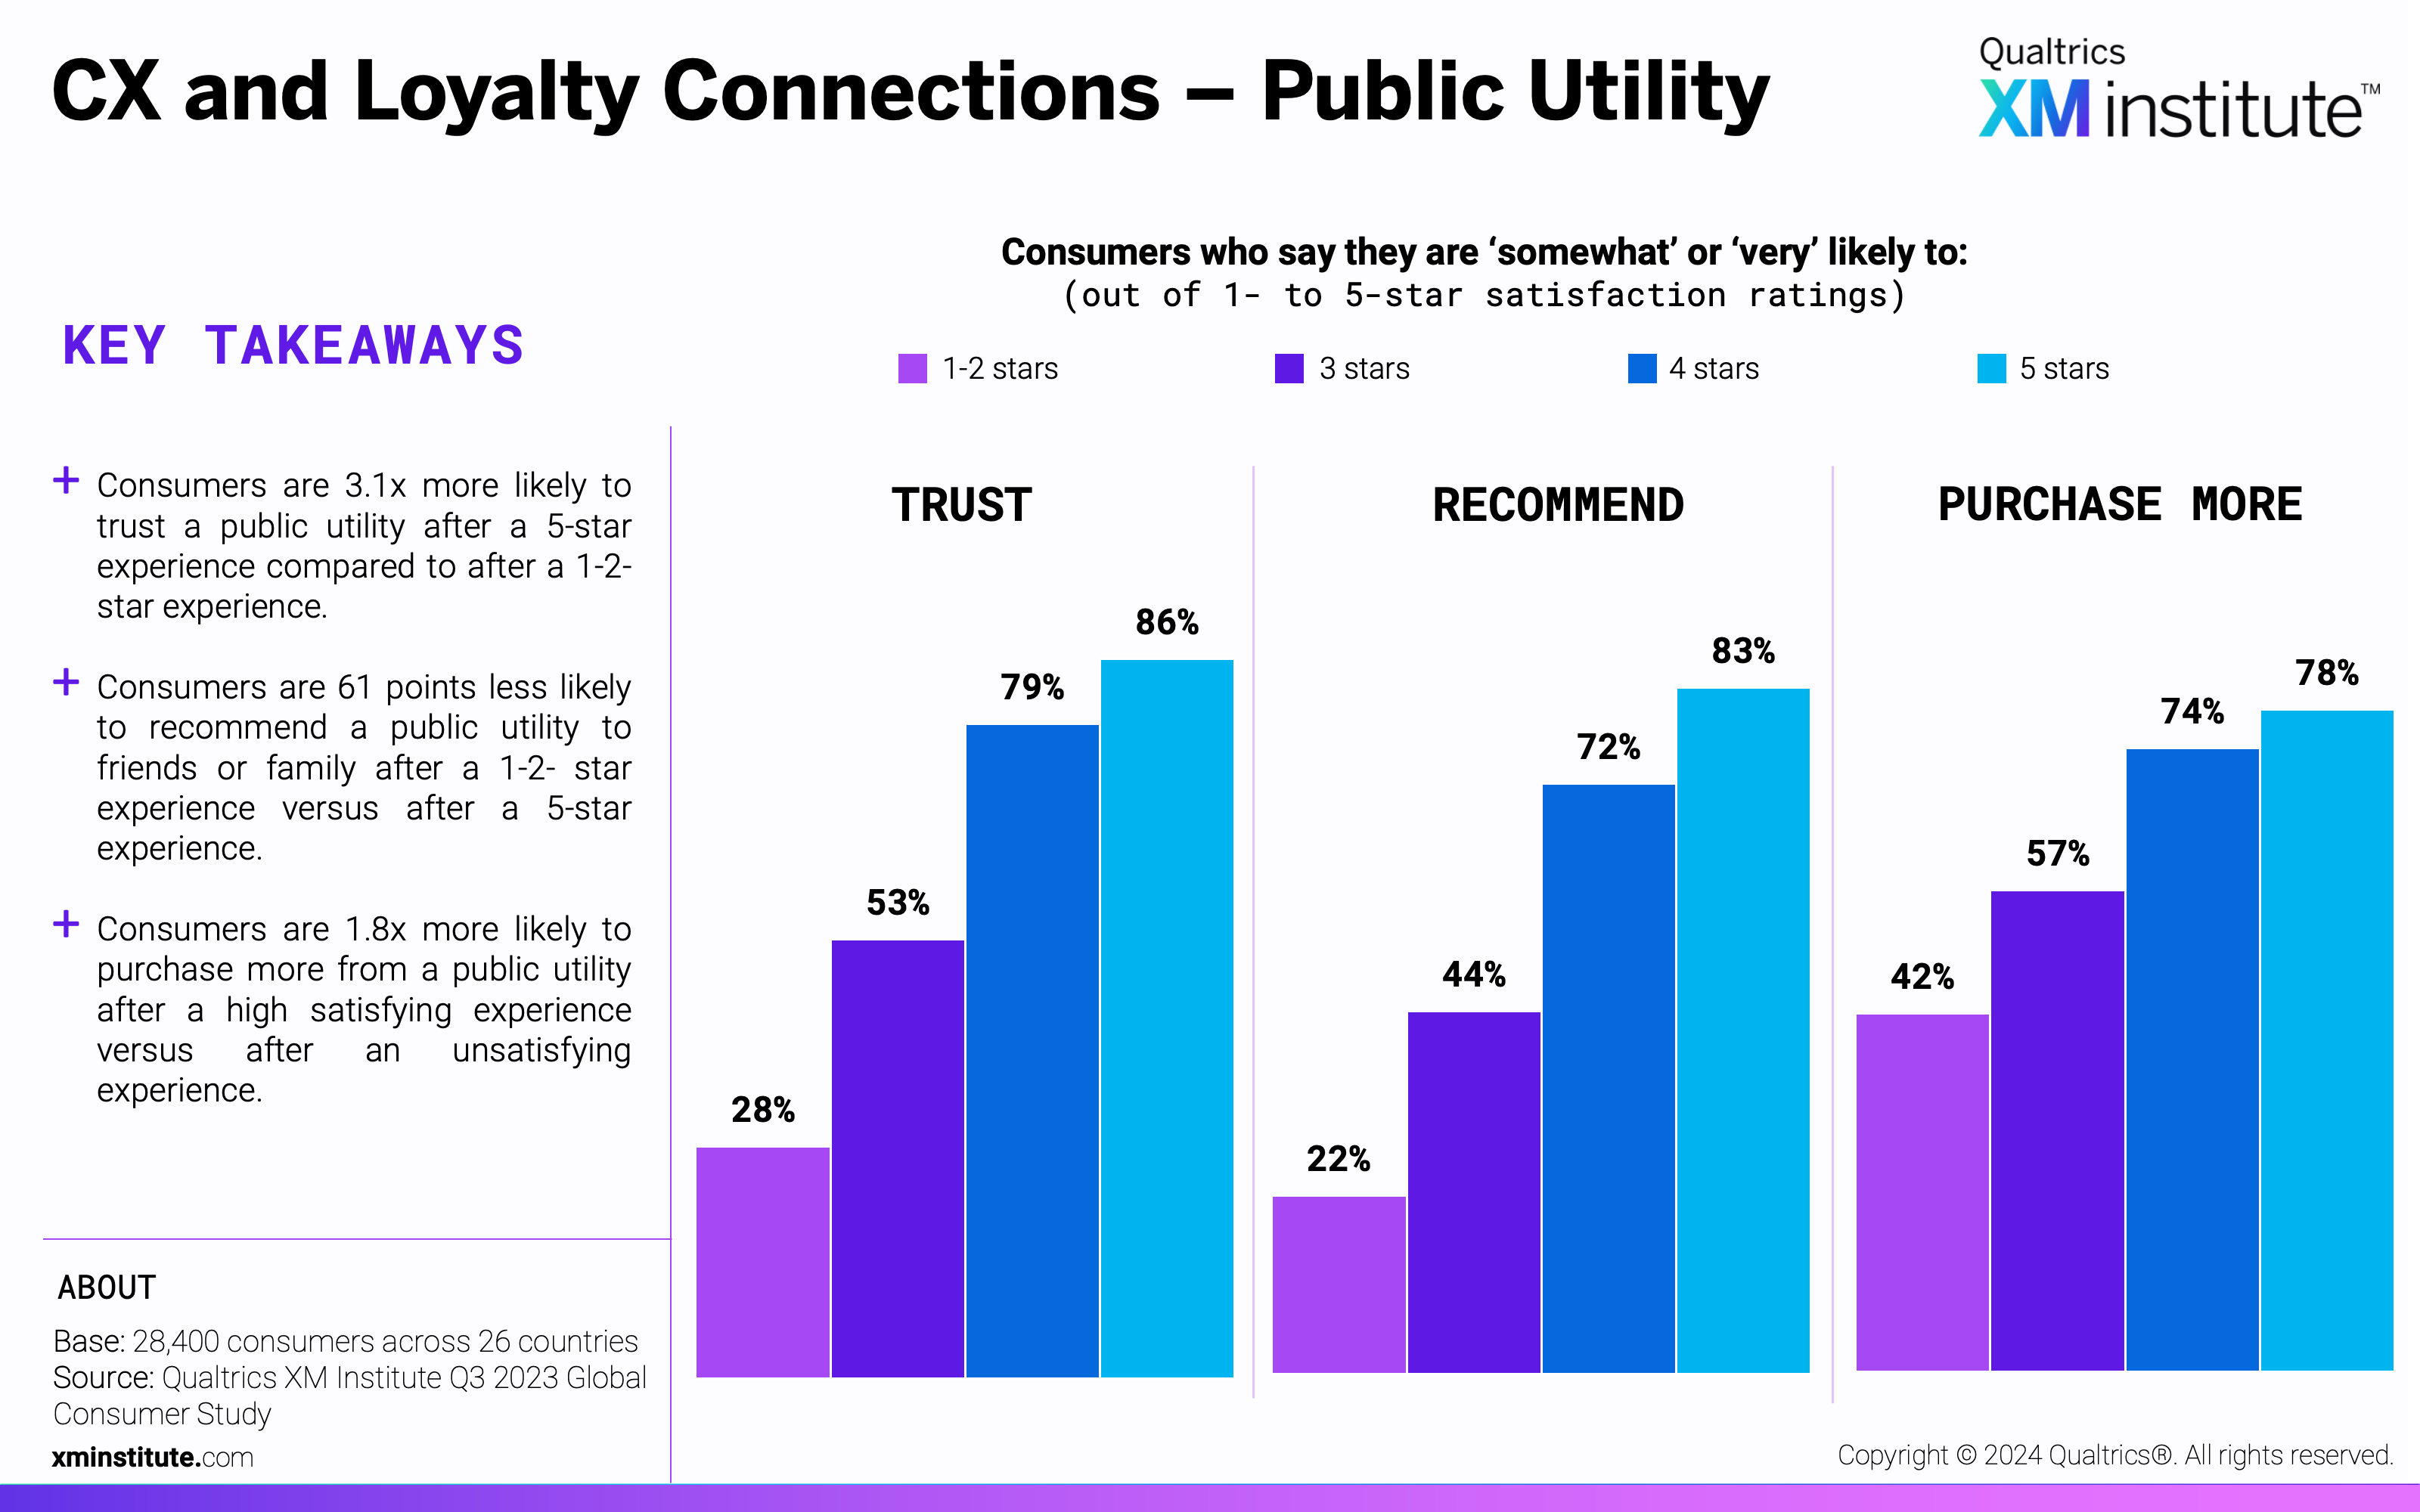
- CX and Loyalty Connections – Public Utility (see Figure 25)
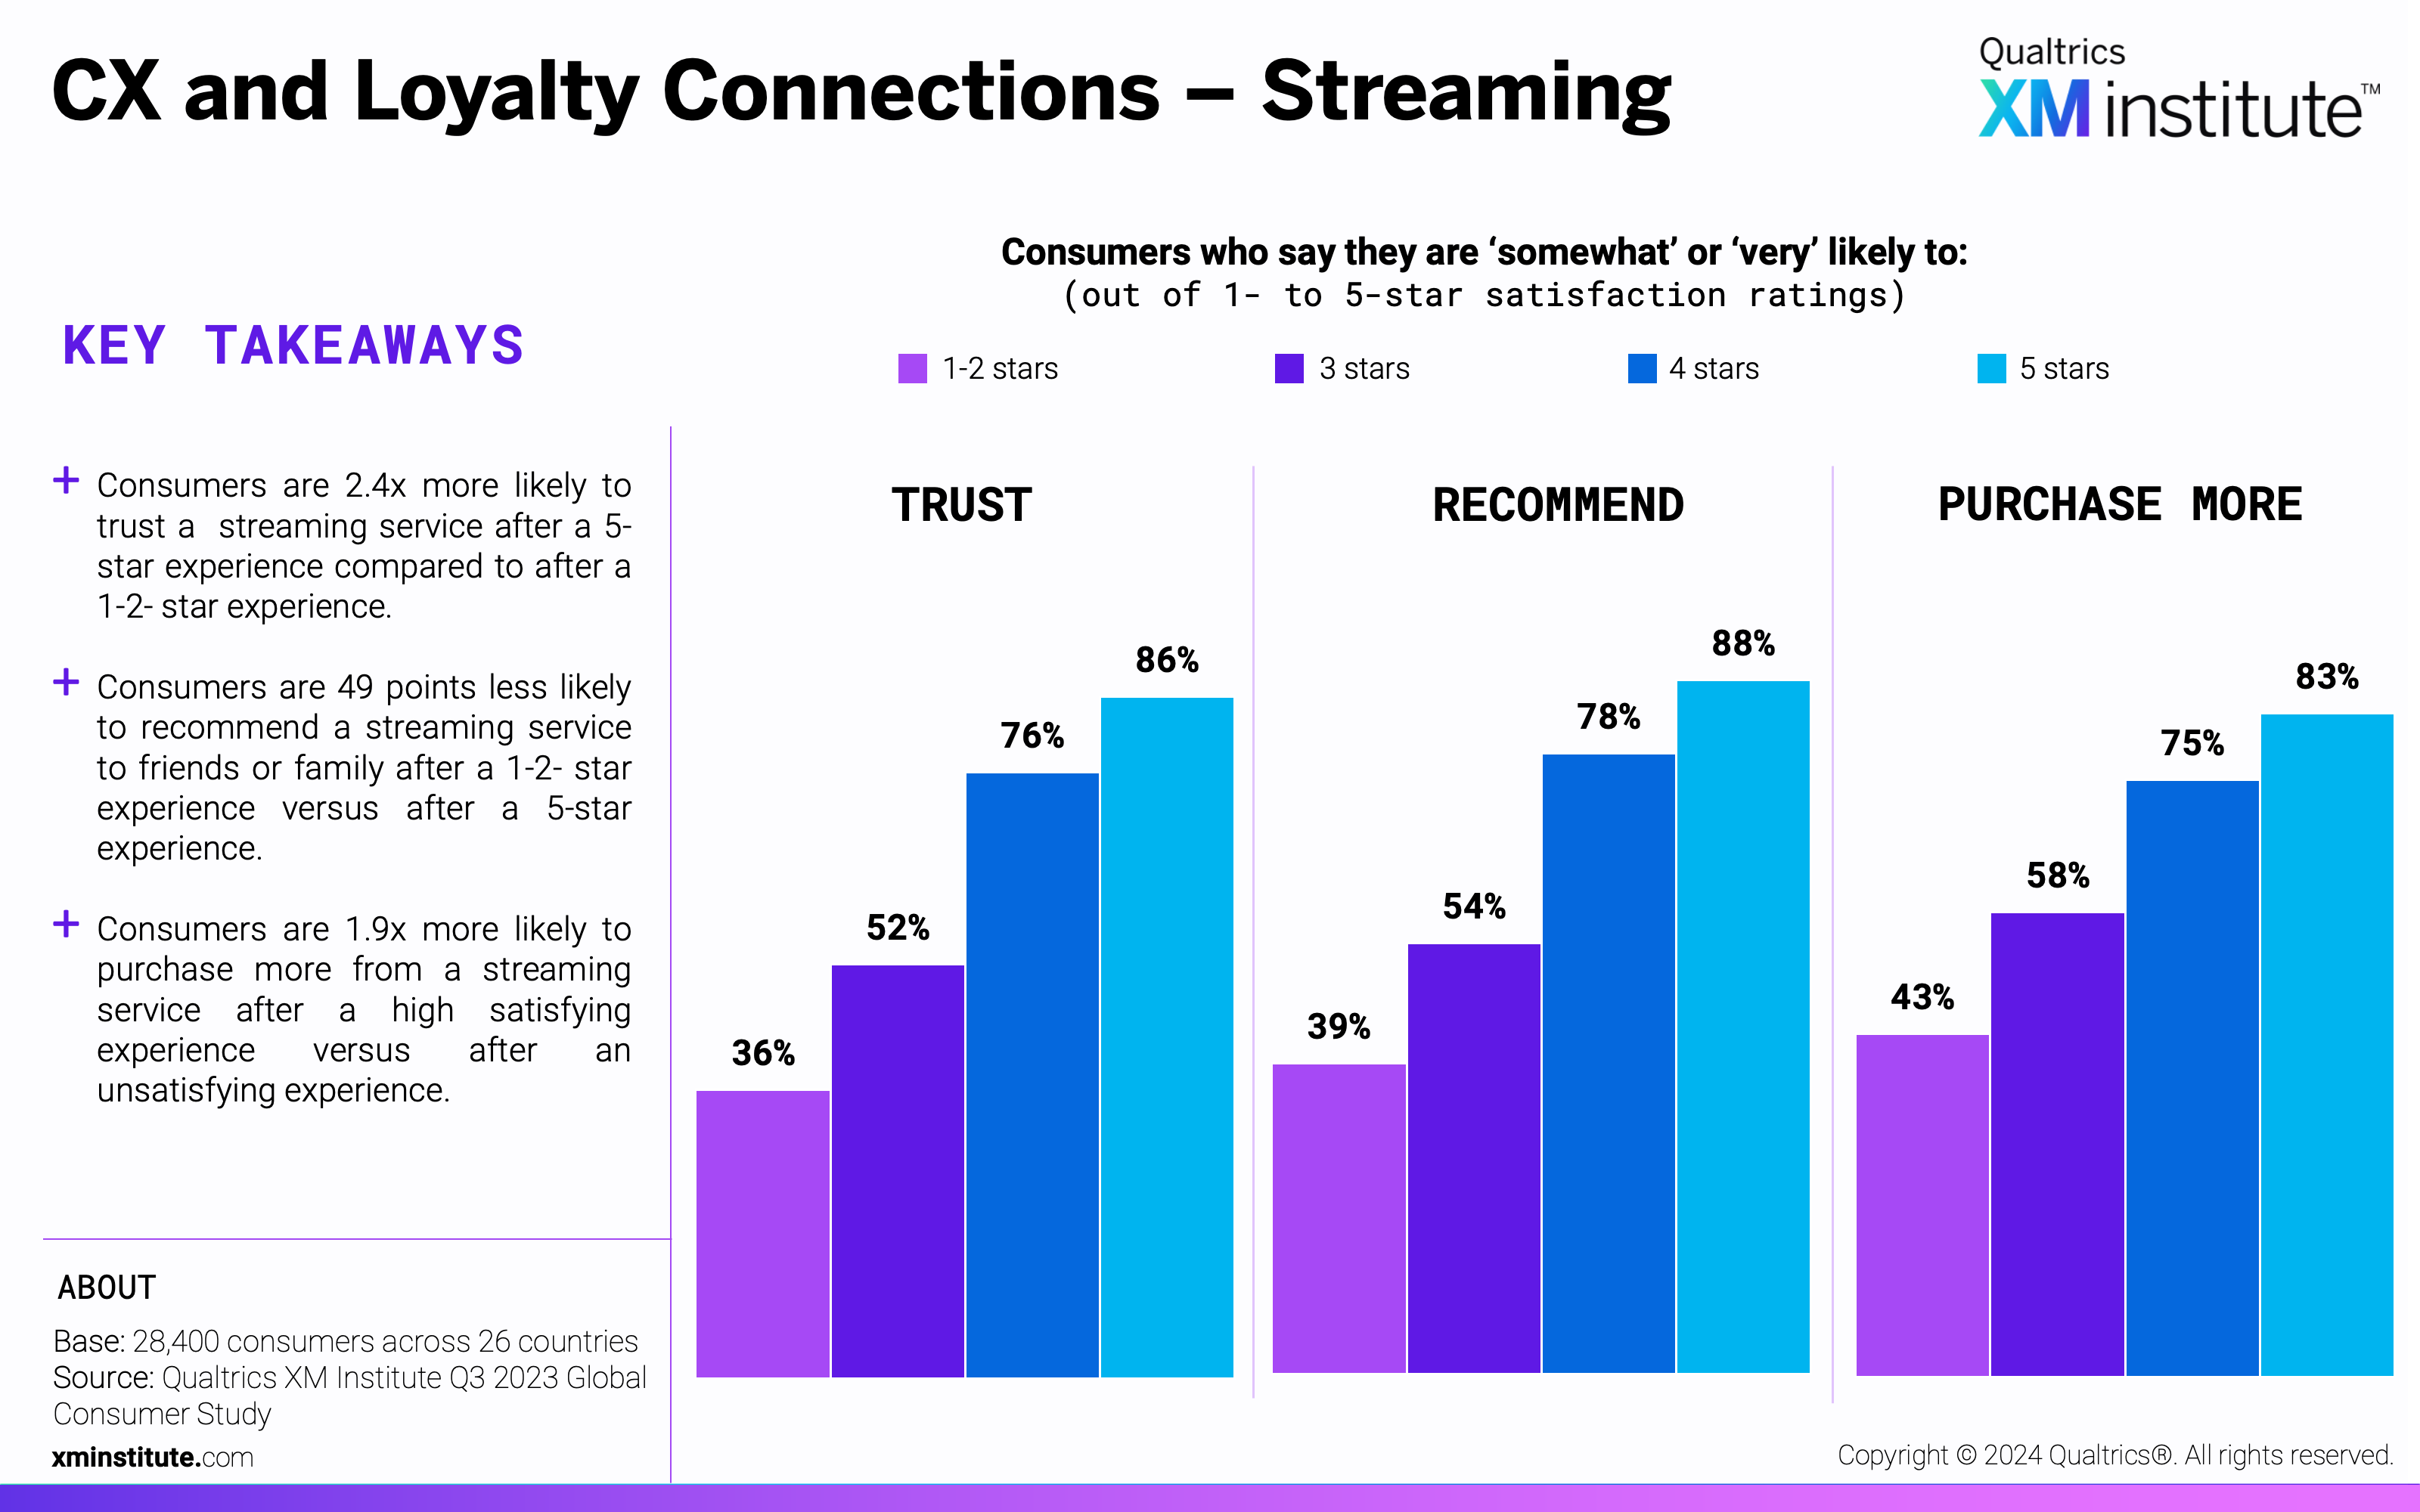
- CX and Loyalty Connections – Streaming (see Figure 26)
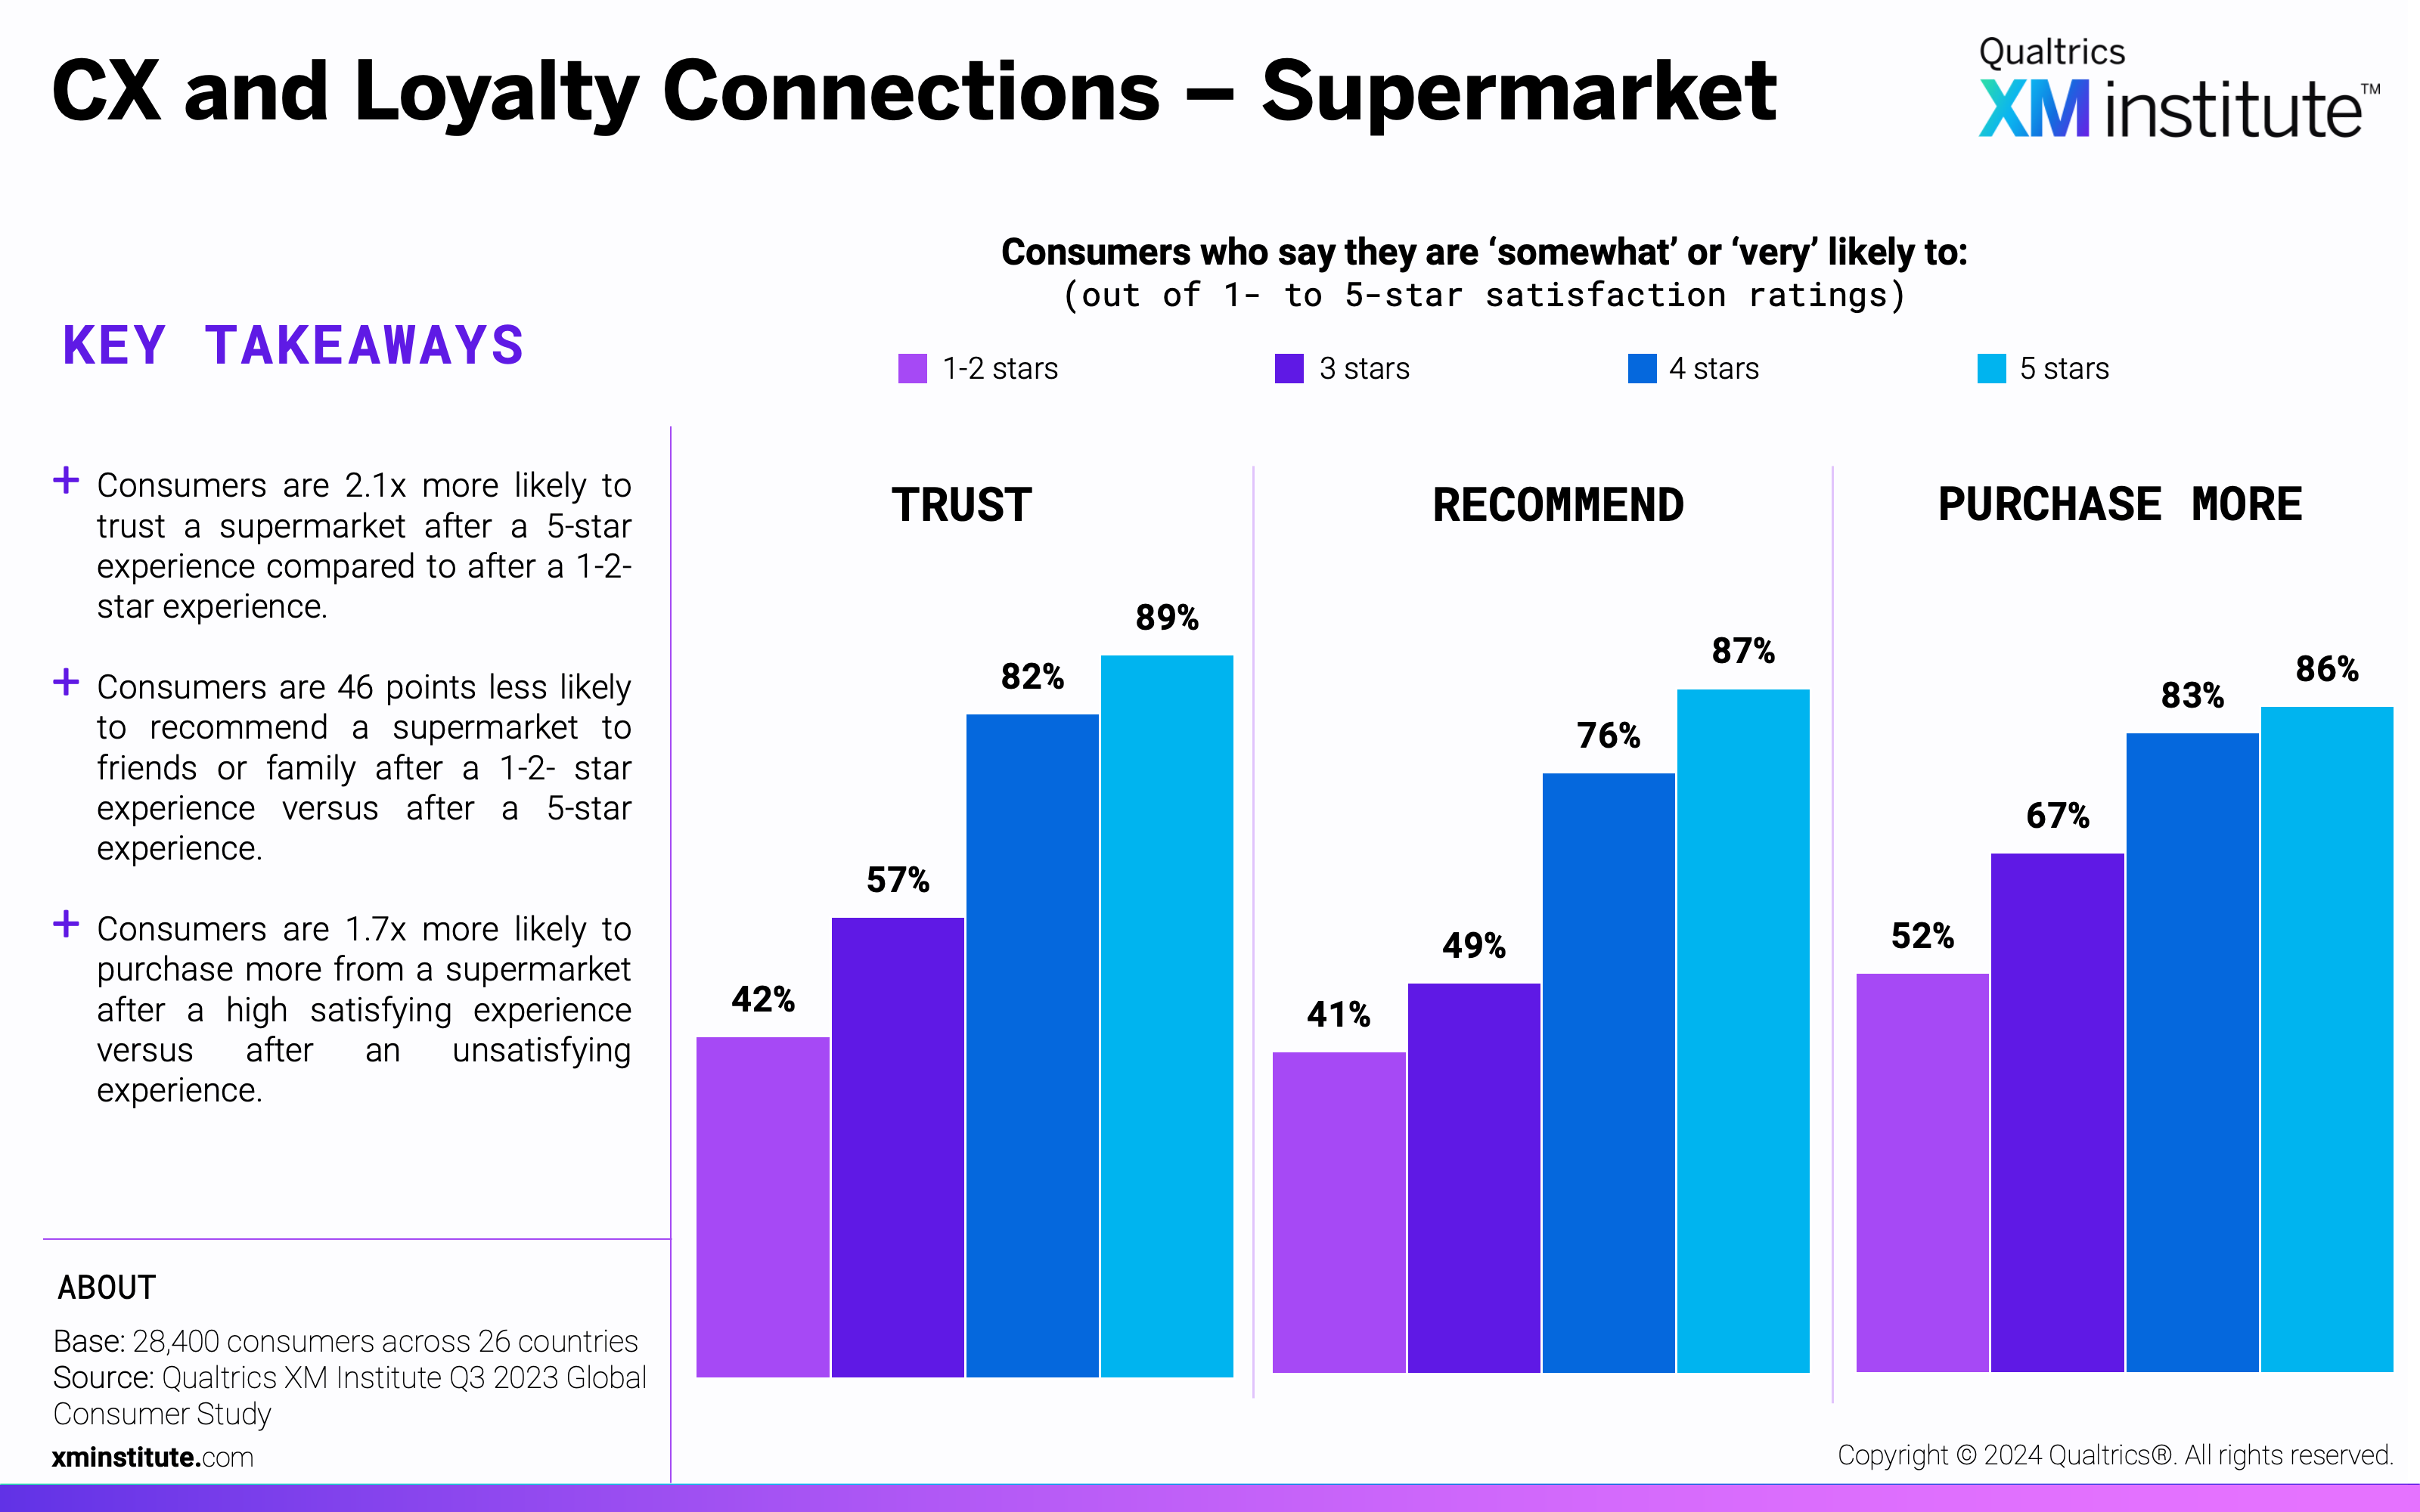
- CX and Loyalty Connections – Supermarket (see Figure 27)
- CX and Trust Connections by Country (see Figure 28)
- CX and Advocacy Connections by Country (see Figure 29)
- CX and Rebuying Connections by Country (see Figure 30)
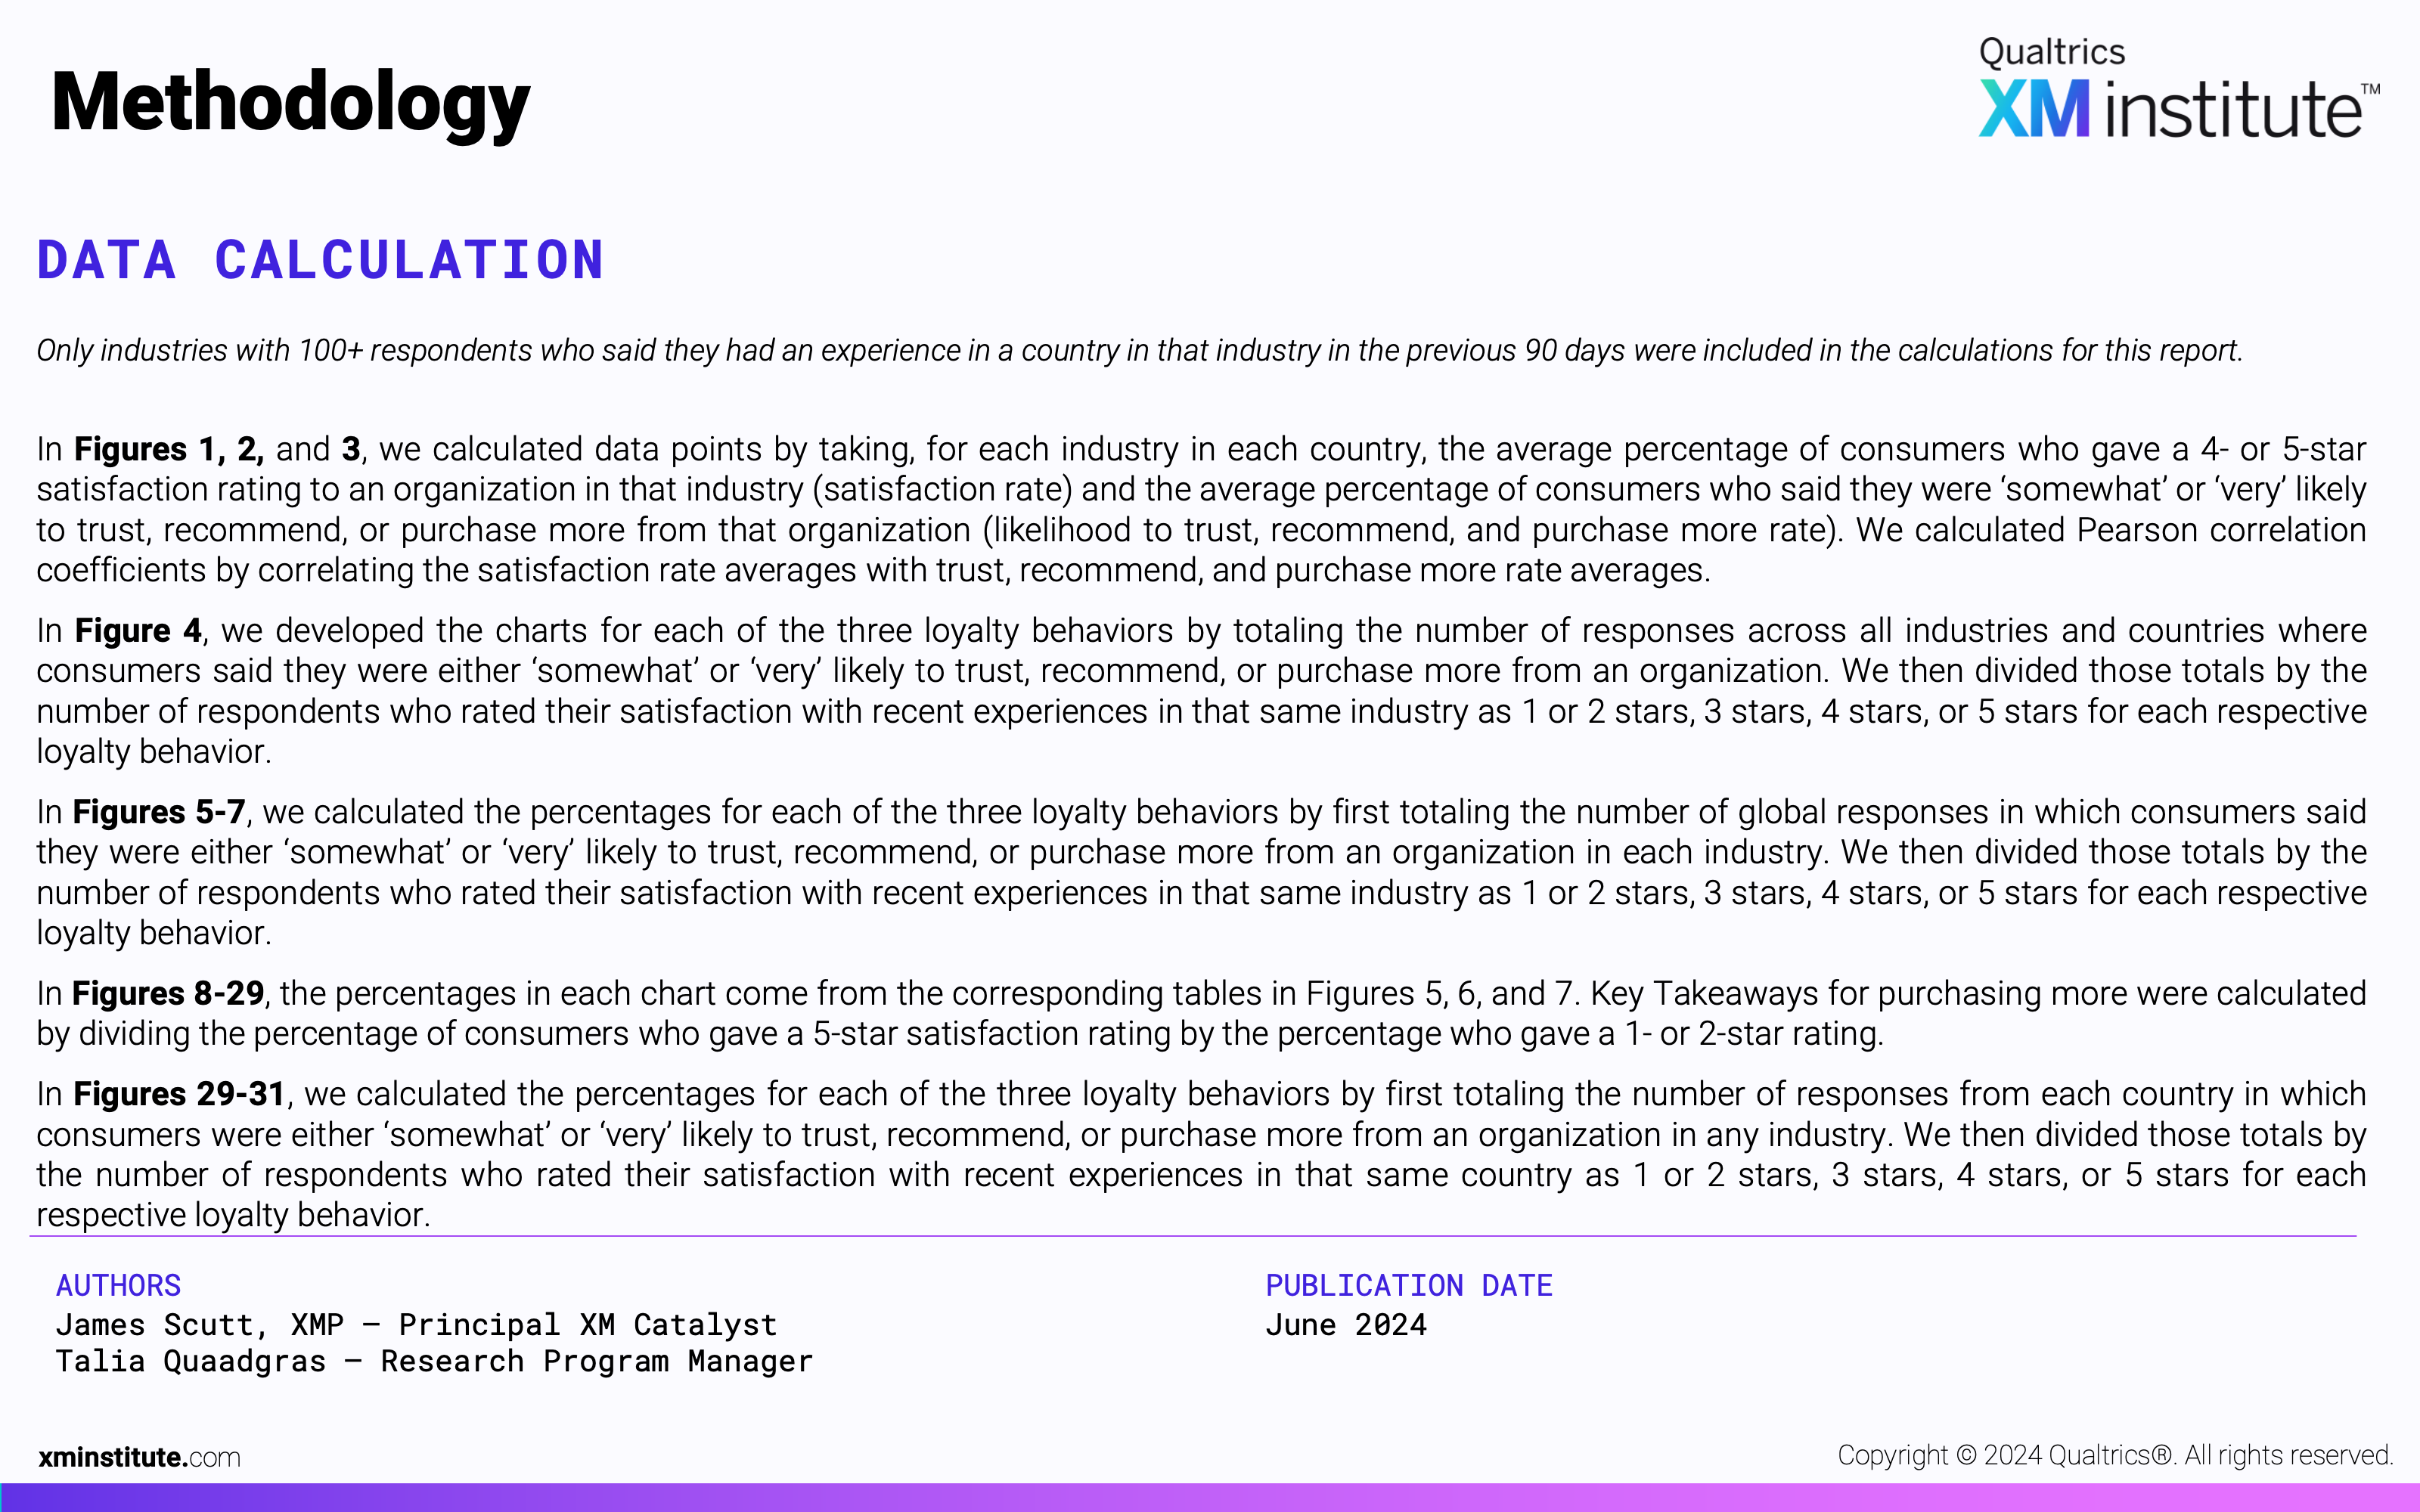
- Methodology (see Figure 31)