Key Findings
As part of Qualtrics XM Institute’s 2023 Global Consumer Study, we asked more than 28,000 consumers from 26 countries to evaluate their recent experiences with companies across 20 industries. Participants rated their satisfaction with these interactions on a scale of 1-5 stars and then told us how likely they are to trust, recommend, and purchase more from the company following that experience. To understand year-over-year changes in customer sentiment, we compared these results to our findings in the 2022 Global Consumer Study. We found that:
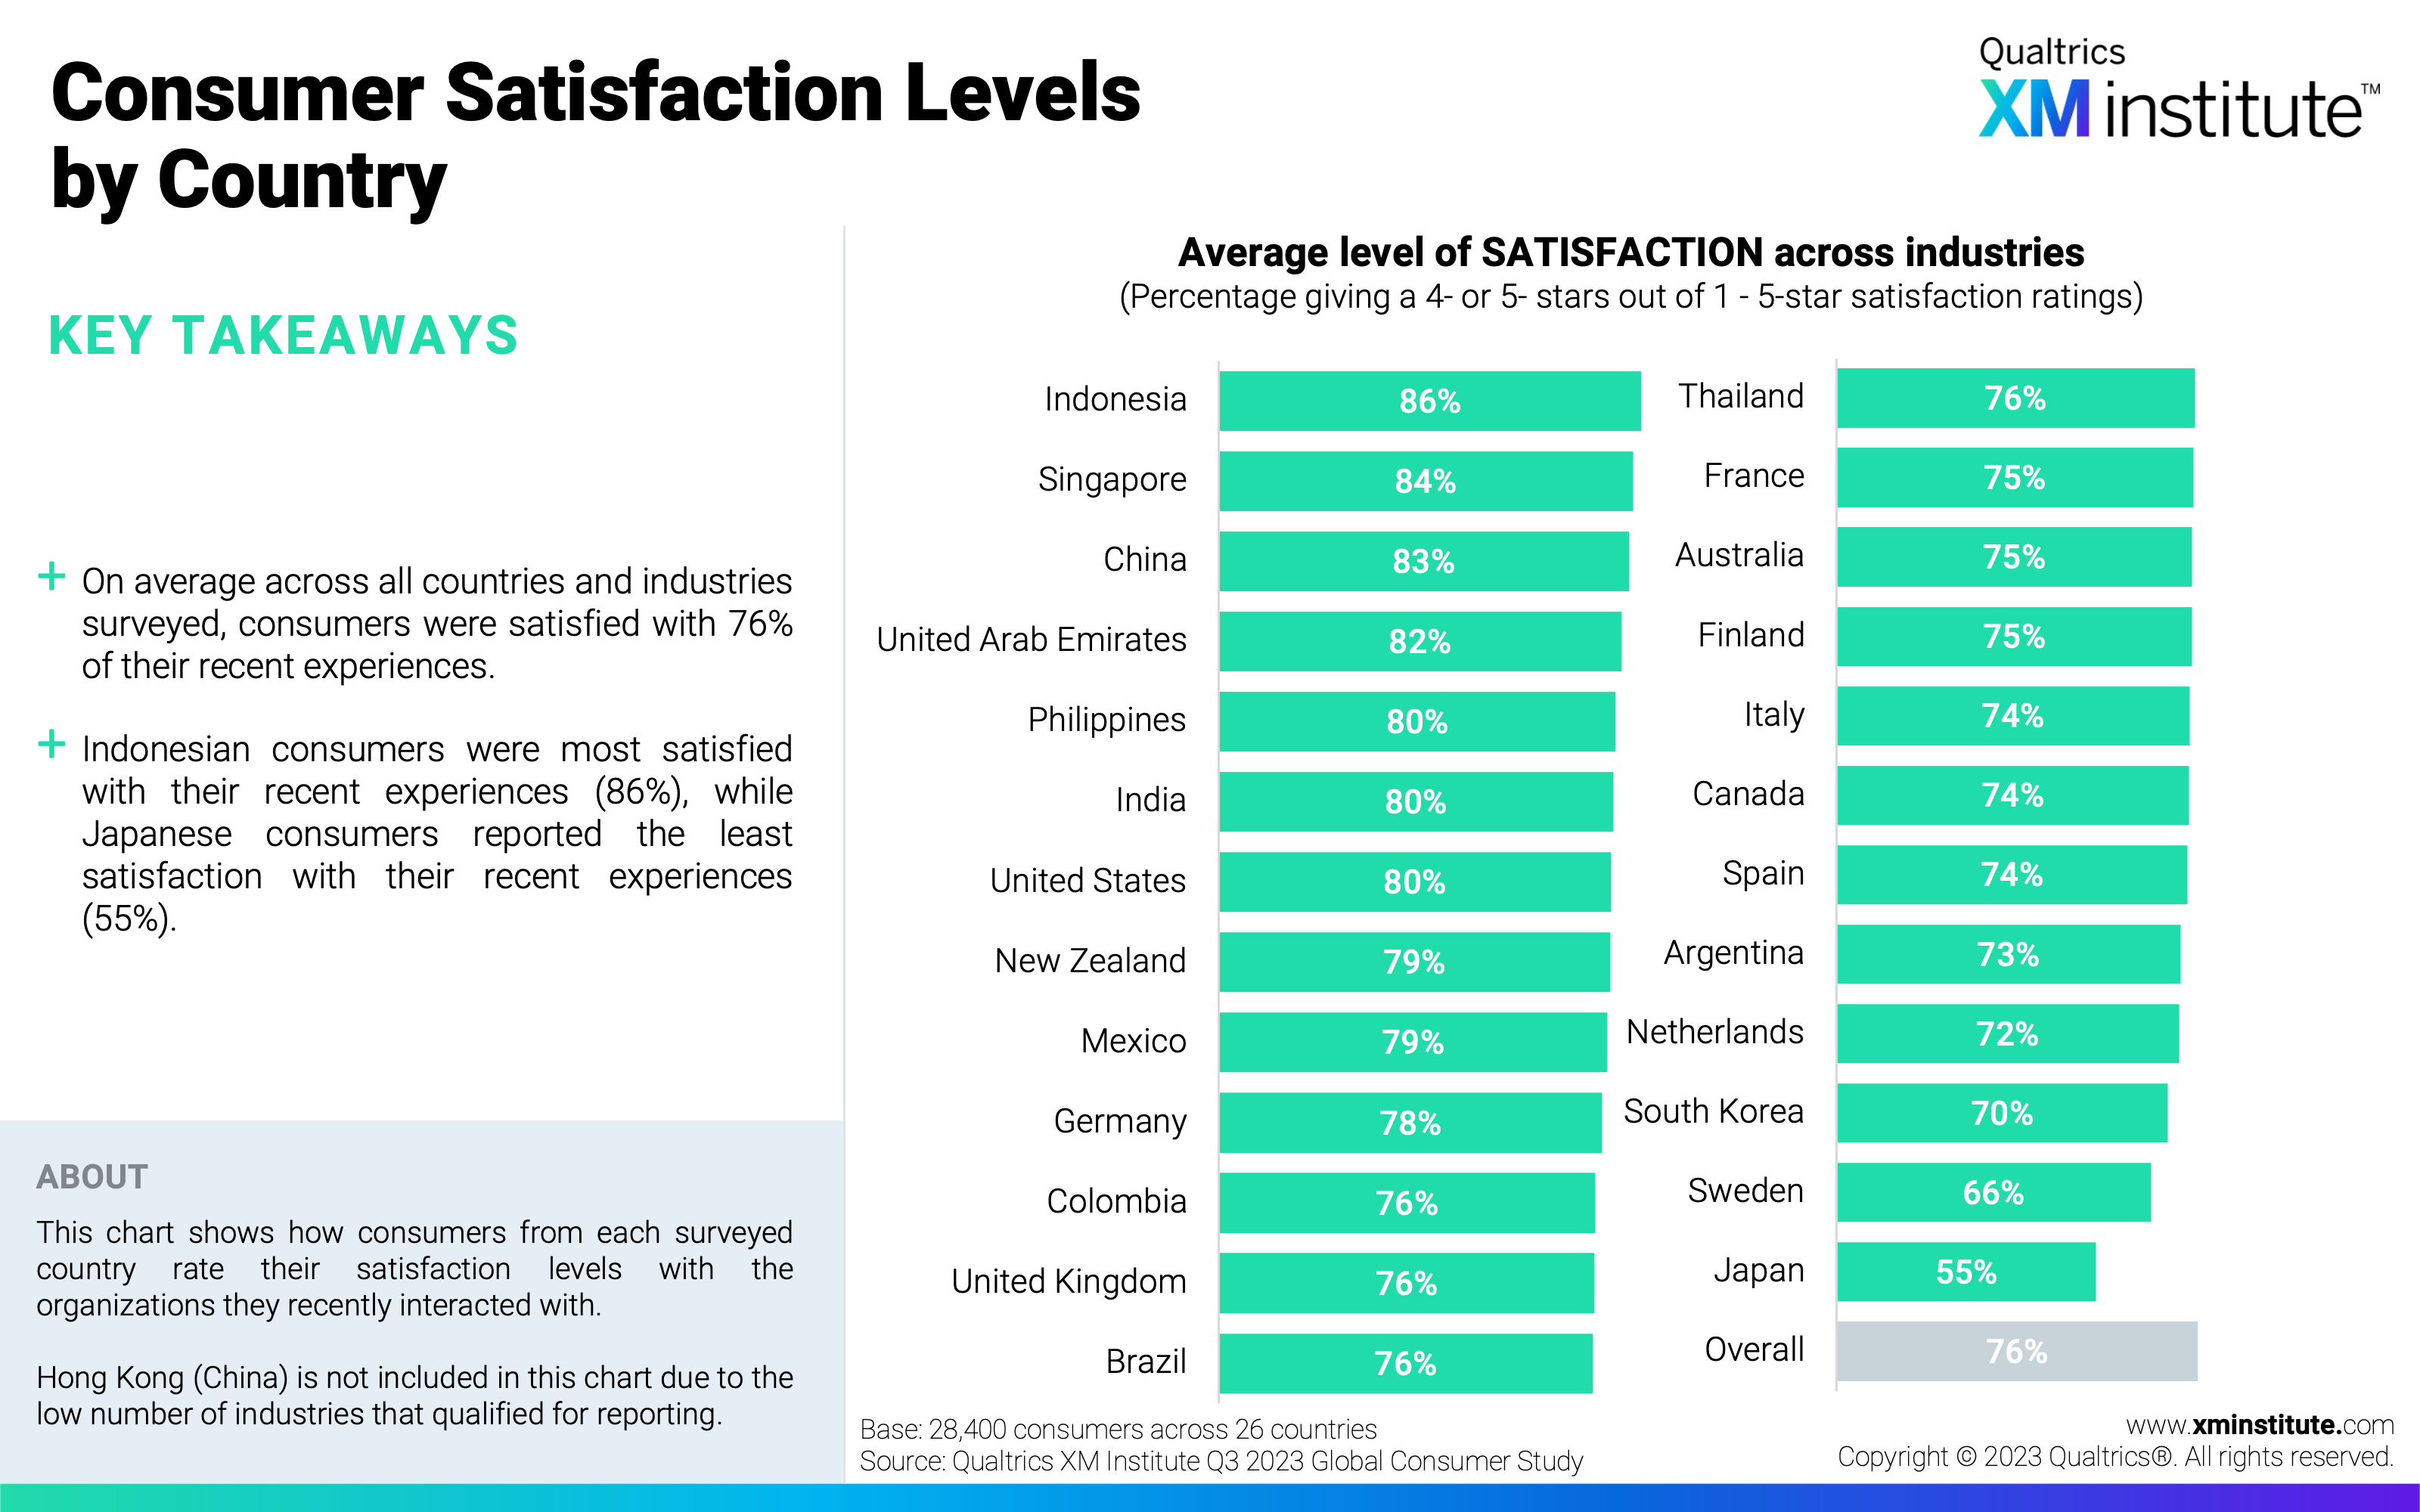
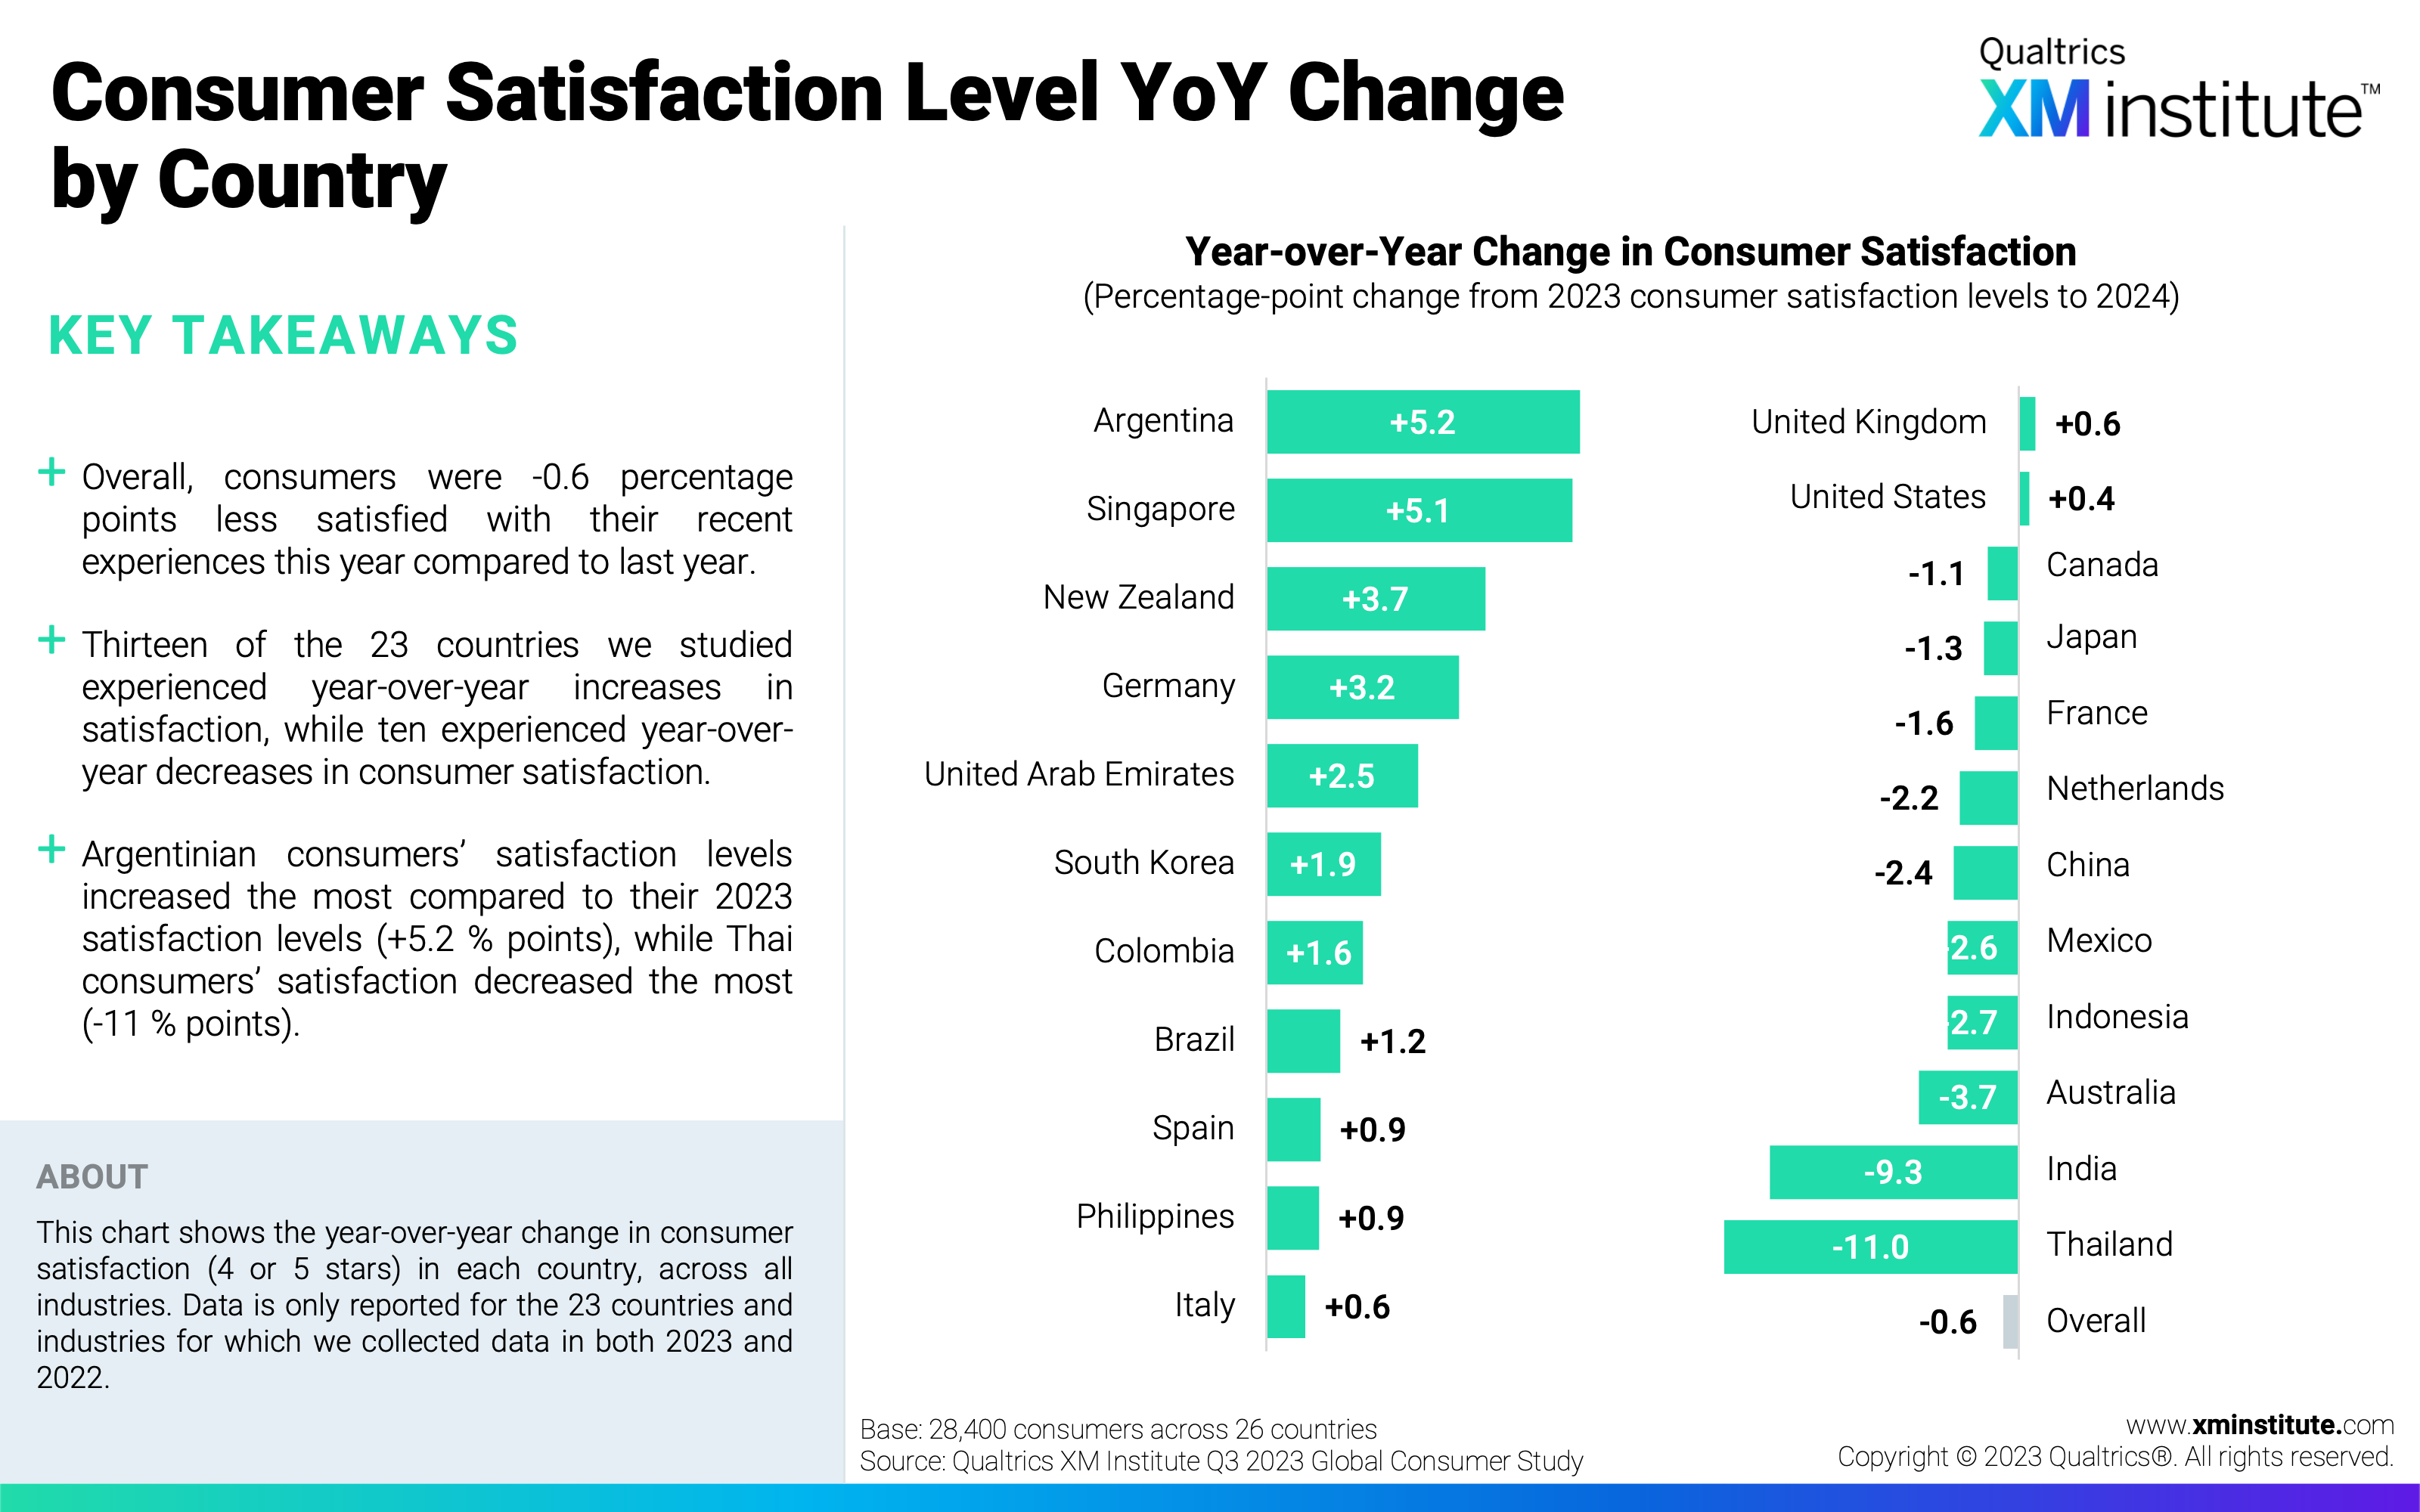
- Consumer satisfaction decreased – slightly. On average, global consumer satisfaction decreased by 0.6 percentage points since last year. Argentinian and Singaporean consumer satisfaction rates increased the most, improving by 5.2 and 5.1 percentage points, respectively. Meanwhile, Thai consumer satisfaction dropped 11 percentage points on average, the most dramatic decrease of any country. India had the highest consumer satisfaction in 2022, but it fell by 9.3 percentage points in the past year, knocking it out of the top spot.
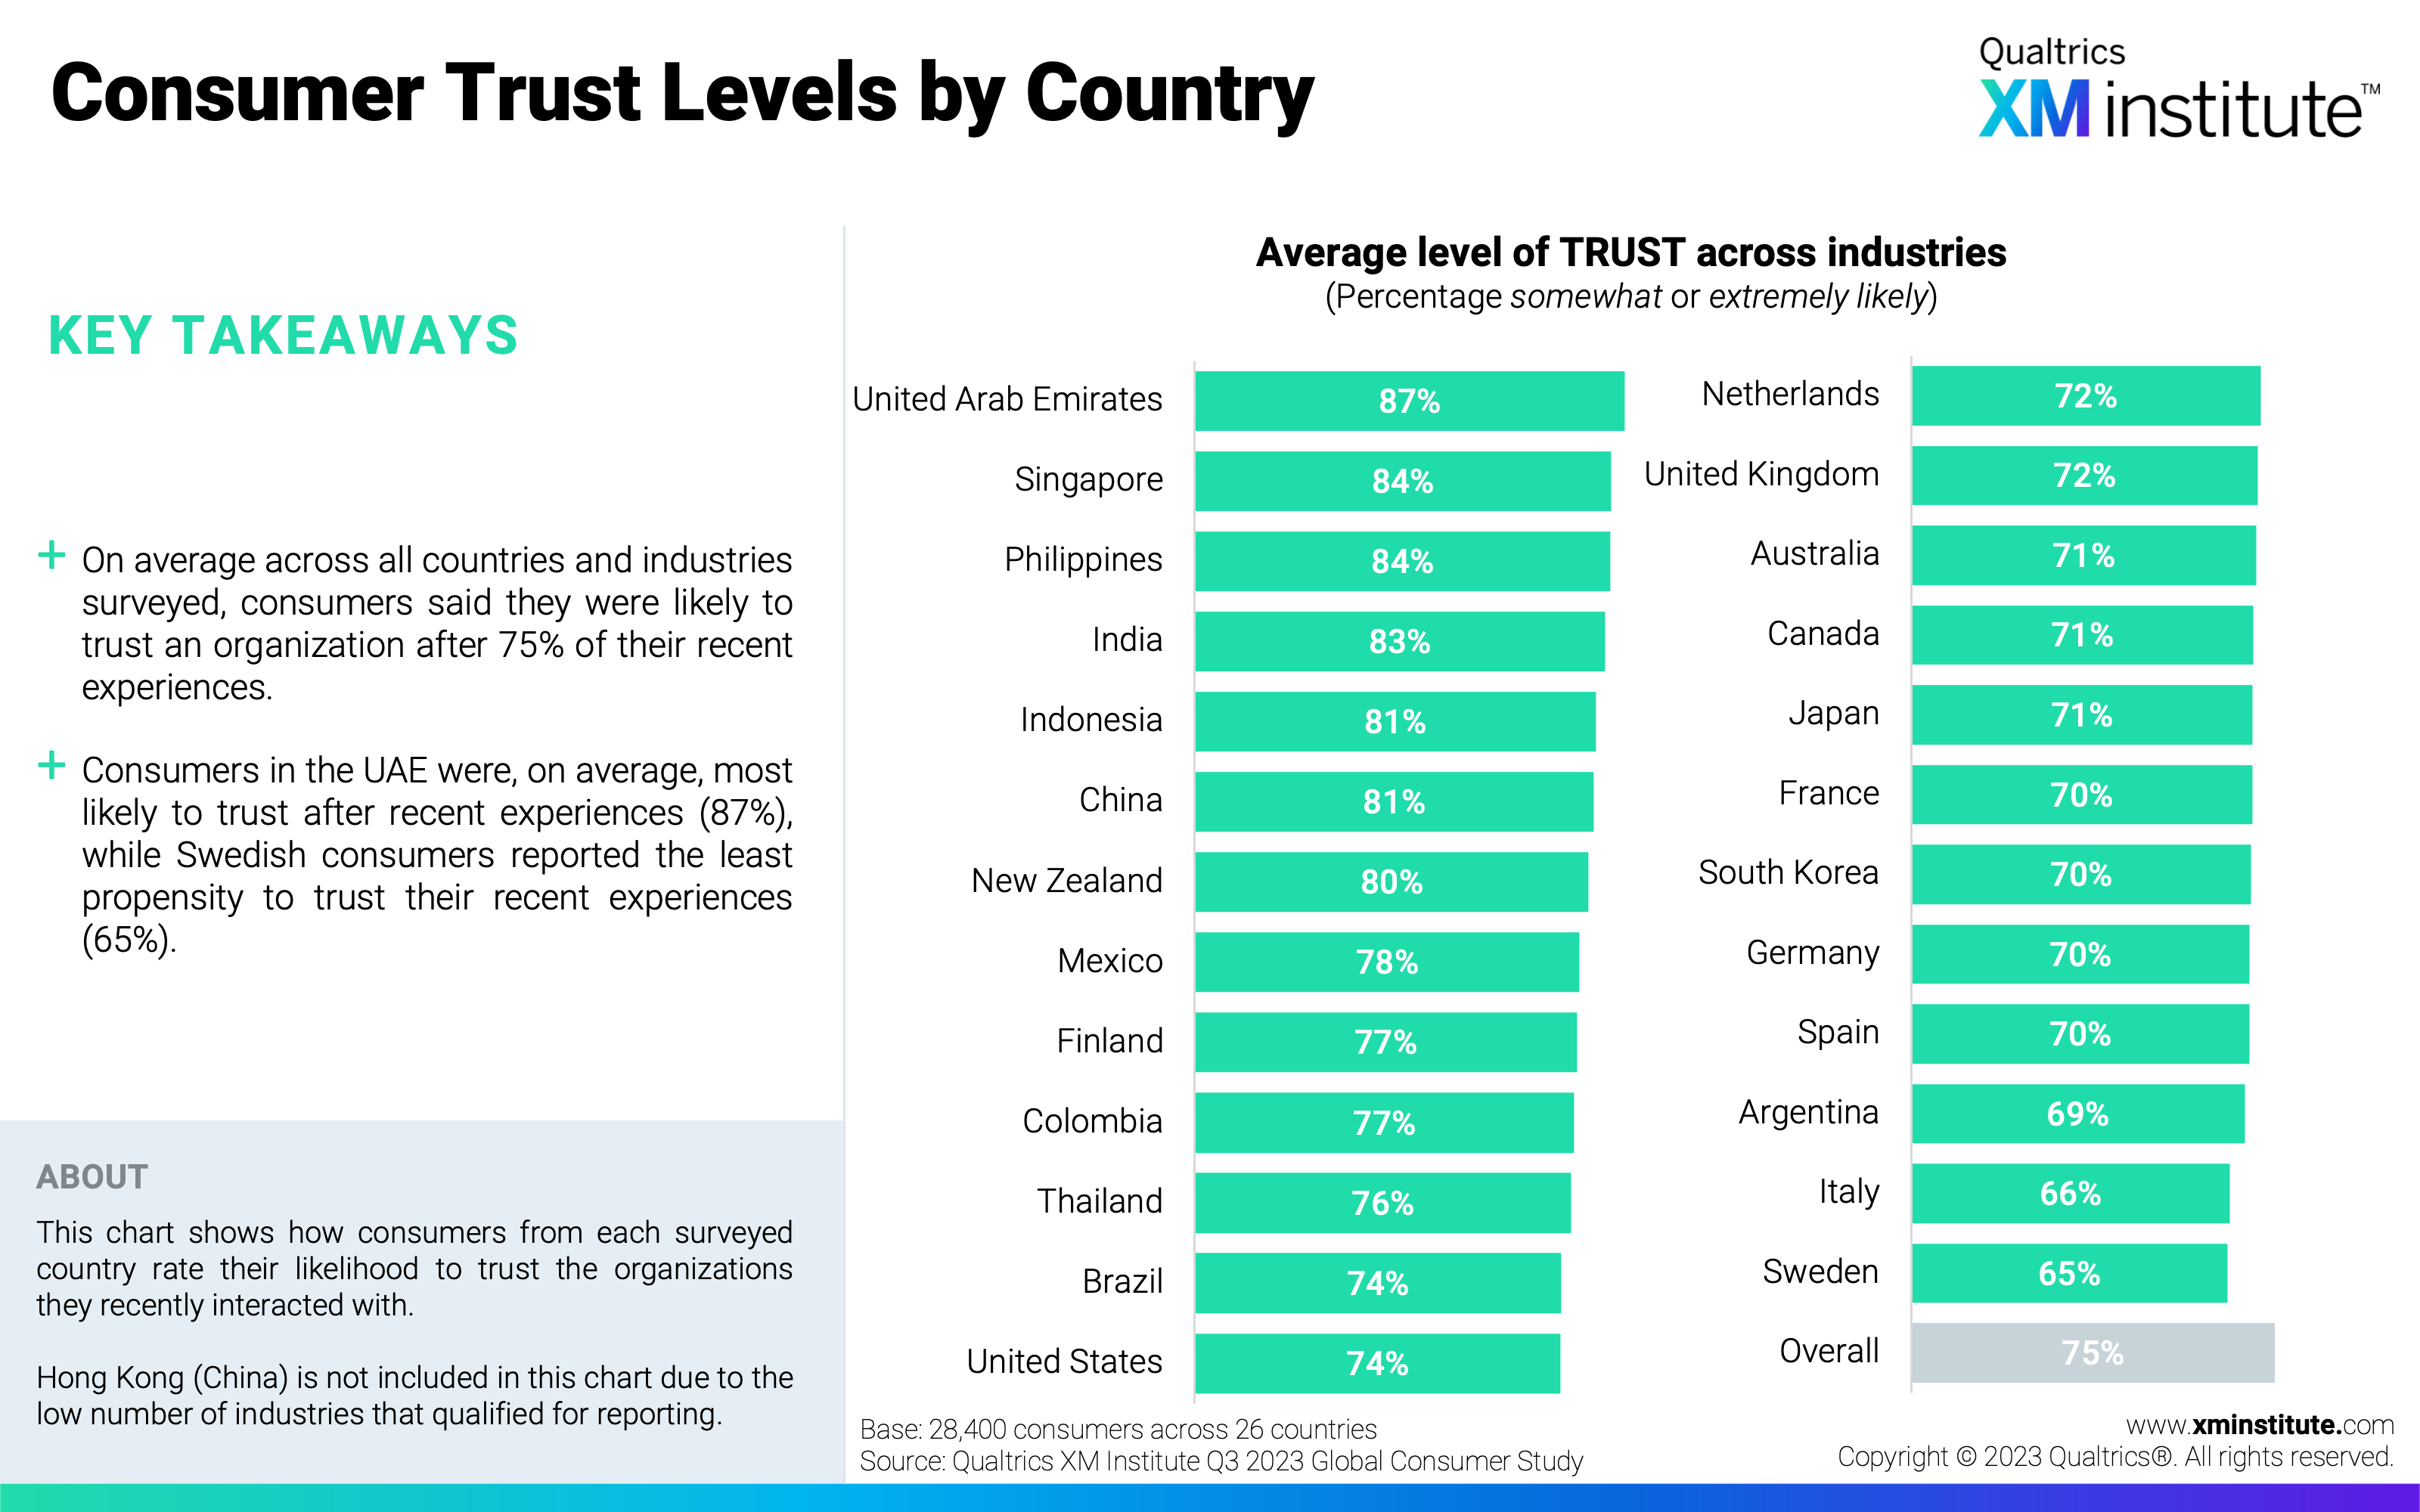
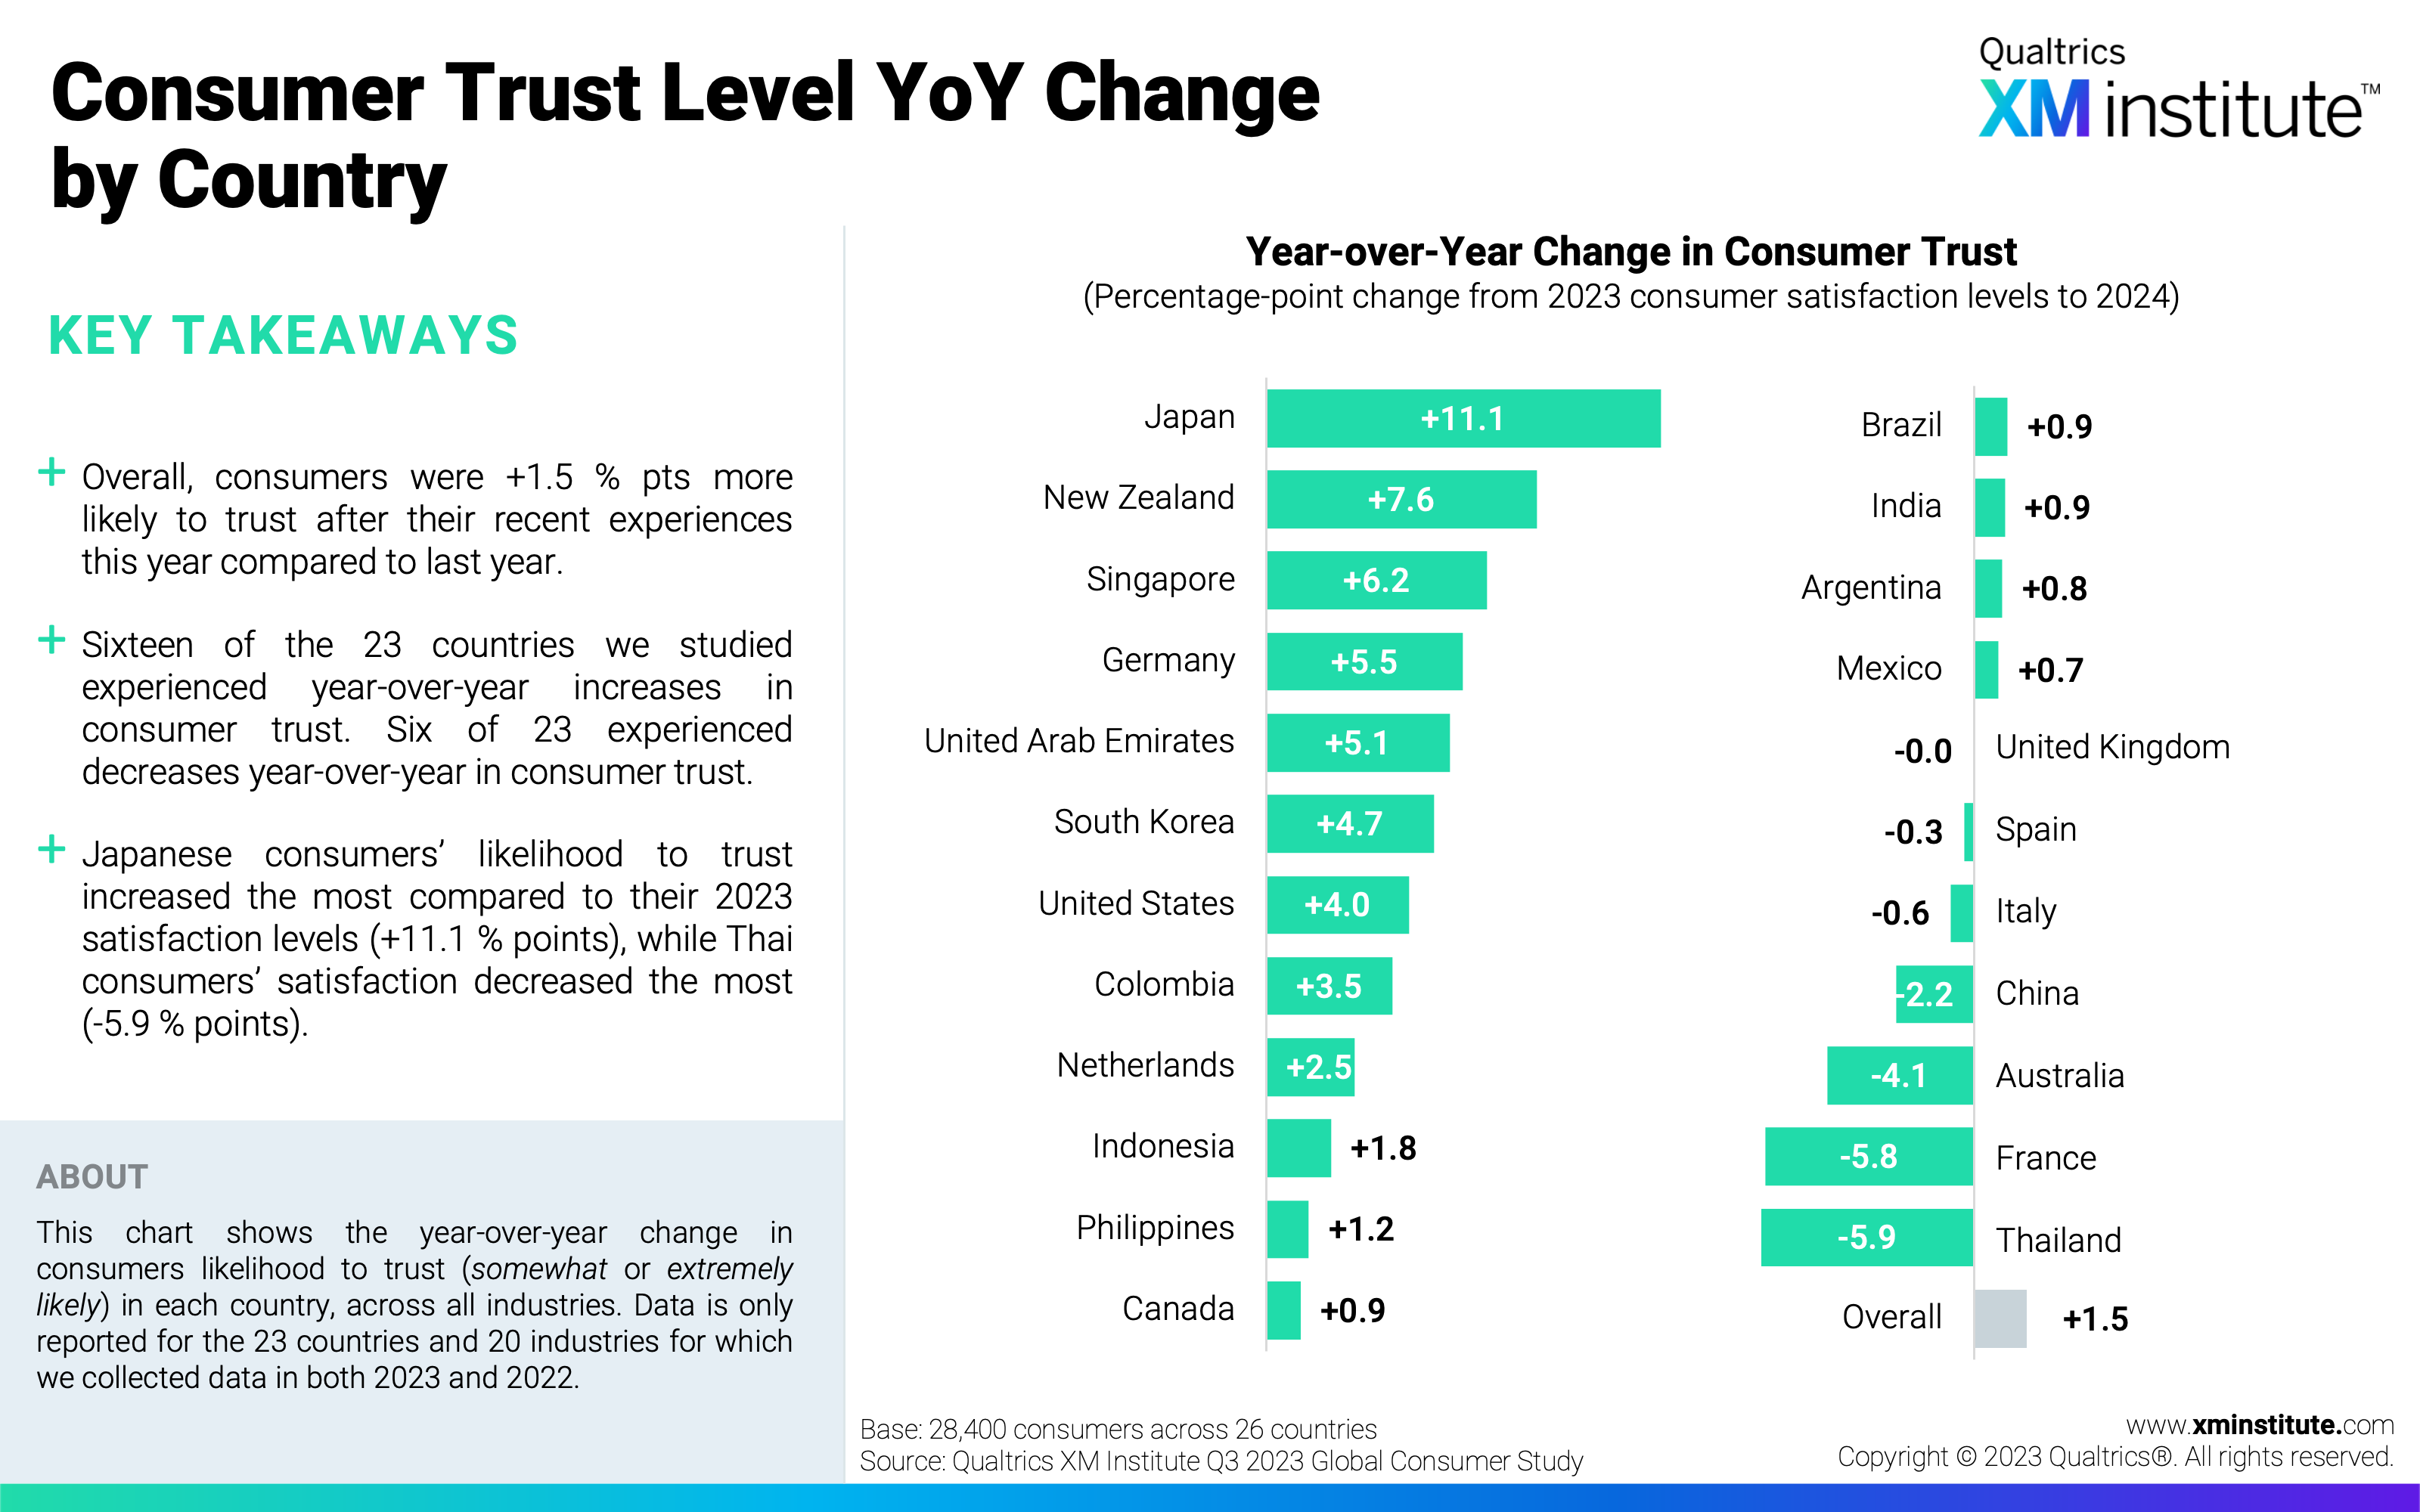
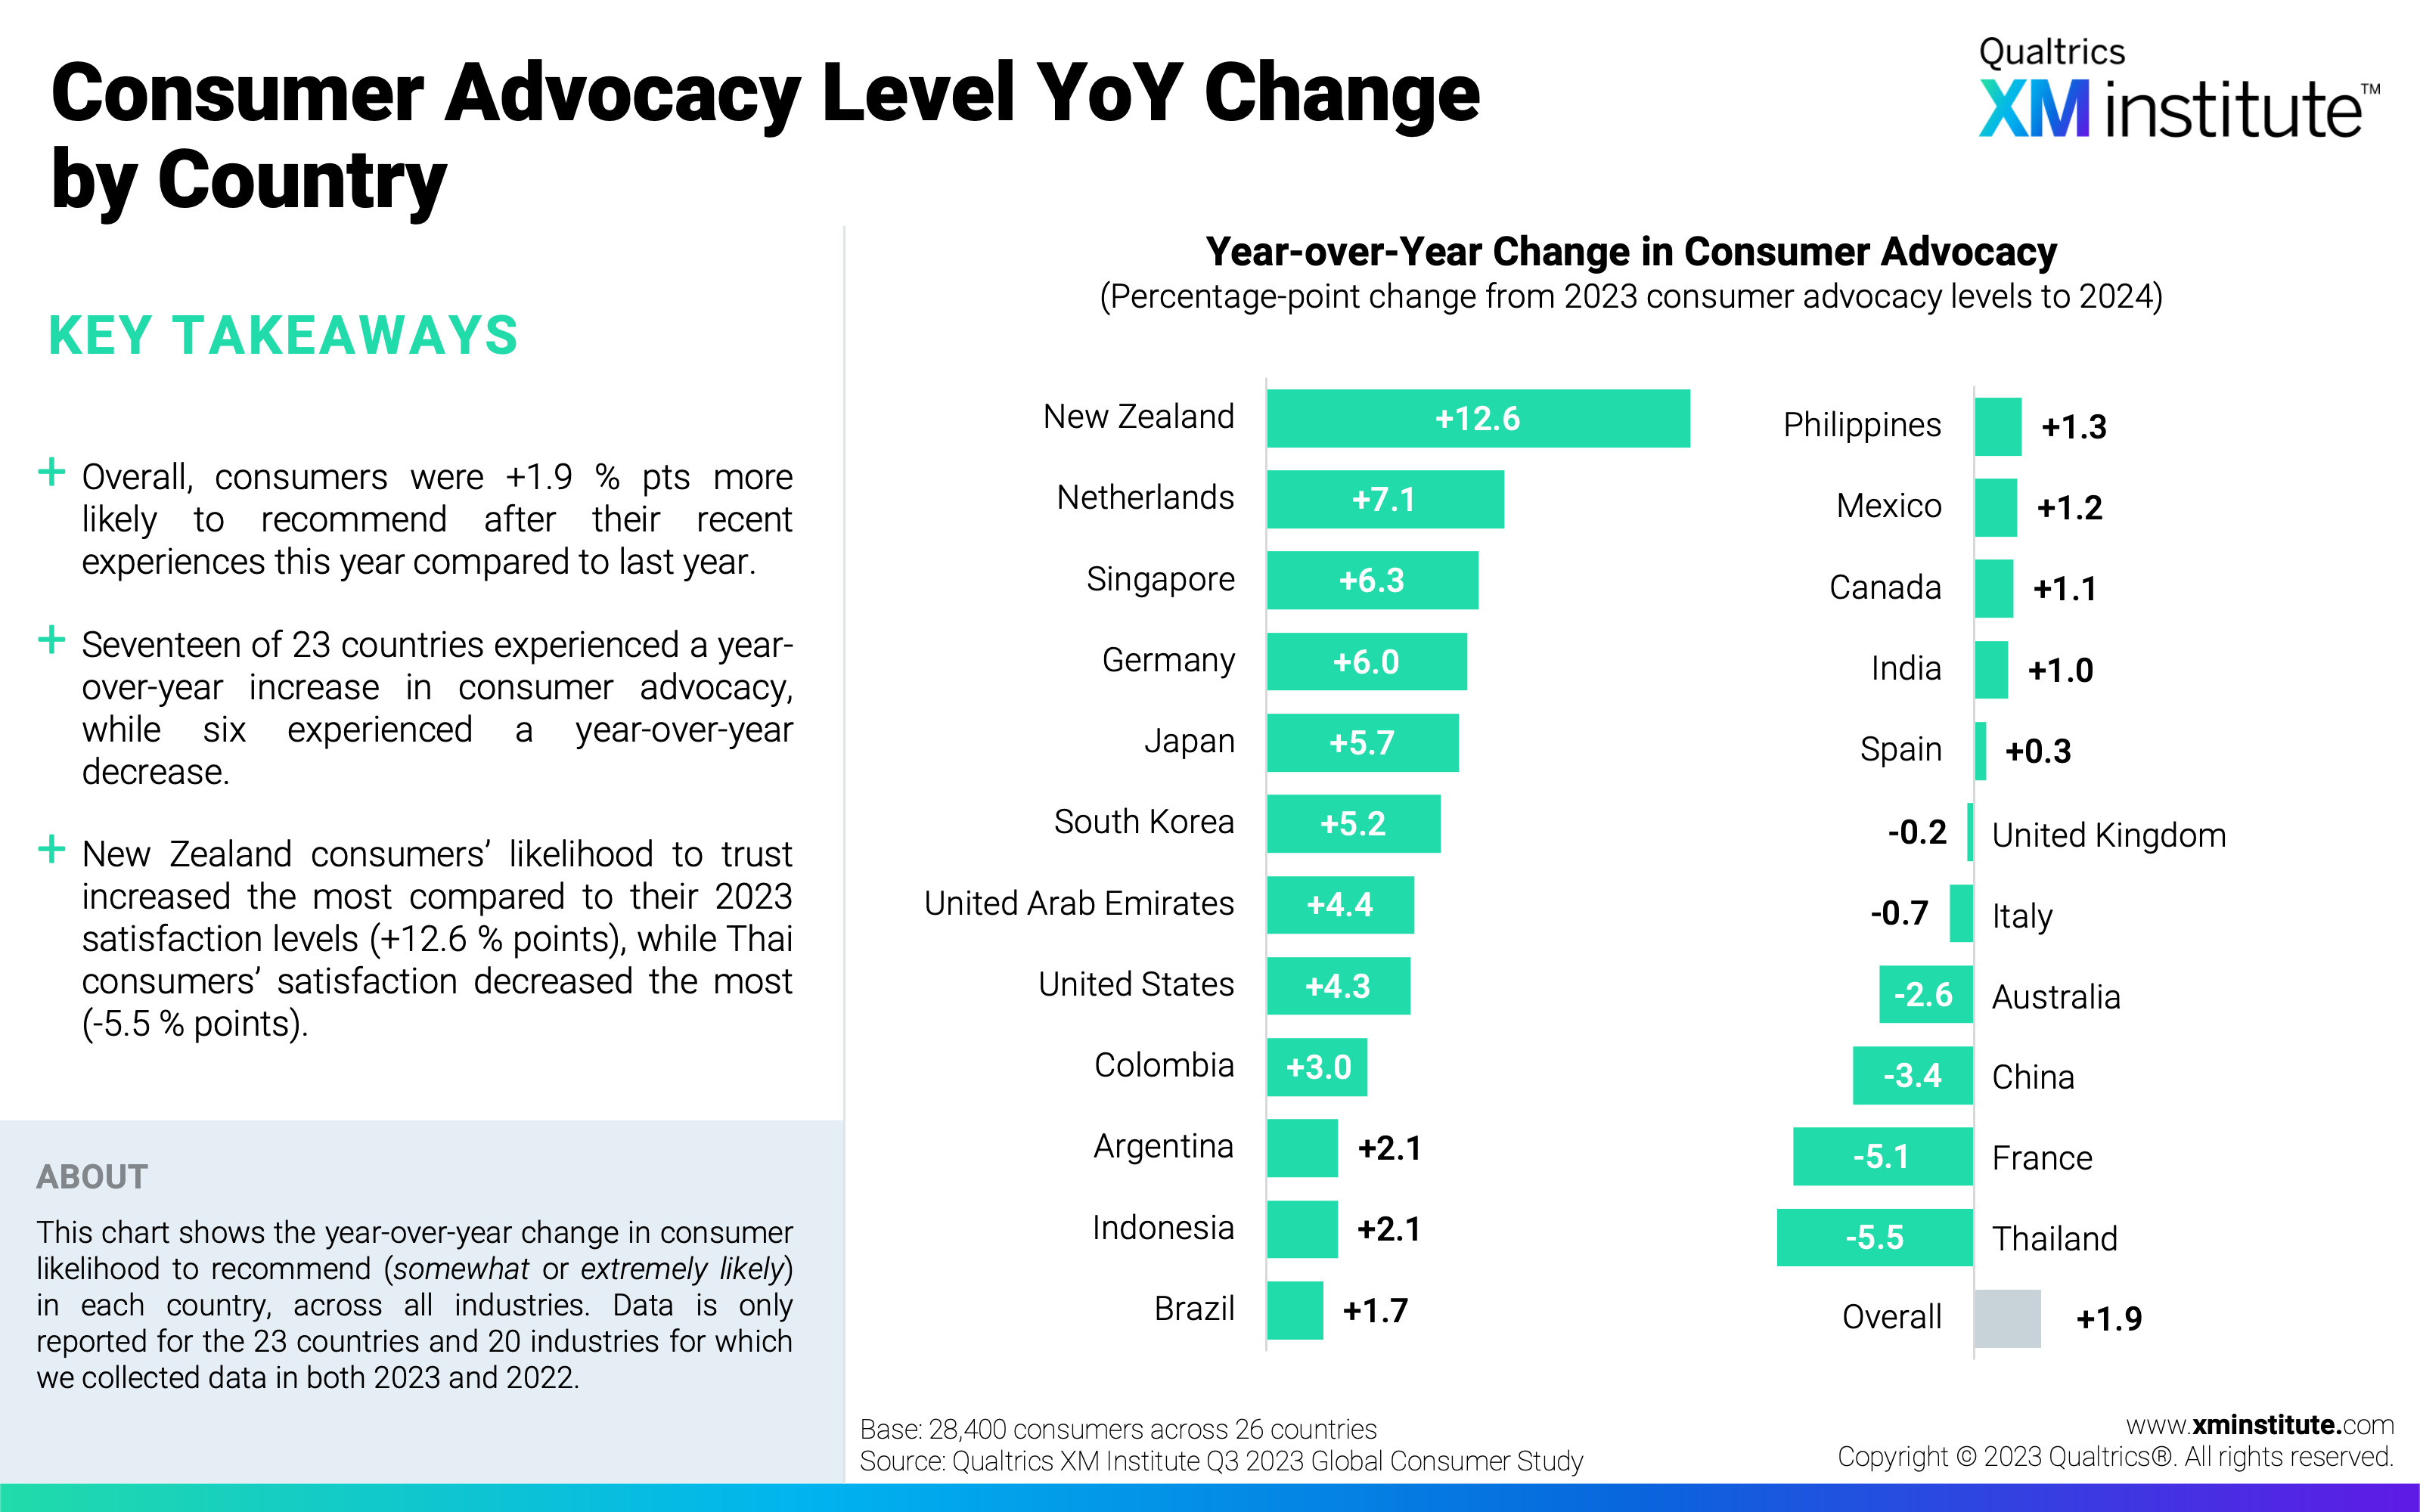
- Global consumer loyalty remains strong. Compared to last year, consumers overall are slightly more likely to both trust (+1.5 percentage points) and recommend organizations across industries to their friends and family (+1.9 percentage points). Loyalty increased the most among consumers in New Zealand, while industries in Thailand experienced a 5+ percentage-point decrease in consumer trust and advocacy.
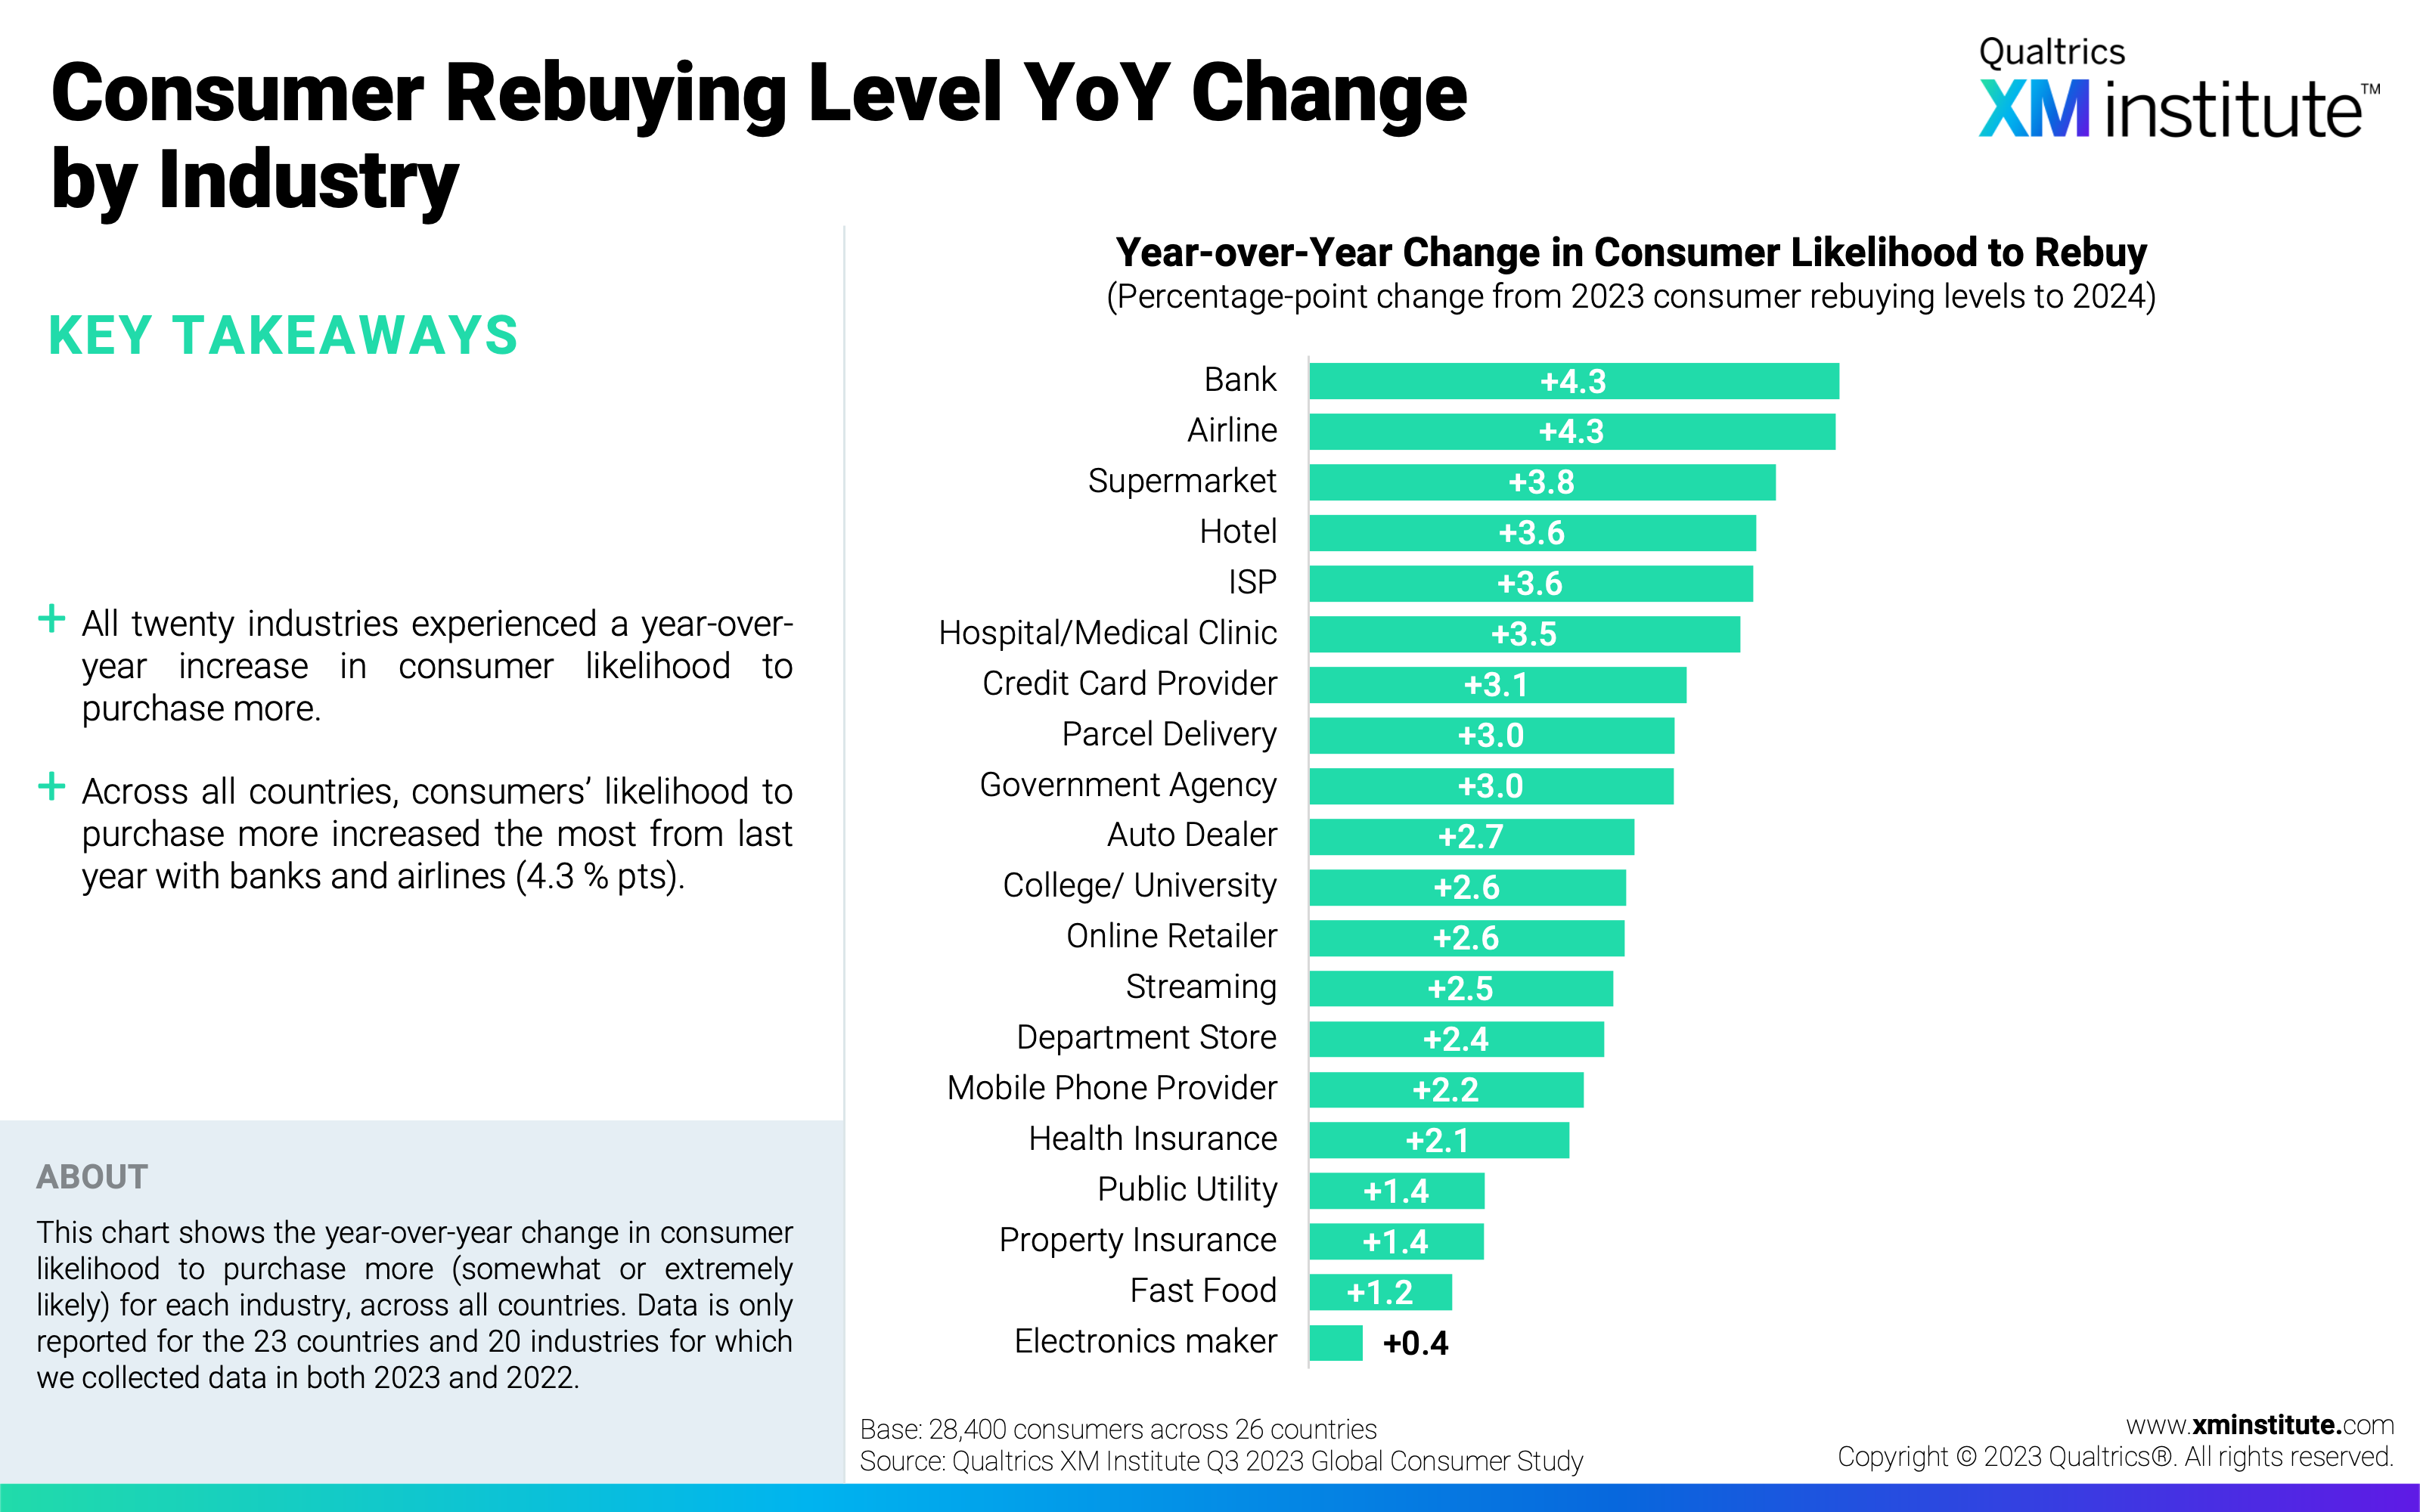
- Likelihood to repurchase increased for all industries. On average across all countries, consumers’ likelihood to purchase more from an organization increased for all 20 industries included in this study. This loyalty metric improved the most for banks, going up 4.3 percentage points on average, and the least for electronics makers, who only saw a bump of 0.4 percentage points.
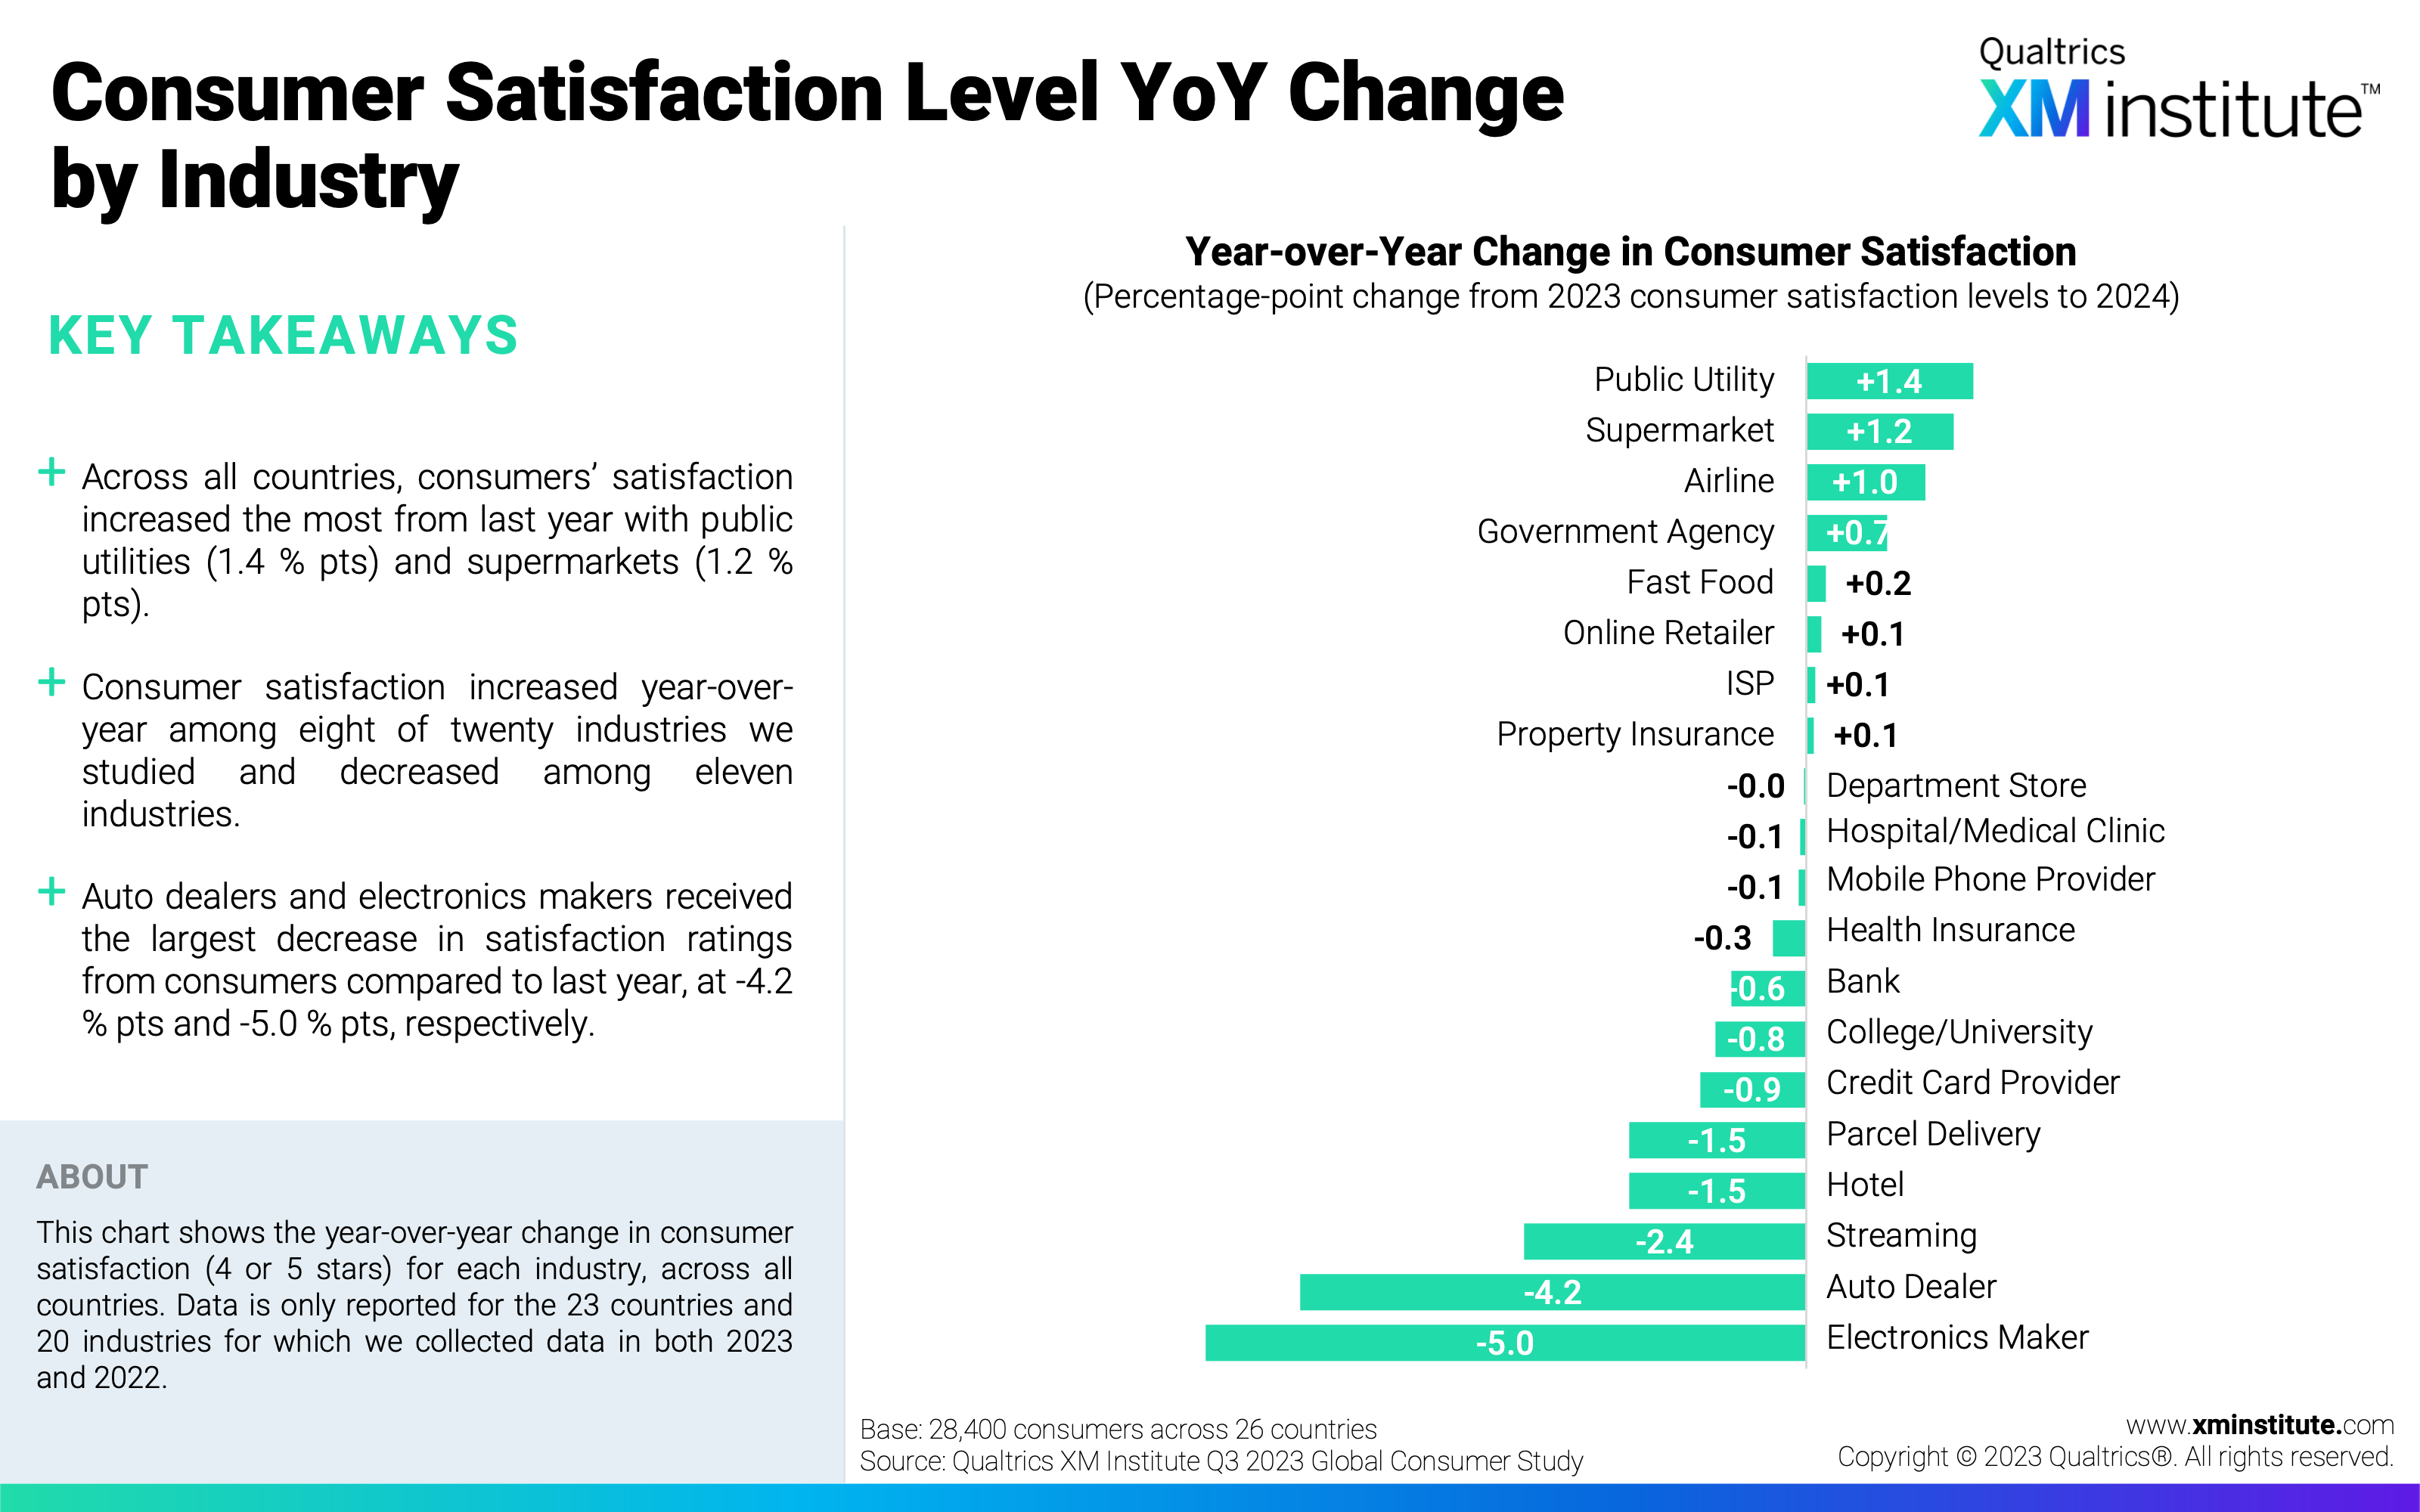
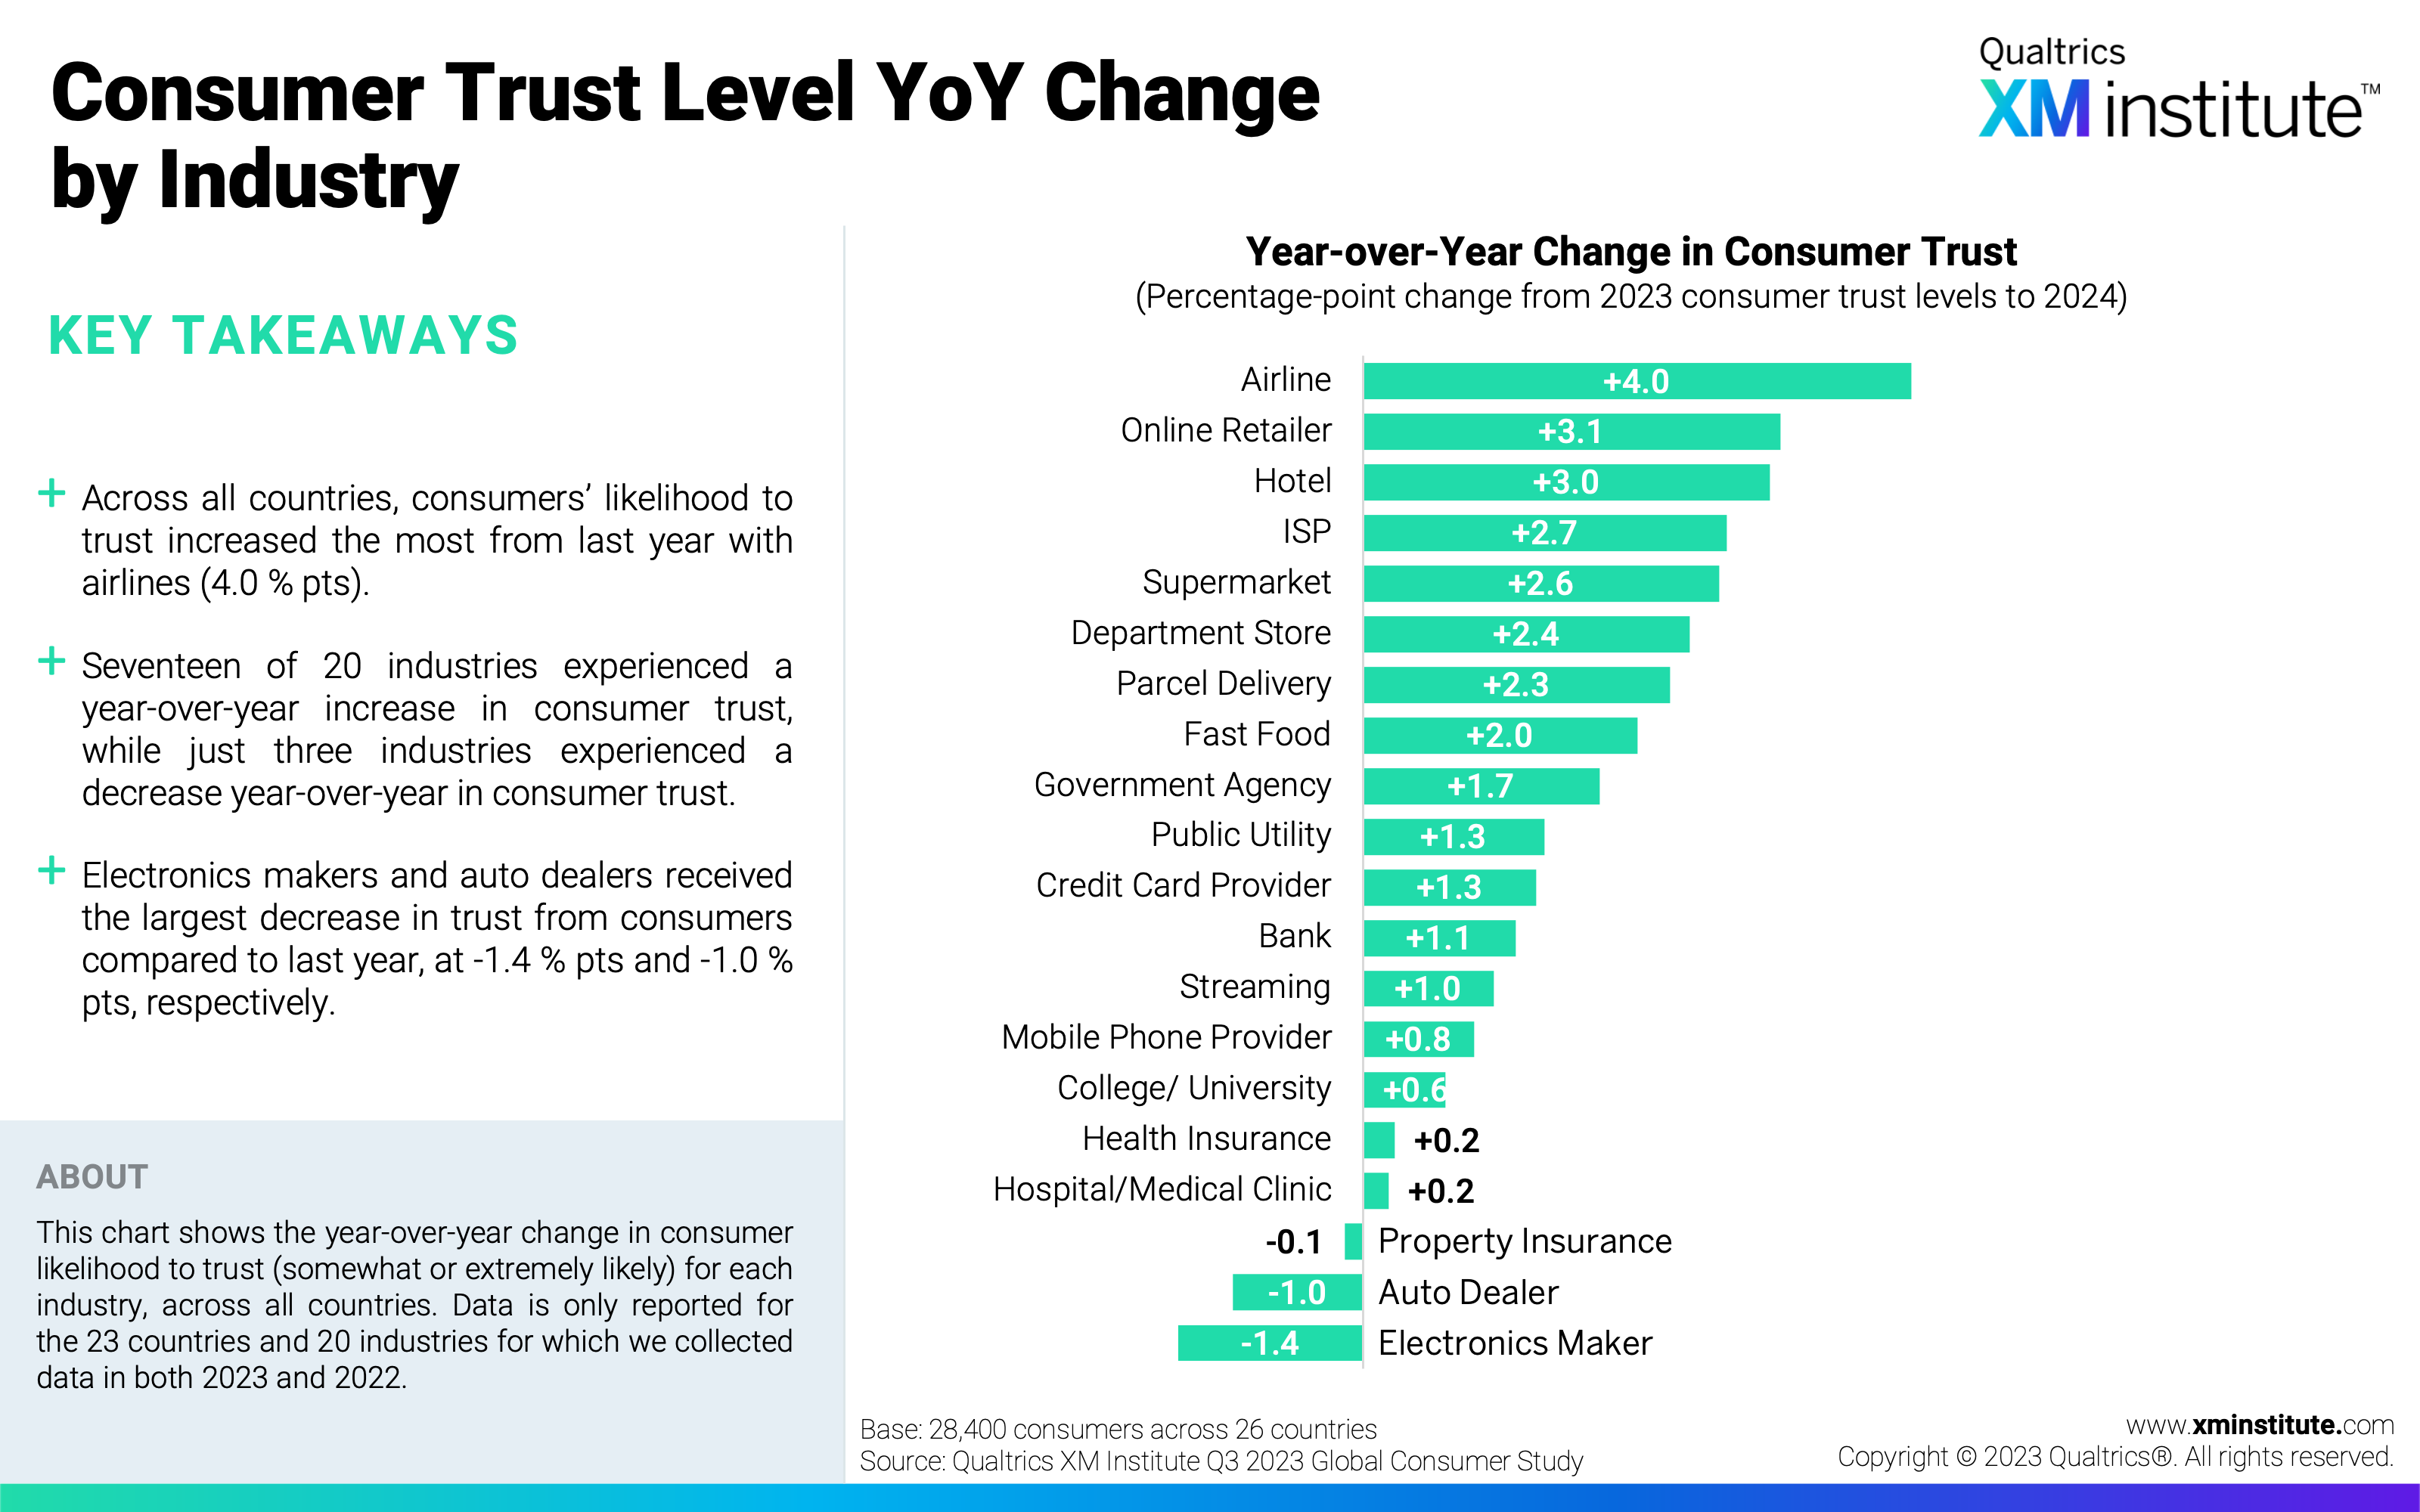
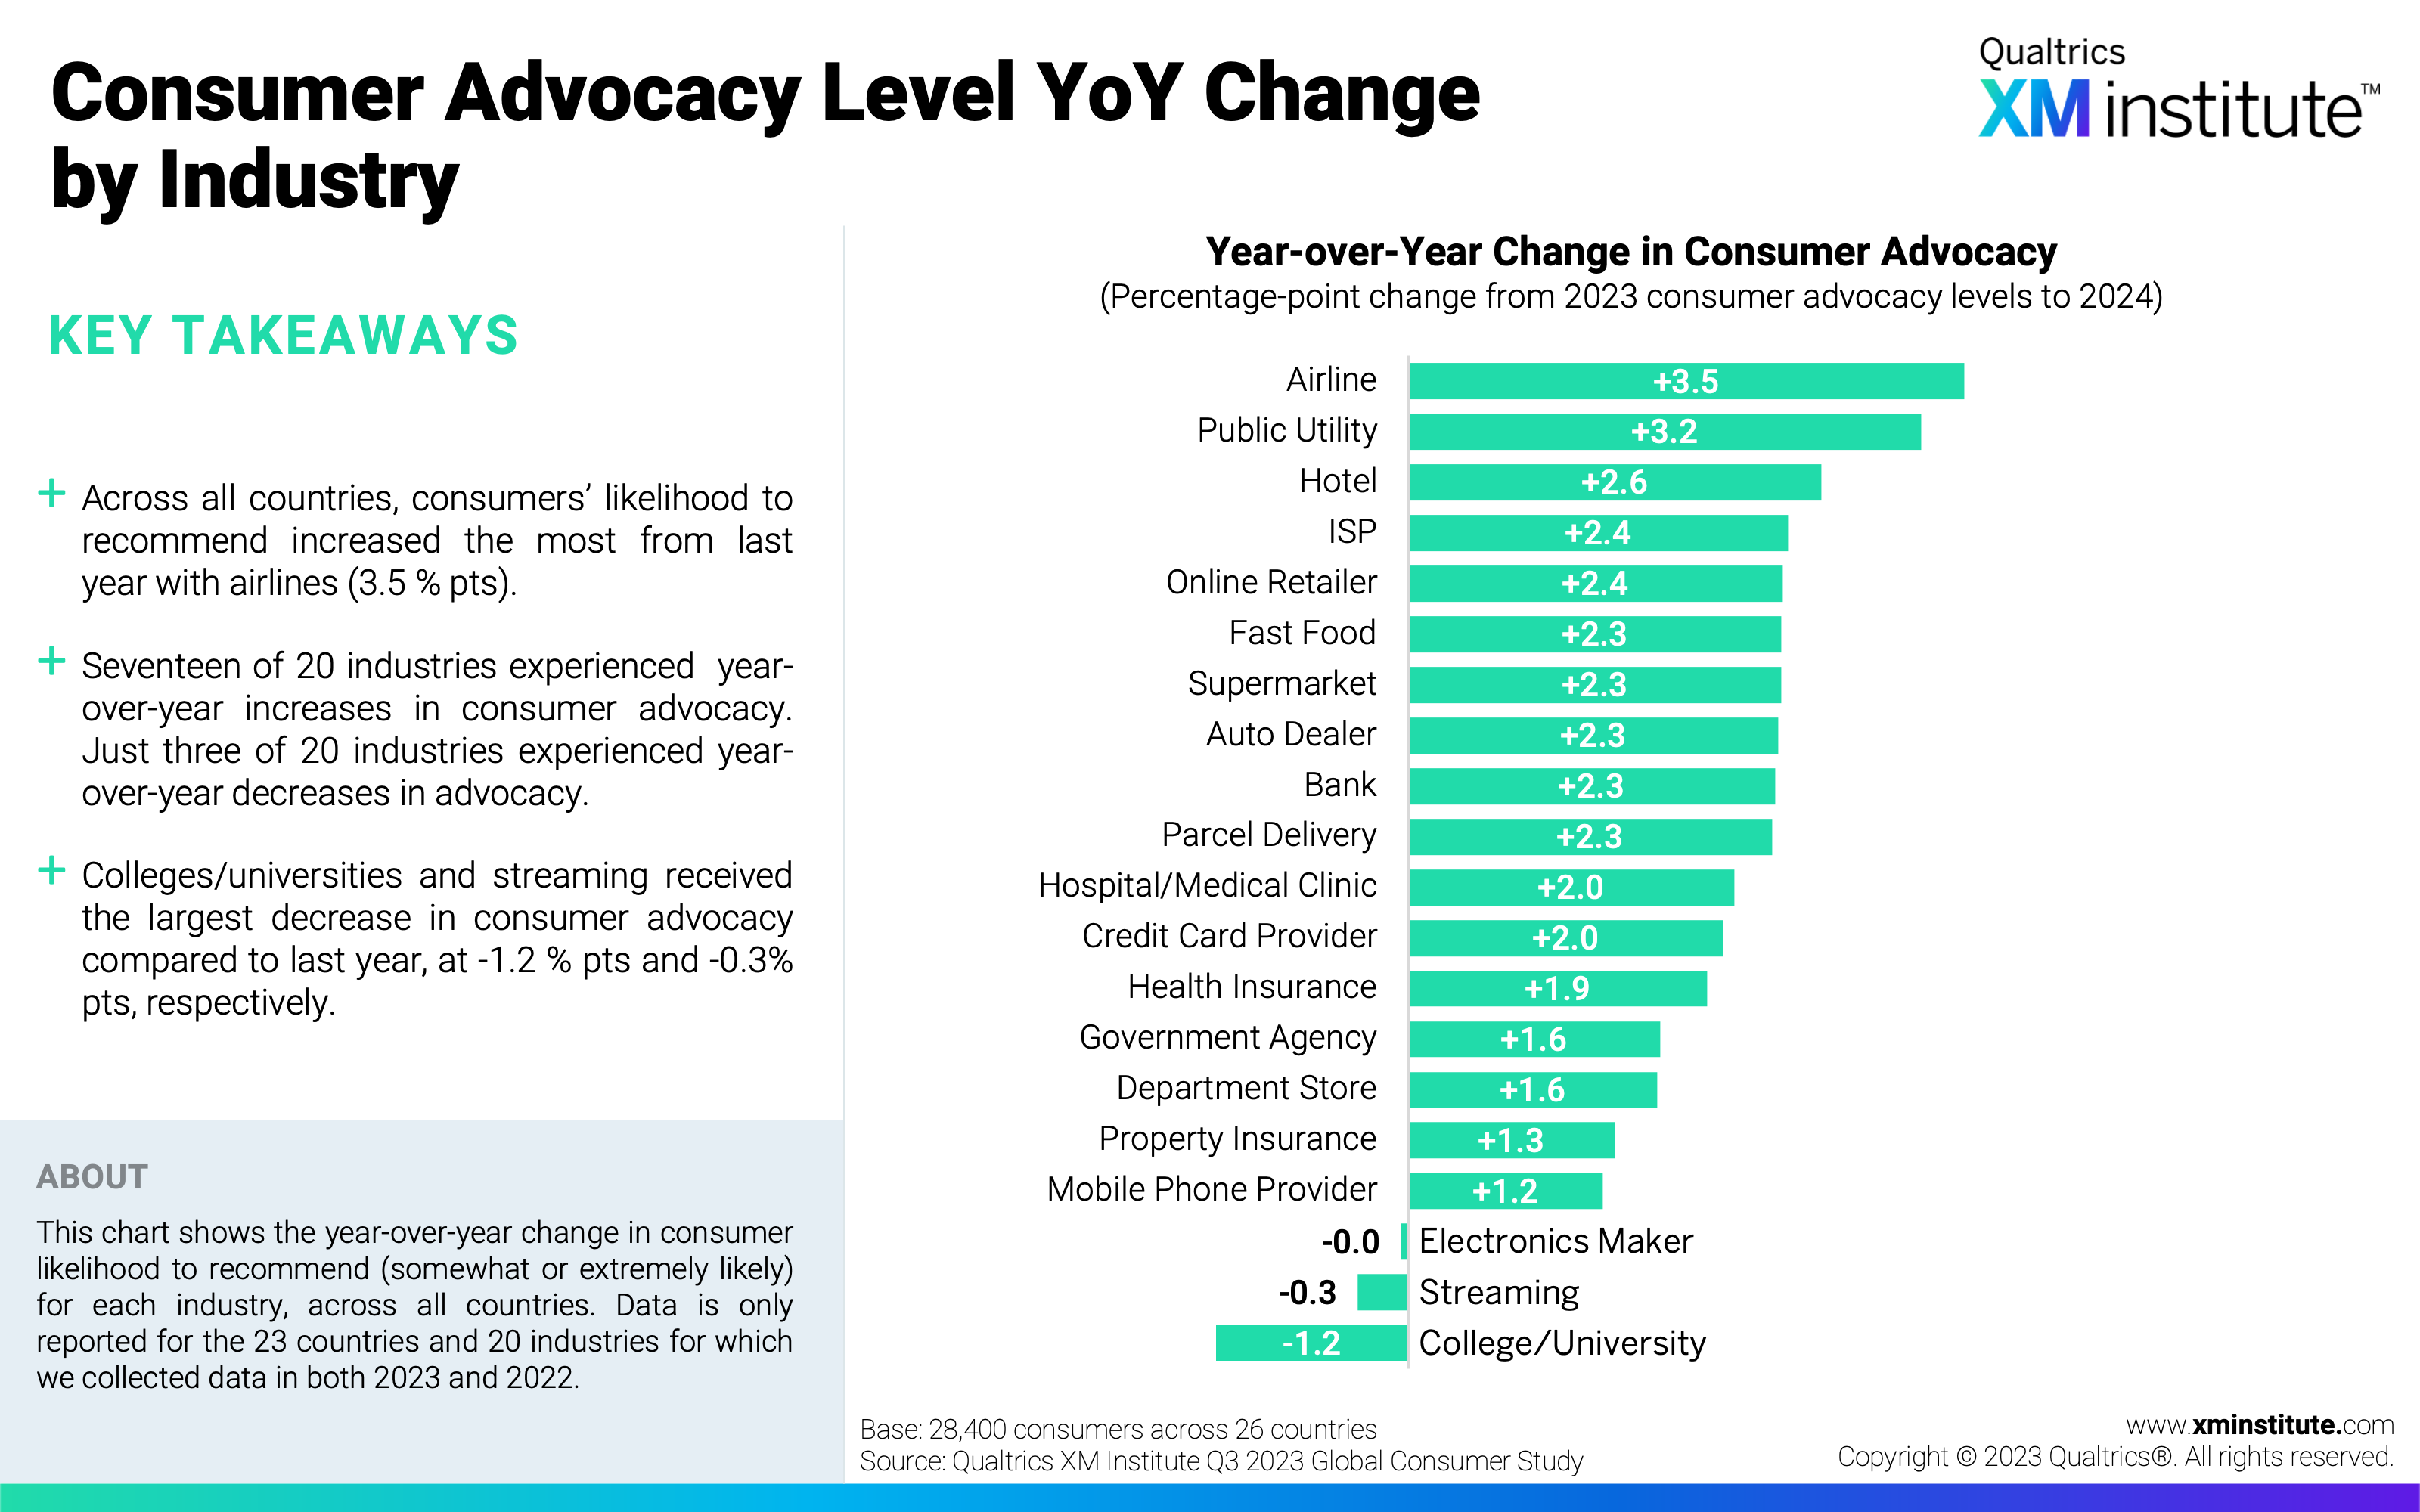
- Airlines enjoyed the greatest gains in consumer loyalty. Of the 20 industries, airlines saw the most substantial improvements in consumer trust (+4.0 percentage points) and advocacy (+3.5 percentage points) and the second-highest increase in consumer likelihood to rebuy (+4.3 percentage points). Consumer satisfaction with this industry also increased by 1.0 percentage points, the third highest after supermarkets and public utilities.
Figures
Here are the figures in this Data Snapshot:
- Consumer Satisfaction Levels by Country (see Figure 1)
- Consumer Satisfaction Level YoY Change by Country (see Figure 2)
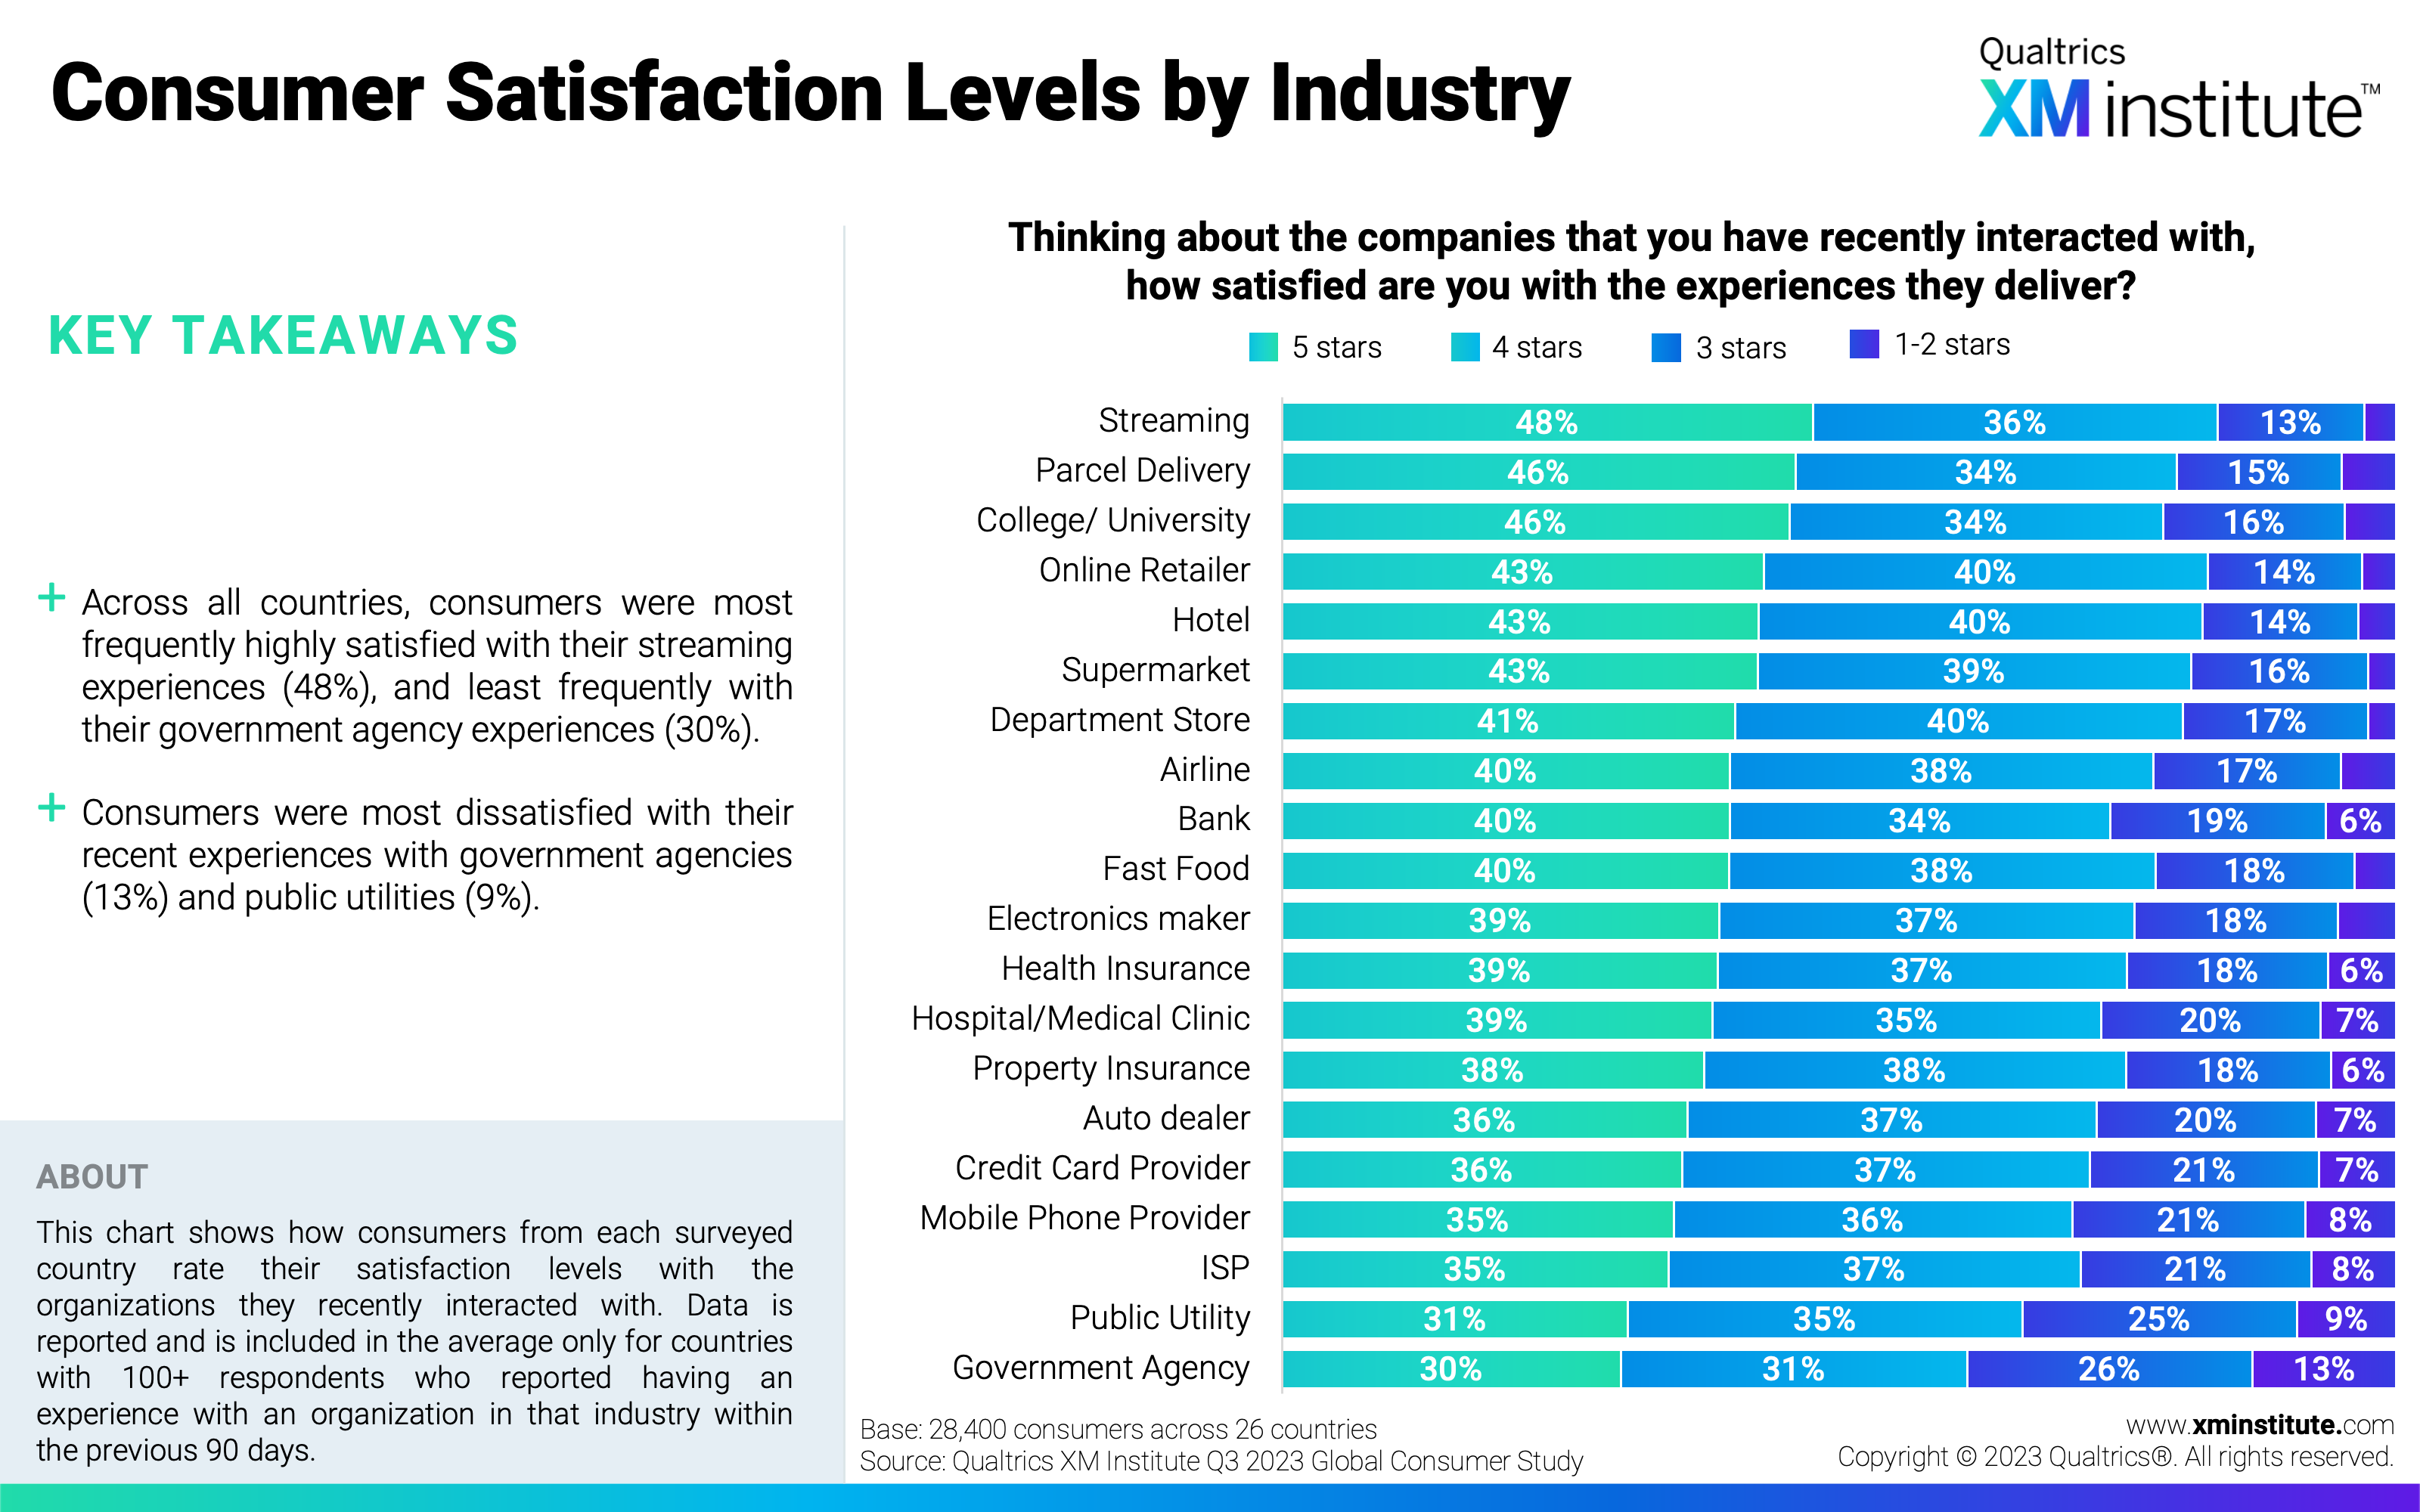
- Consumer Satisfaction Level by Industry (see Figure 3)
- Consumer Satisfaction Level YoY Change by Industry (see Figure 4)
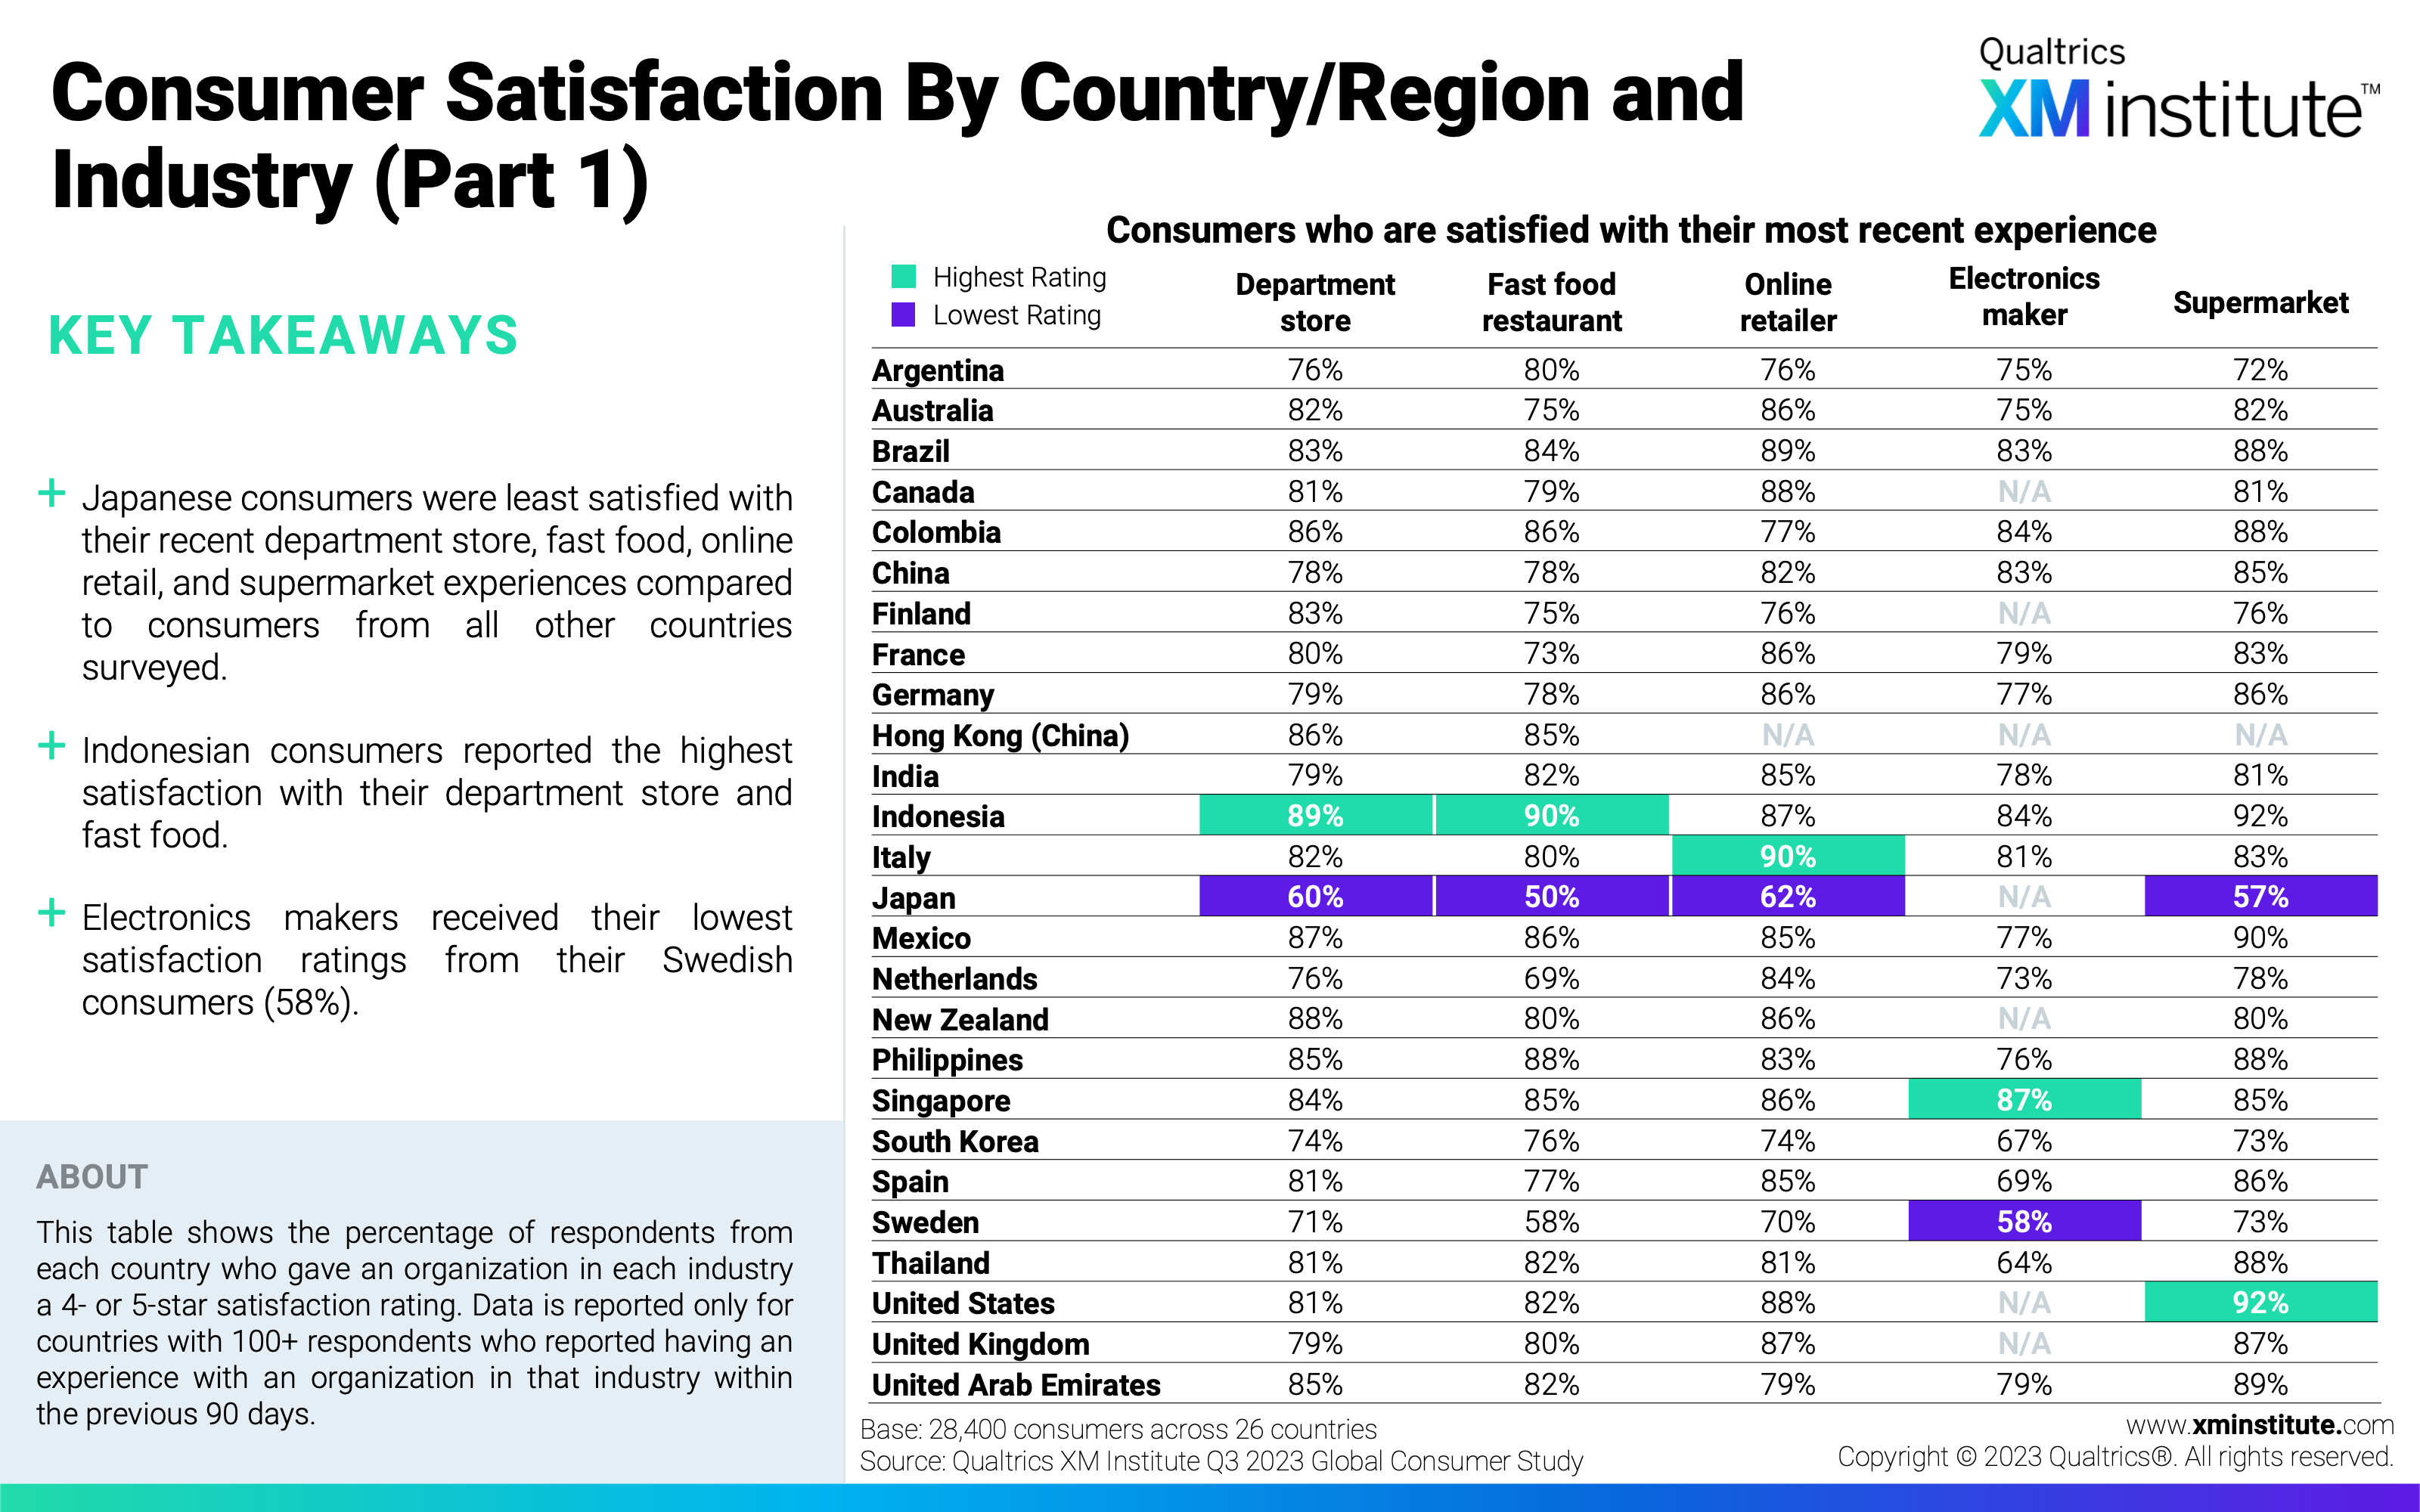
- Consumer Satisfaction by Country/Region and Industry (Part 1) (see Figure 5)
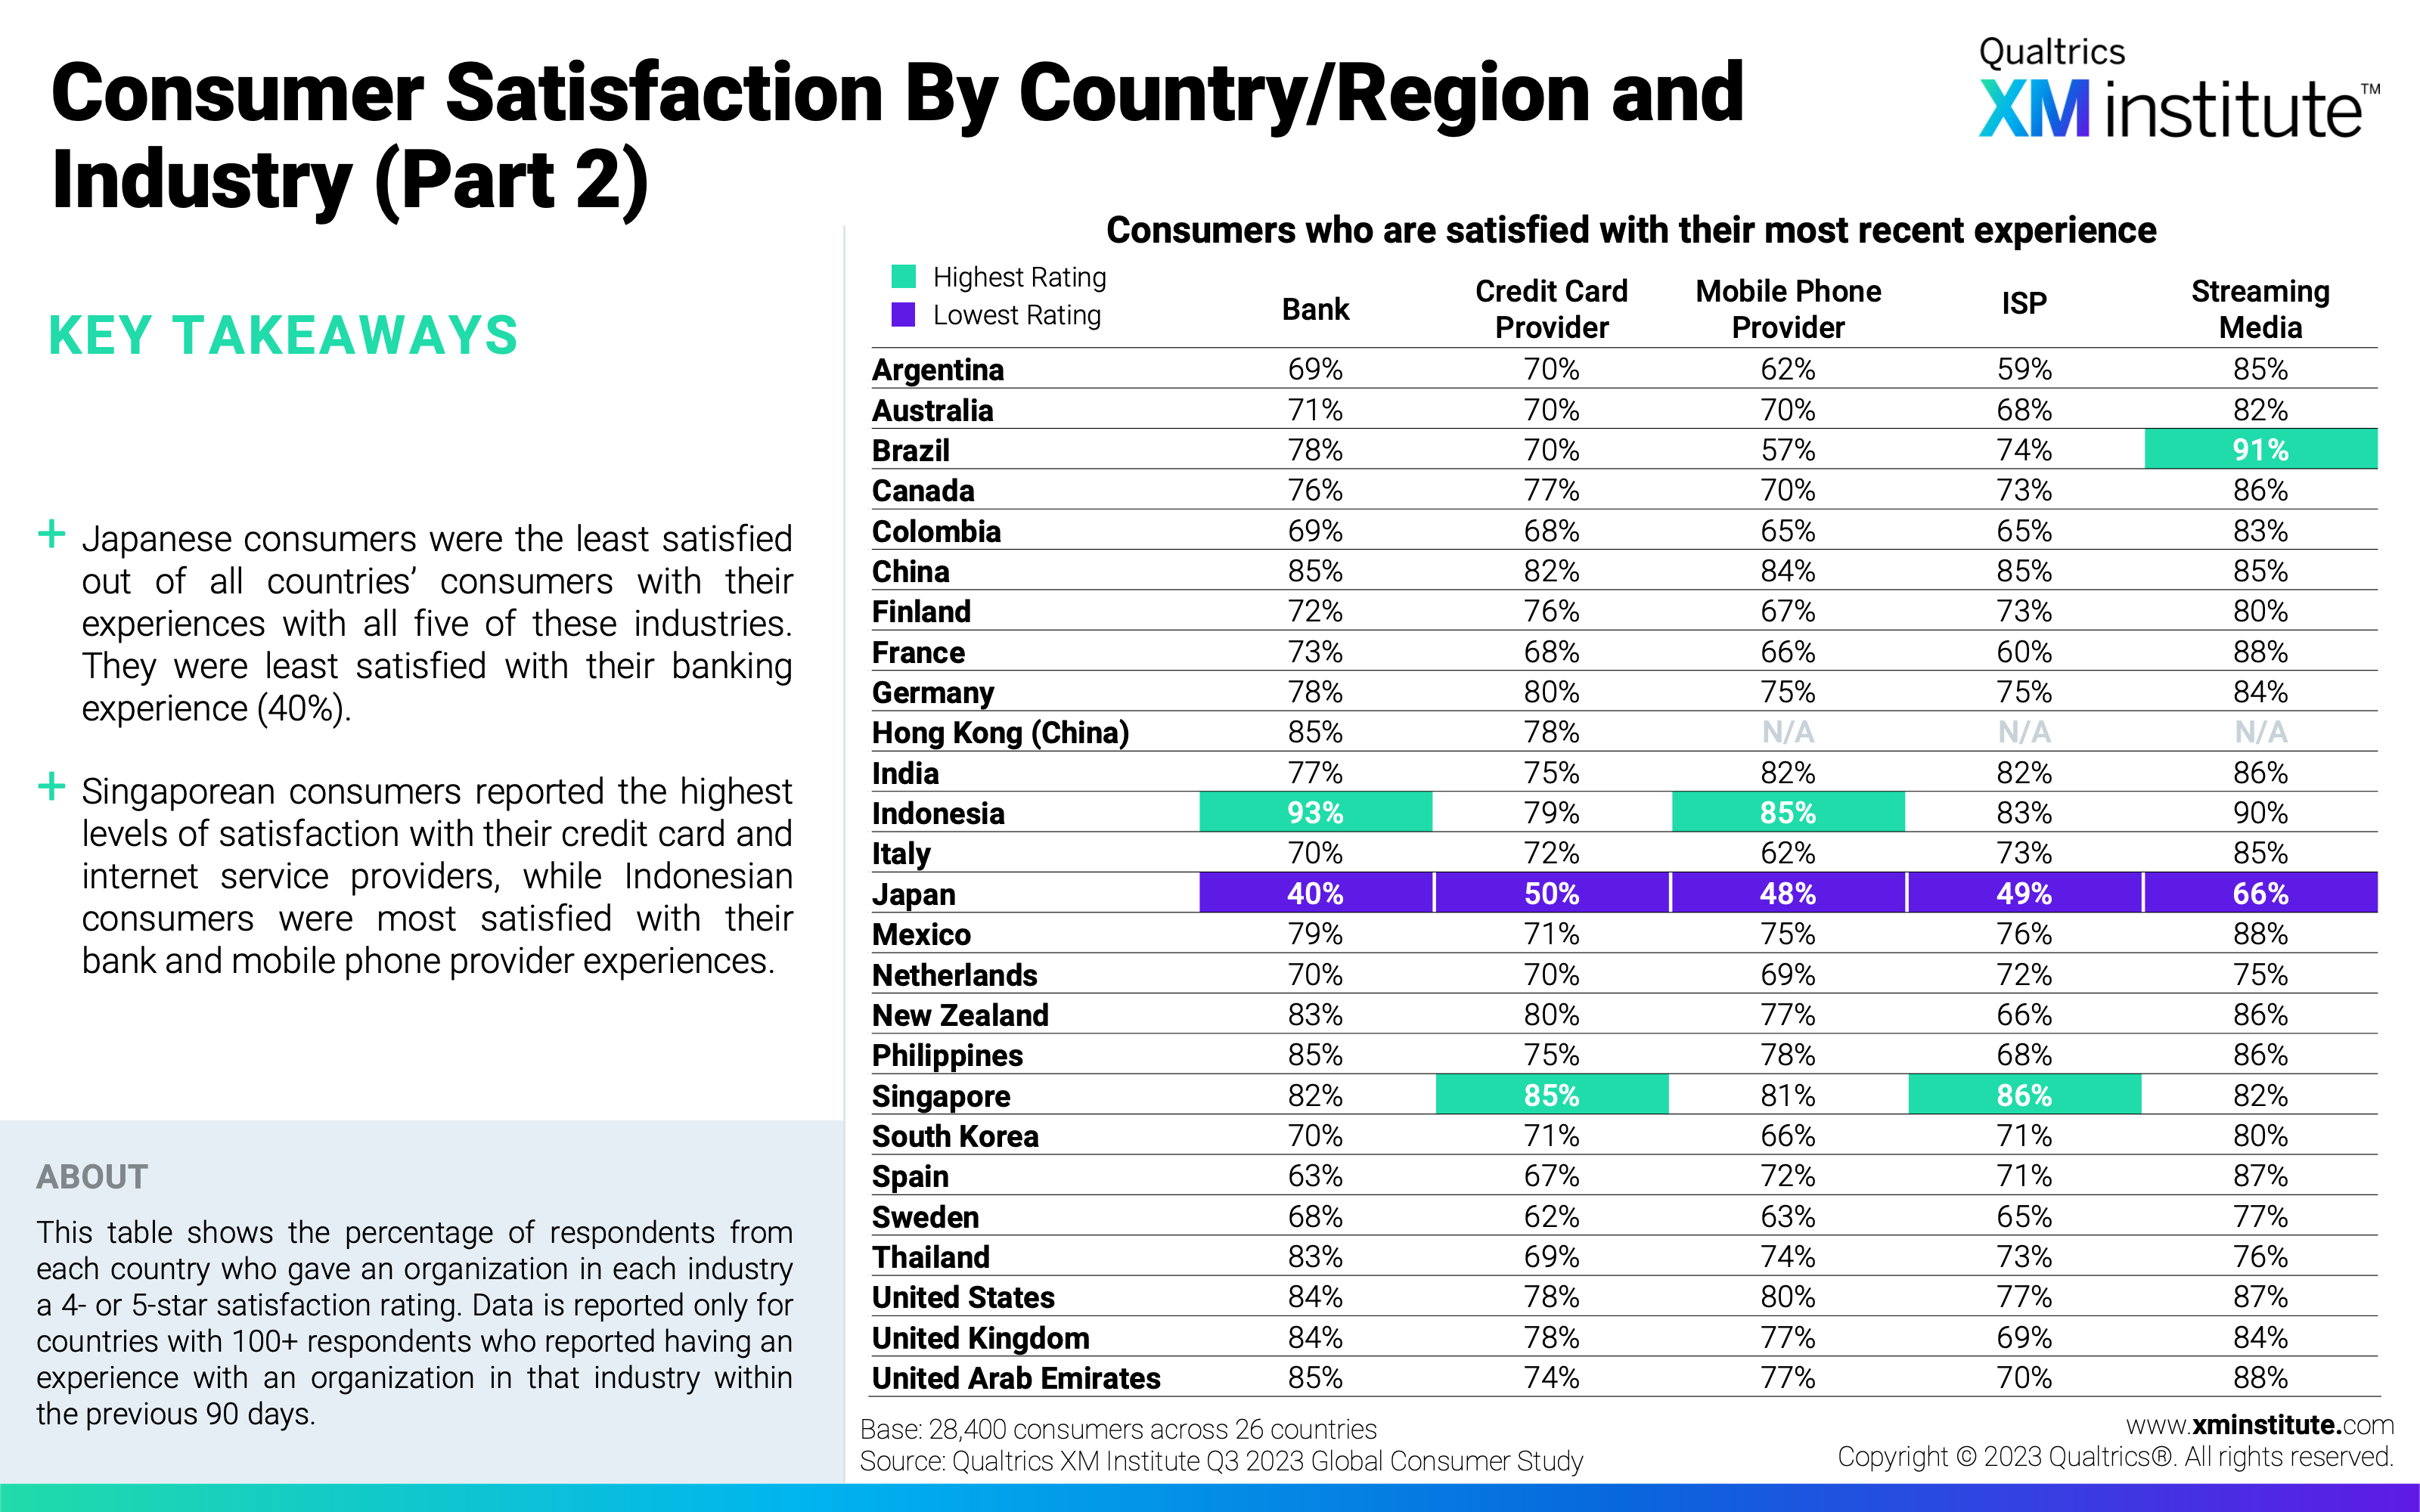
- Consumer Satisfaction by Country/Region and Industry (Part 2) (see Figure 6)
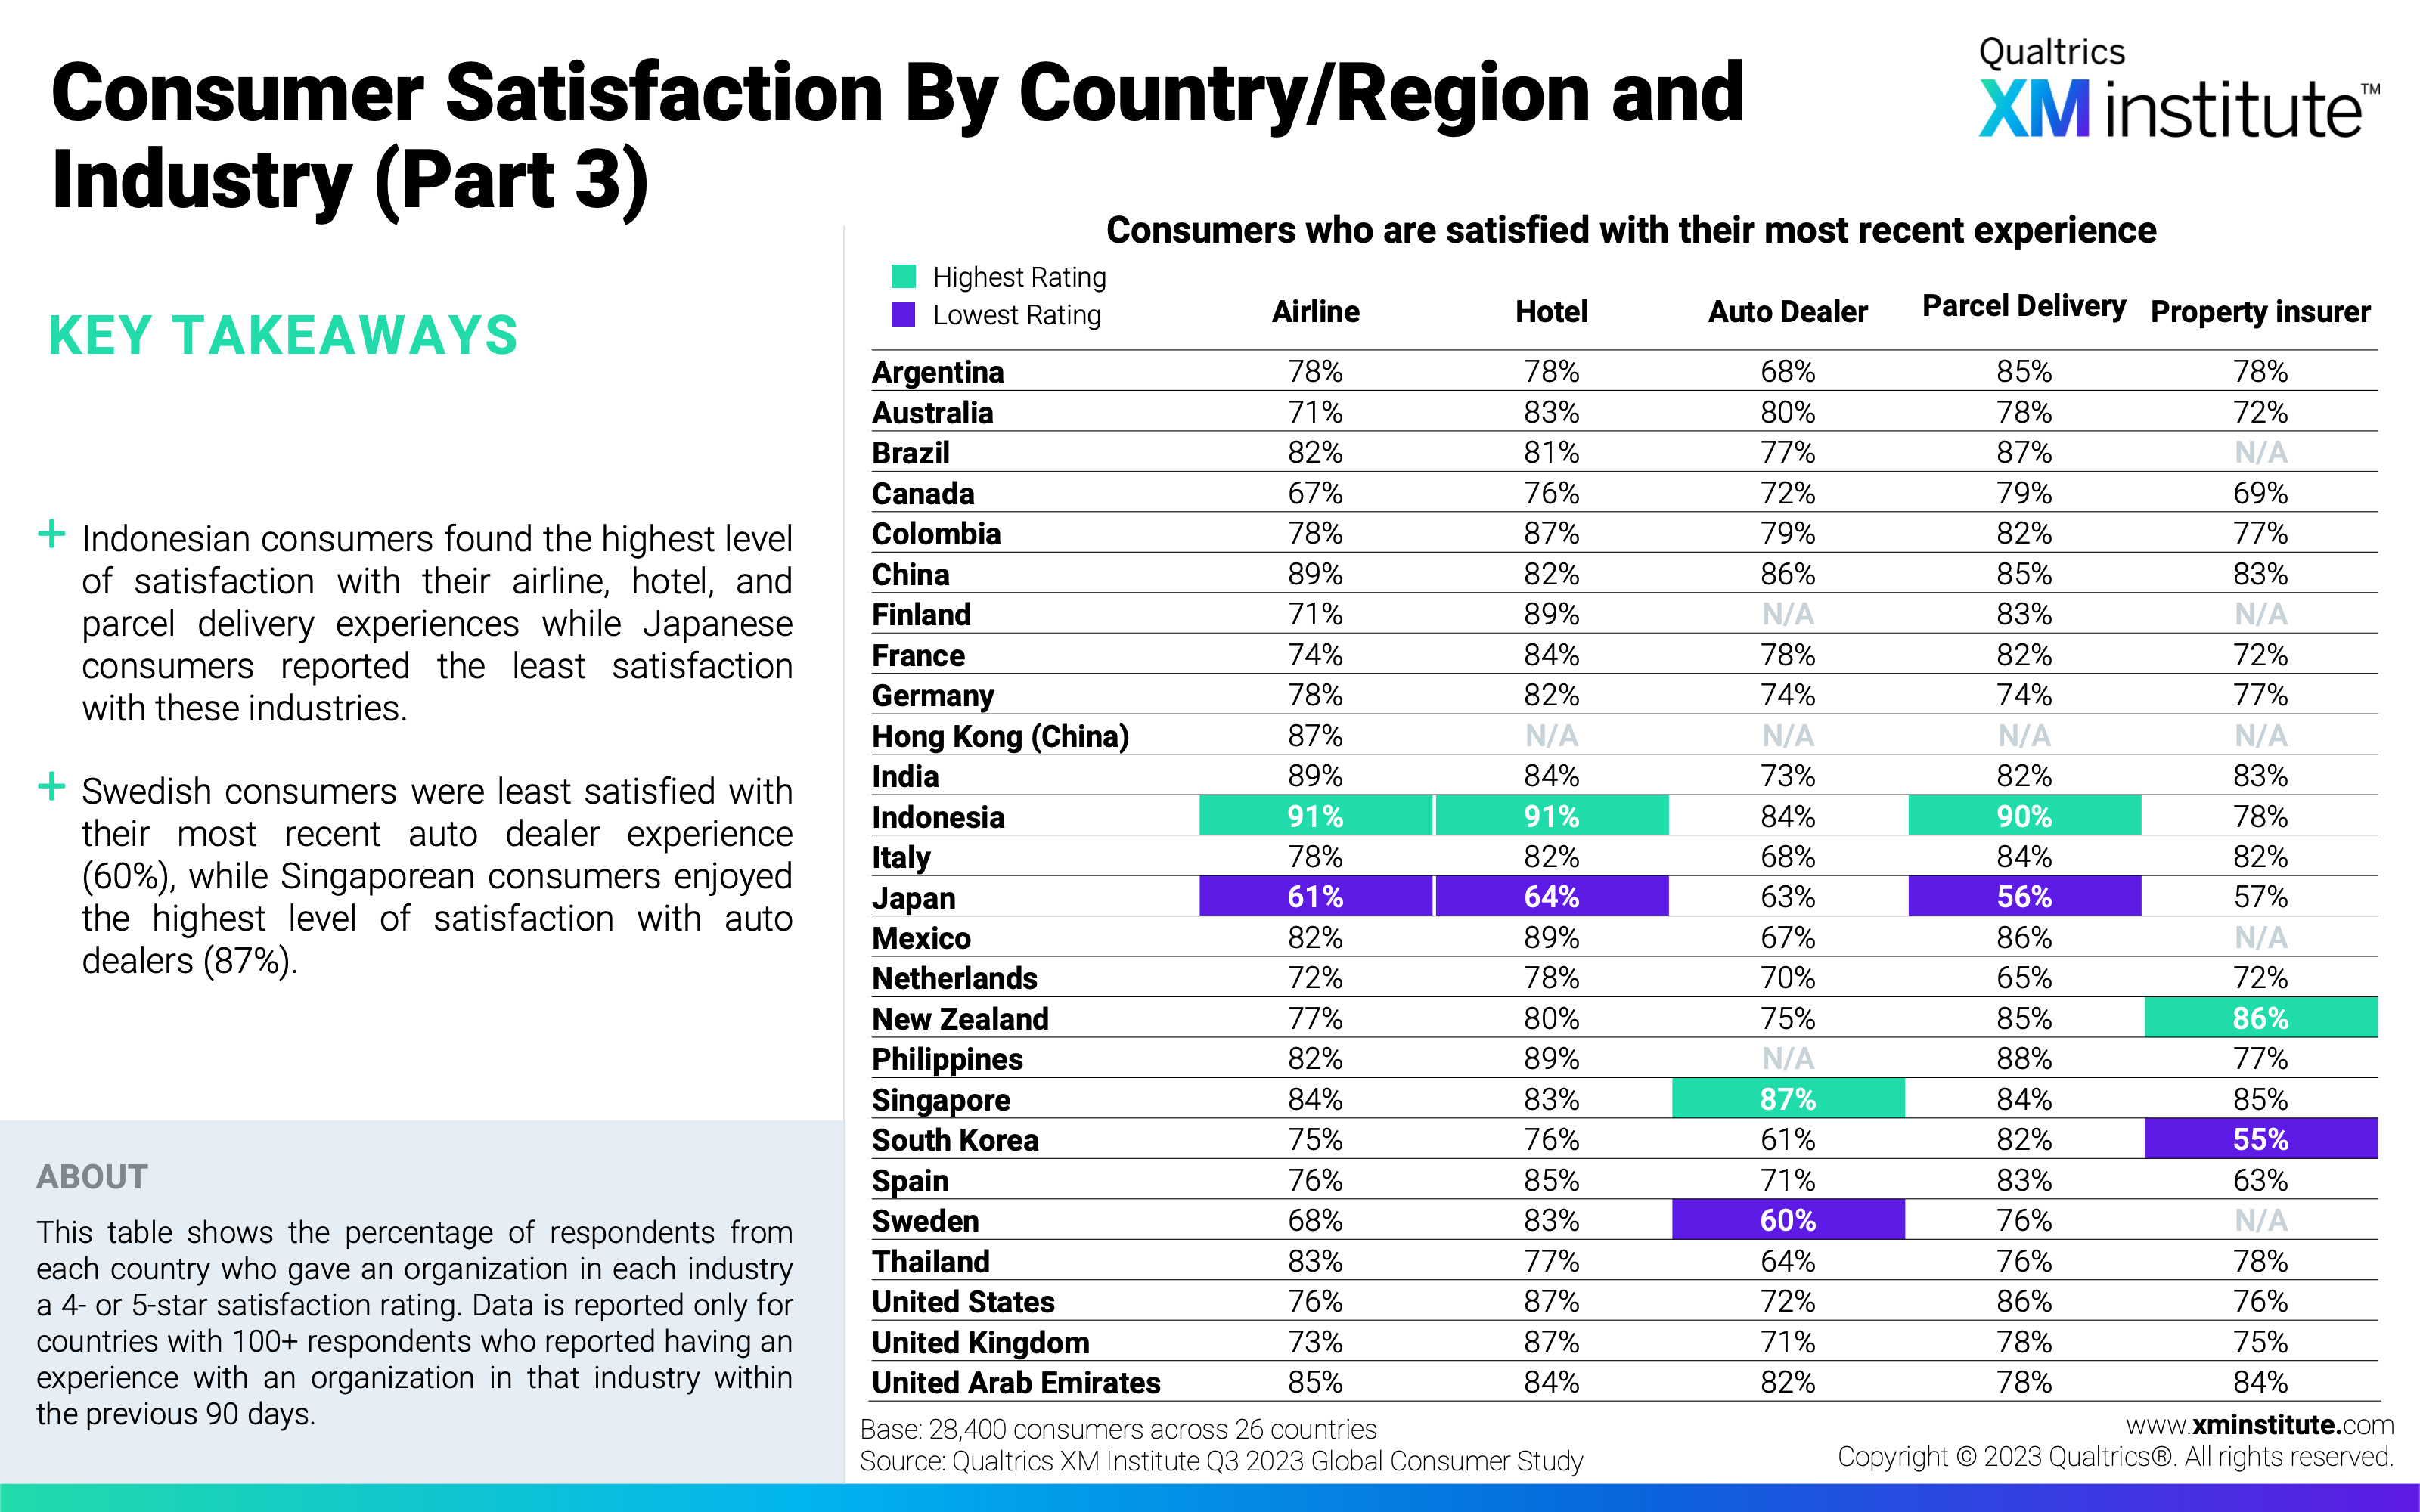
- Consumer Satisfaction by Country/Region and Industry (Part 3) (see Figure 7)
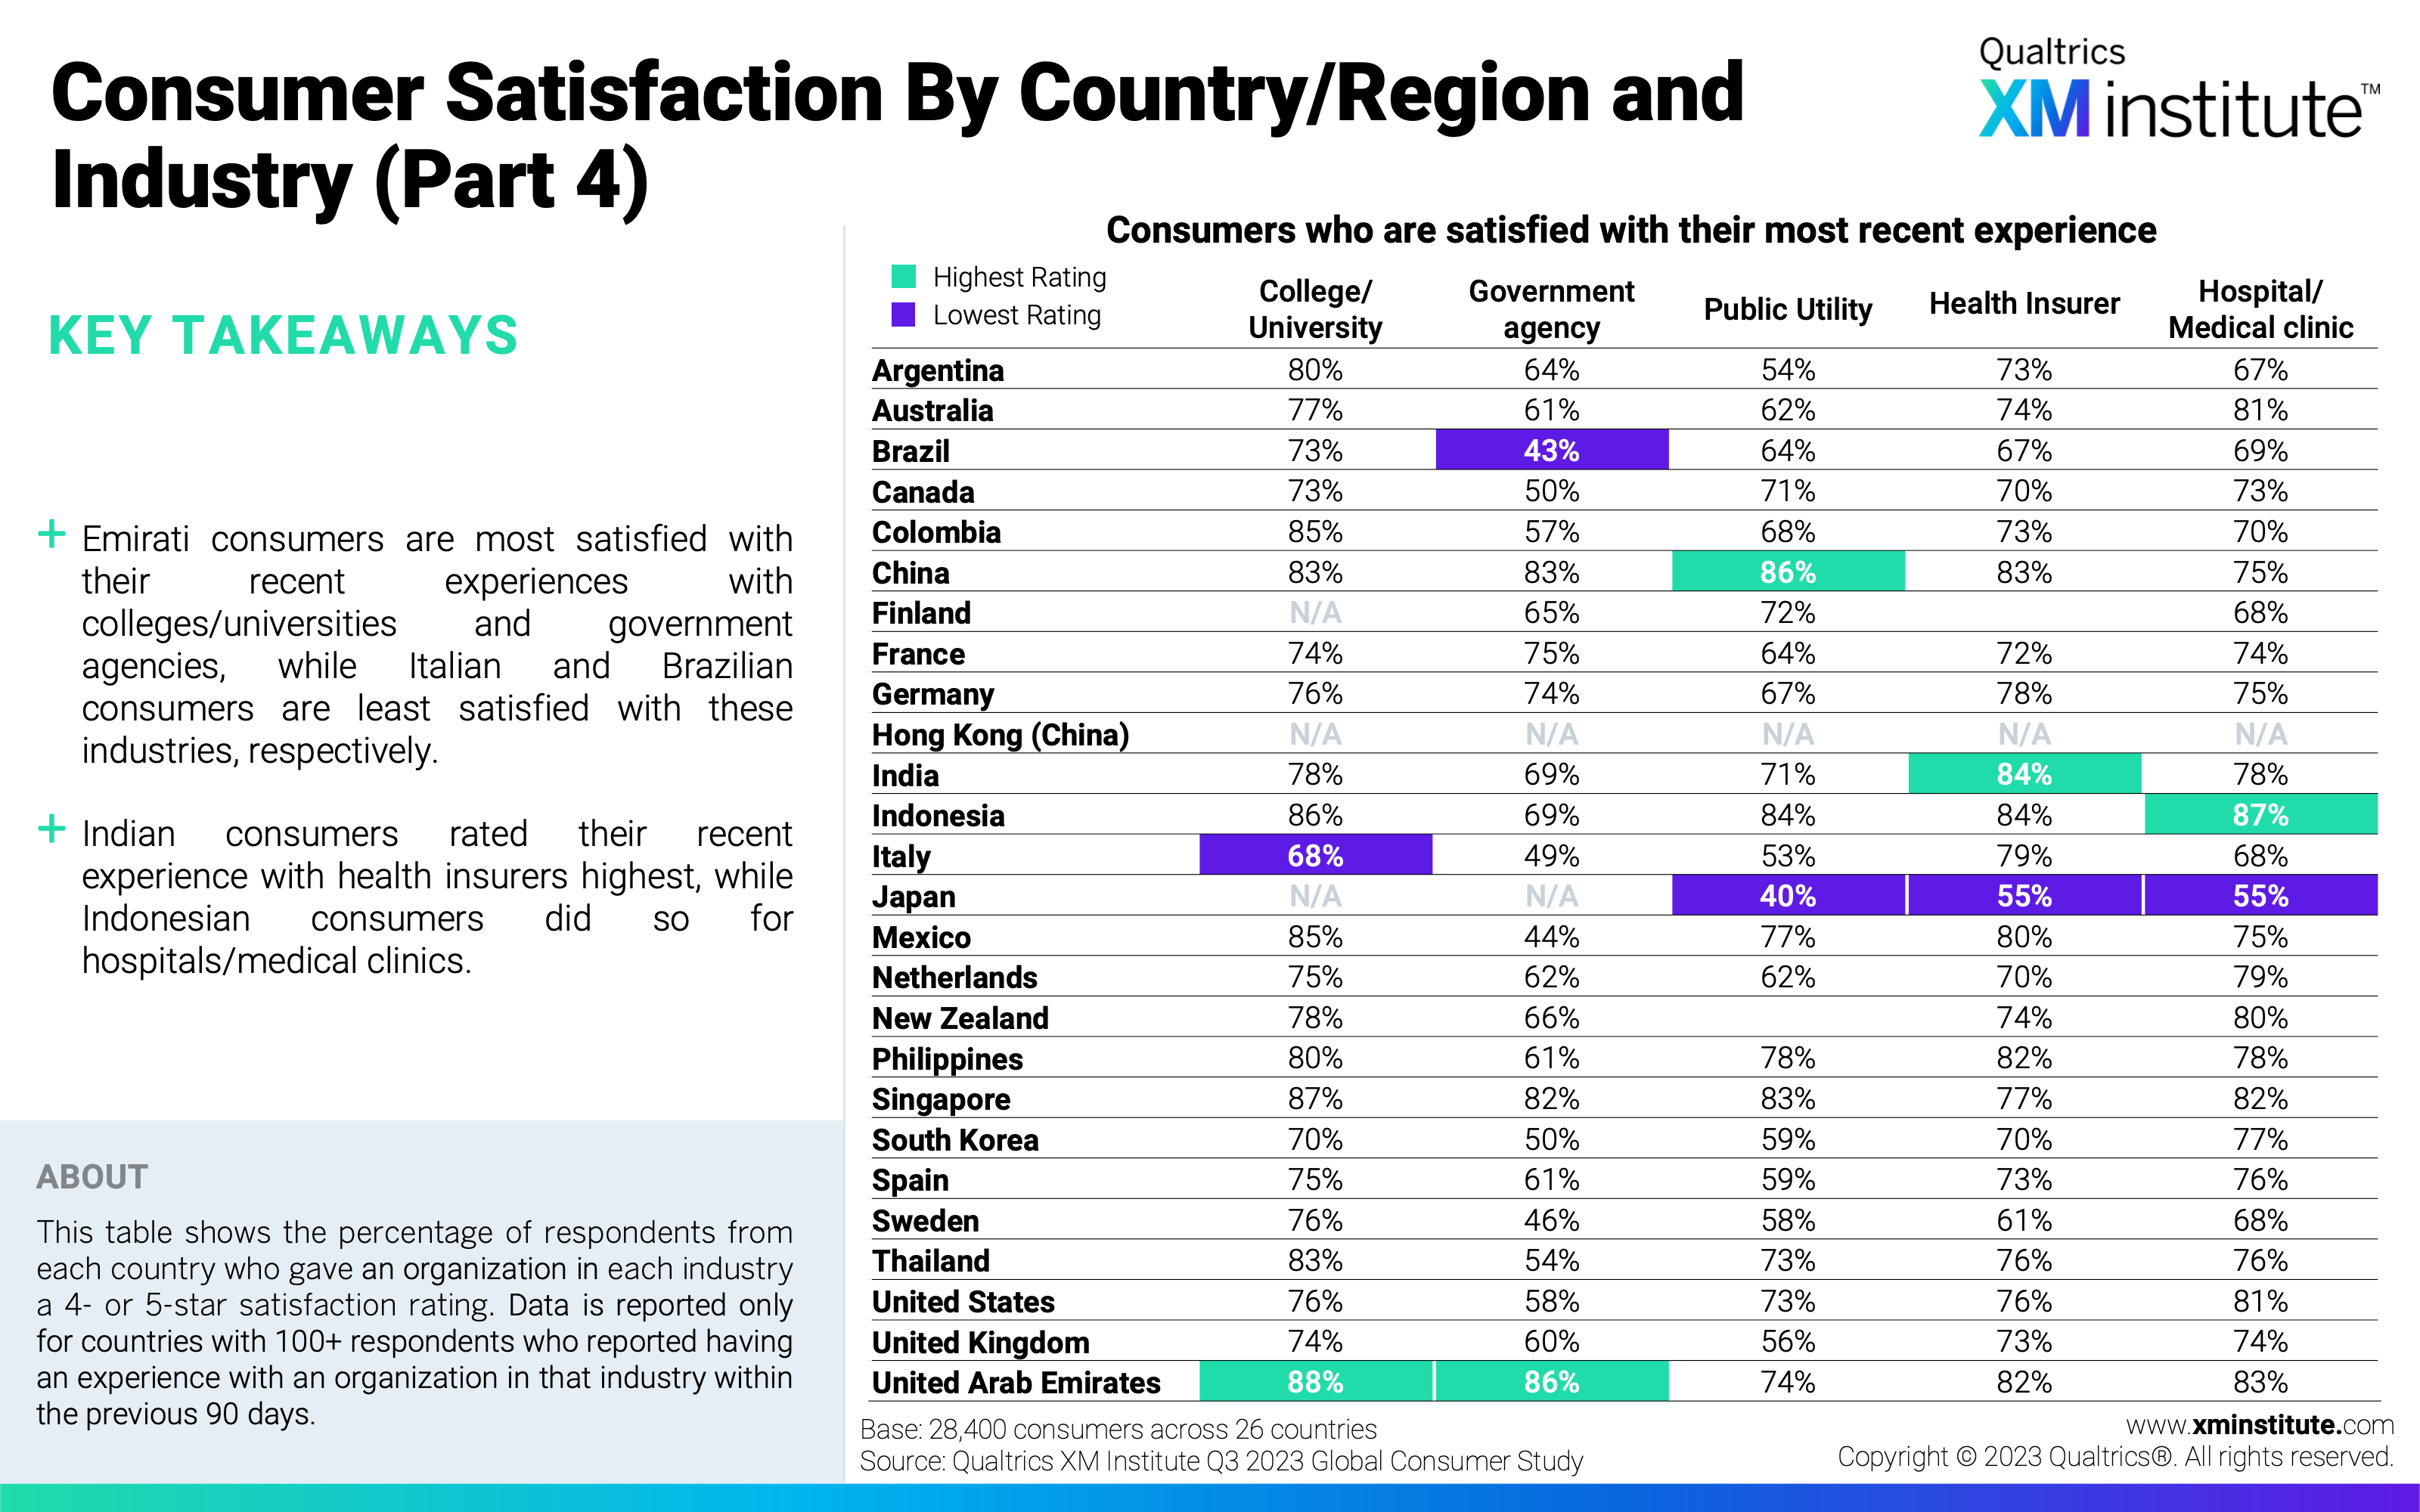
- Consumer Satisfaction by Country/Region and Industry (Part 4) (see Figure 8)
- Consumer Trust Level by Country (see Figure 9)
- Consumer Trust Level YoY Change by Country (see Figure 10)
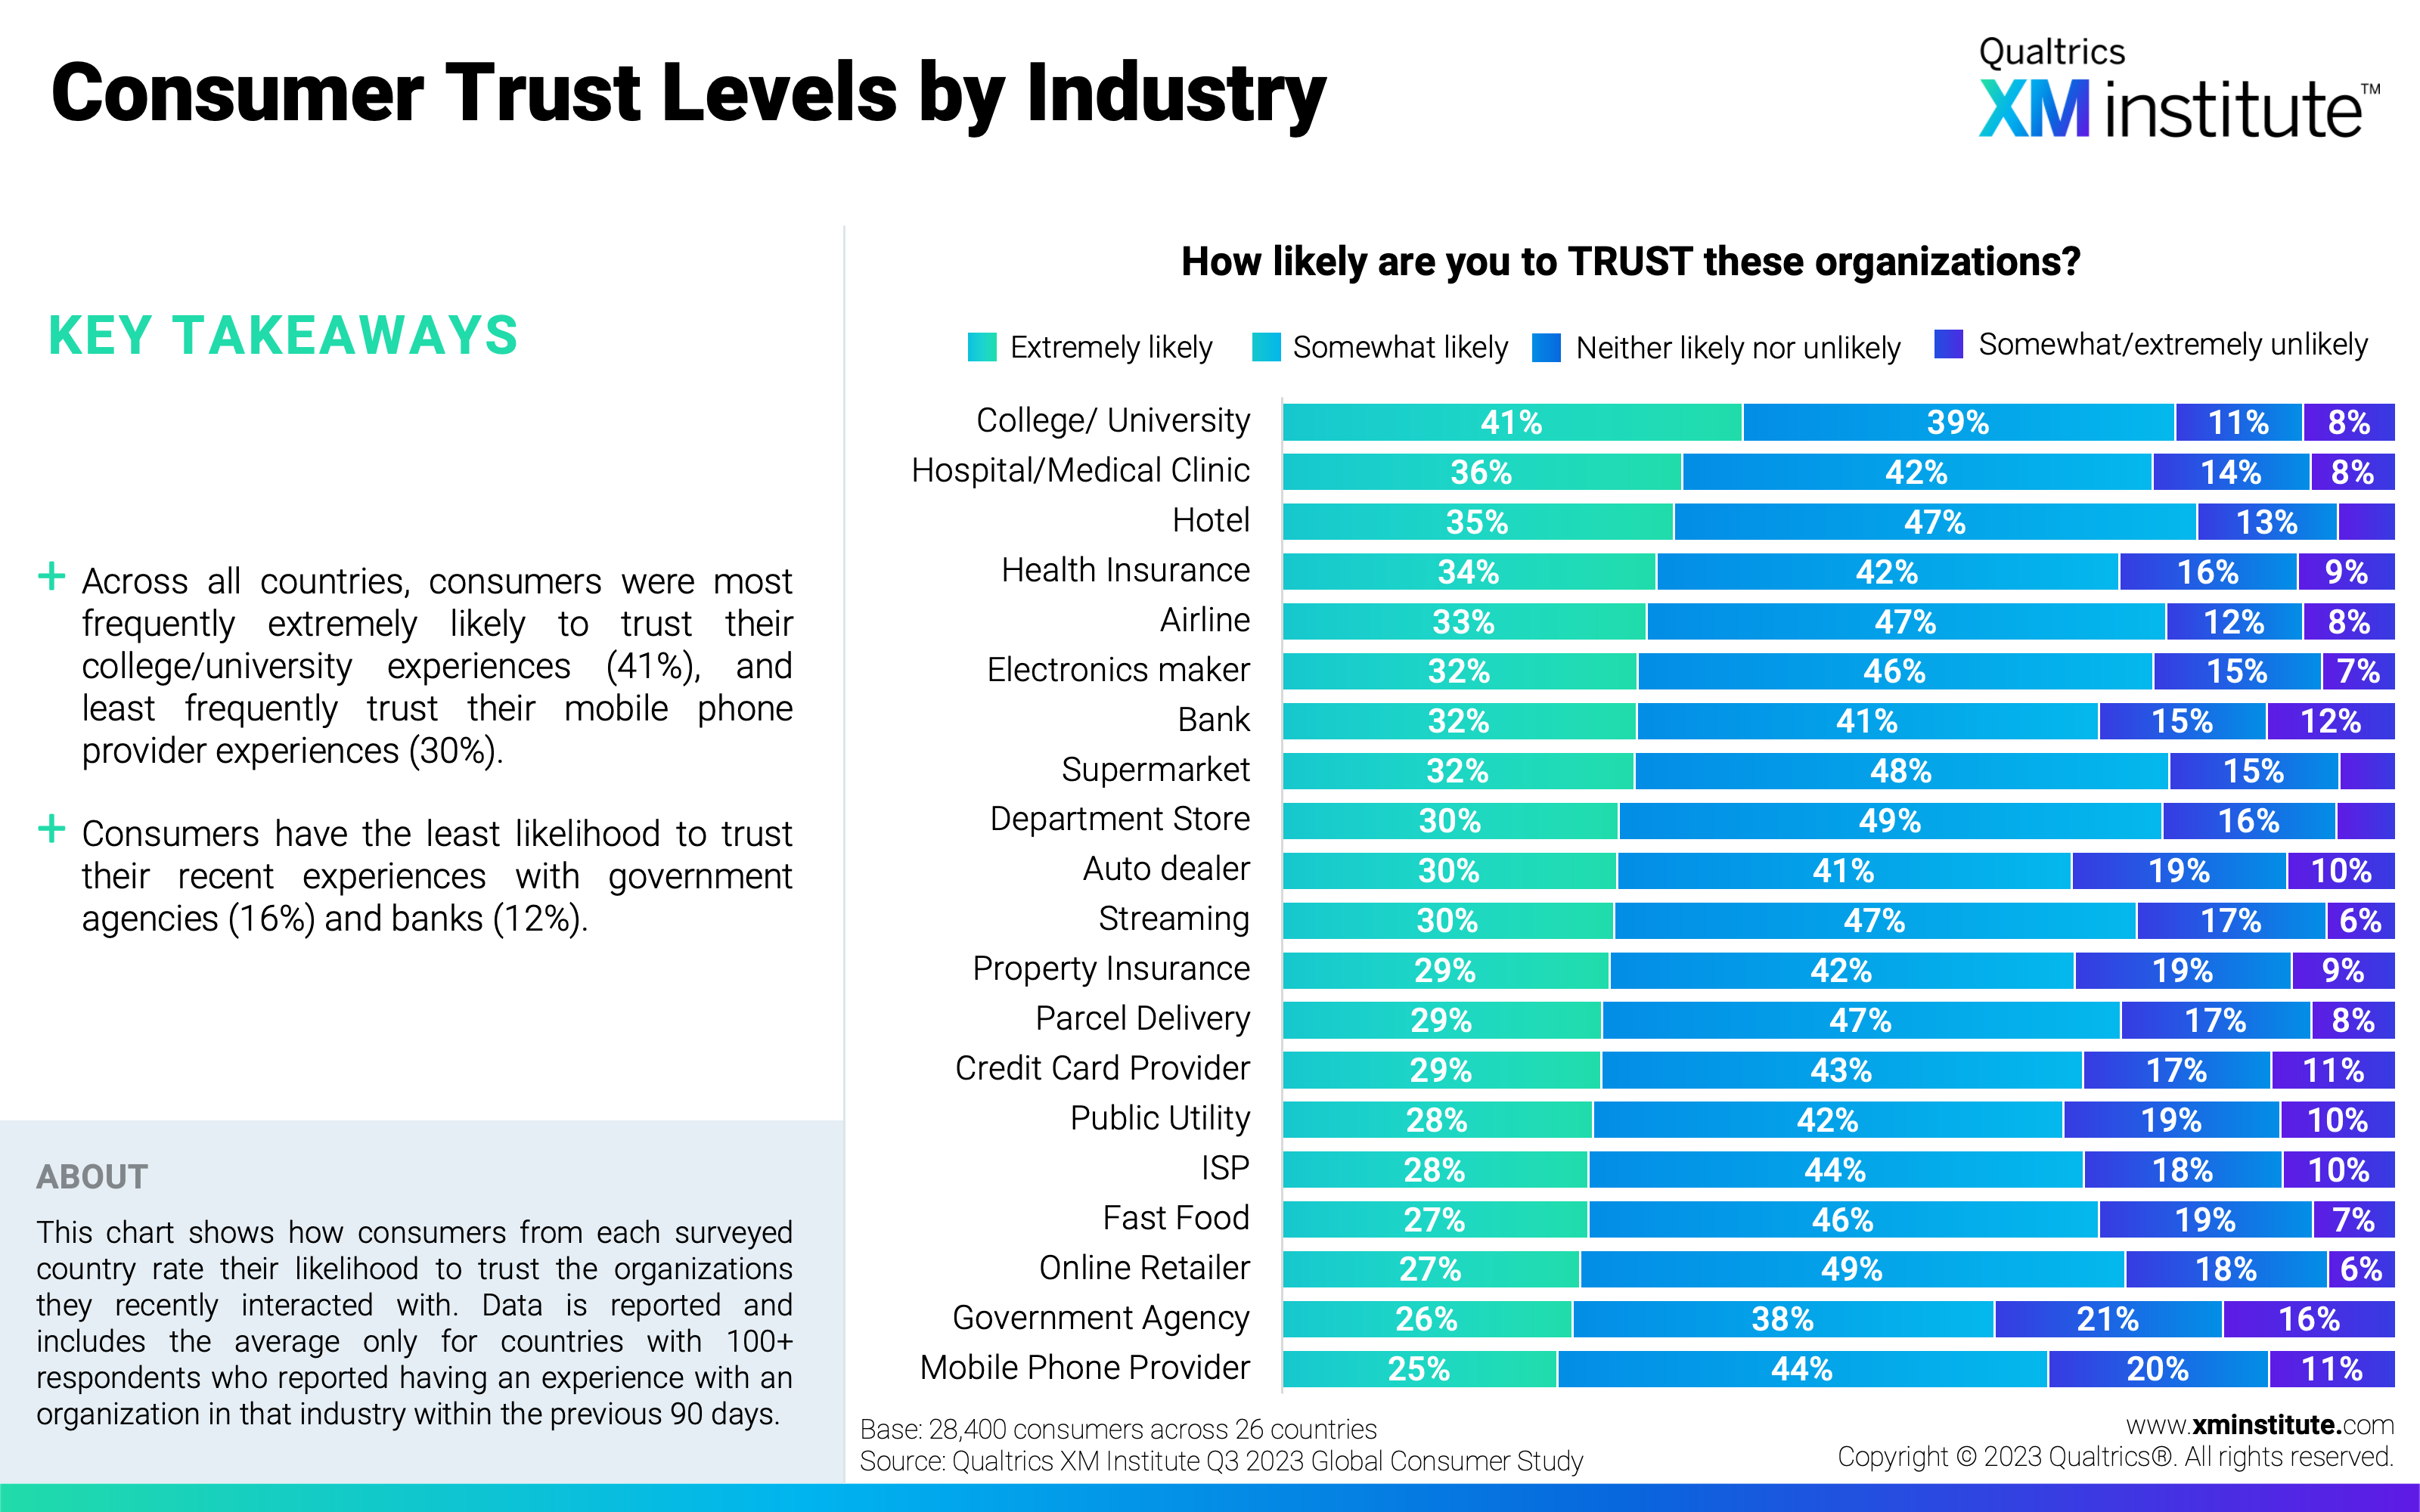
- Consumer Trust Level by Industry (see Figure 11)
- Consumer Trust Level YoY Change by Industry (see Figure 12)
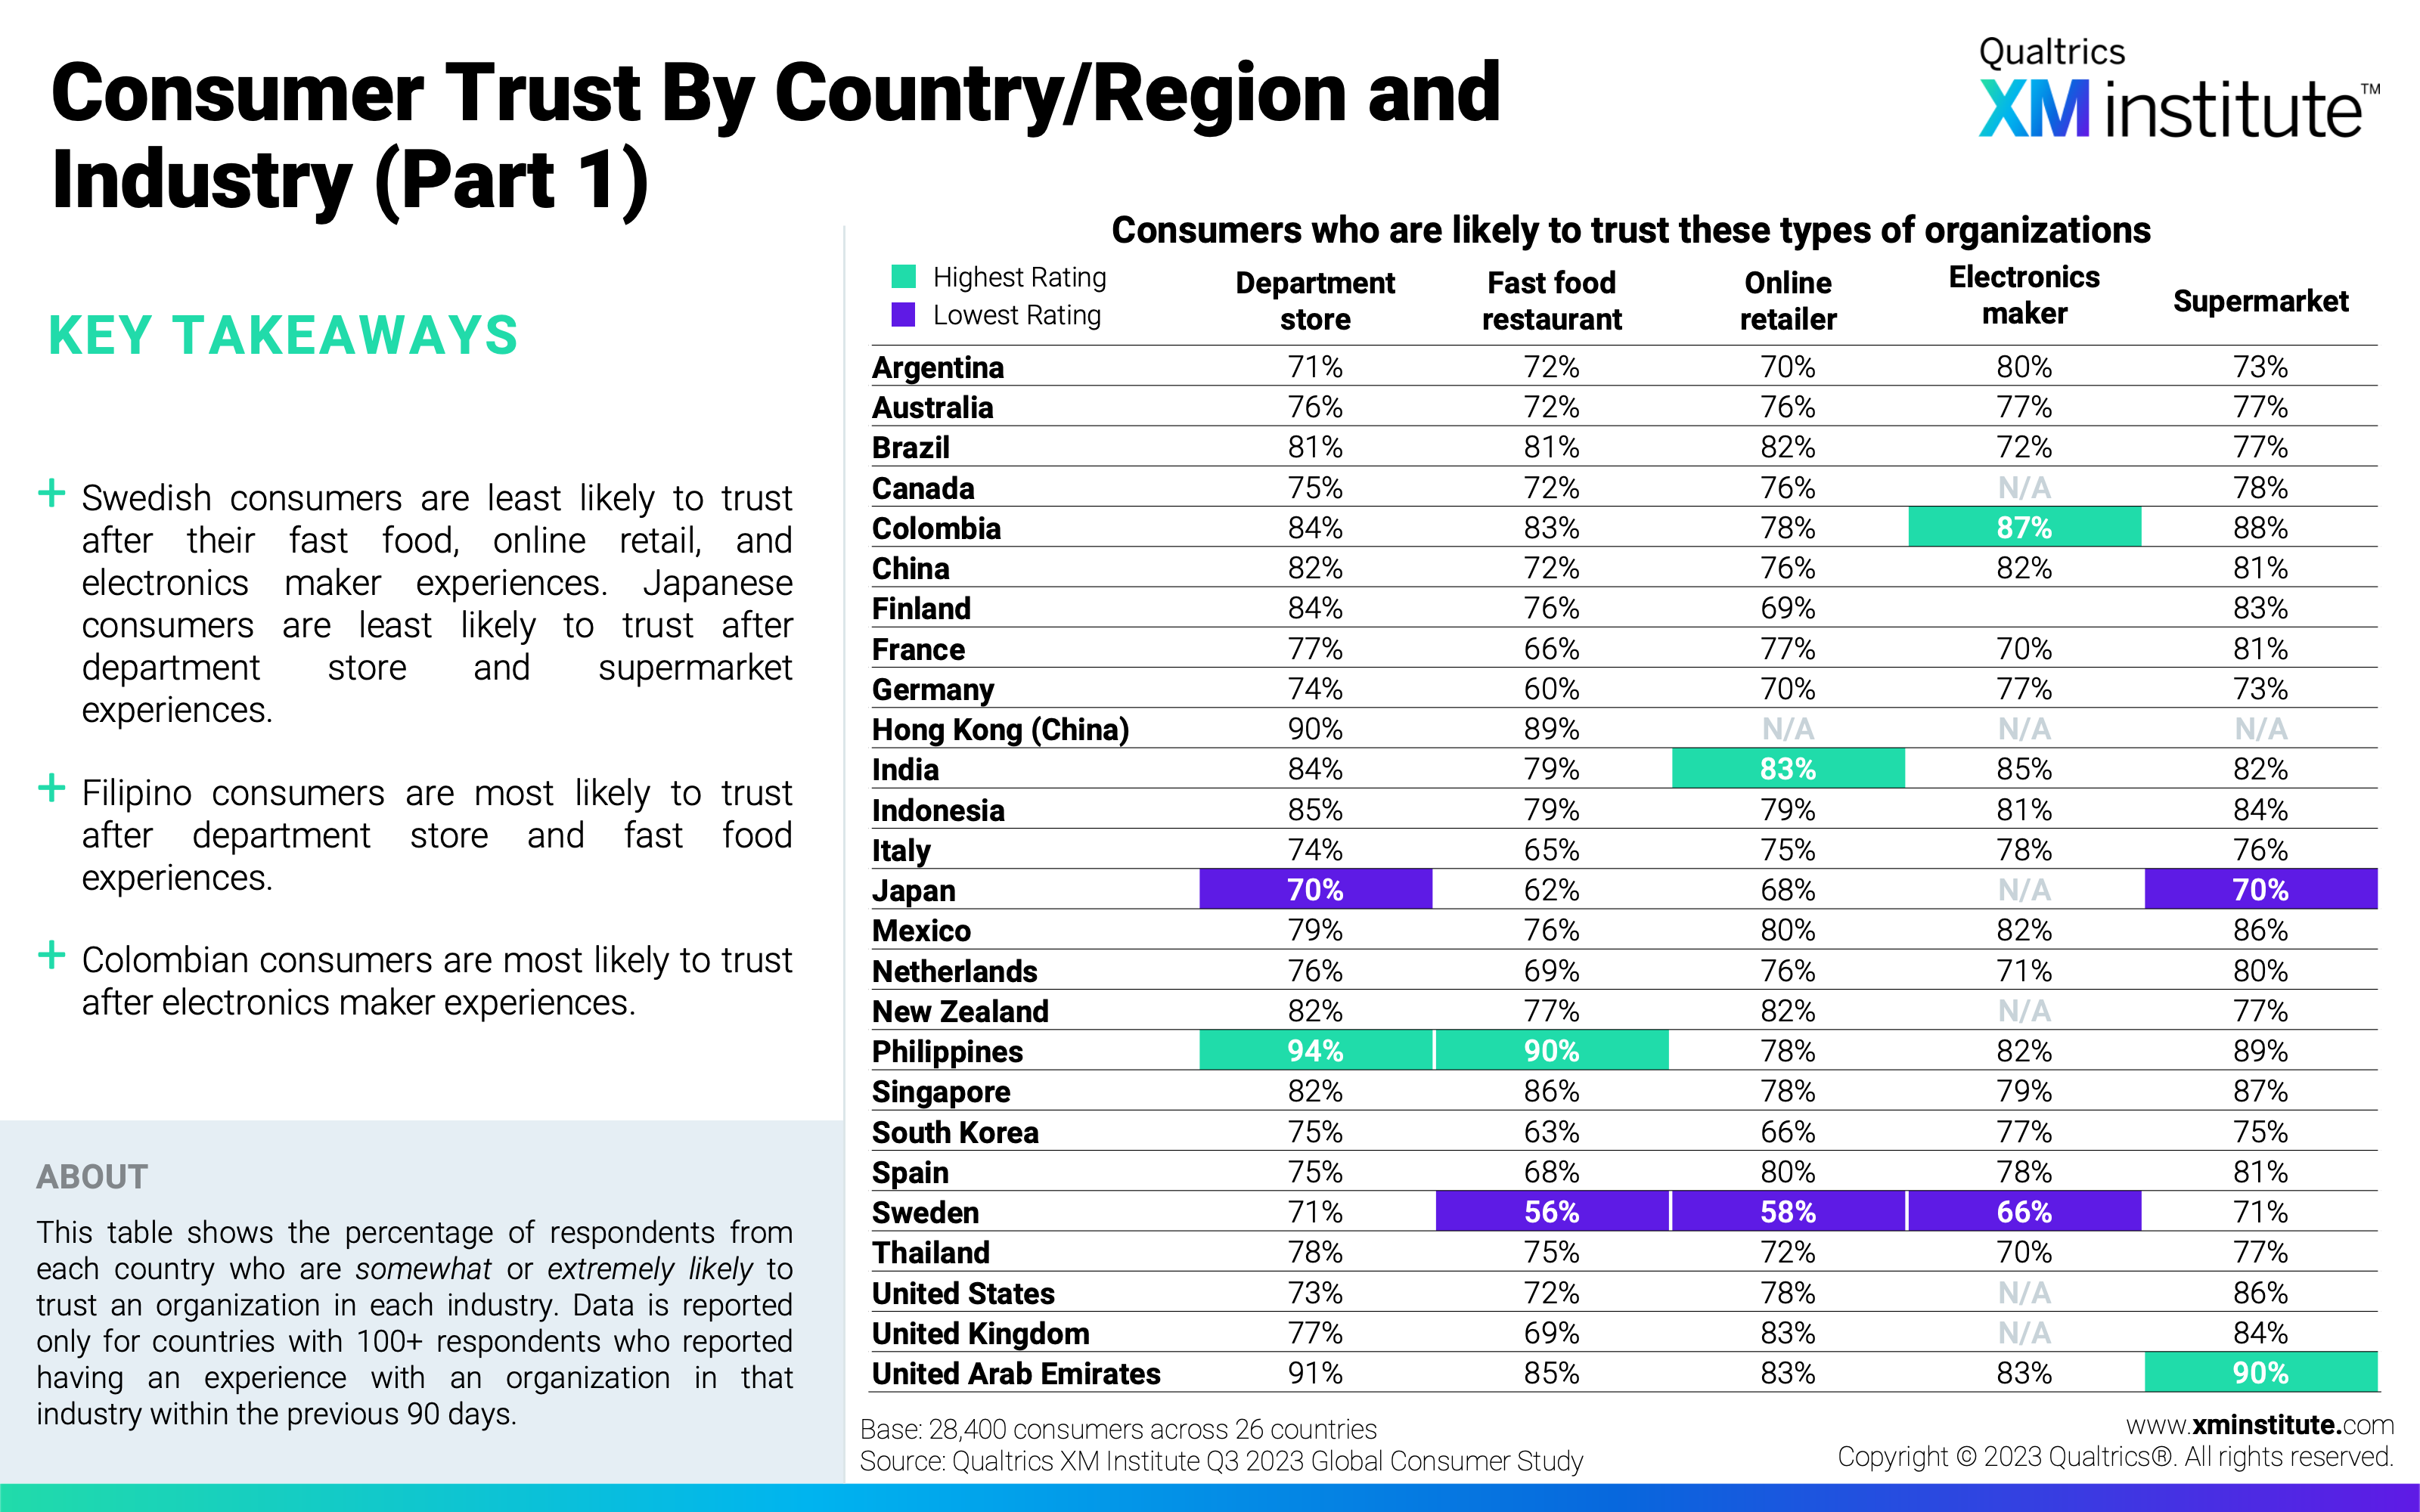
- Consumer Trust by Country/Region and Industry (Part 1) (see Figure 13)
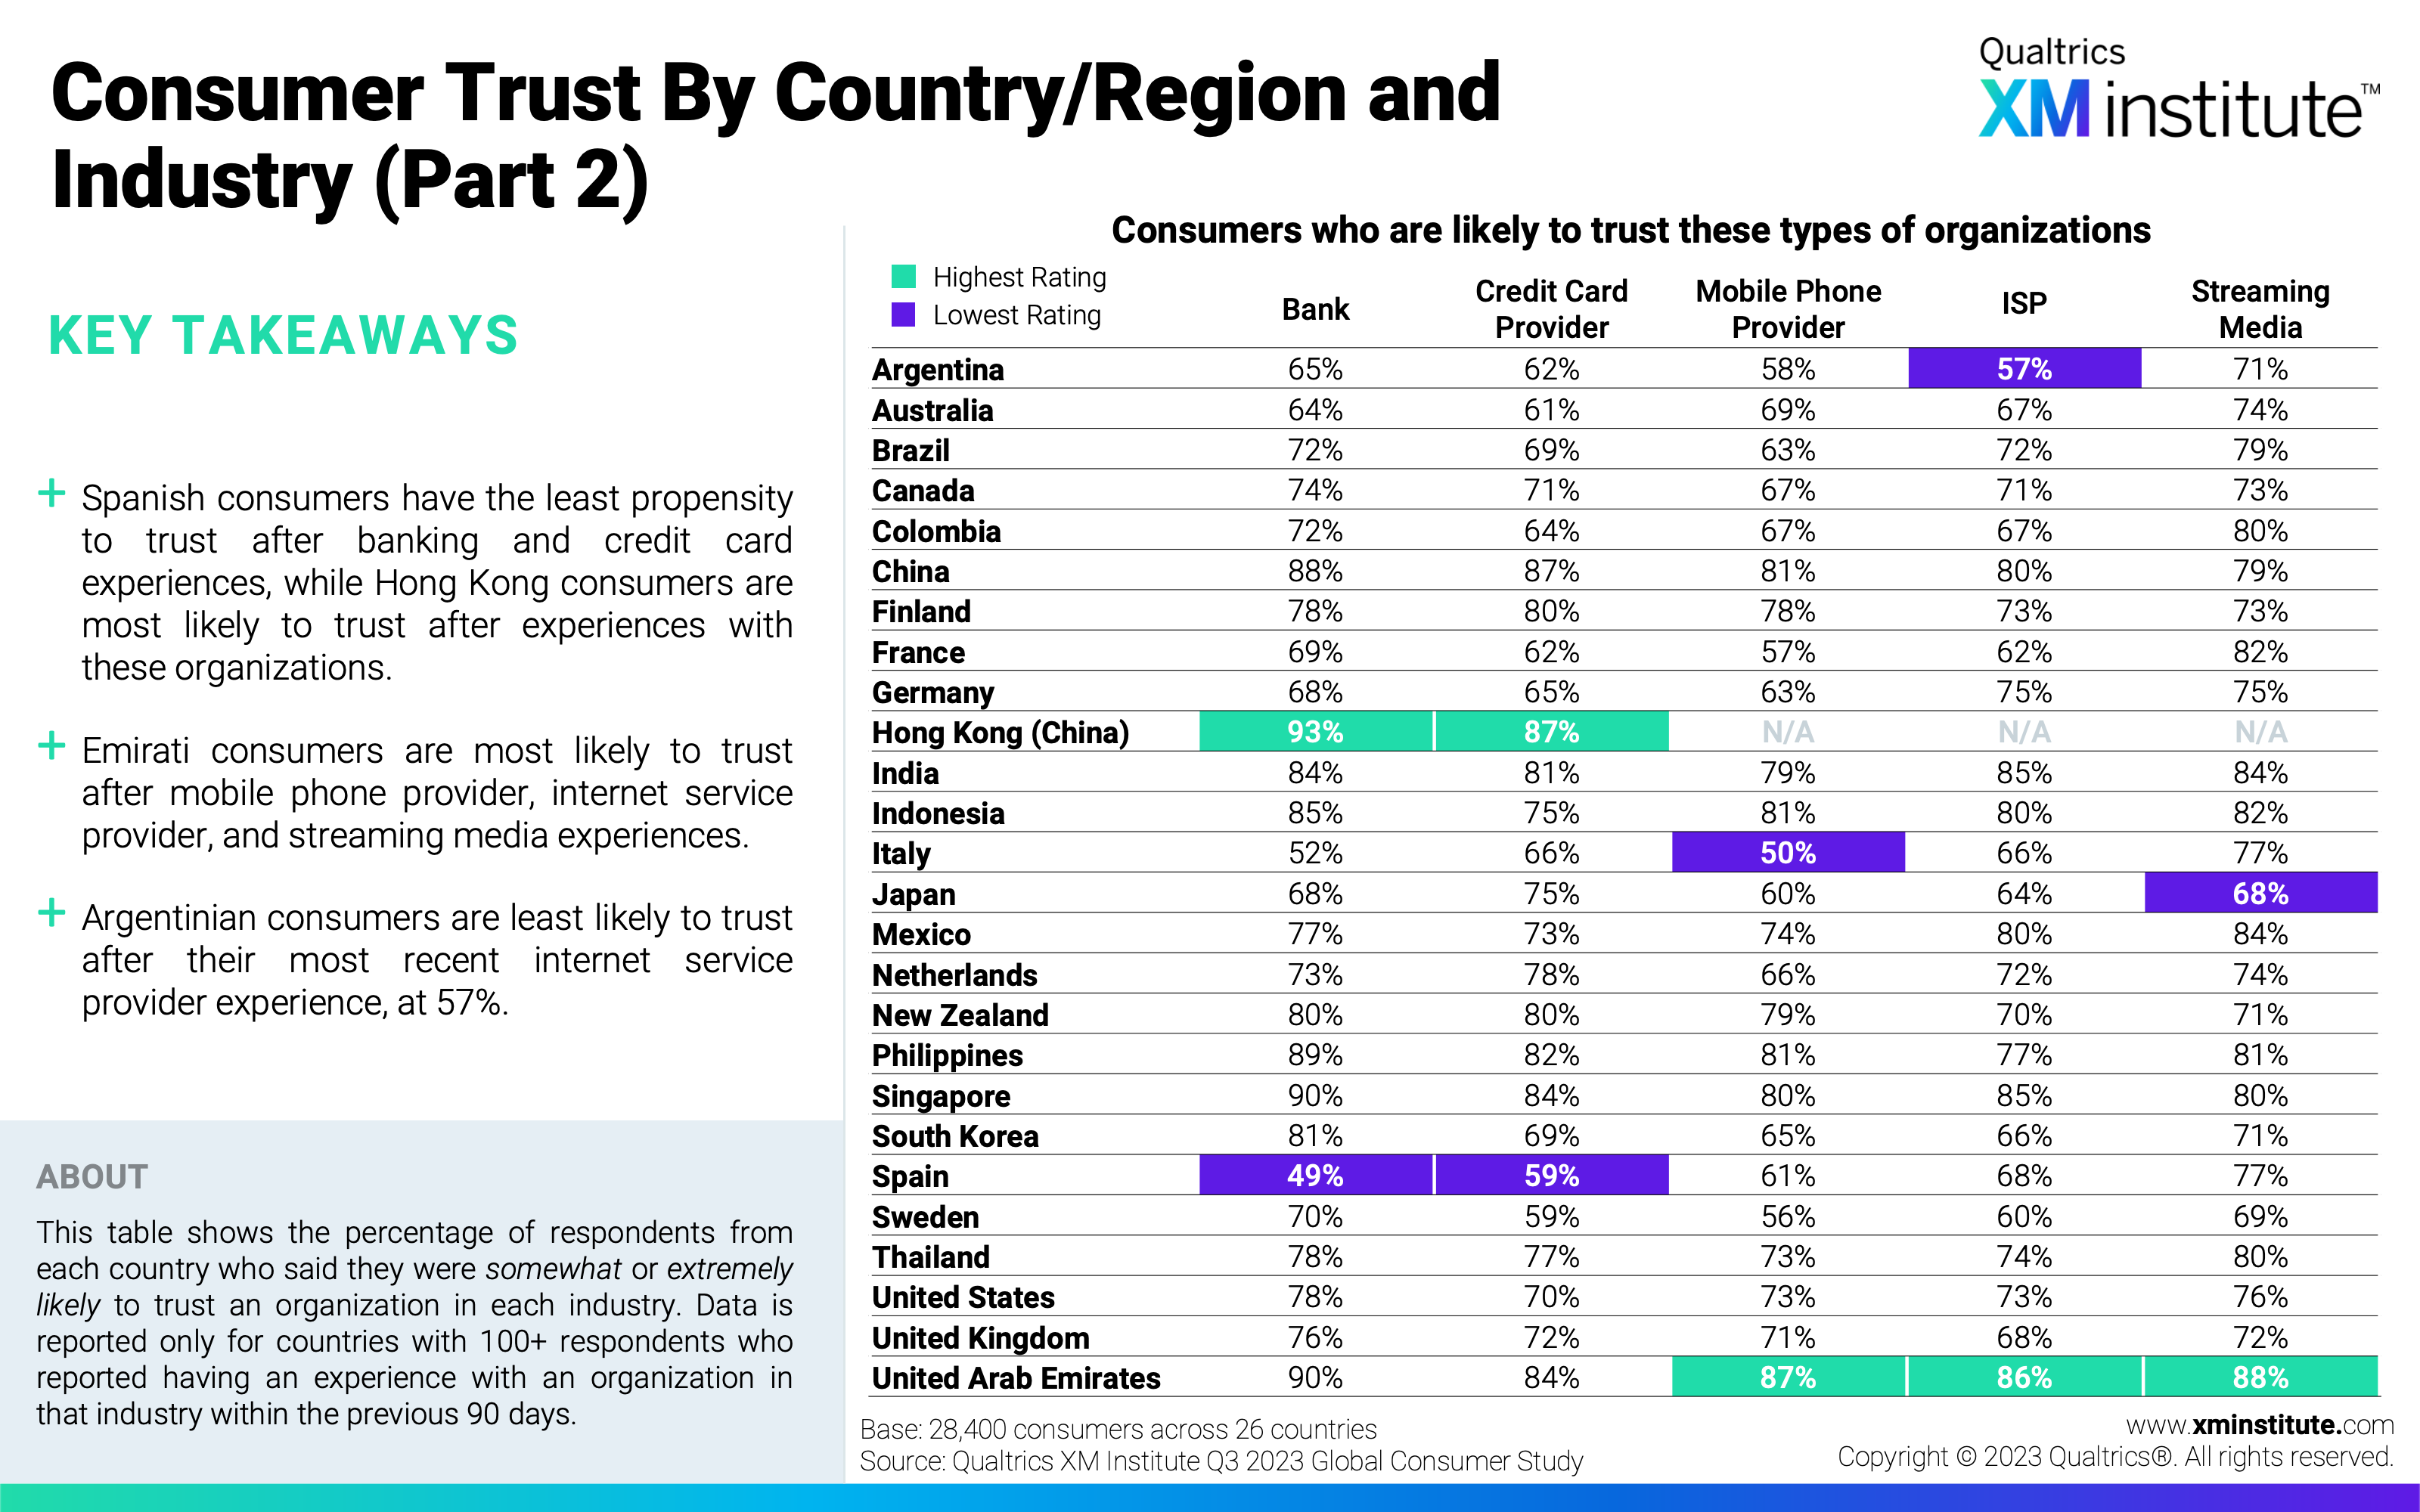
- Consumer Trust by Country/Region and Industry (Part 2) (see Figure 14)
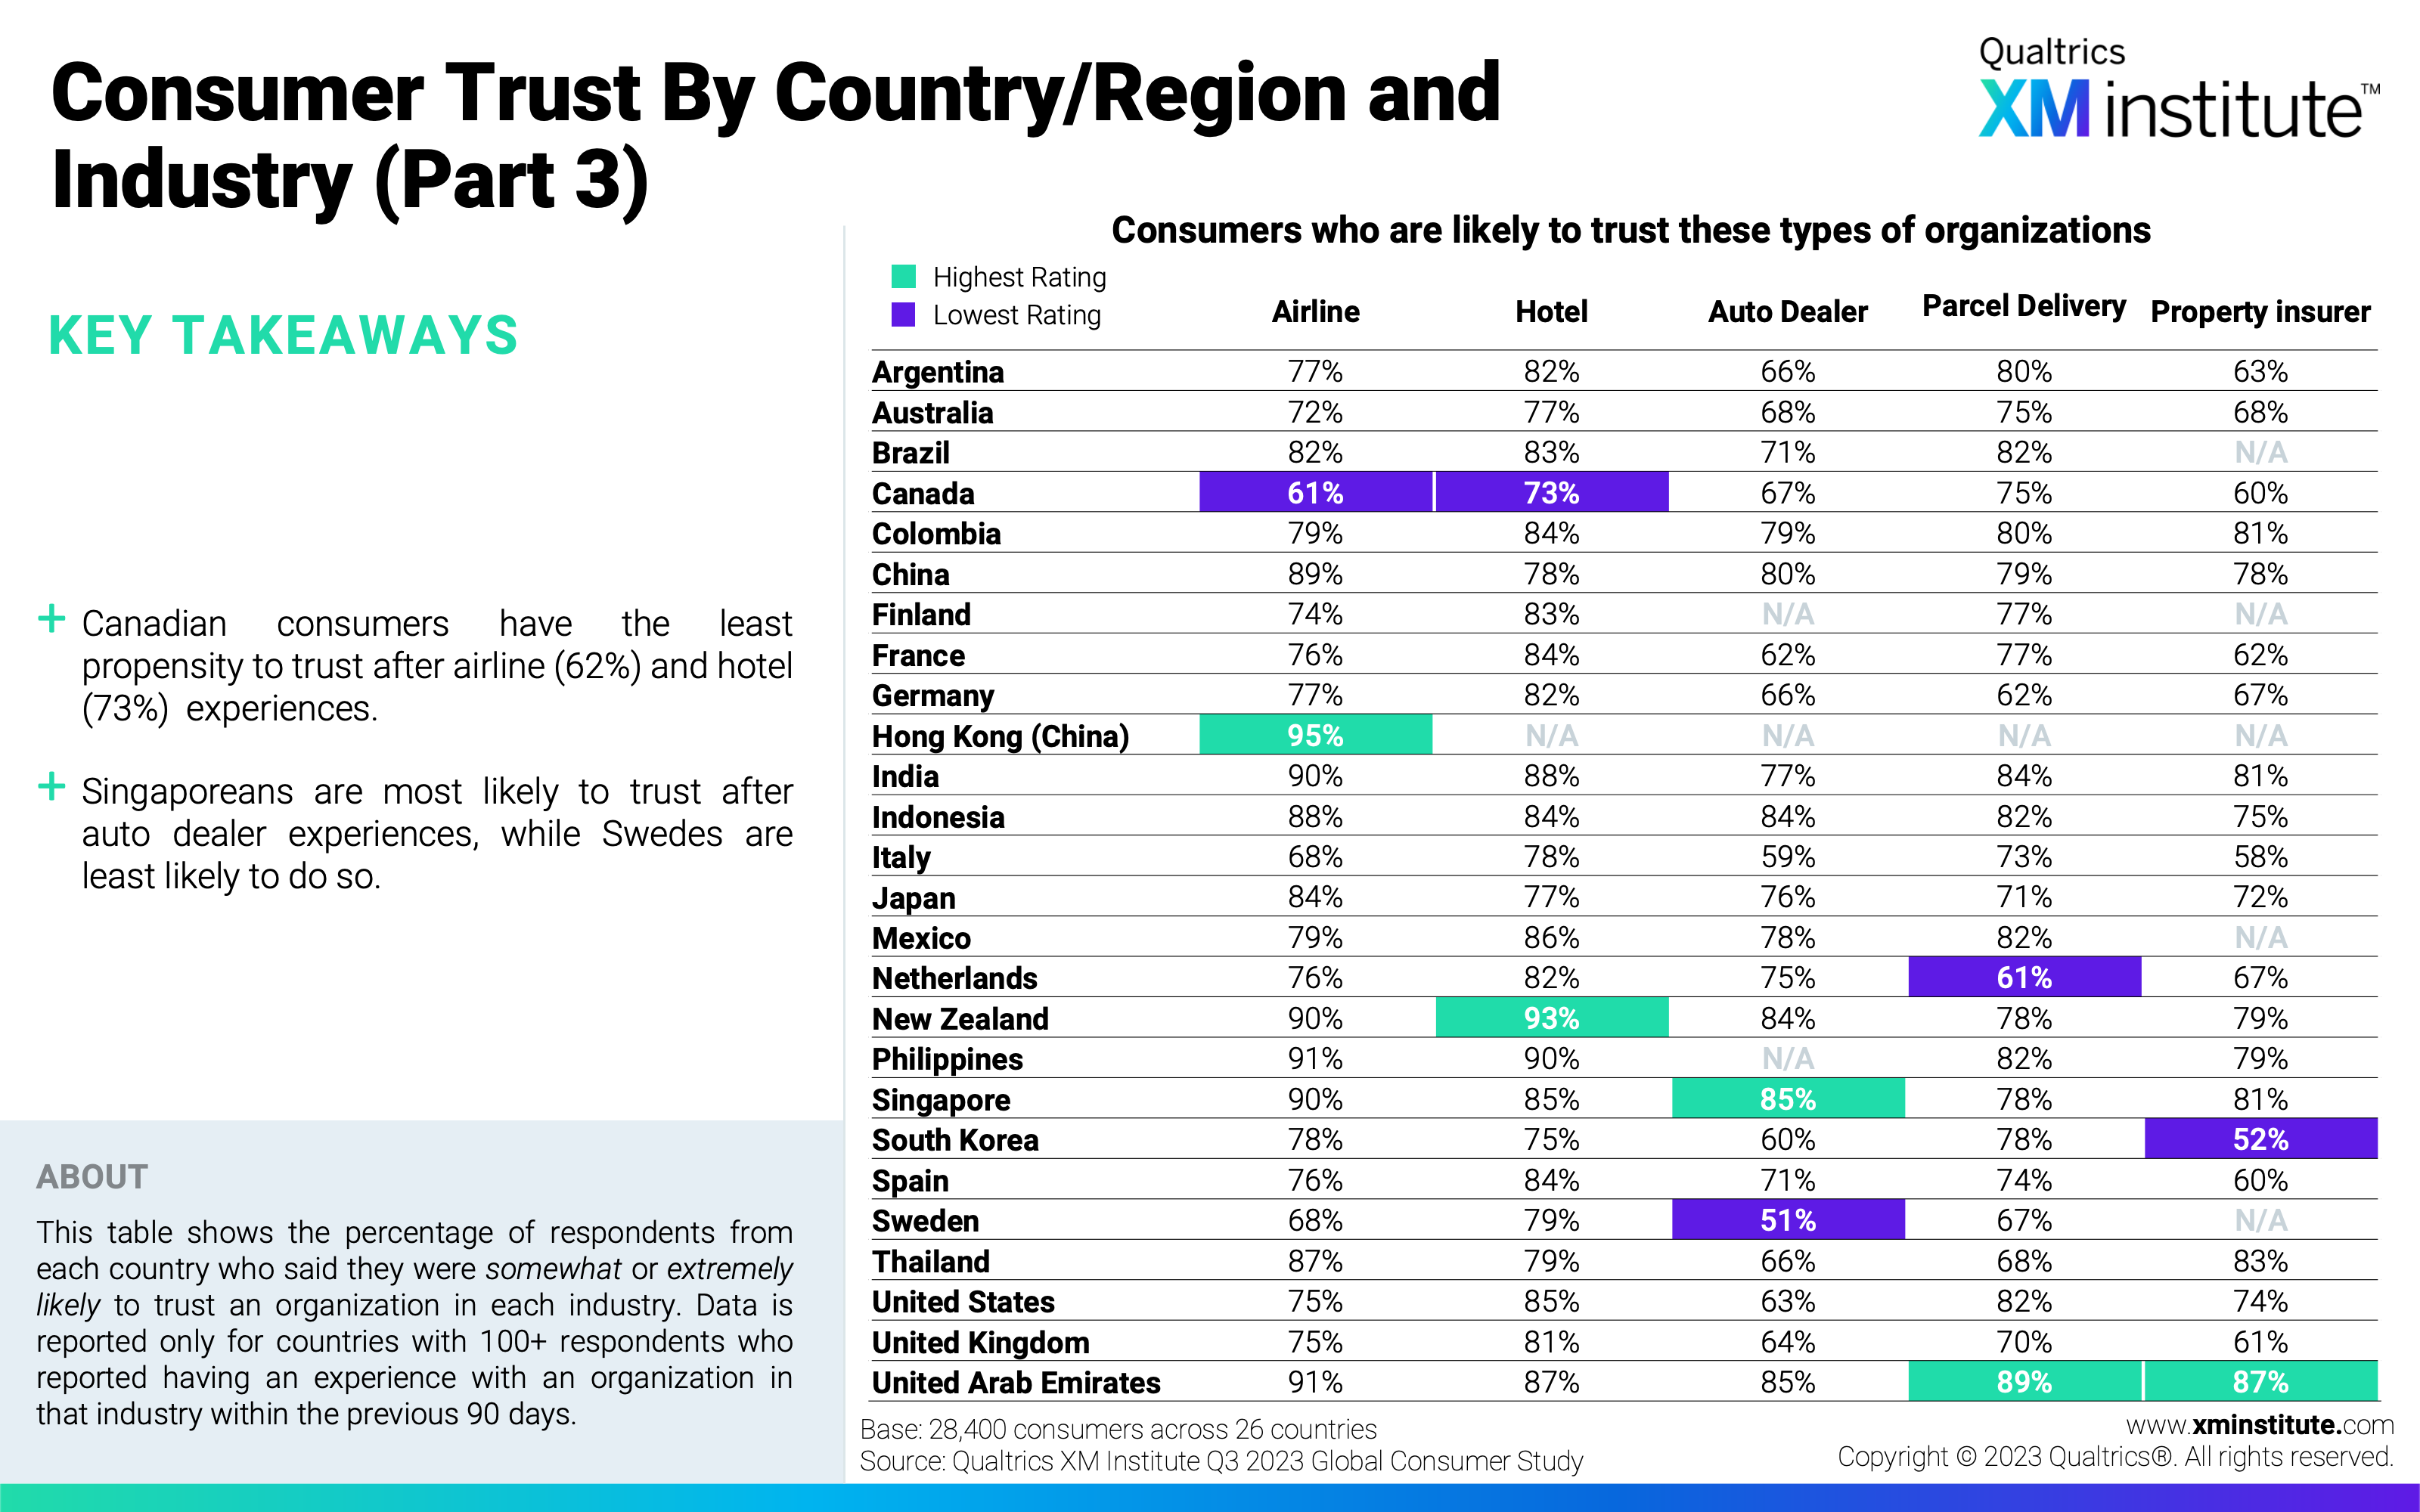
- Consumer Trust by Country/Region and Industry (Part 3) (see Figure 15)
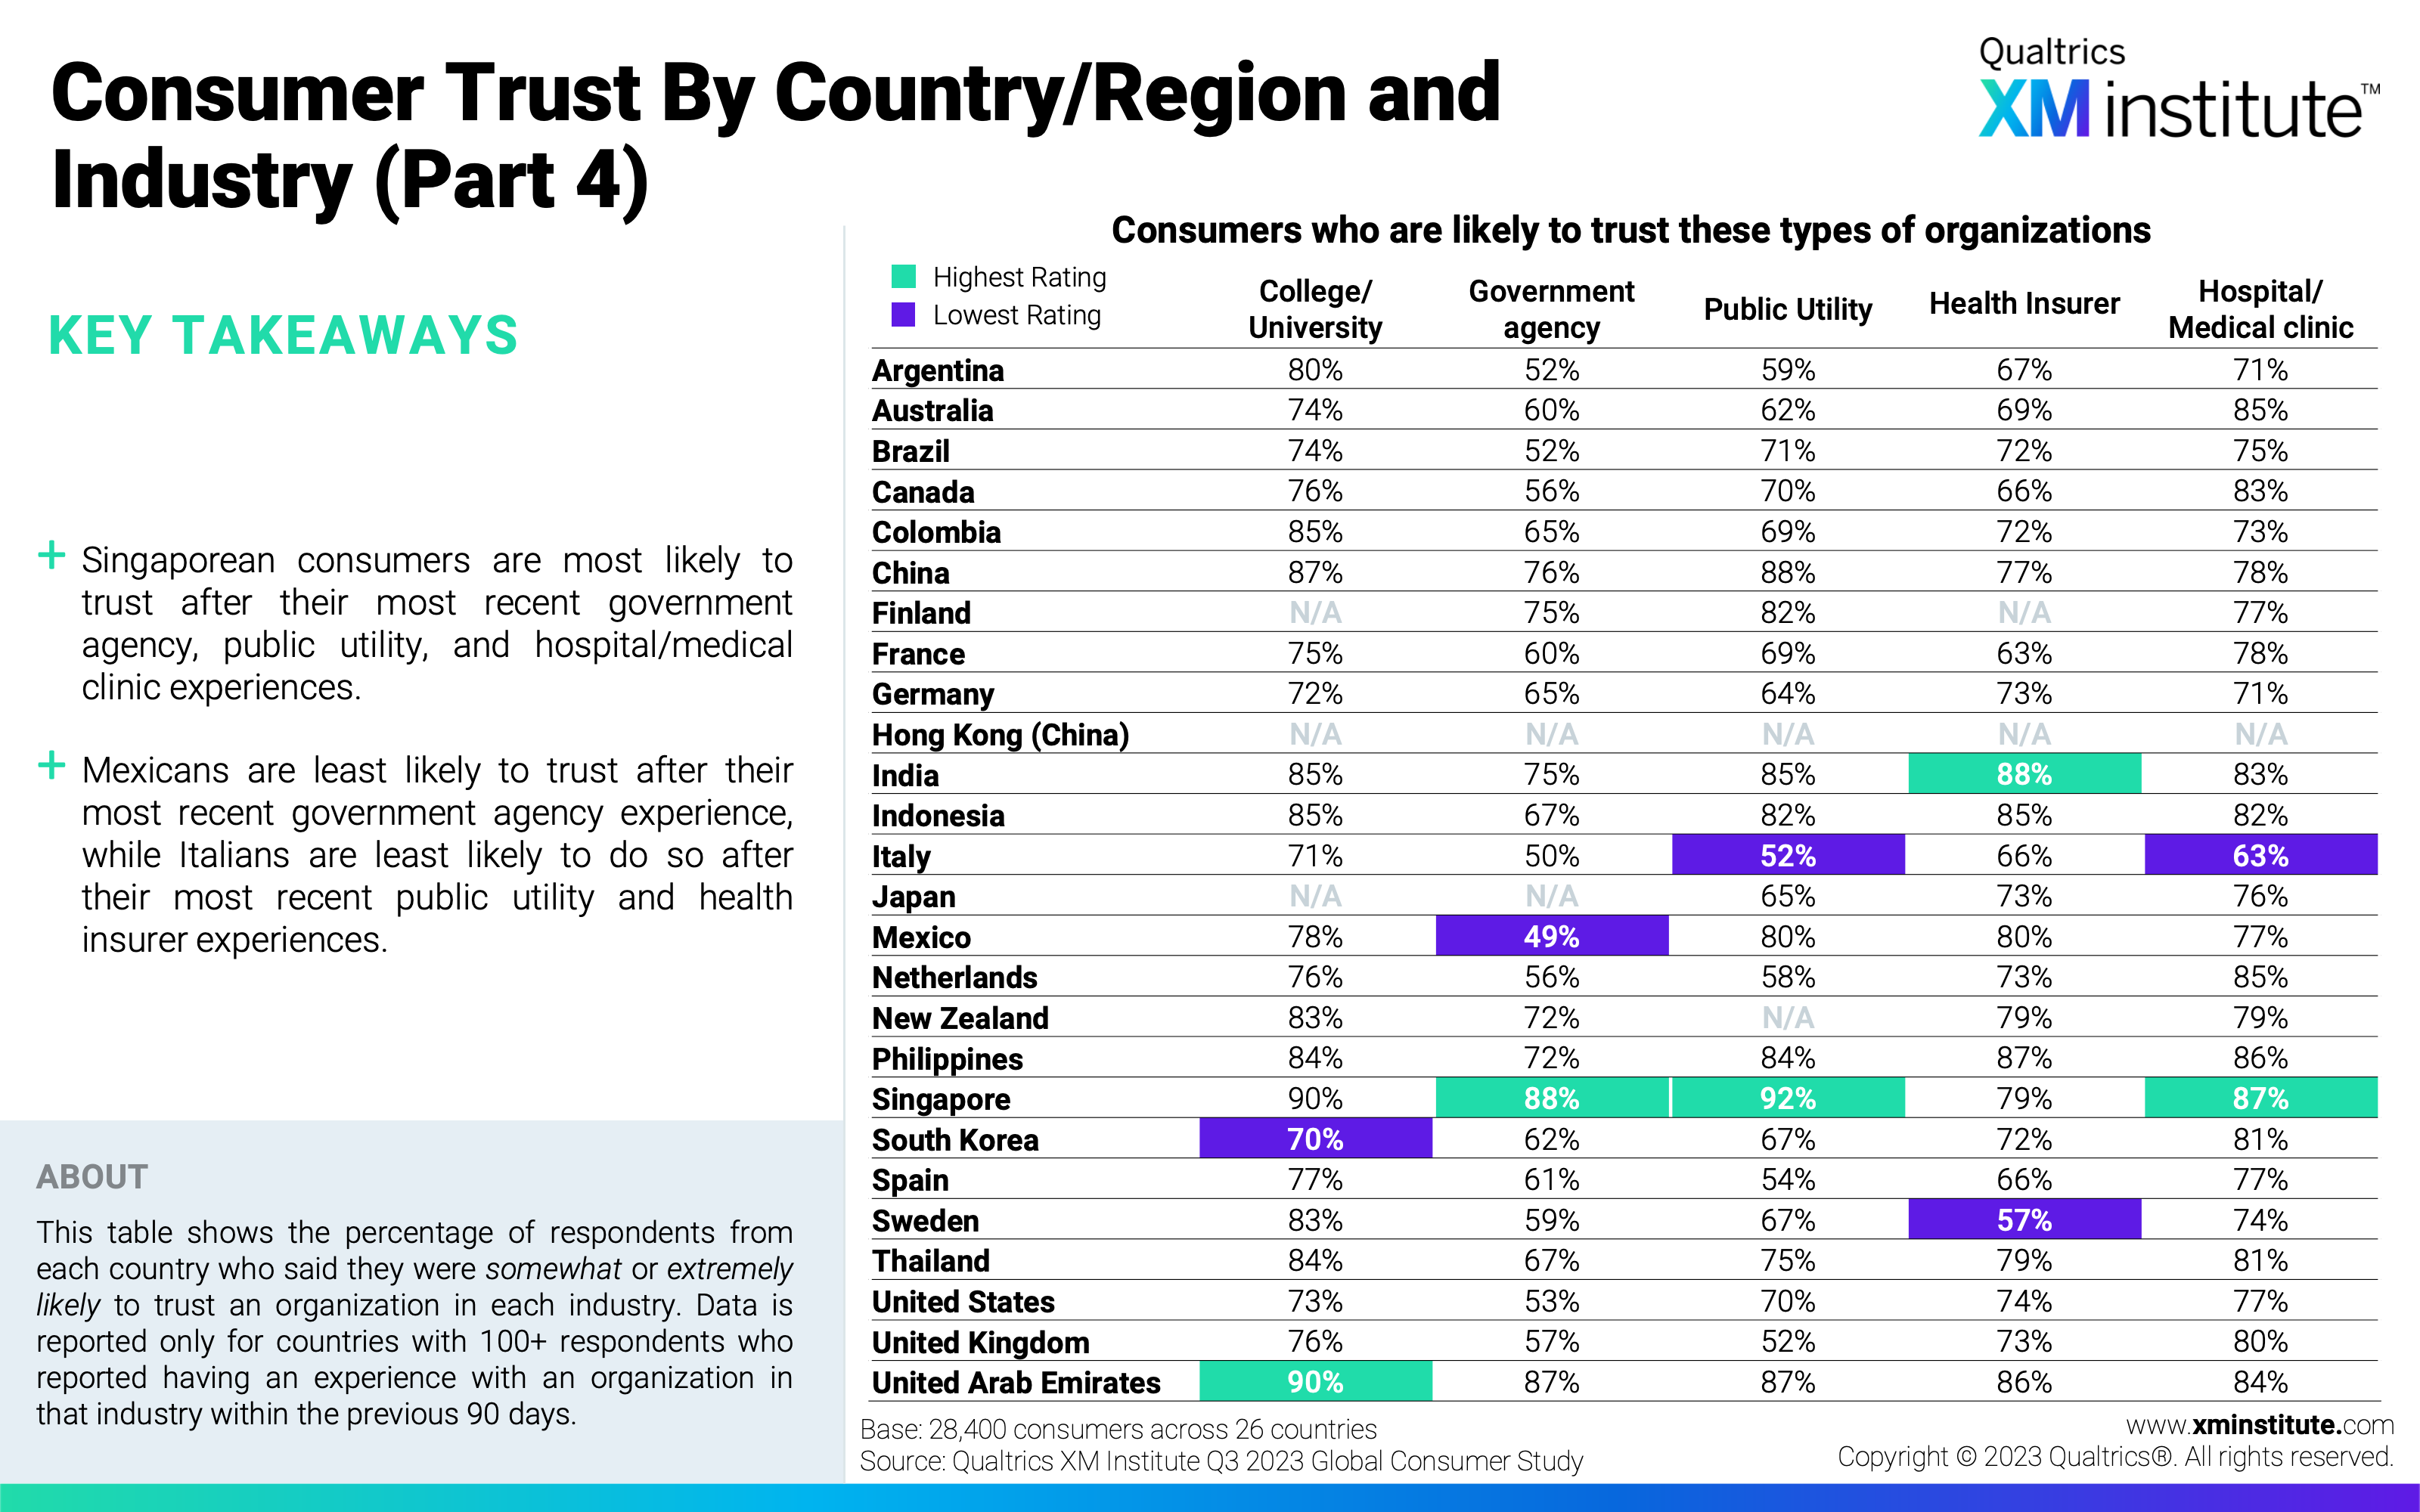
- Consumer Trust by Country/Region and Industry (Part 4) (see Figure 16)
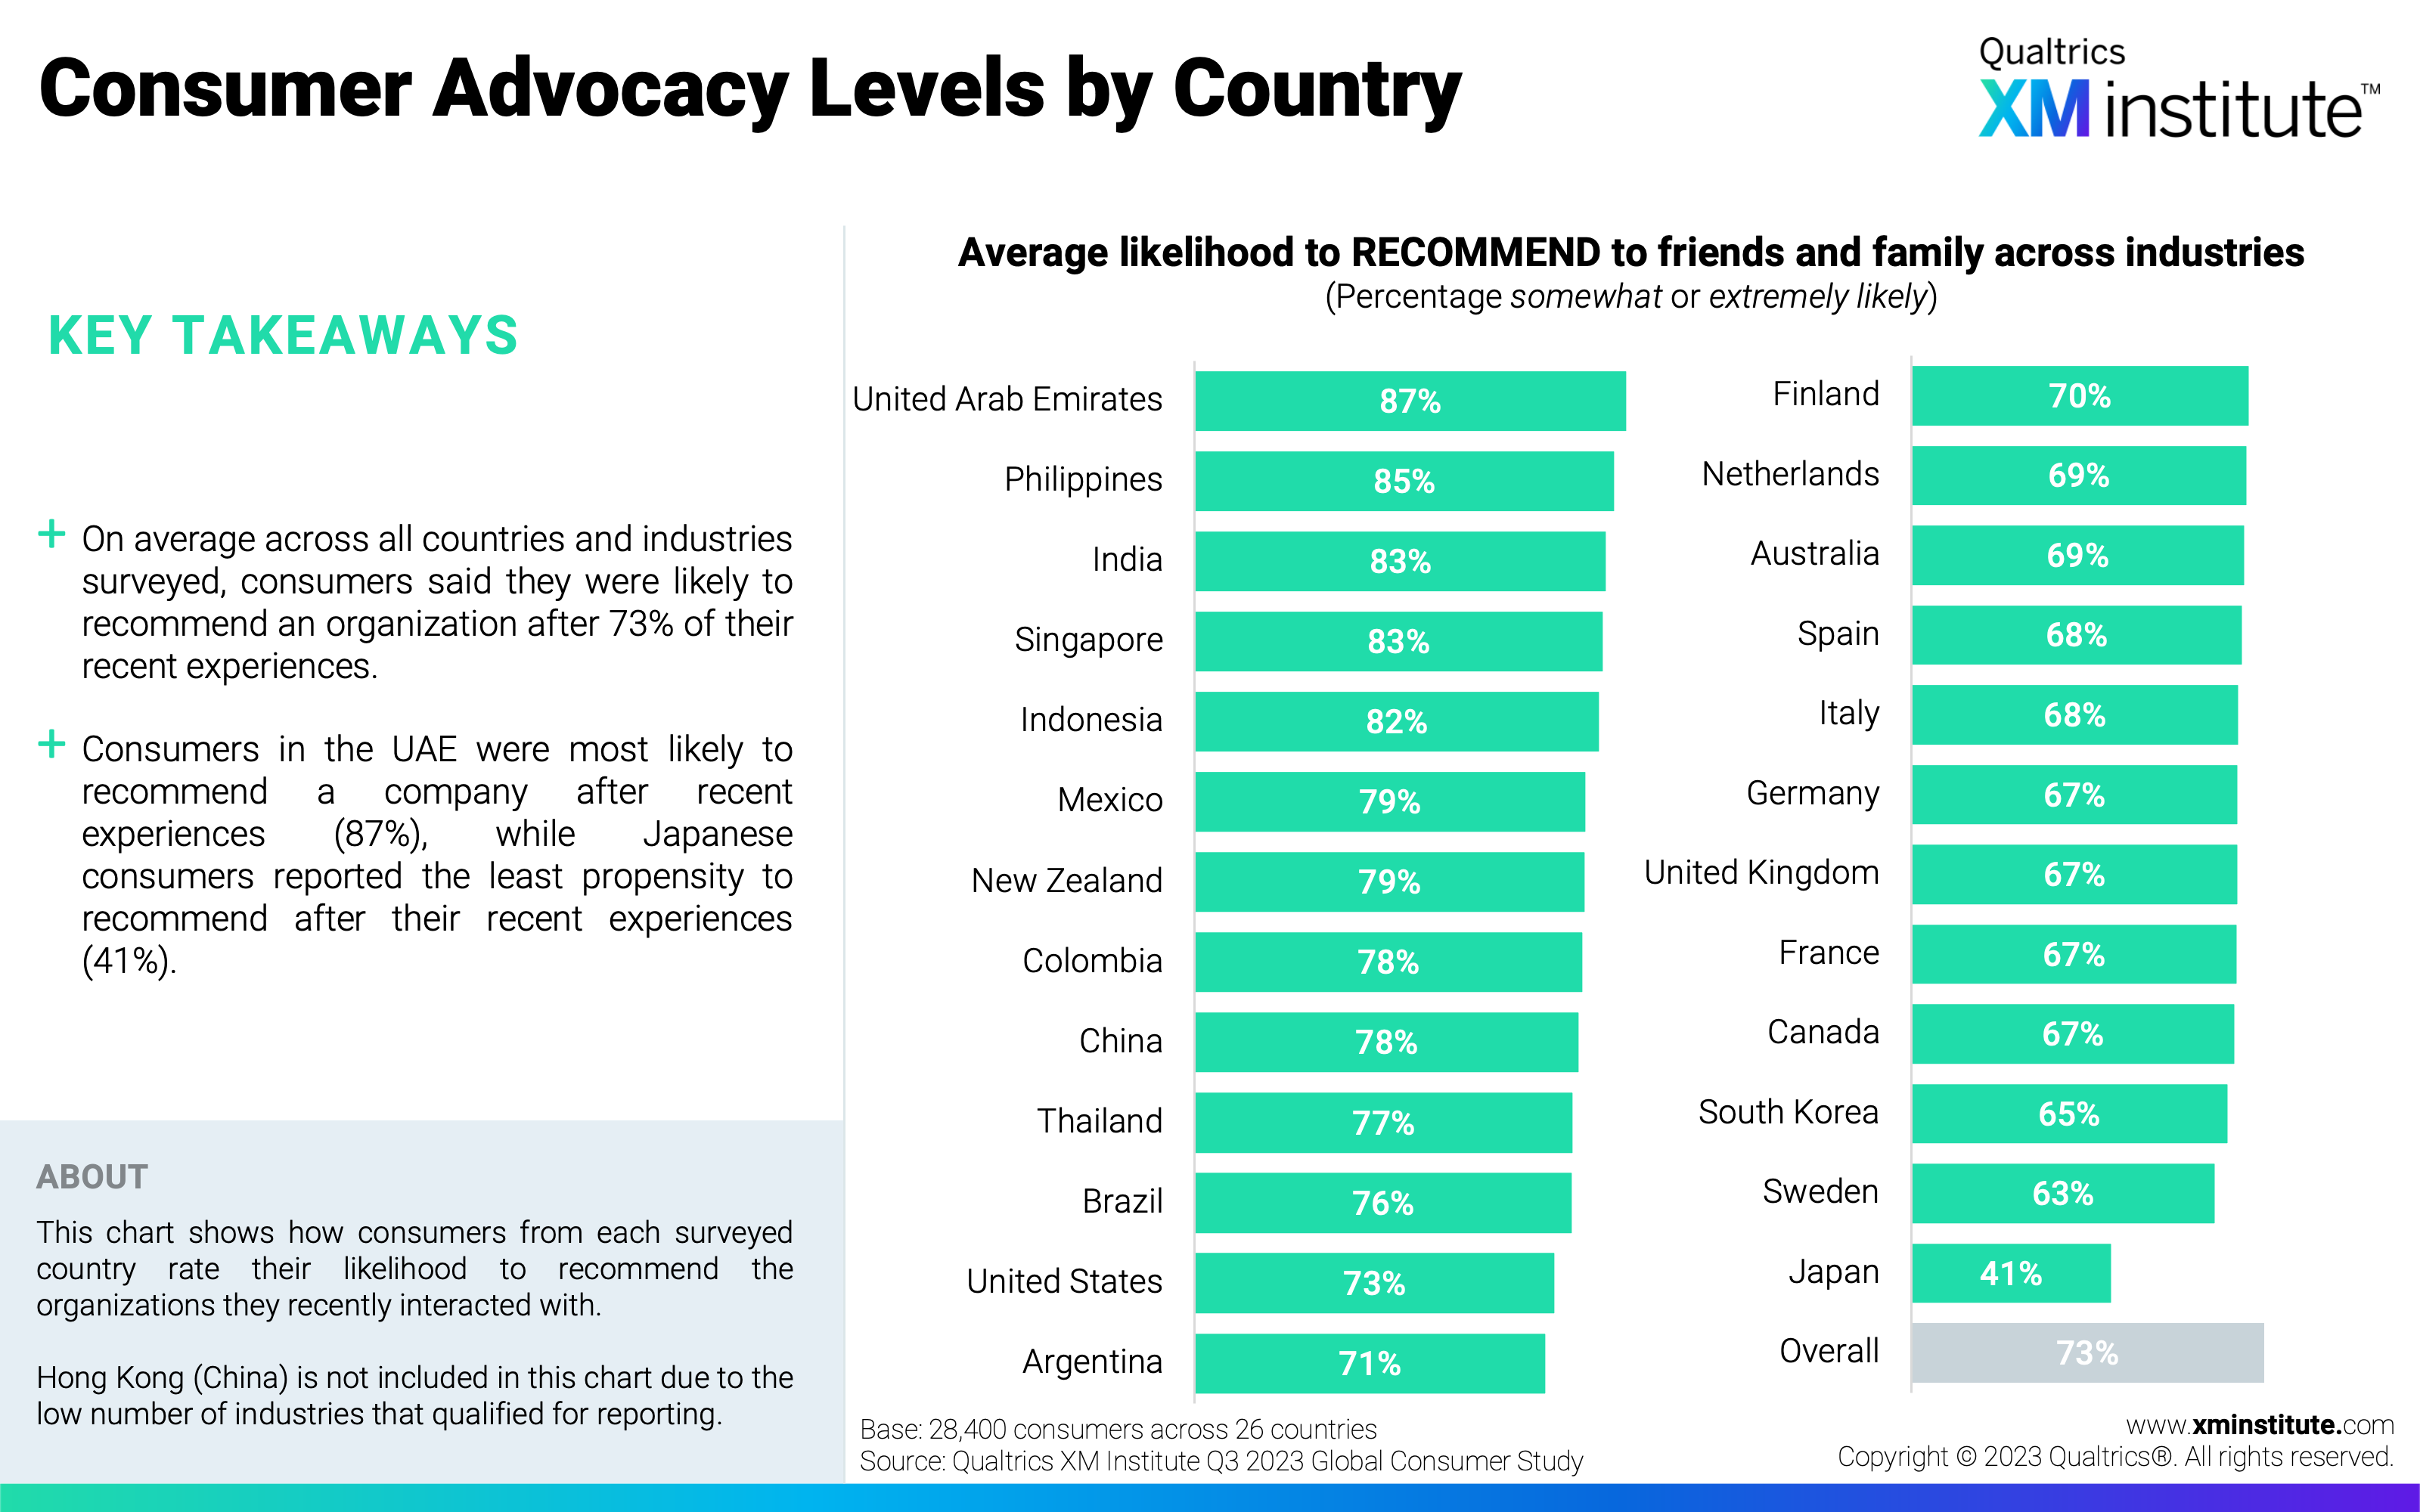
- Consumer Advocacy Levels by Country/Region (see Figure 17)
- Consumer Advocacy Level YoY Change by Country/Region (see Figure 18)
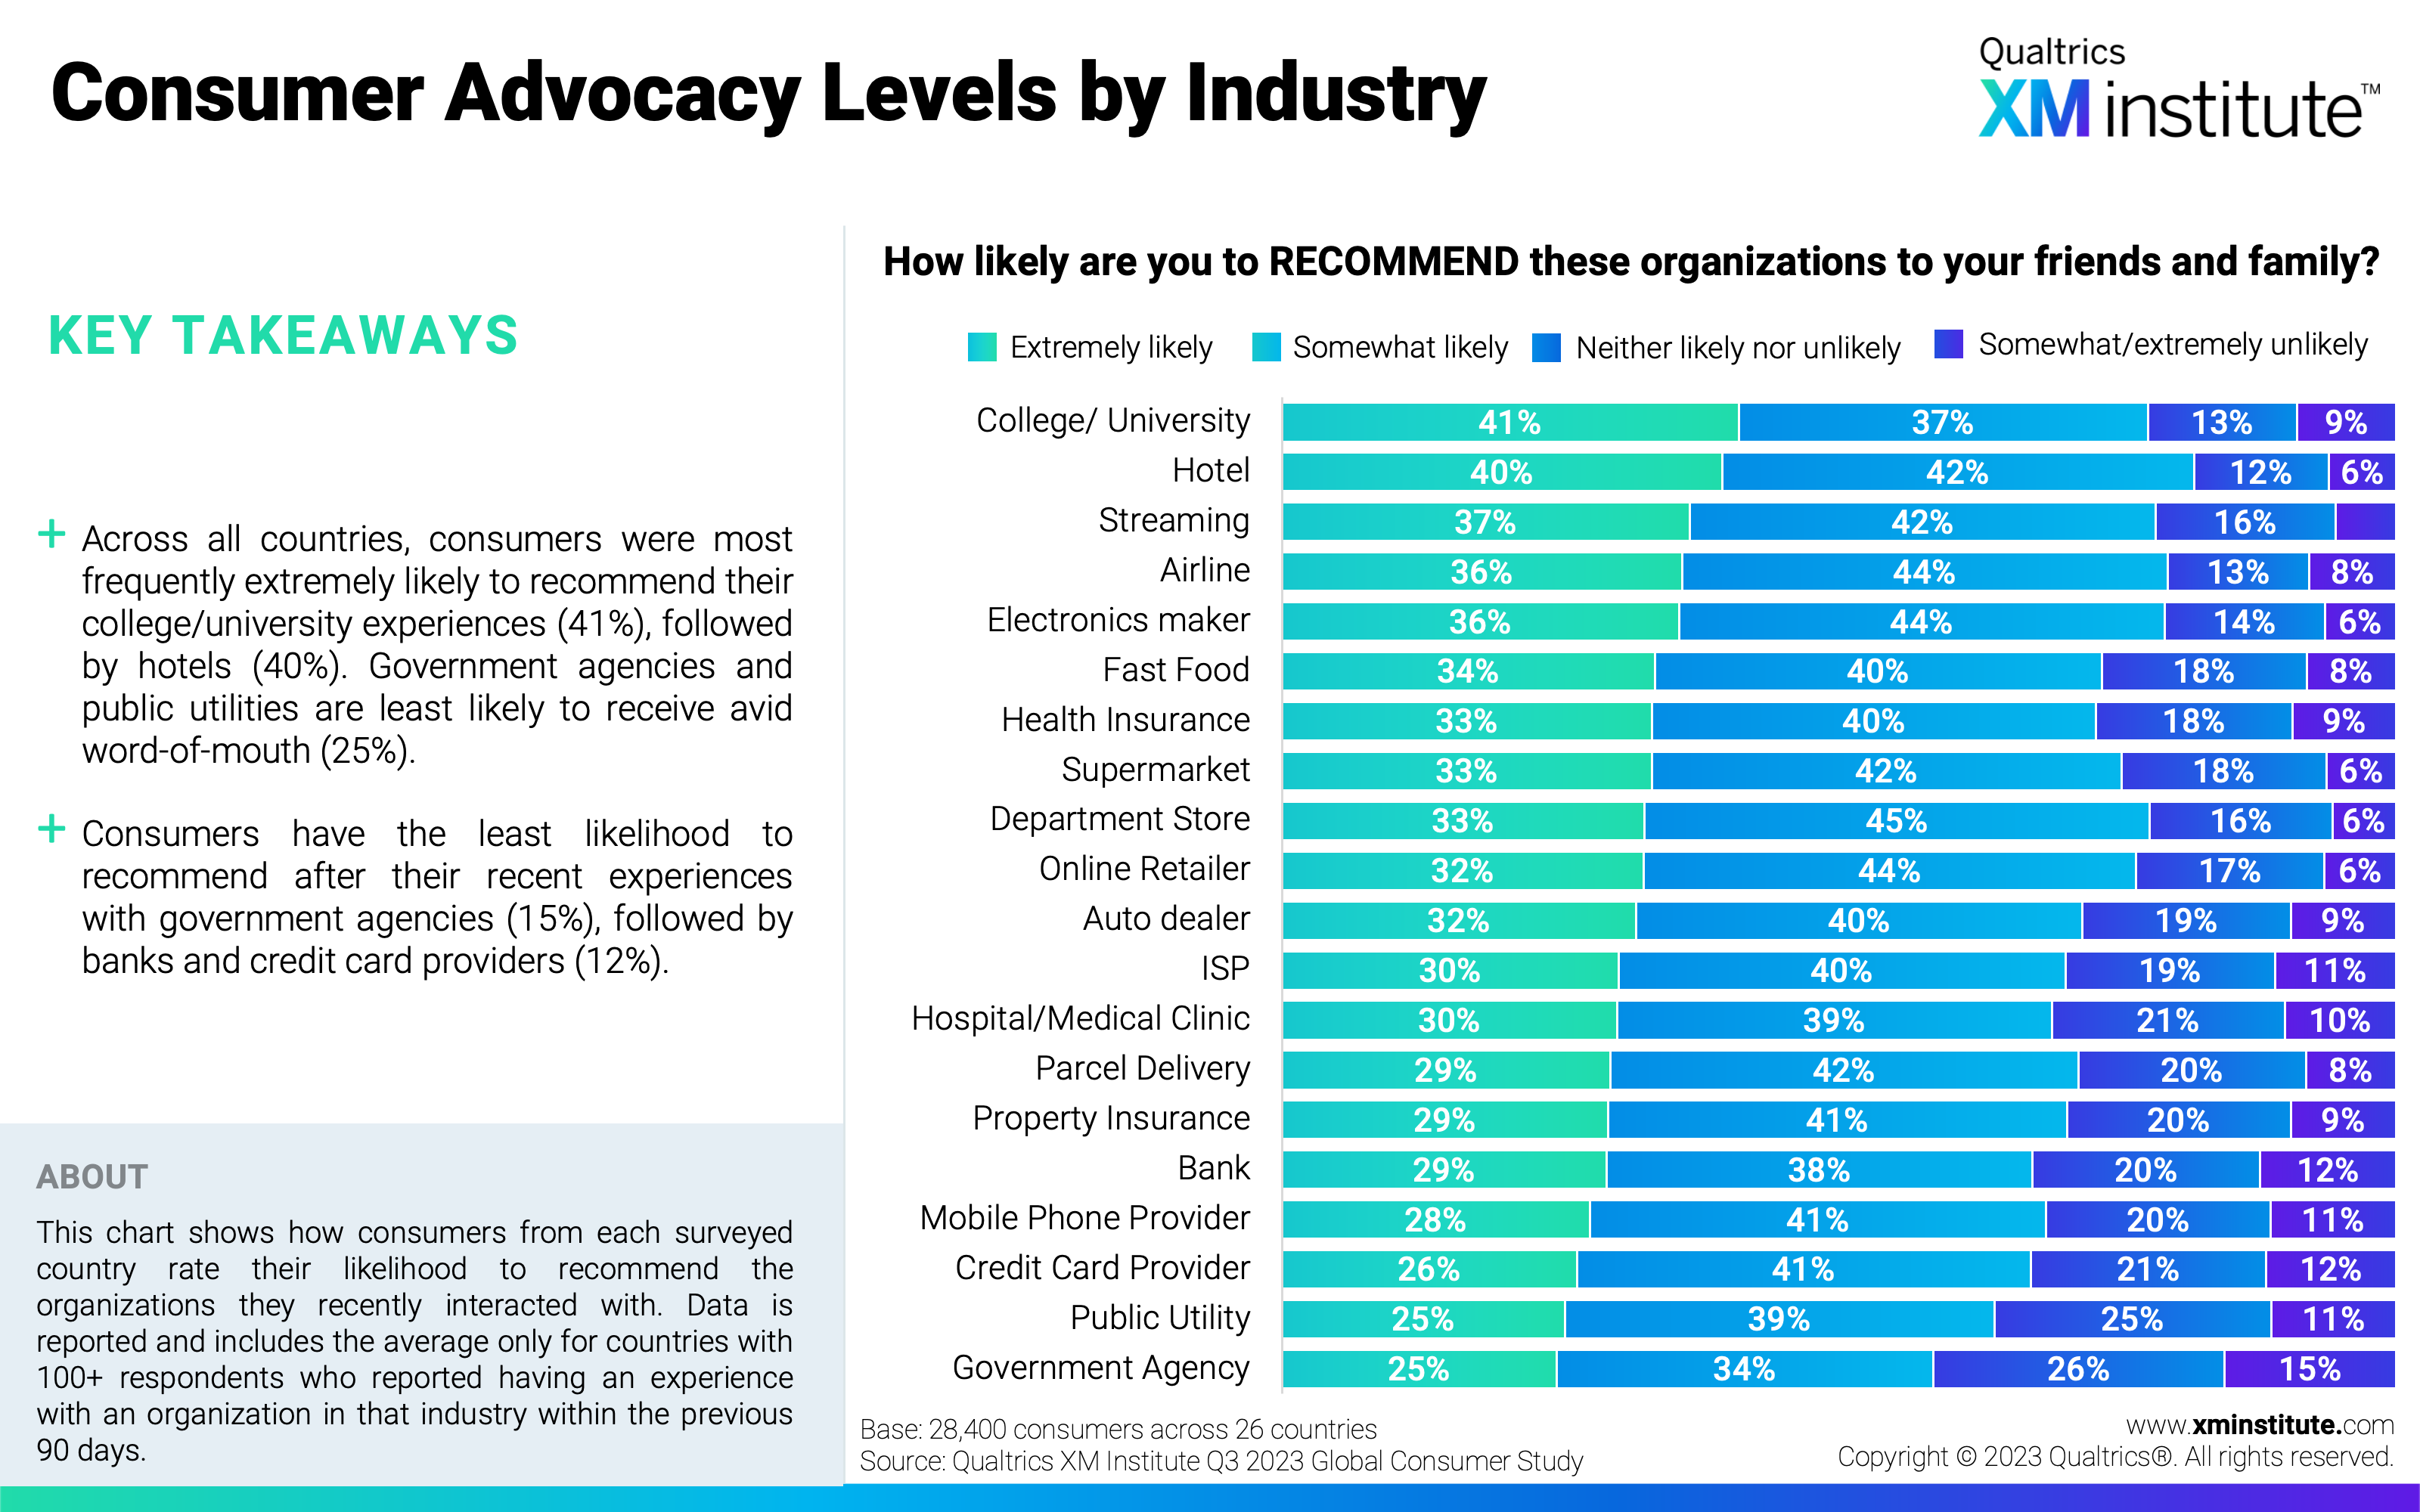
- Consumer Advocacy Level by Industry (see Figure 19)
- Consumer Advocacy Level YoY Change by Industry (see Figure 20)
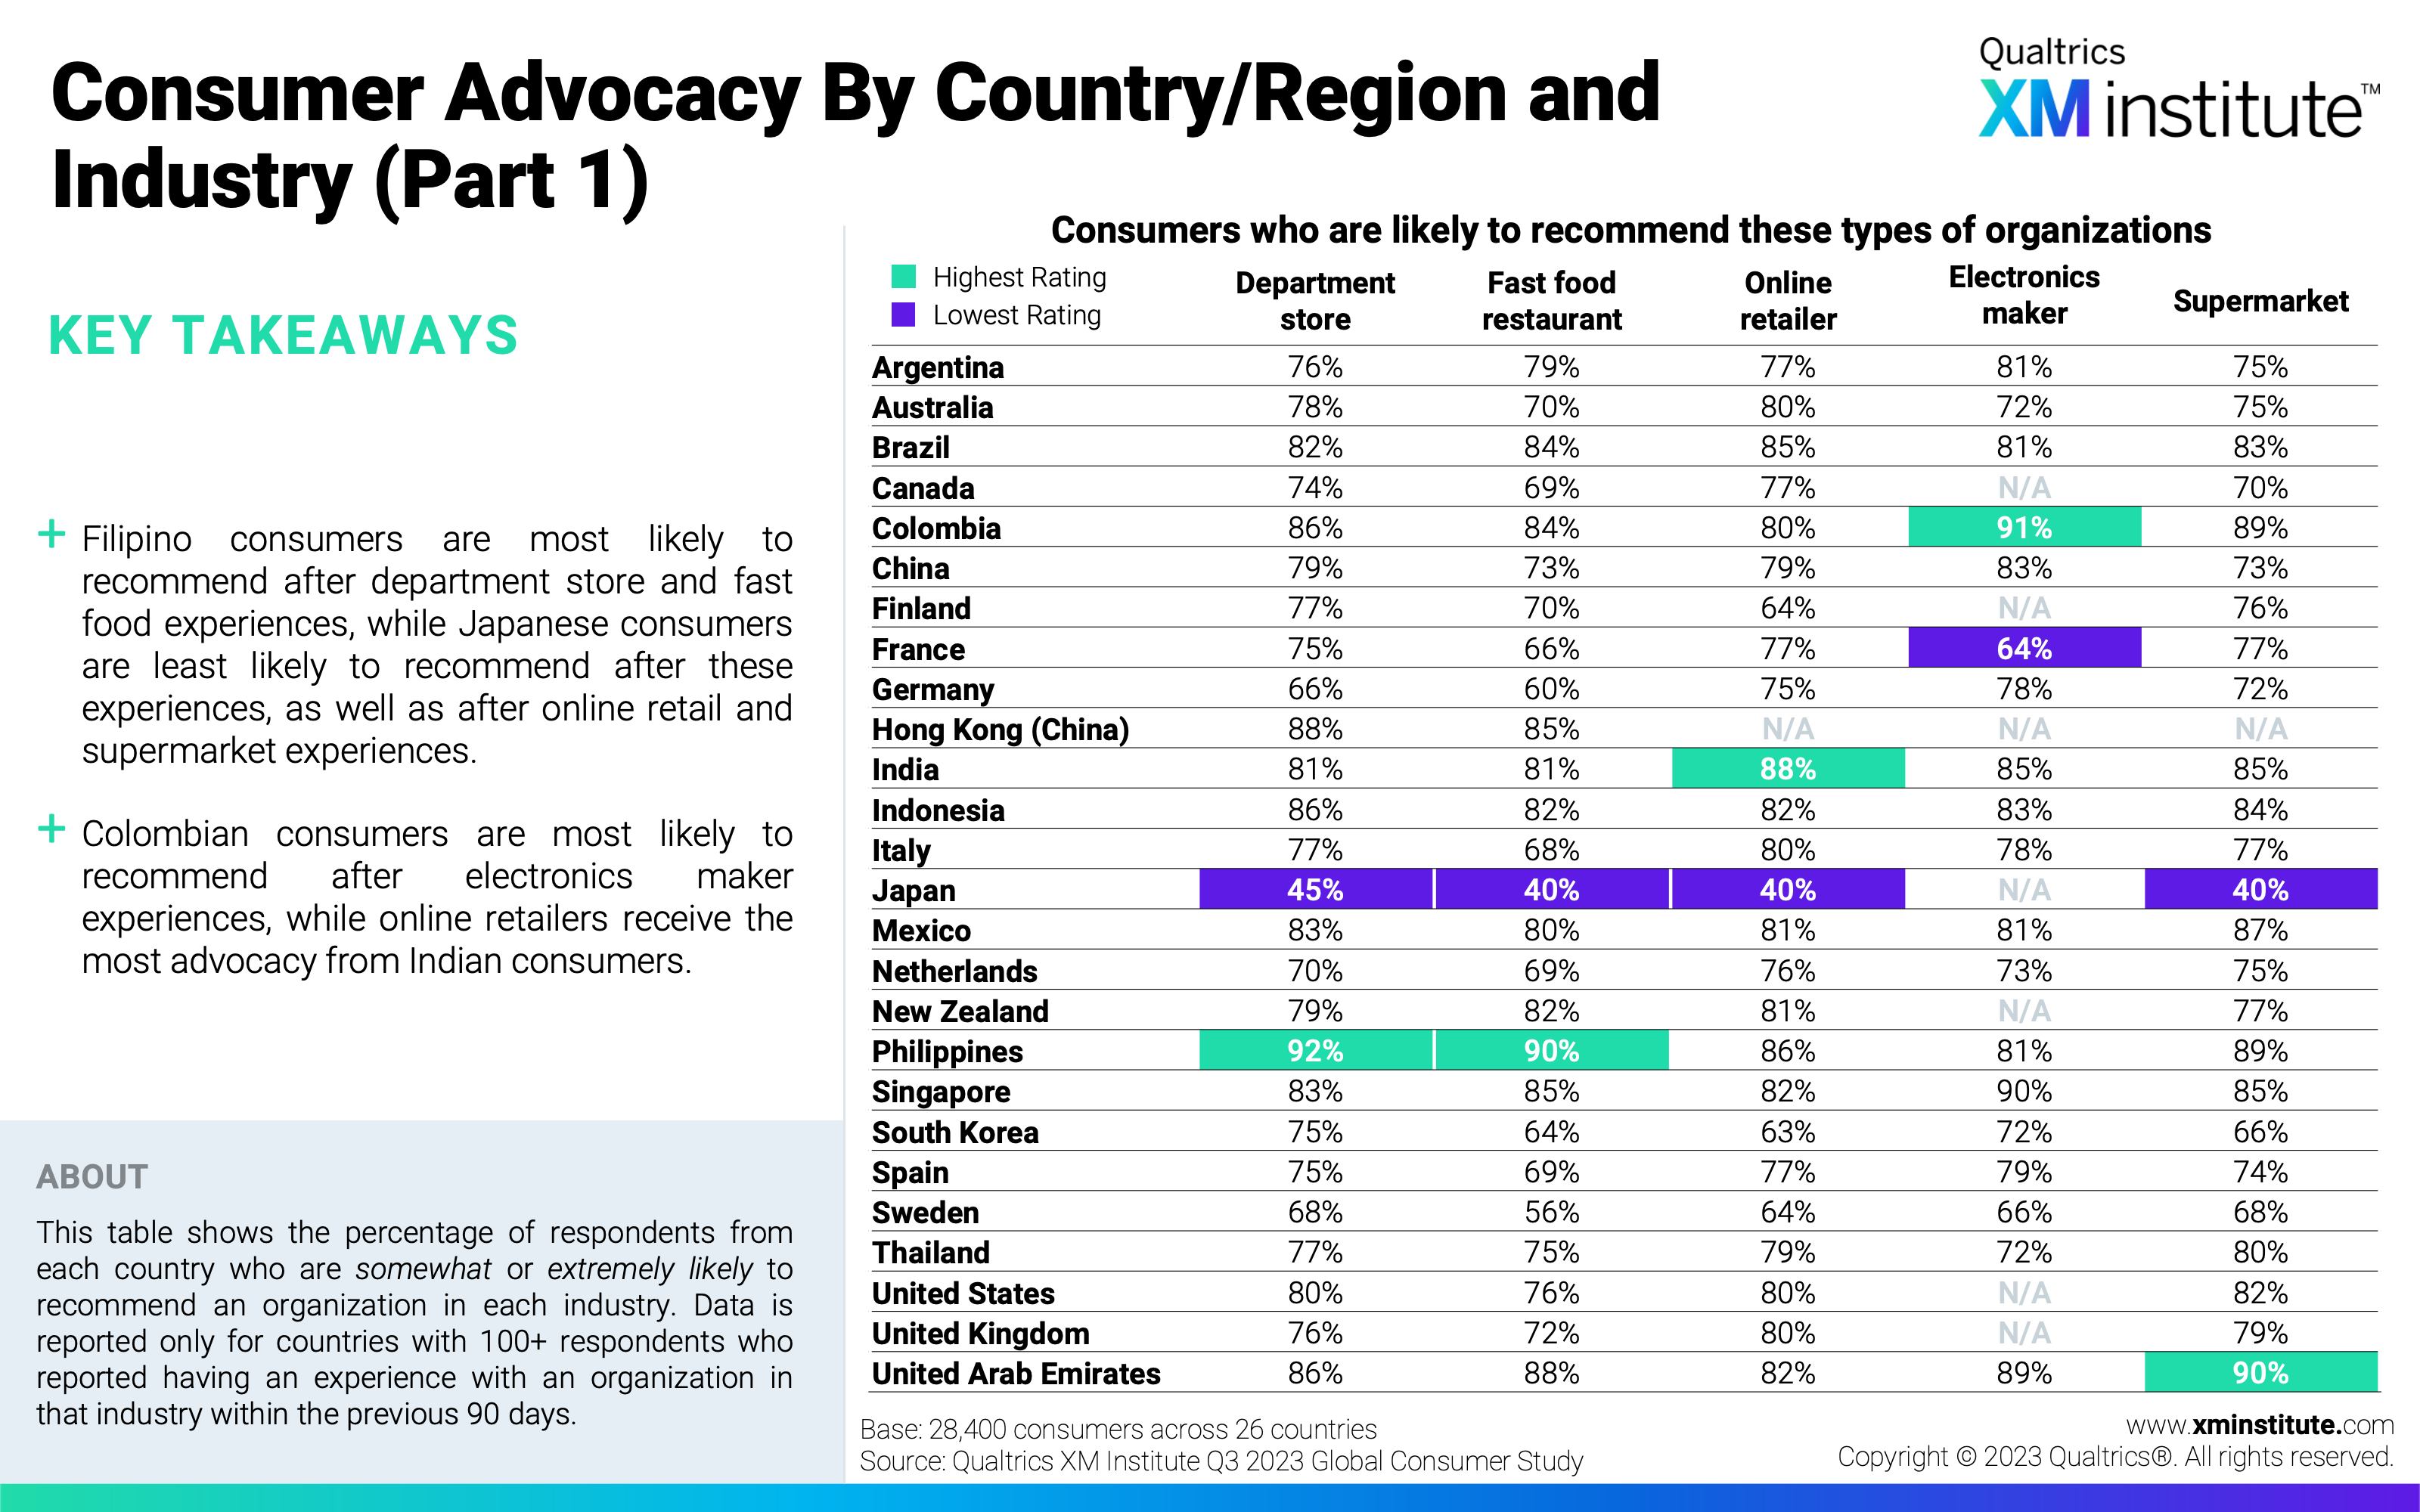
- Consumer Advocacy by Country/Region and Industry (Part 1) (see Figure 21)
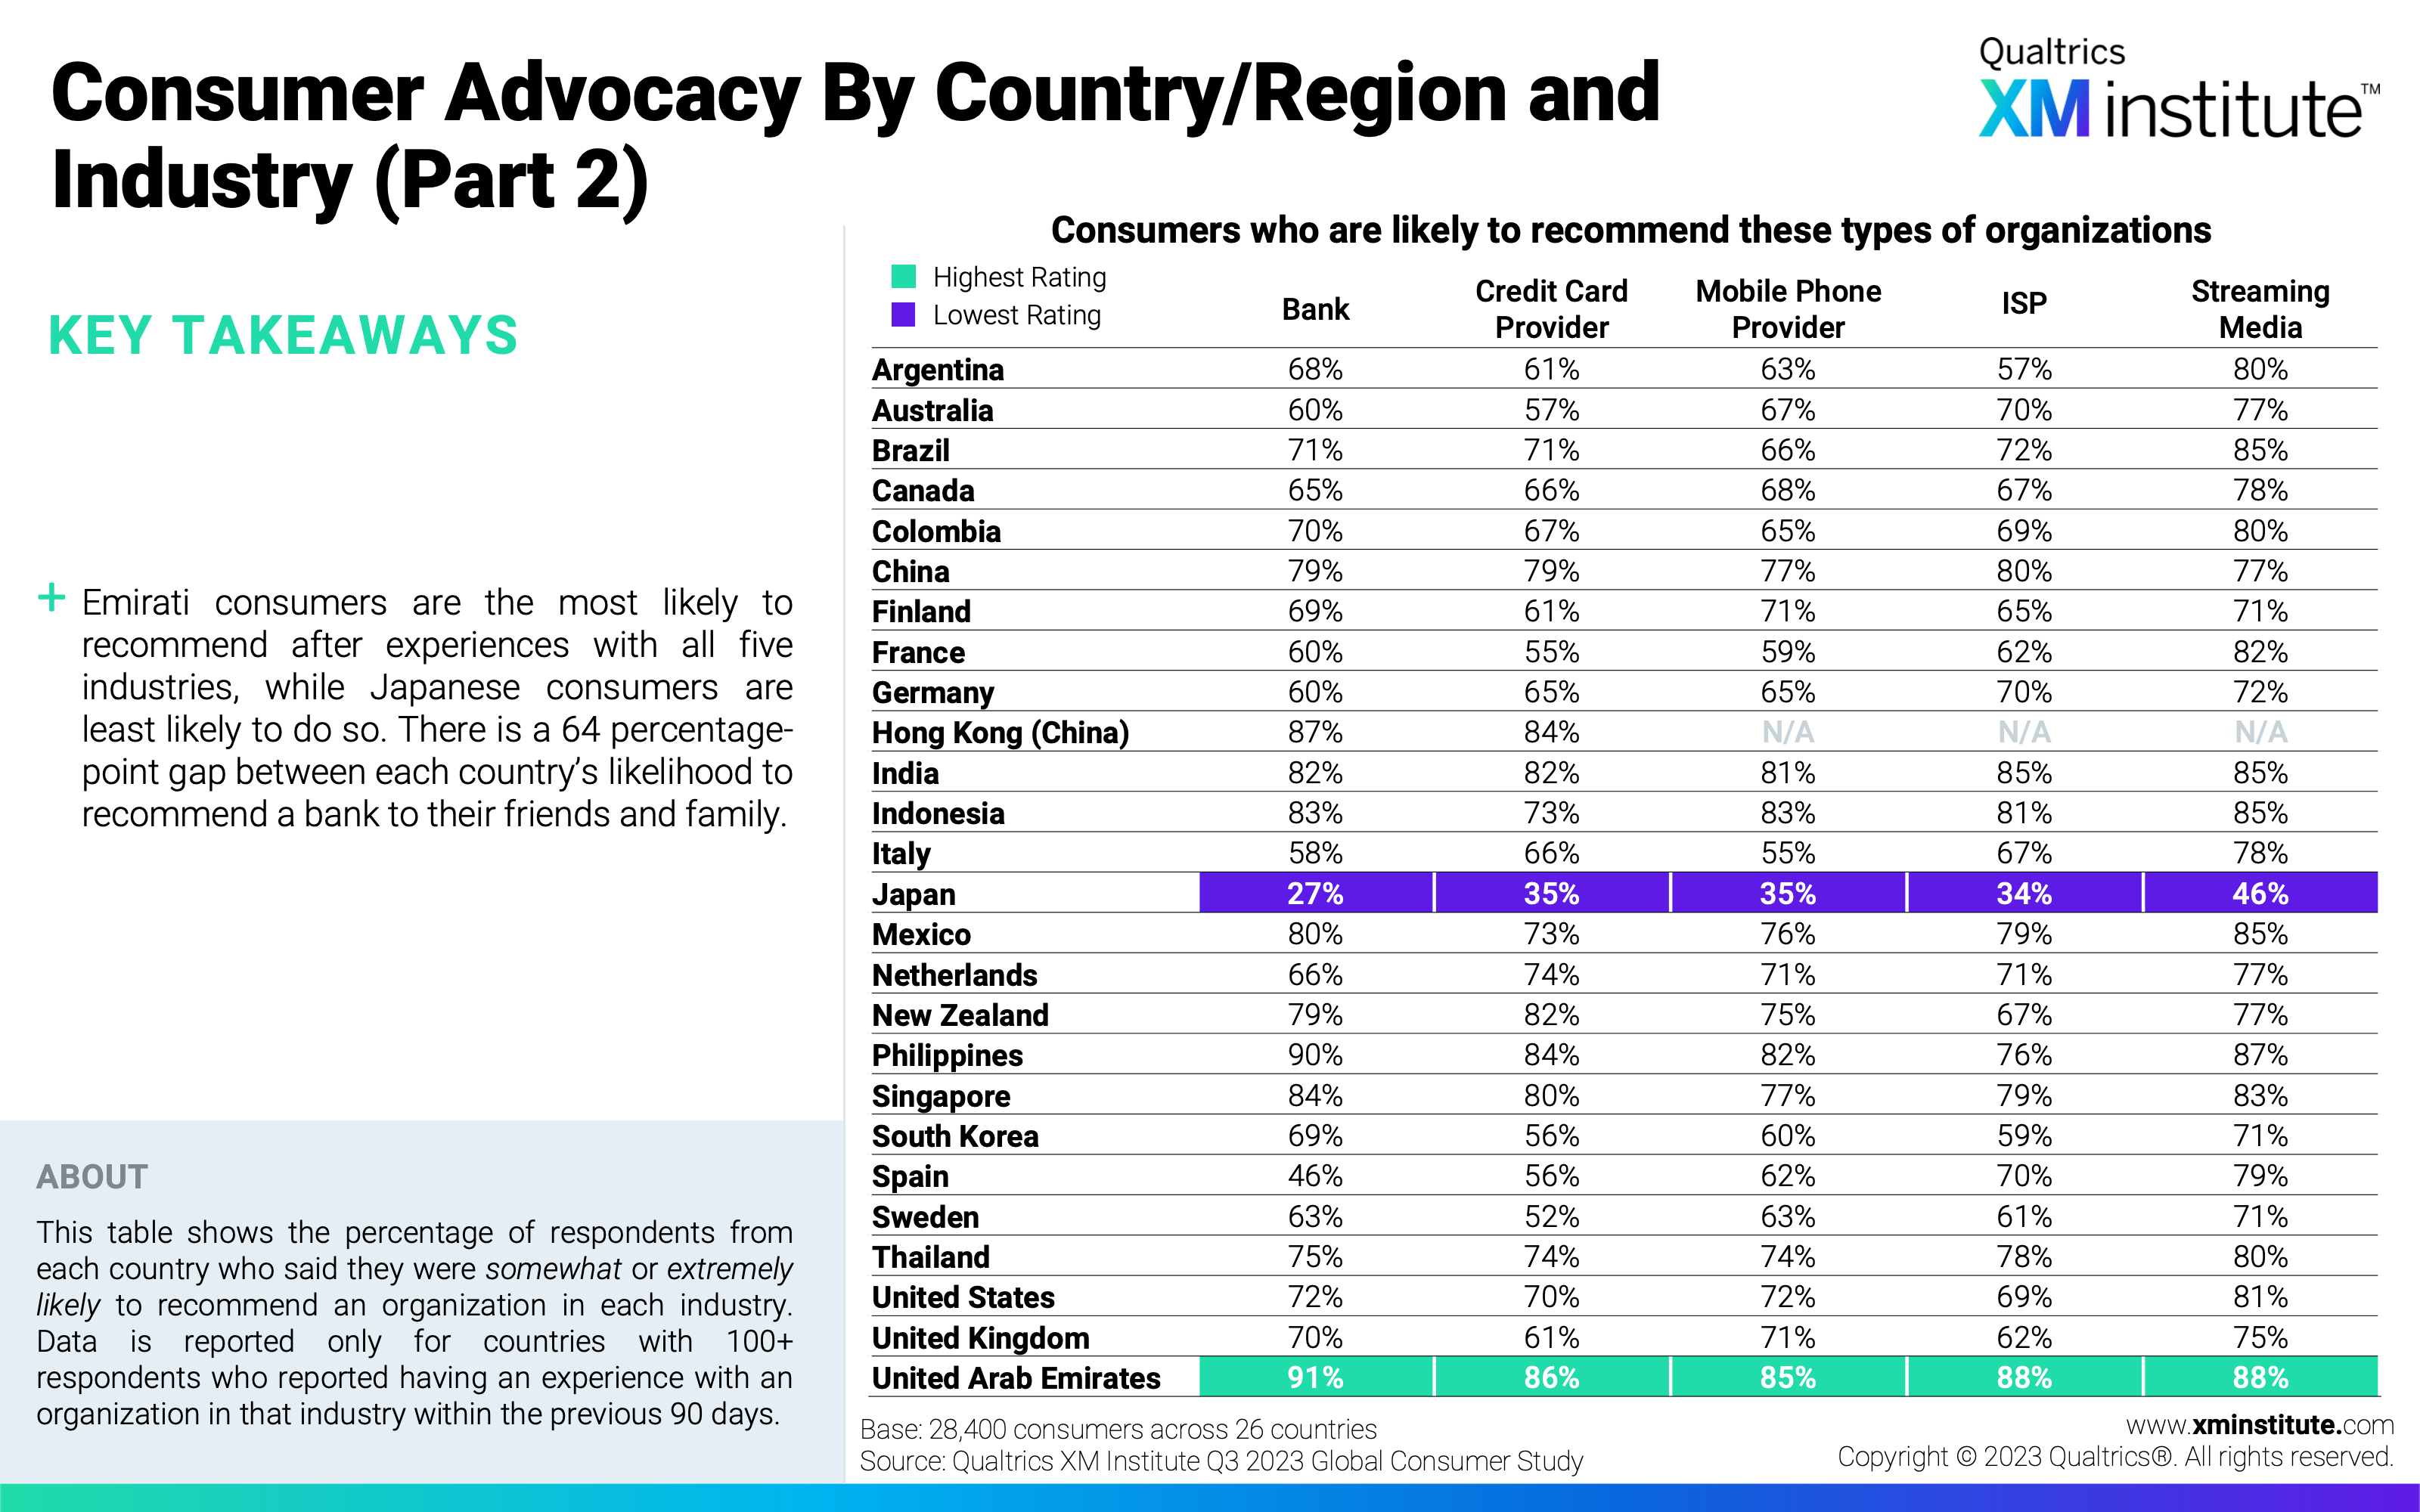
- Consumer Advocacy by Country/Region and Industry (Part 2) (see Figure 22)
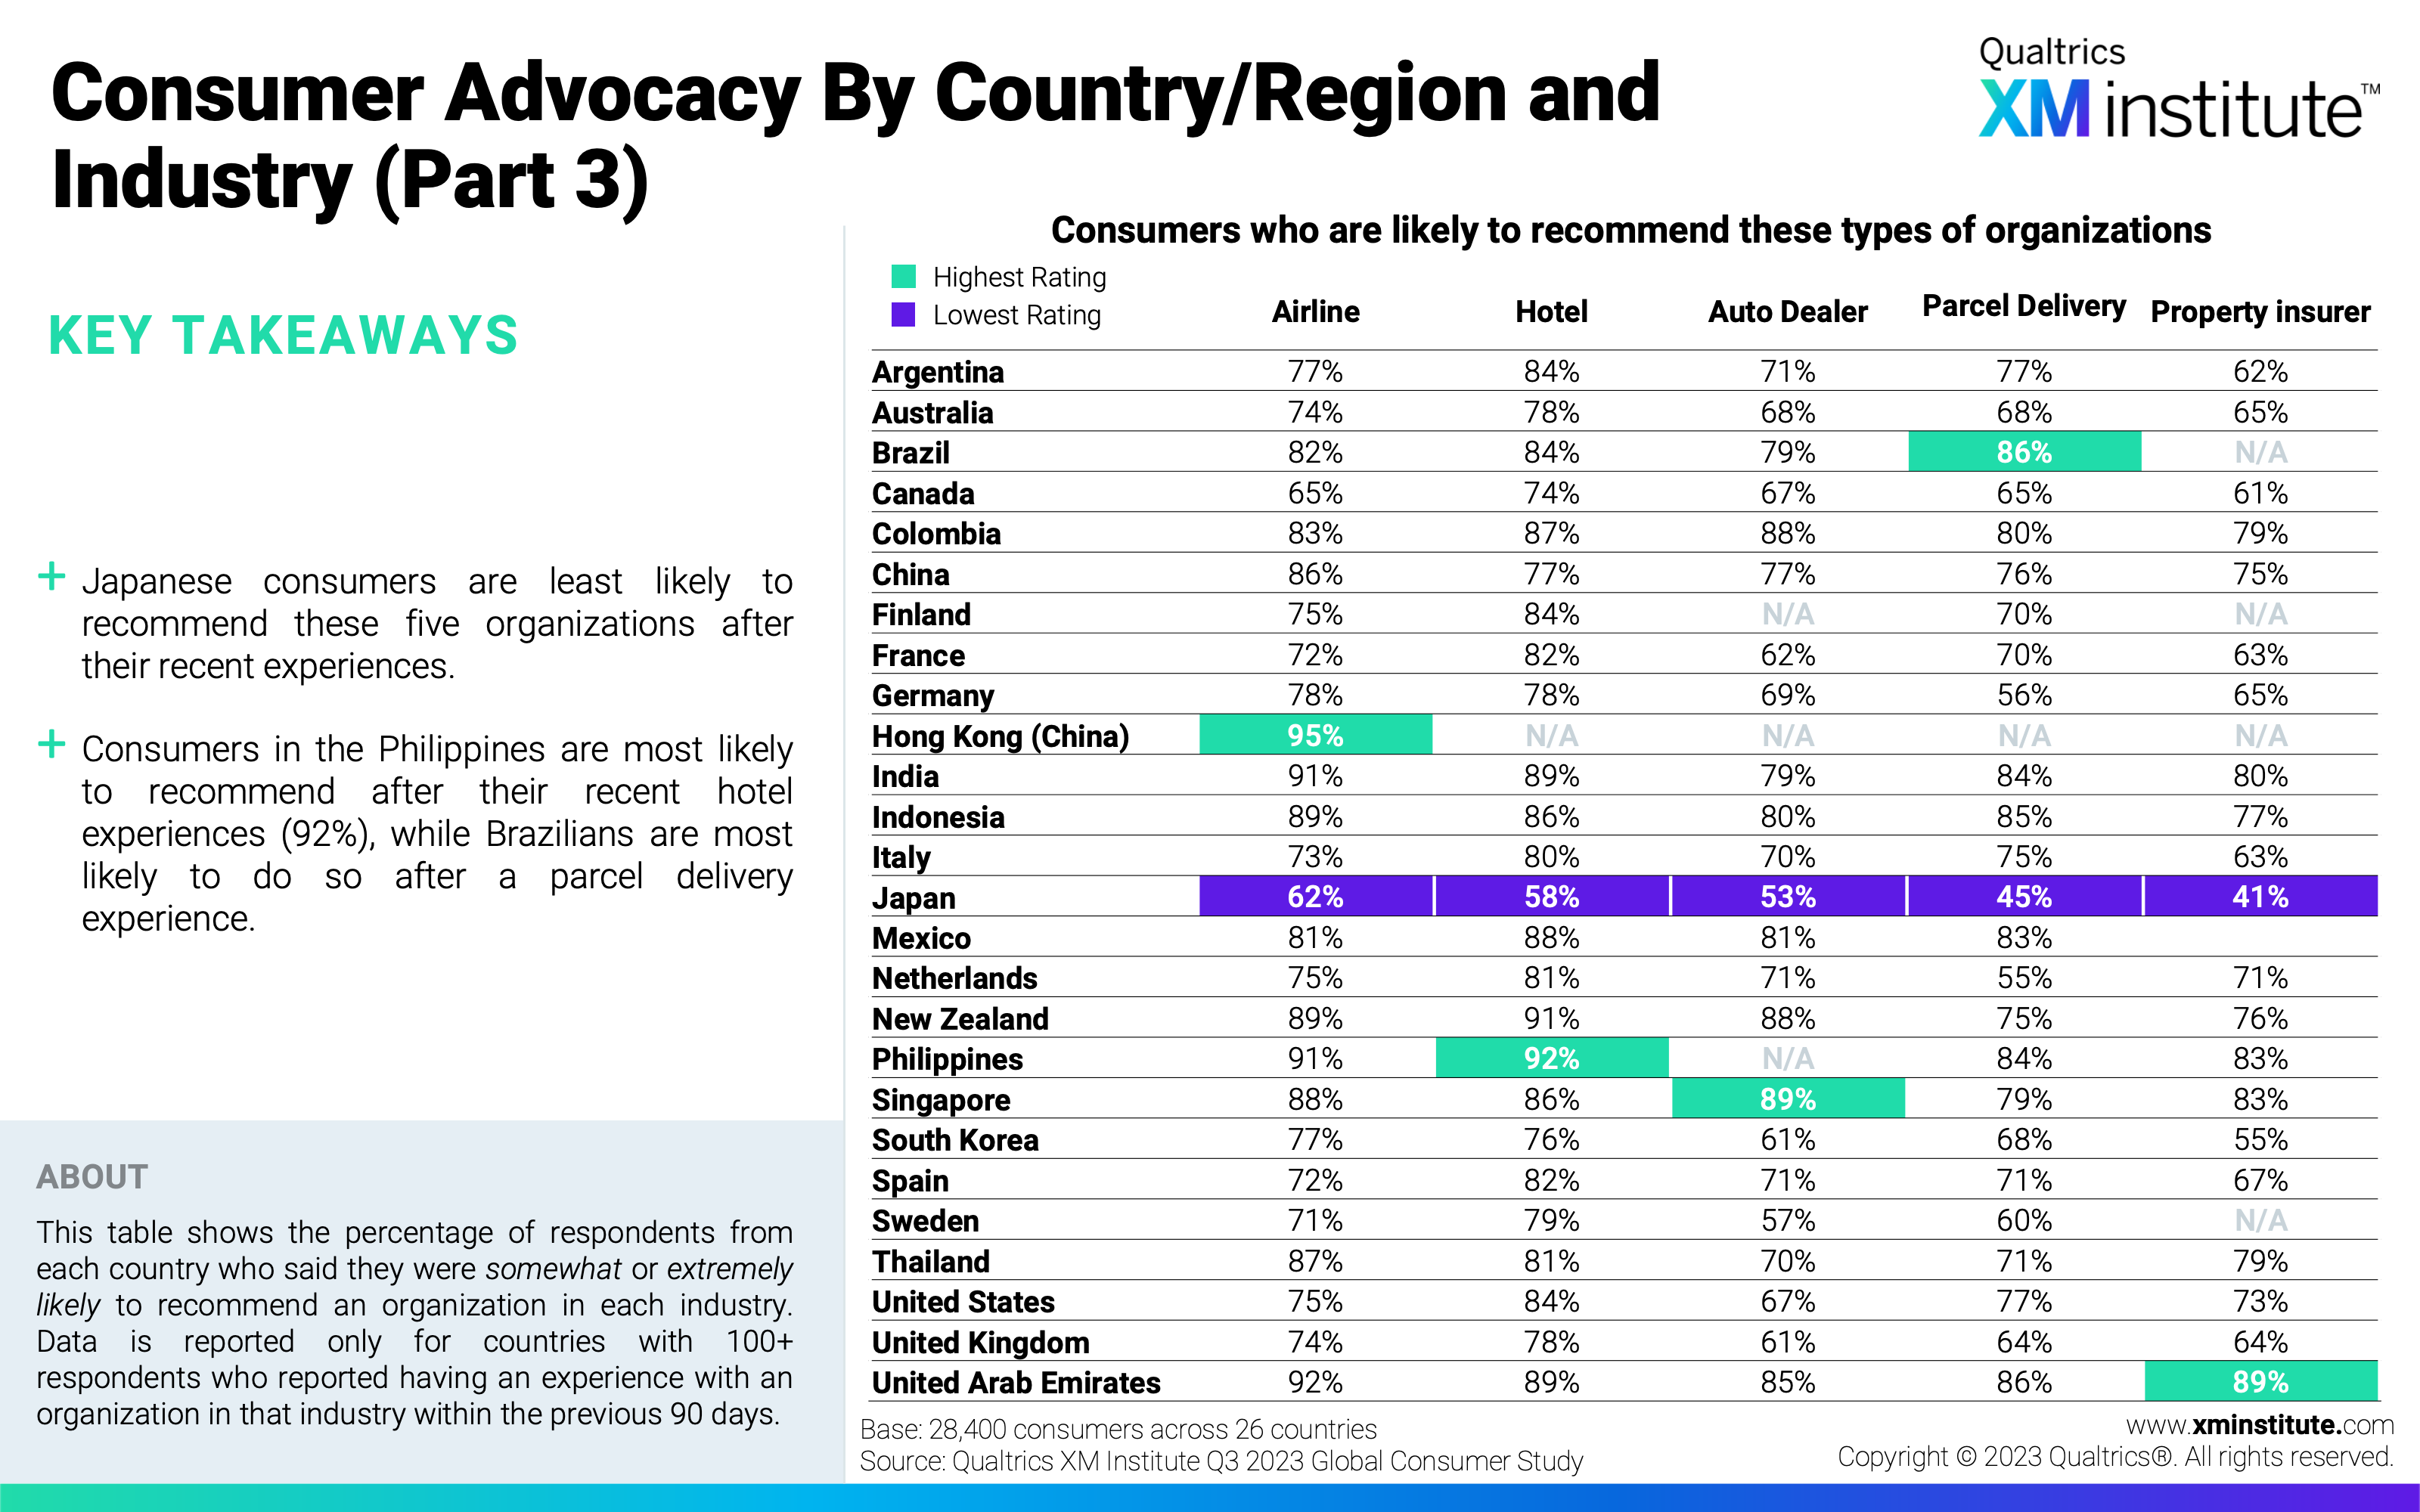
- Consumer Advocacy by Country/Region and Industry (Part 3) (see Figure 23)
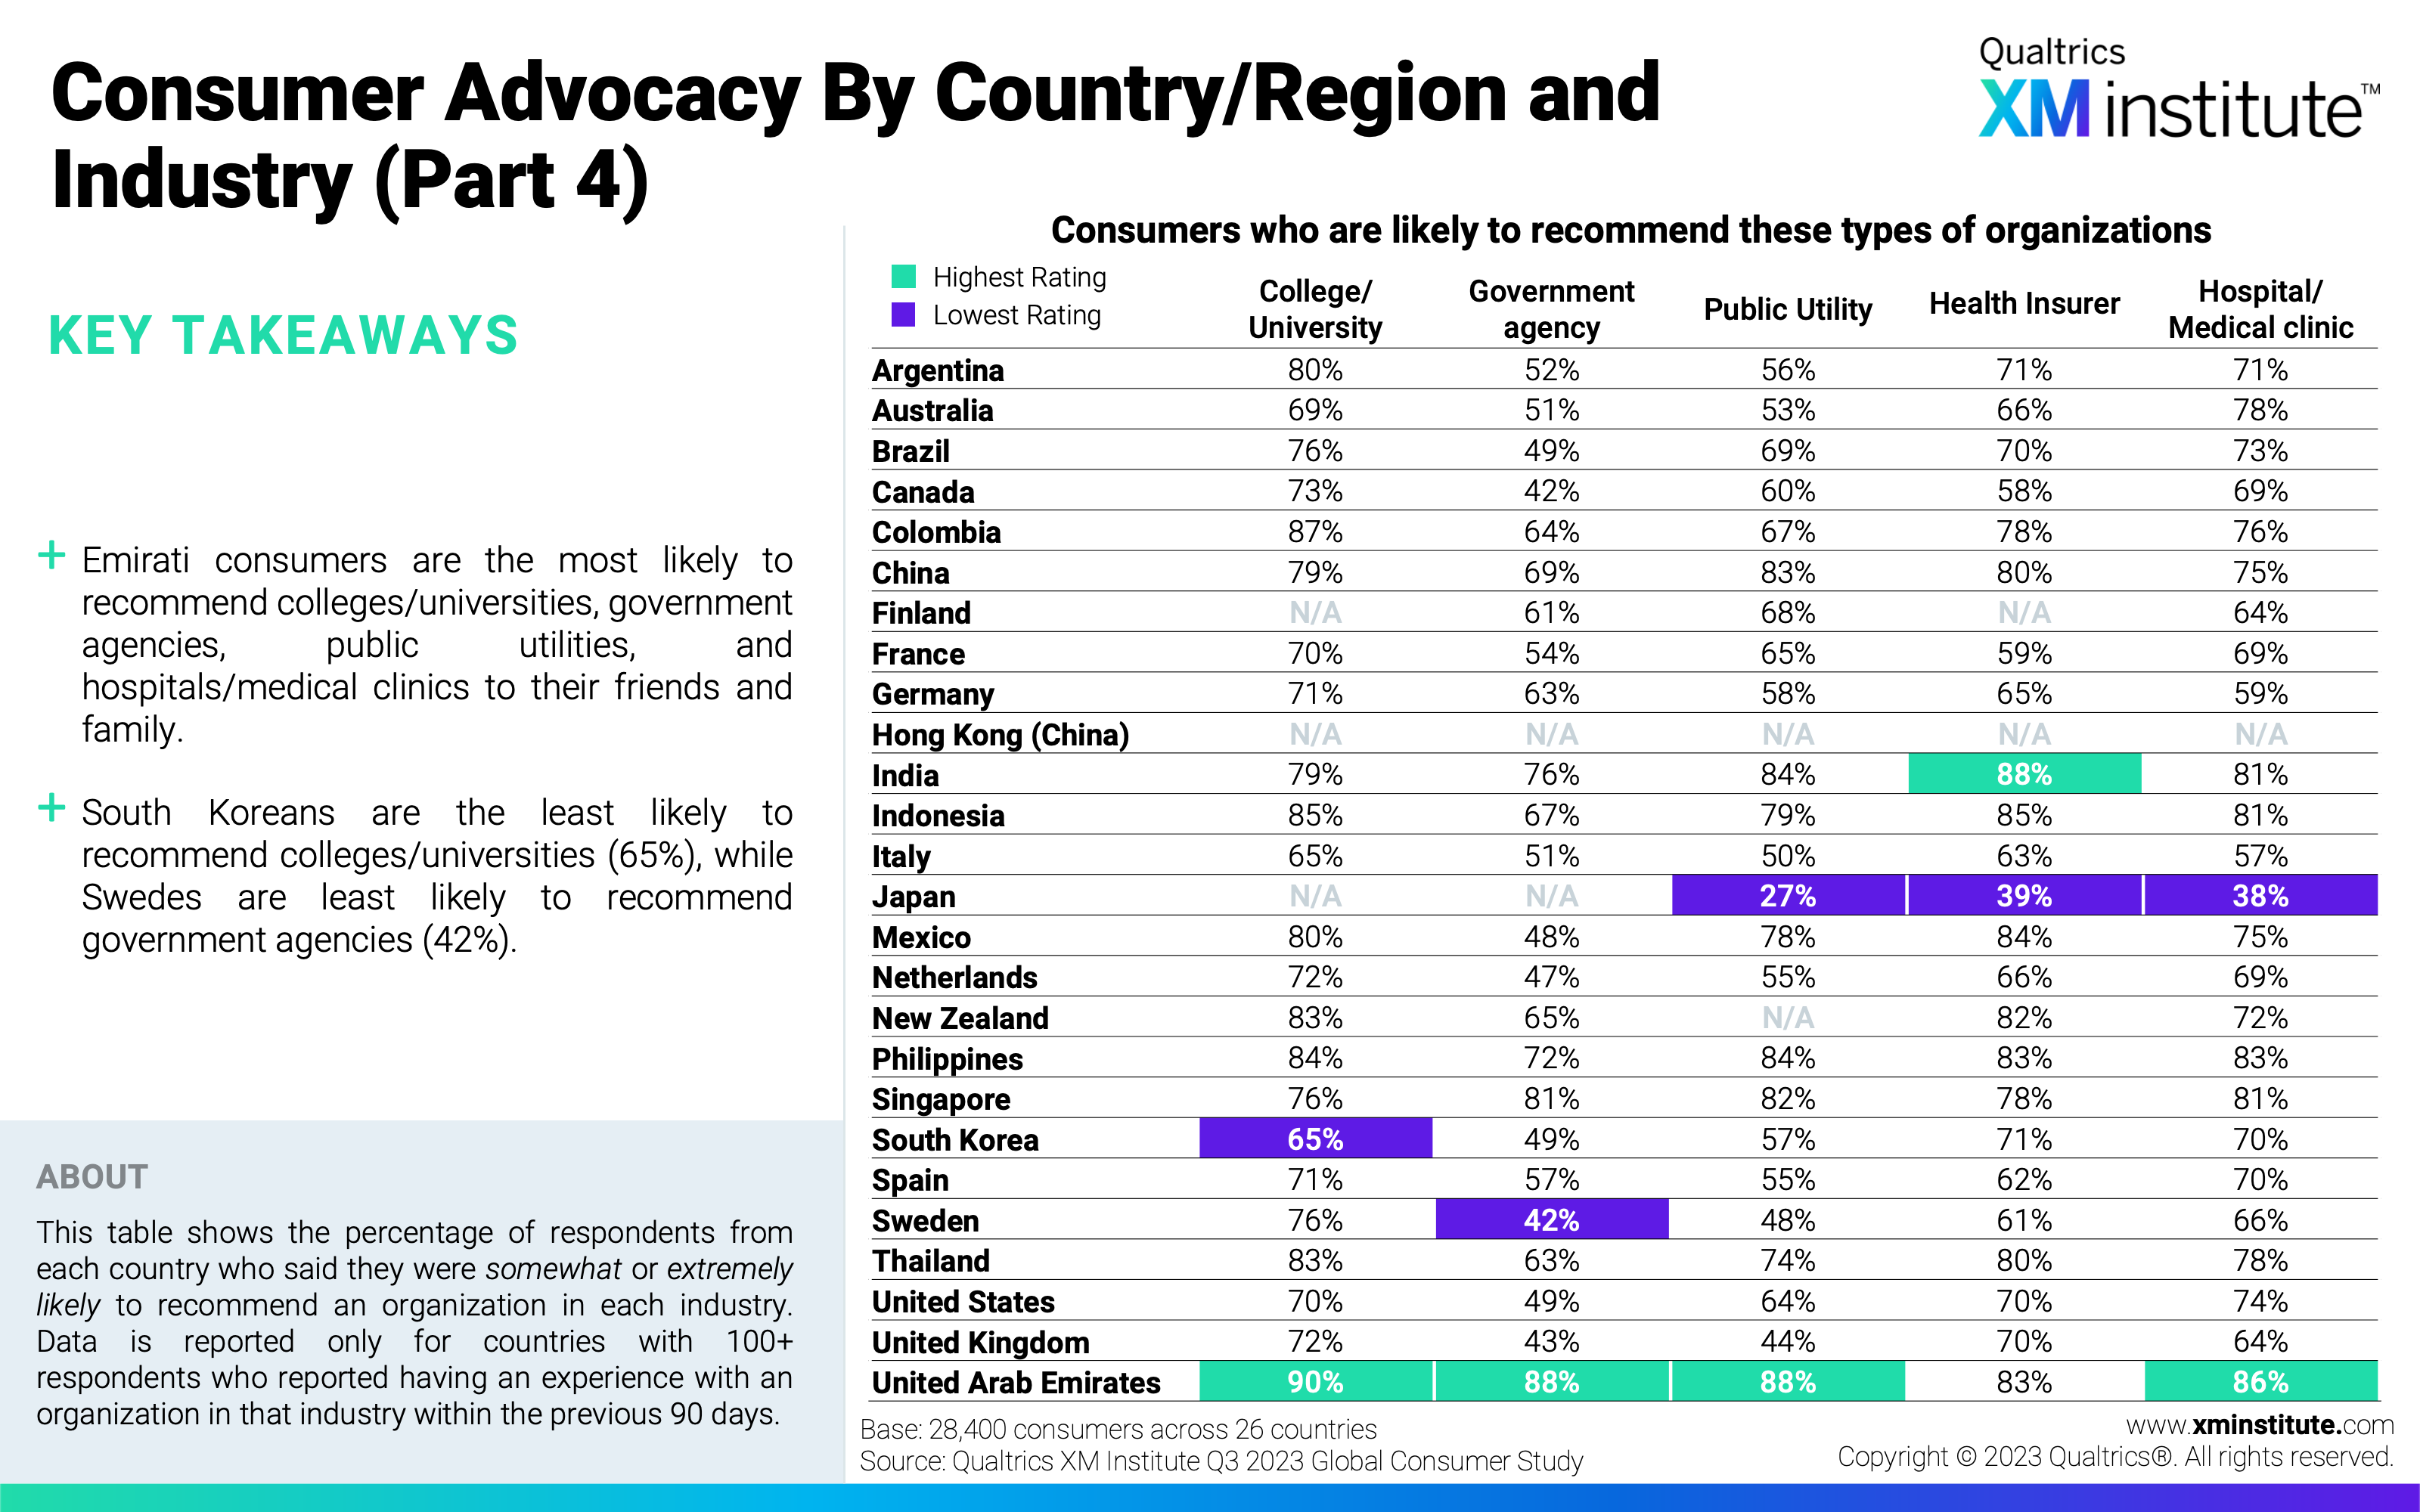
- Consumer Advocacy by Country/Region and Industry (Part 4) (see Figure 24)
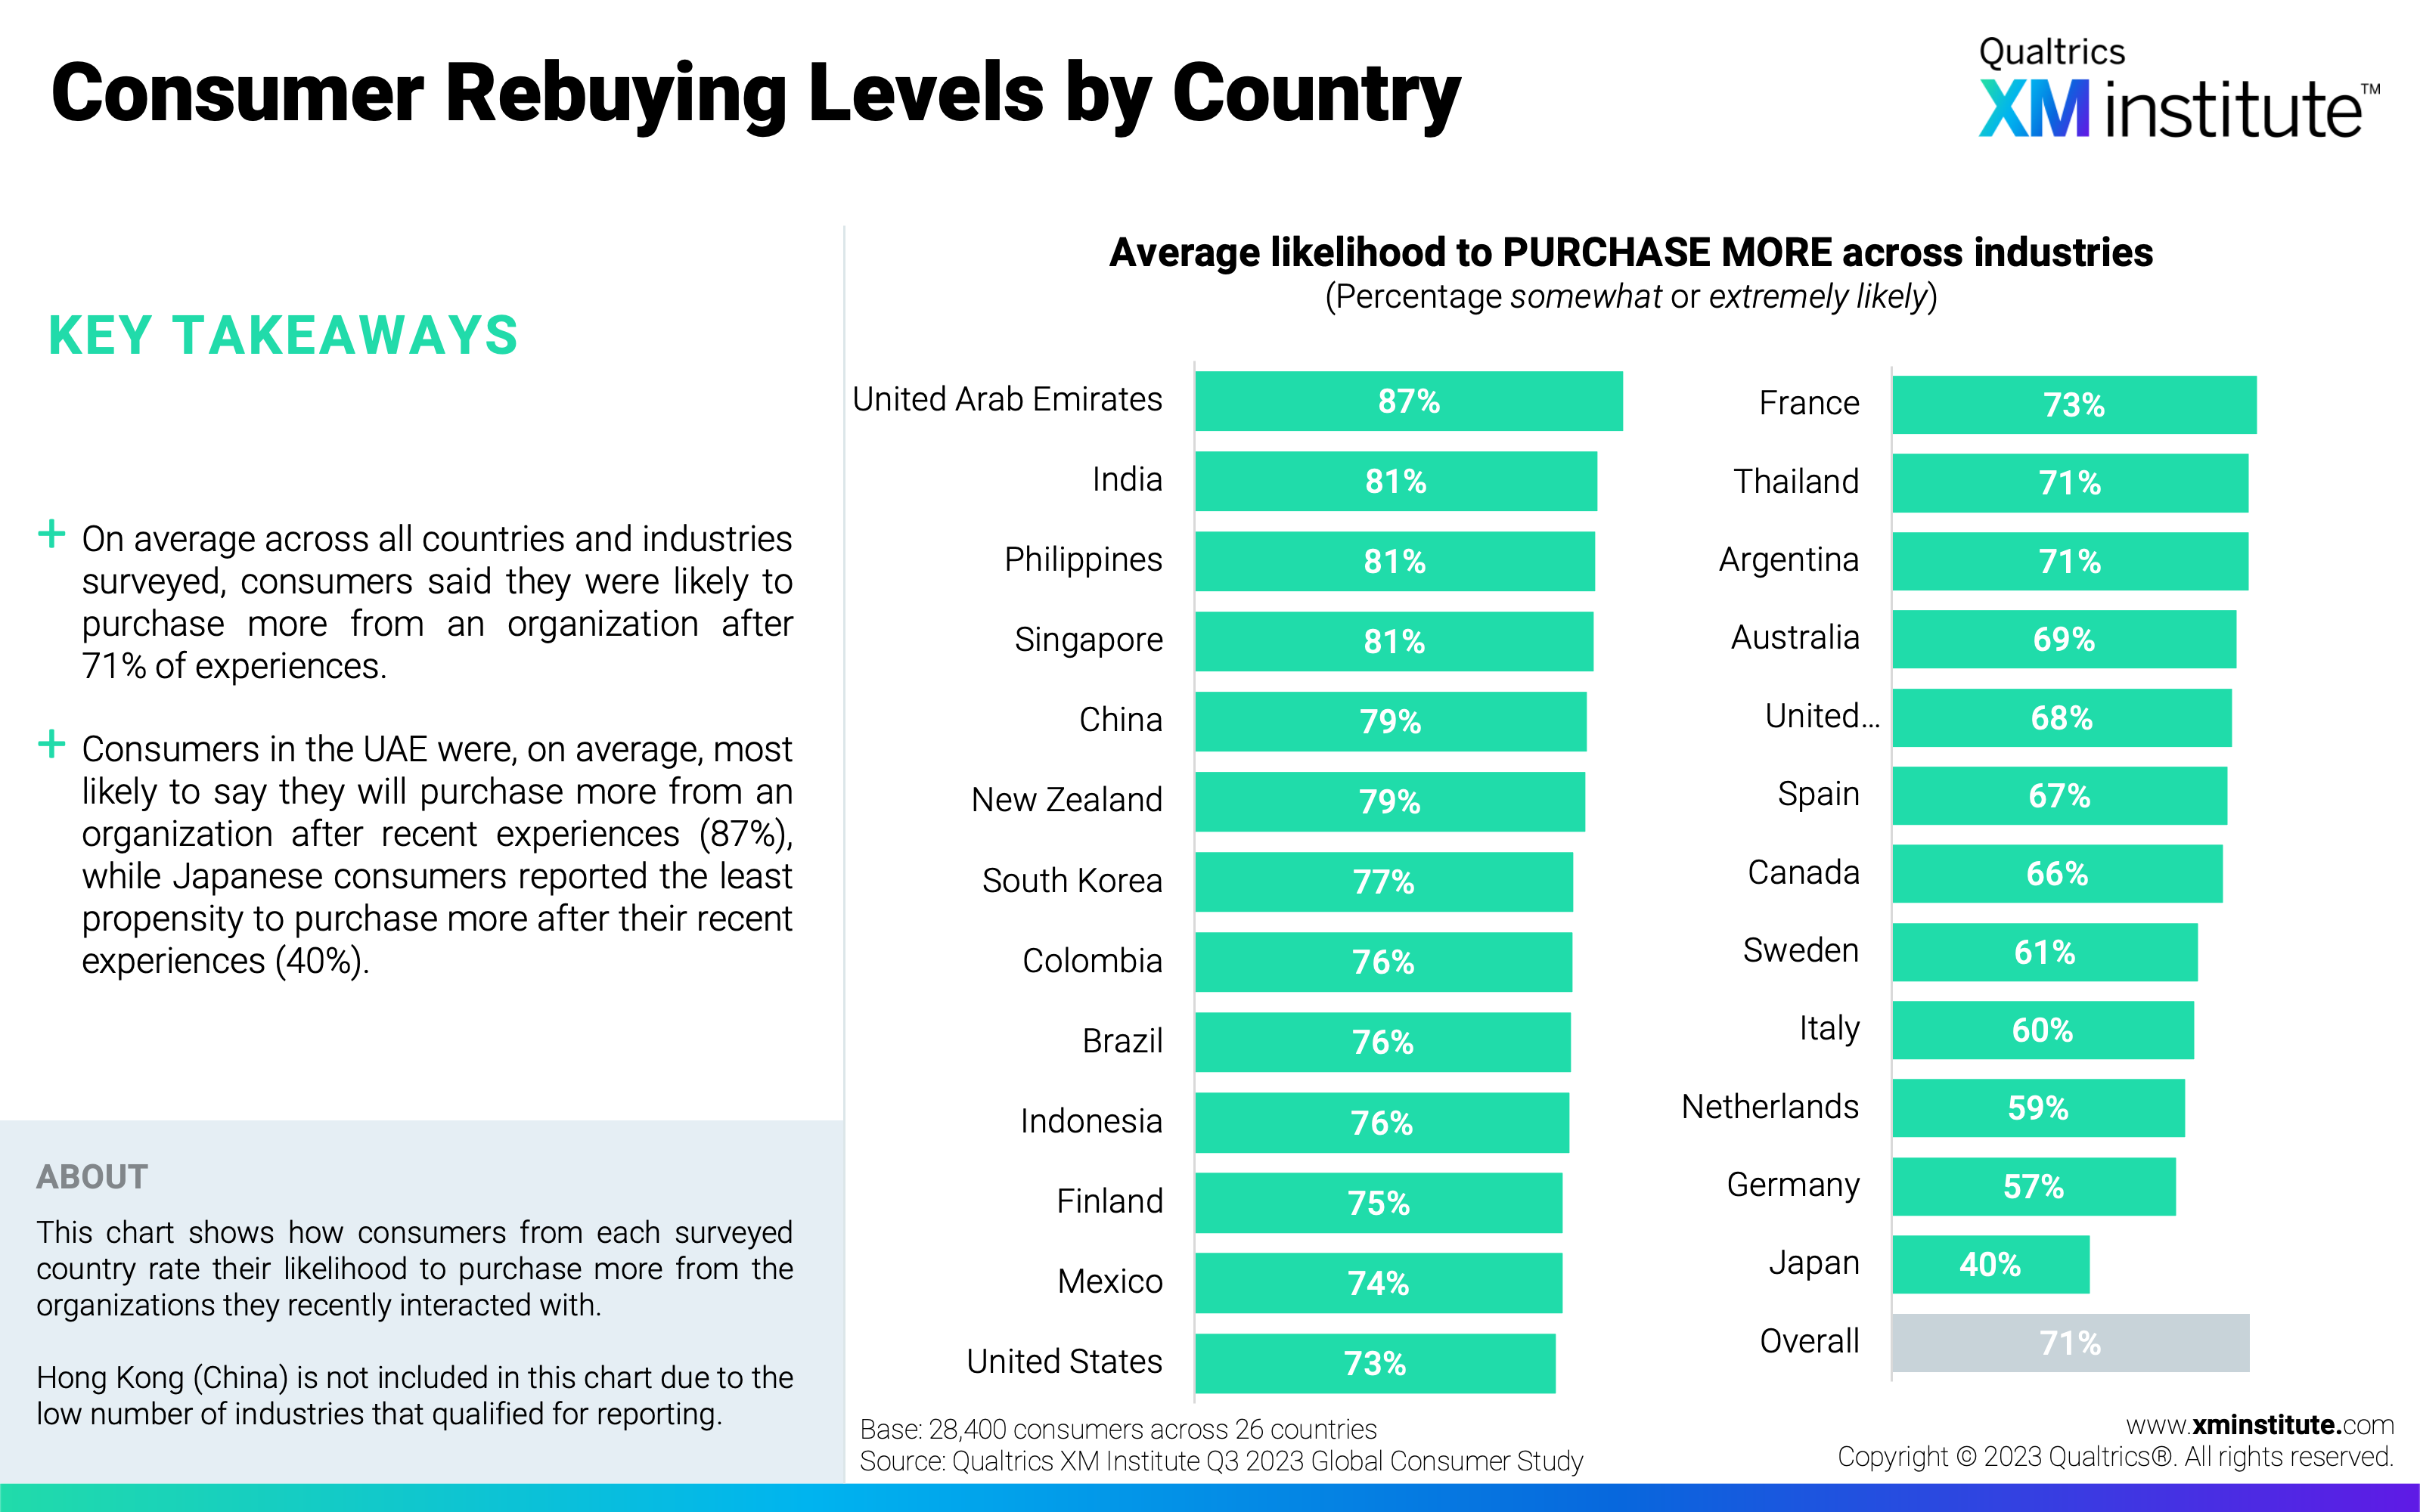
- Consumer Rebuying Level by Country (see Figure 25)
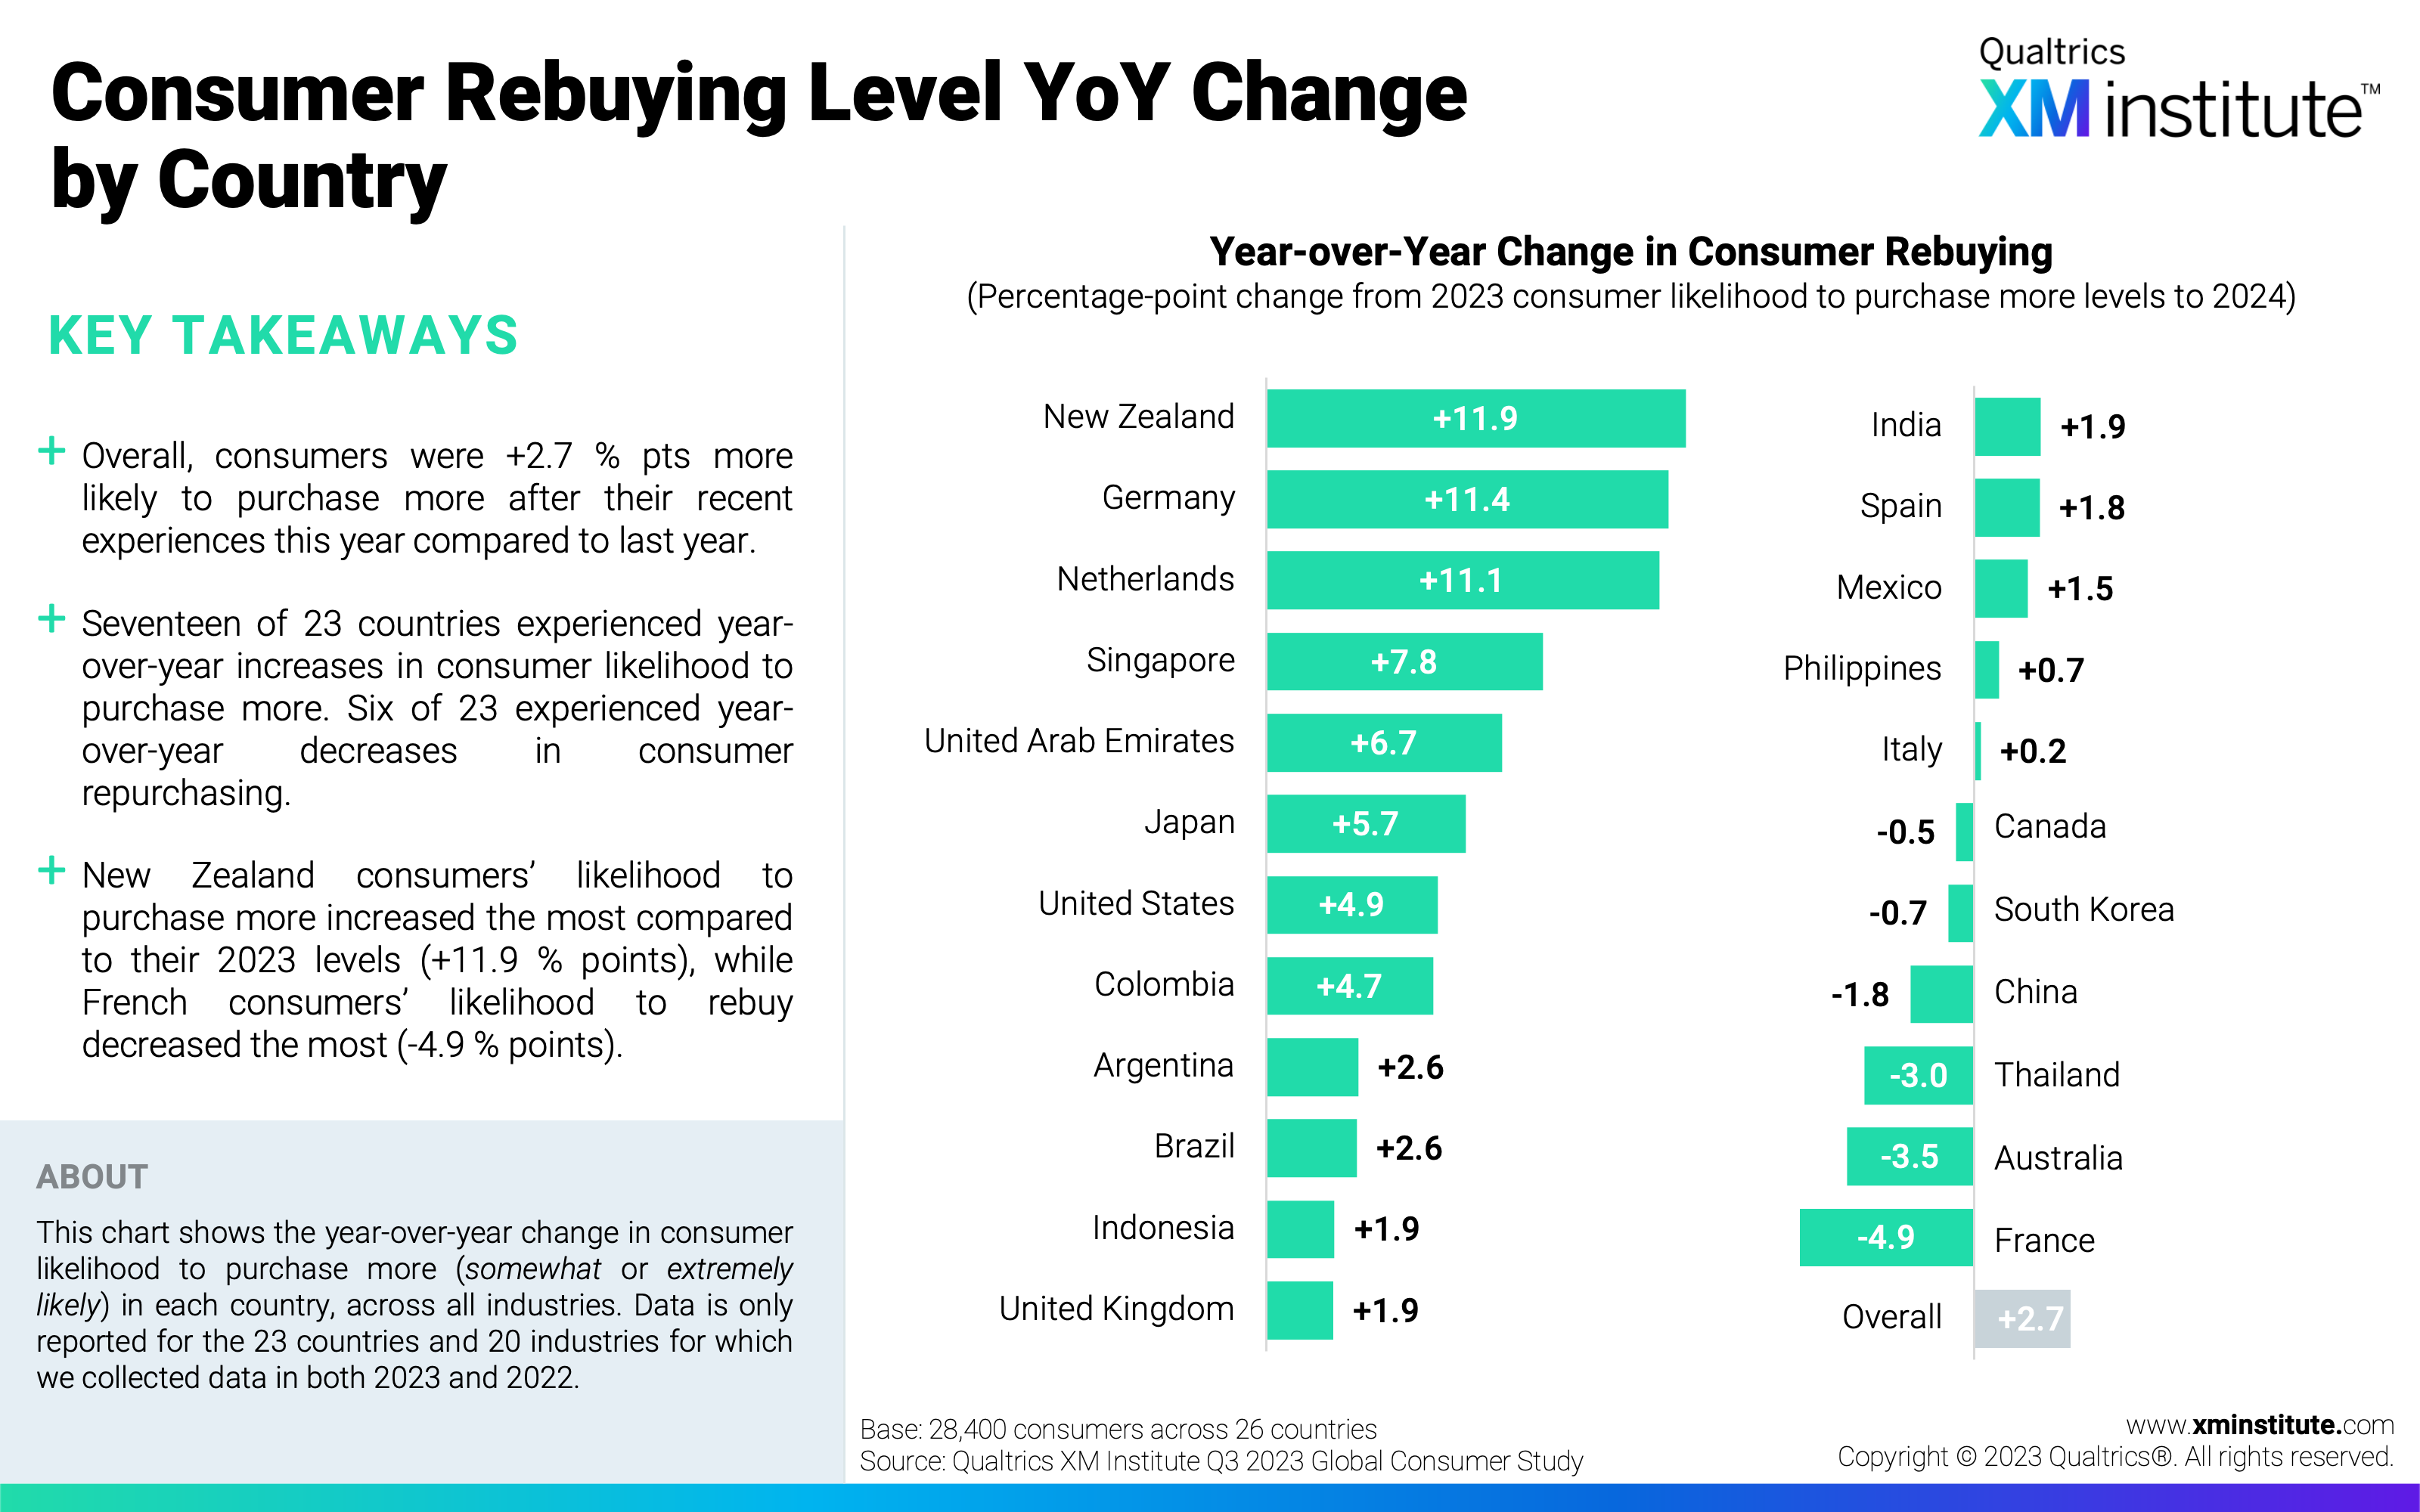
- Consumer Rebuying Level YoY Change by Country (see Figure 26)
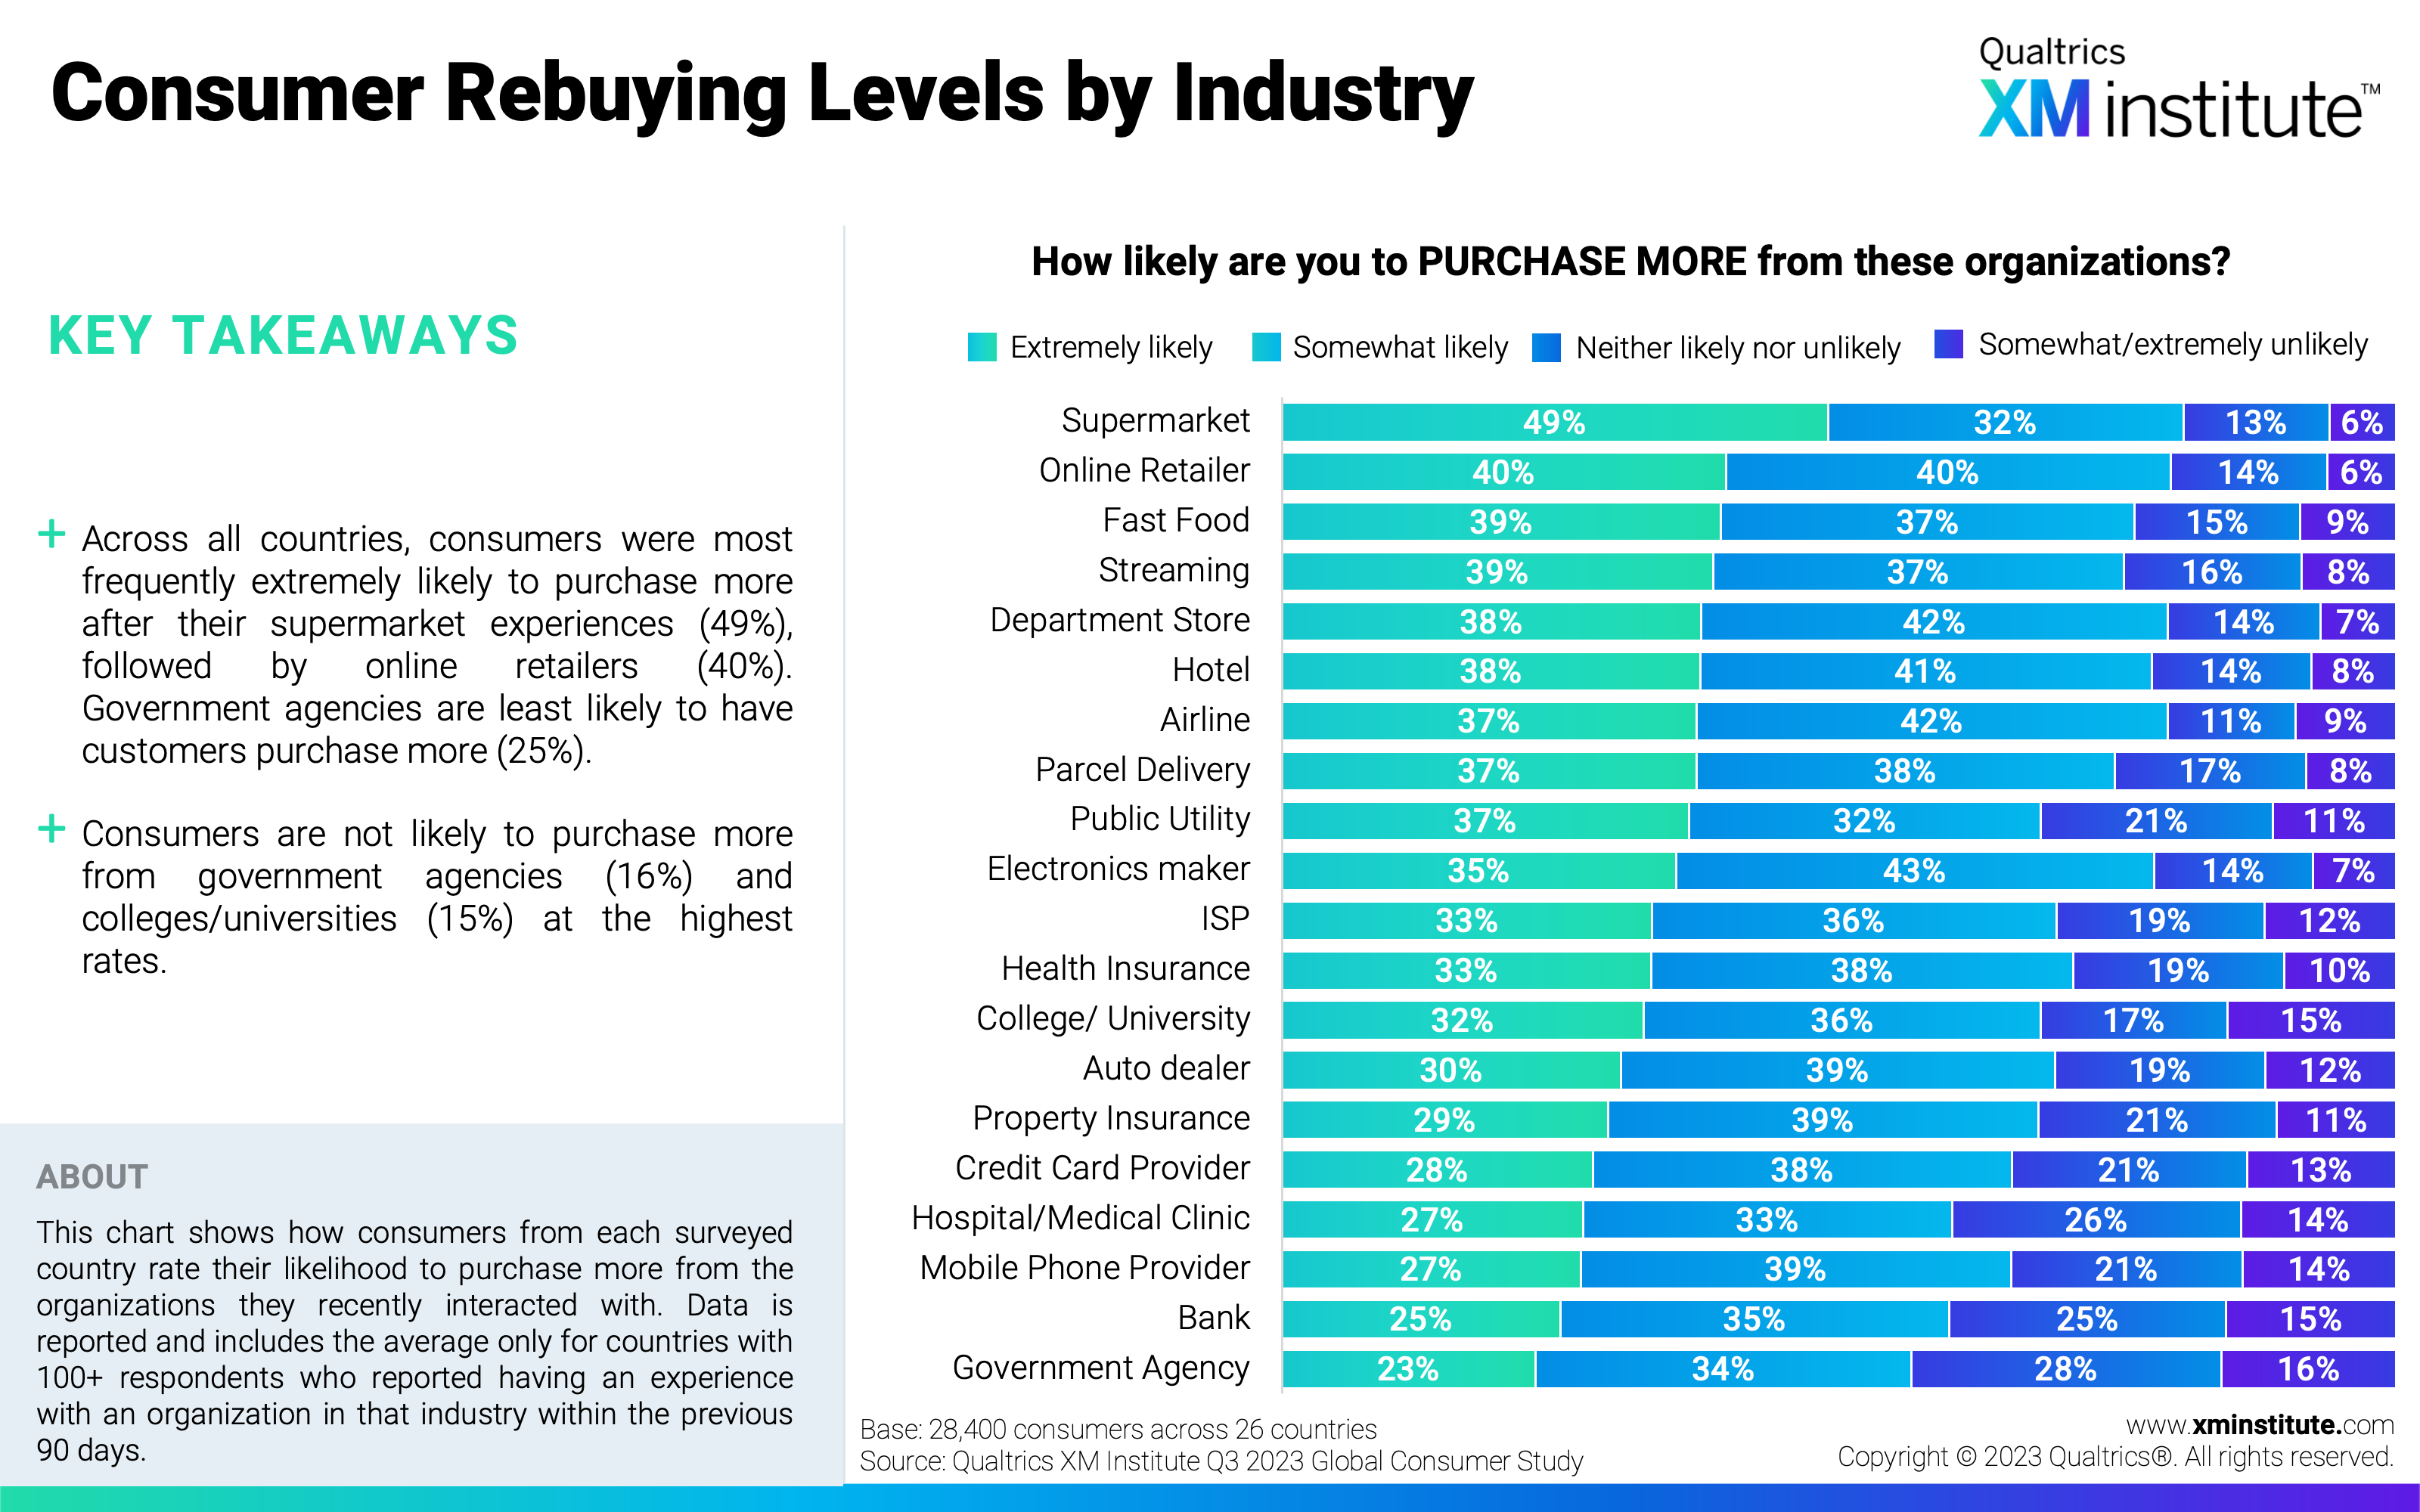
- Consumer Rebuying Level by Industry (see Figure 27)
- Consumer Rebuying Level YoY Change by Industry (see Figure 28)
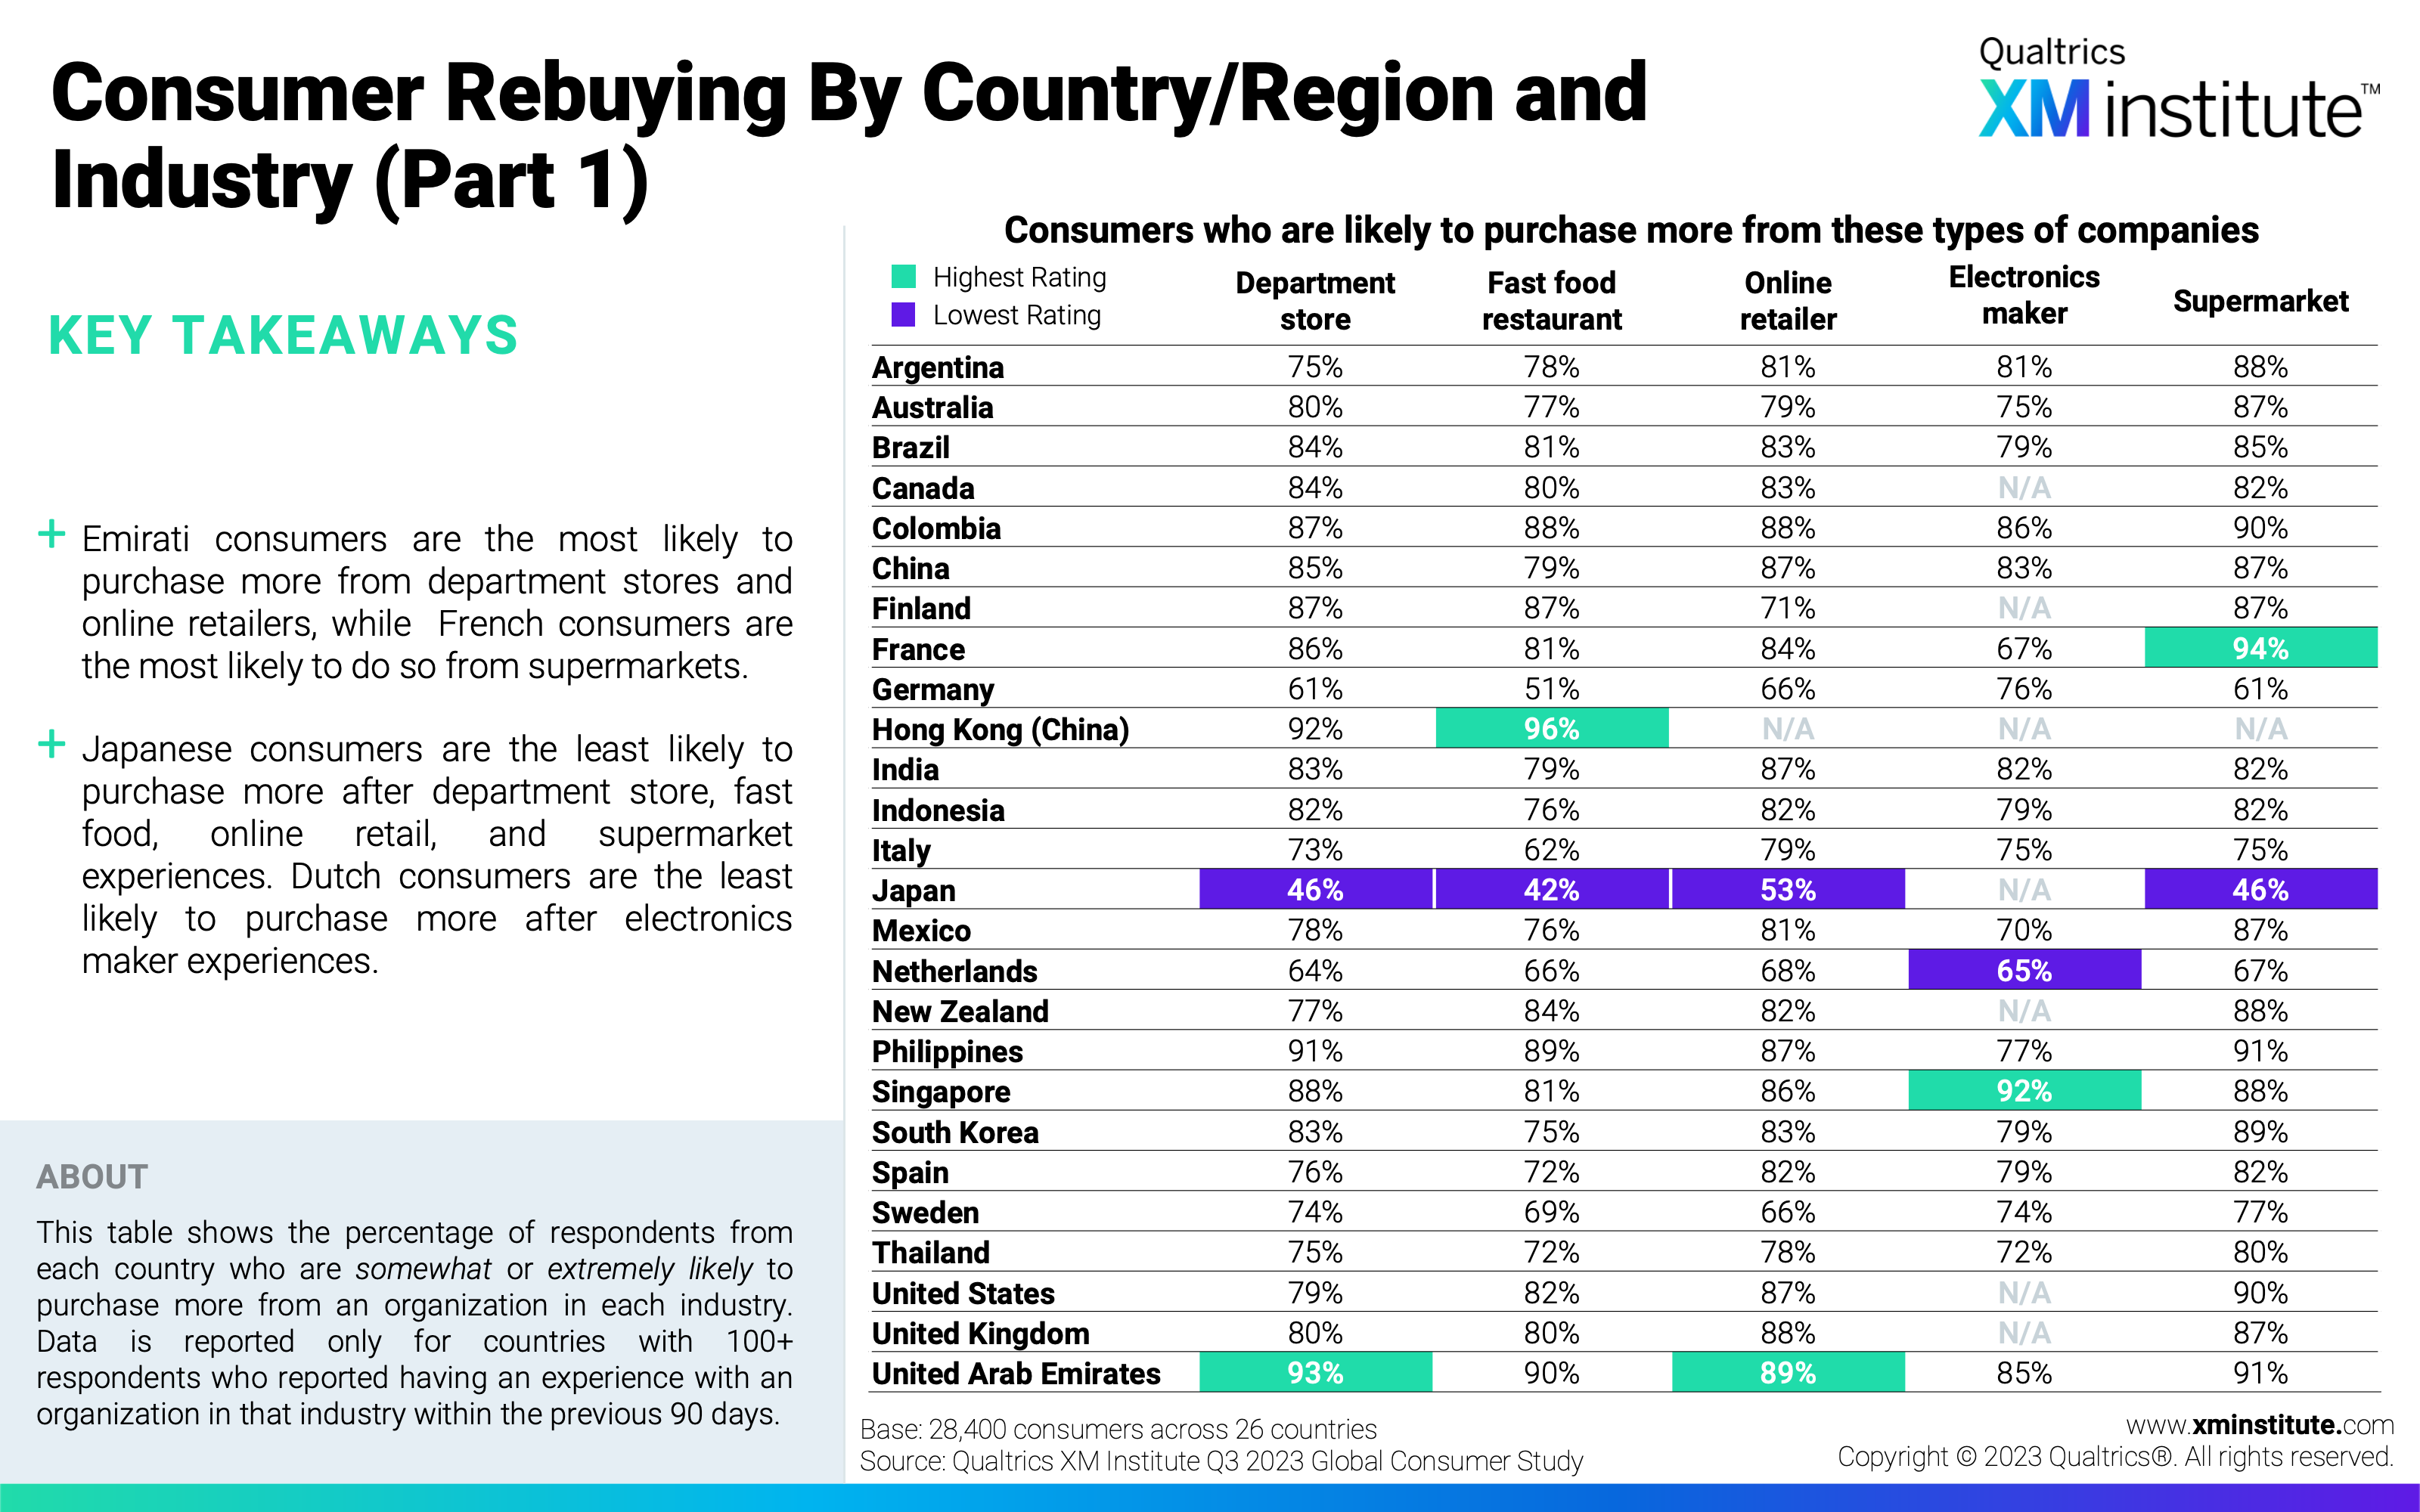
- Consumer Rebuying by Country/Region and Industry (Part 1) (see Figure 29)
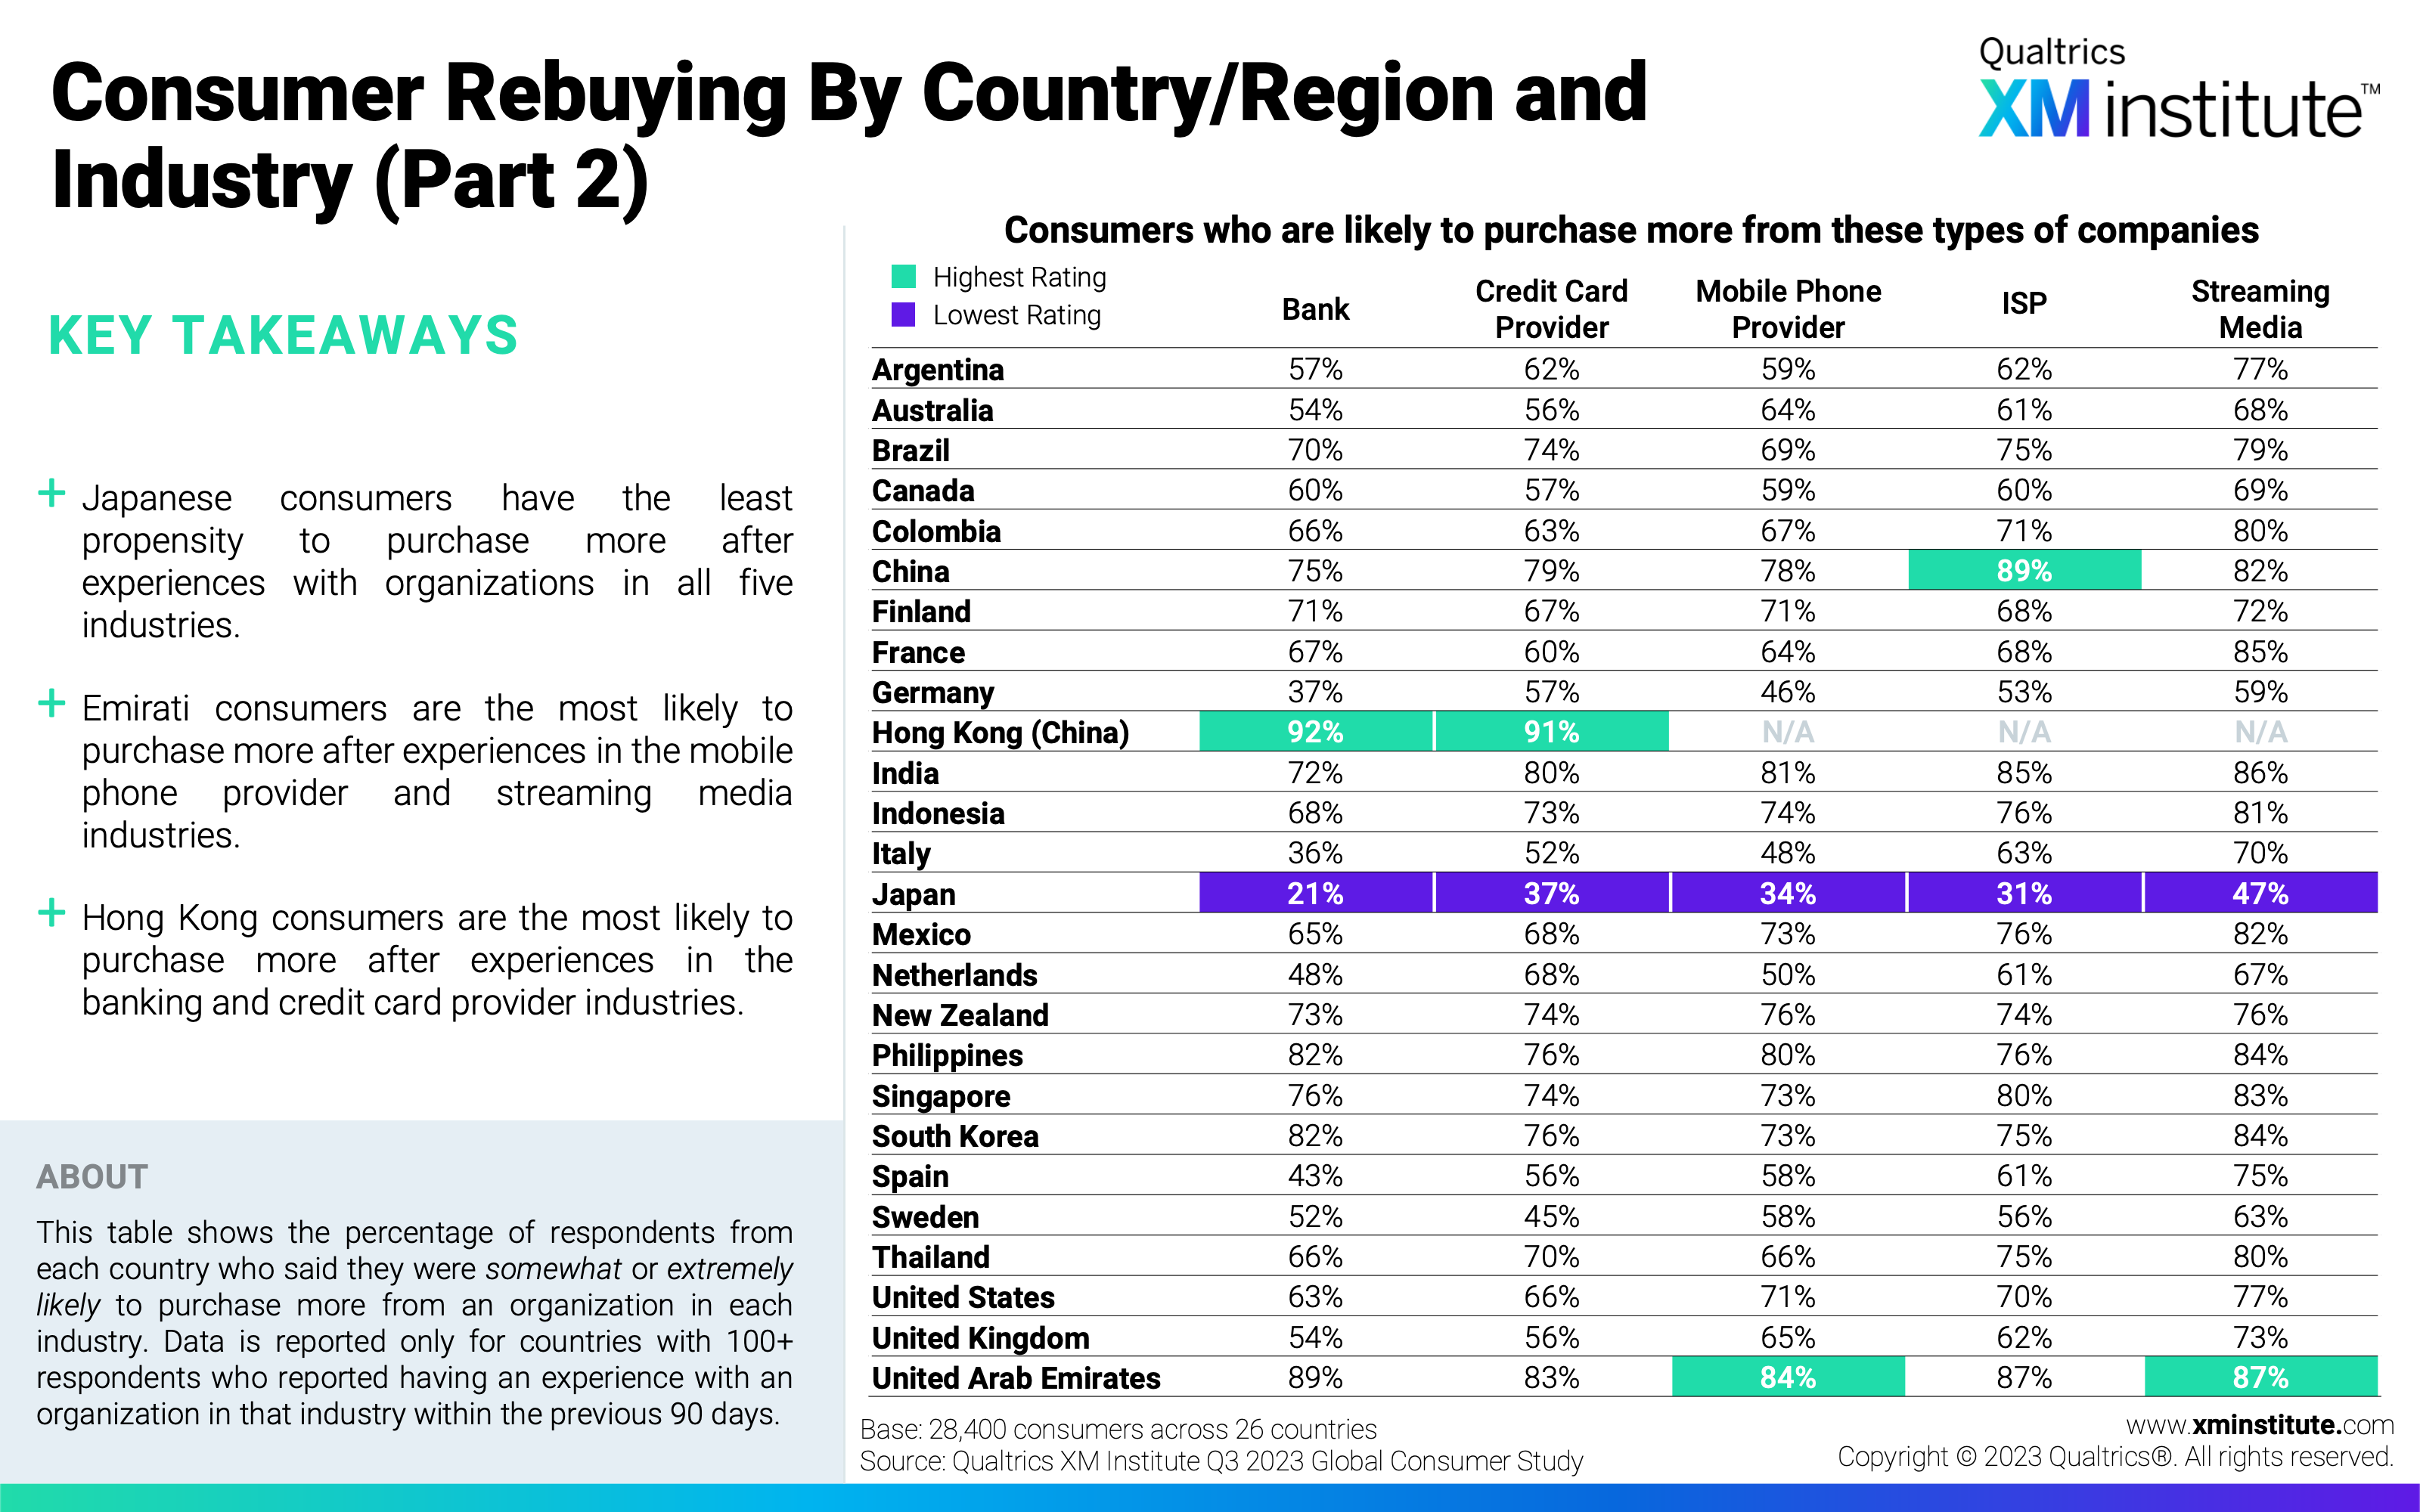
- Consumer Rebuying by Country/Region and Industry (Part 2) (see Figure 30)
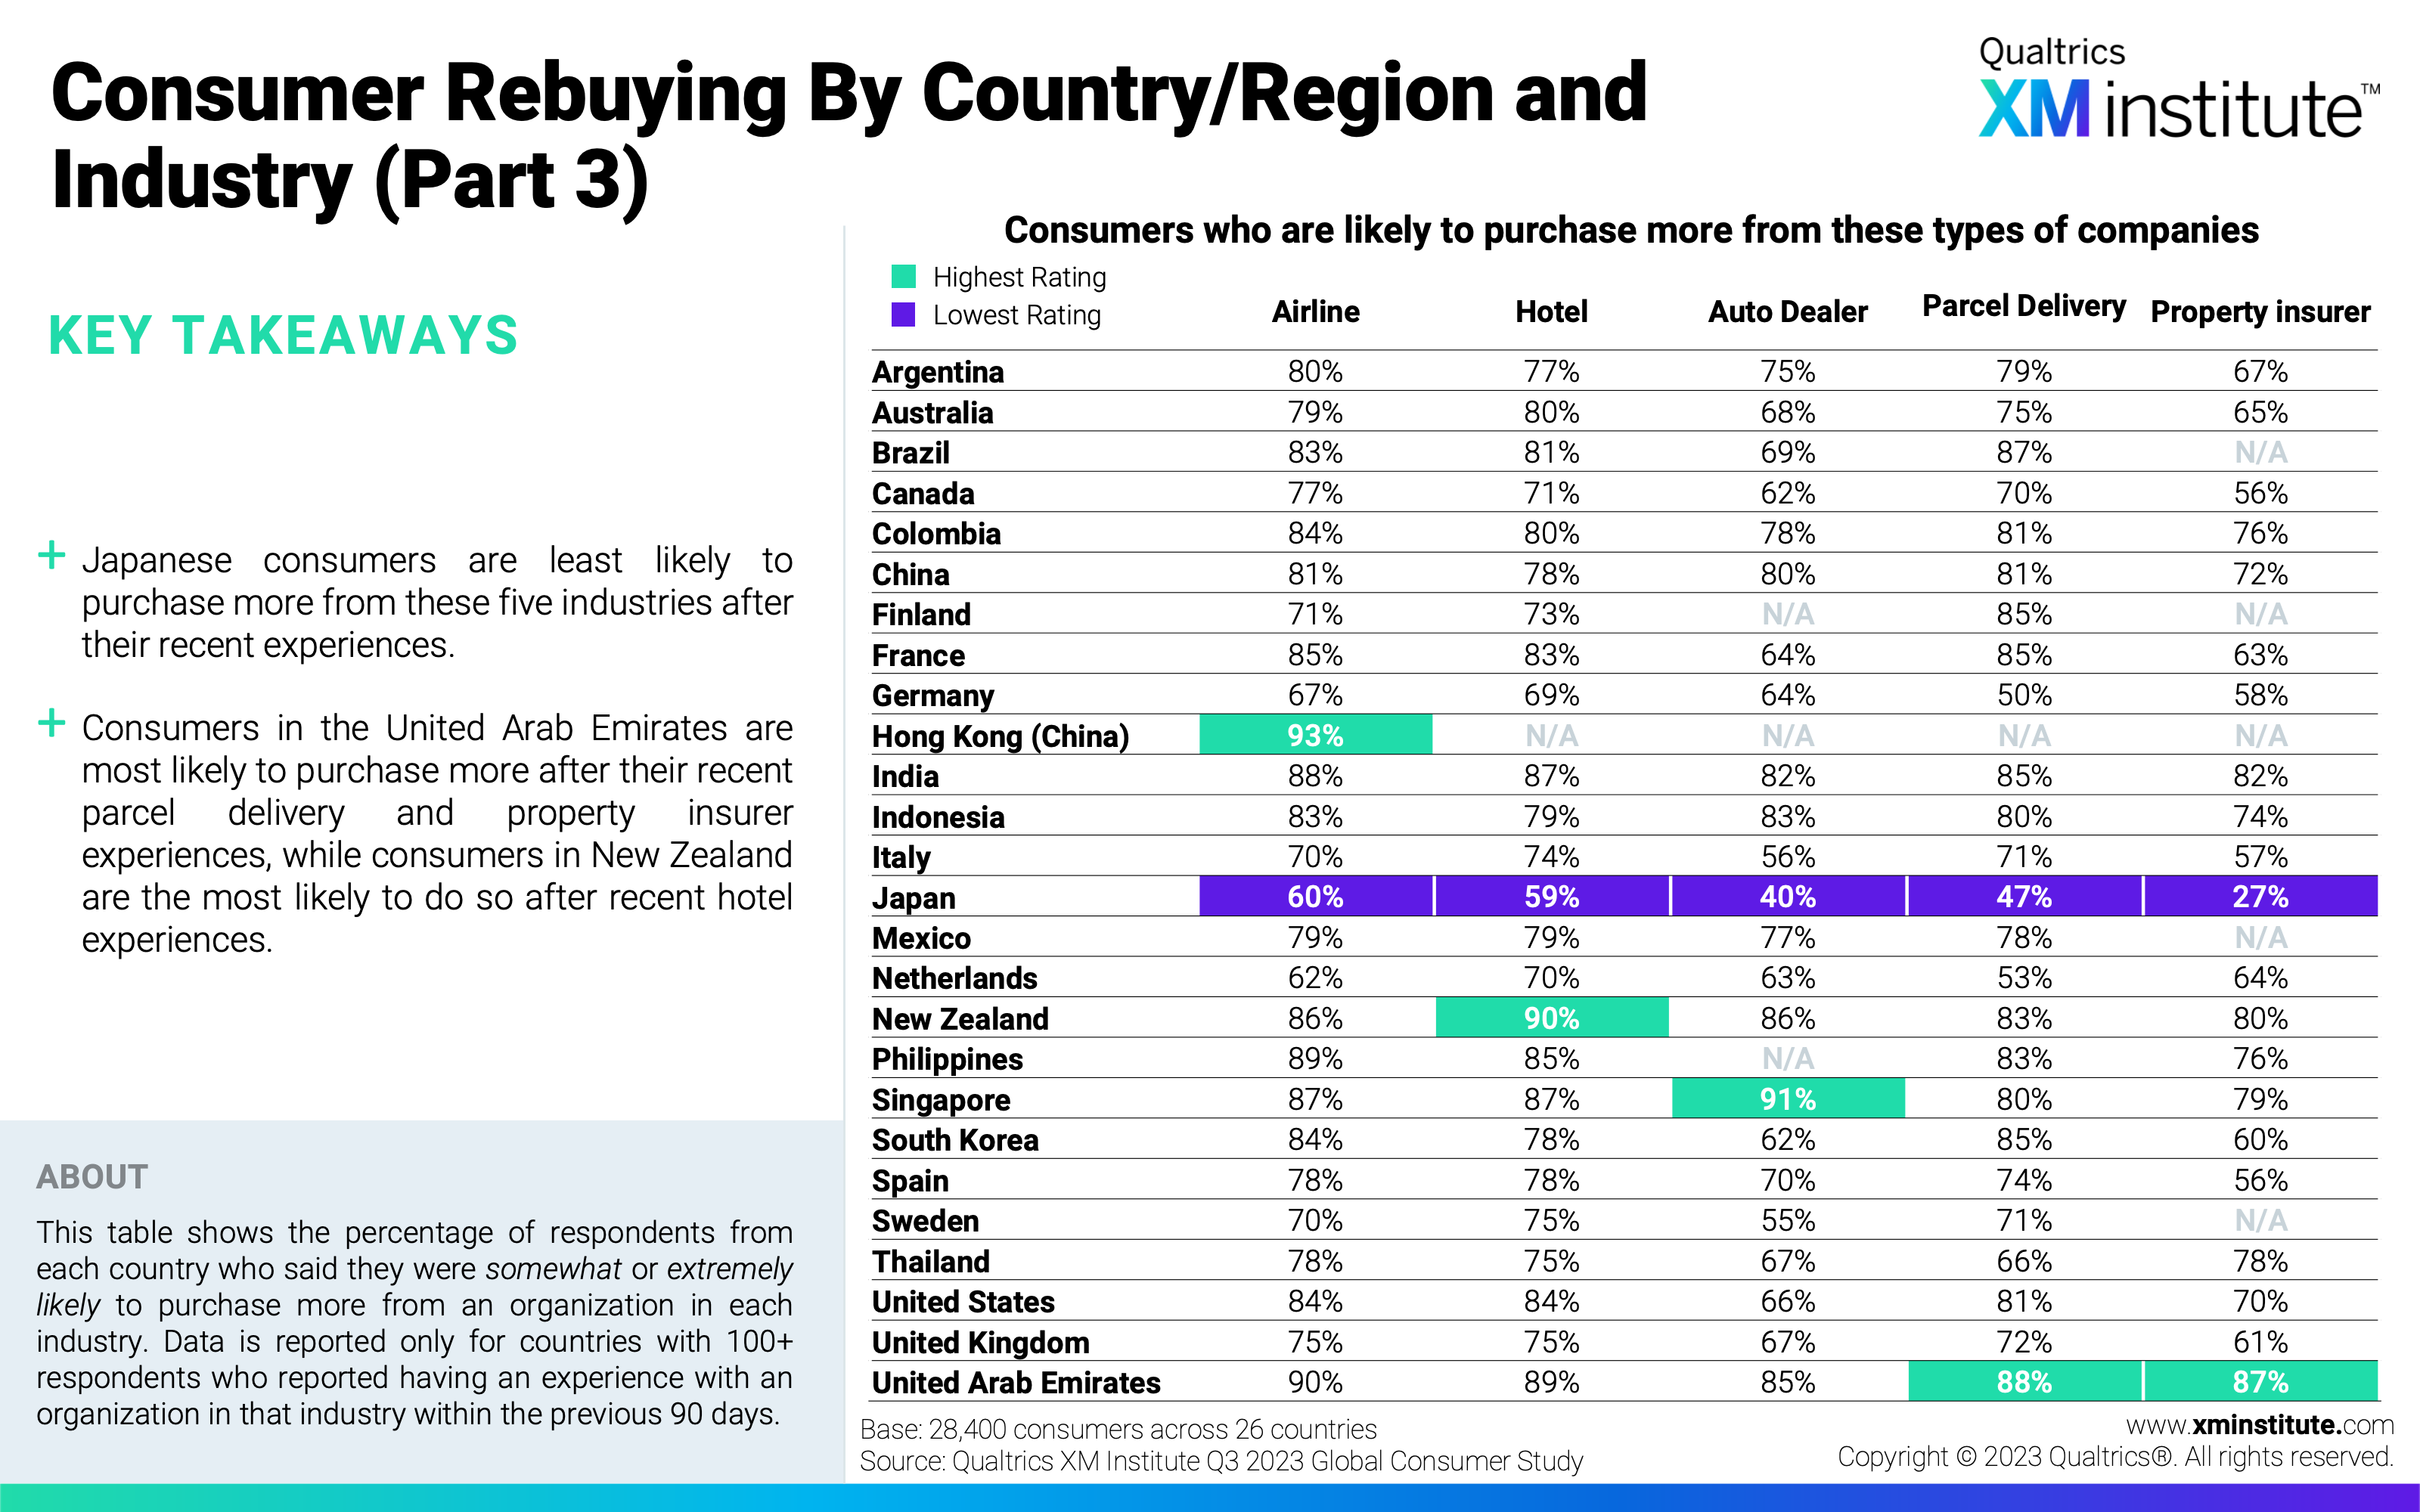
- Consumer Rebuying by Country/Region and Industry (Part 3) (see Figure 31)
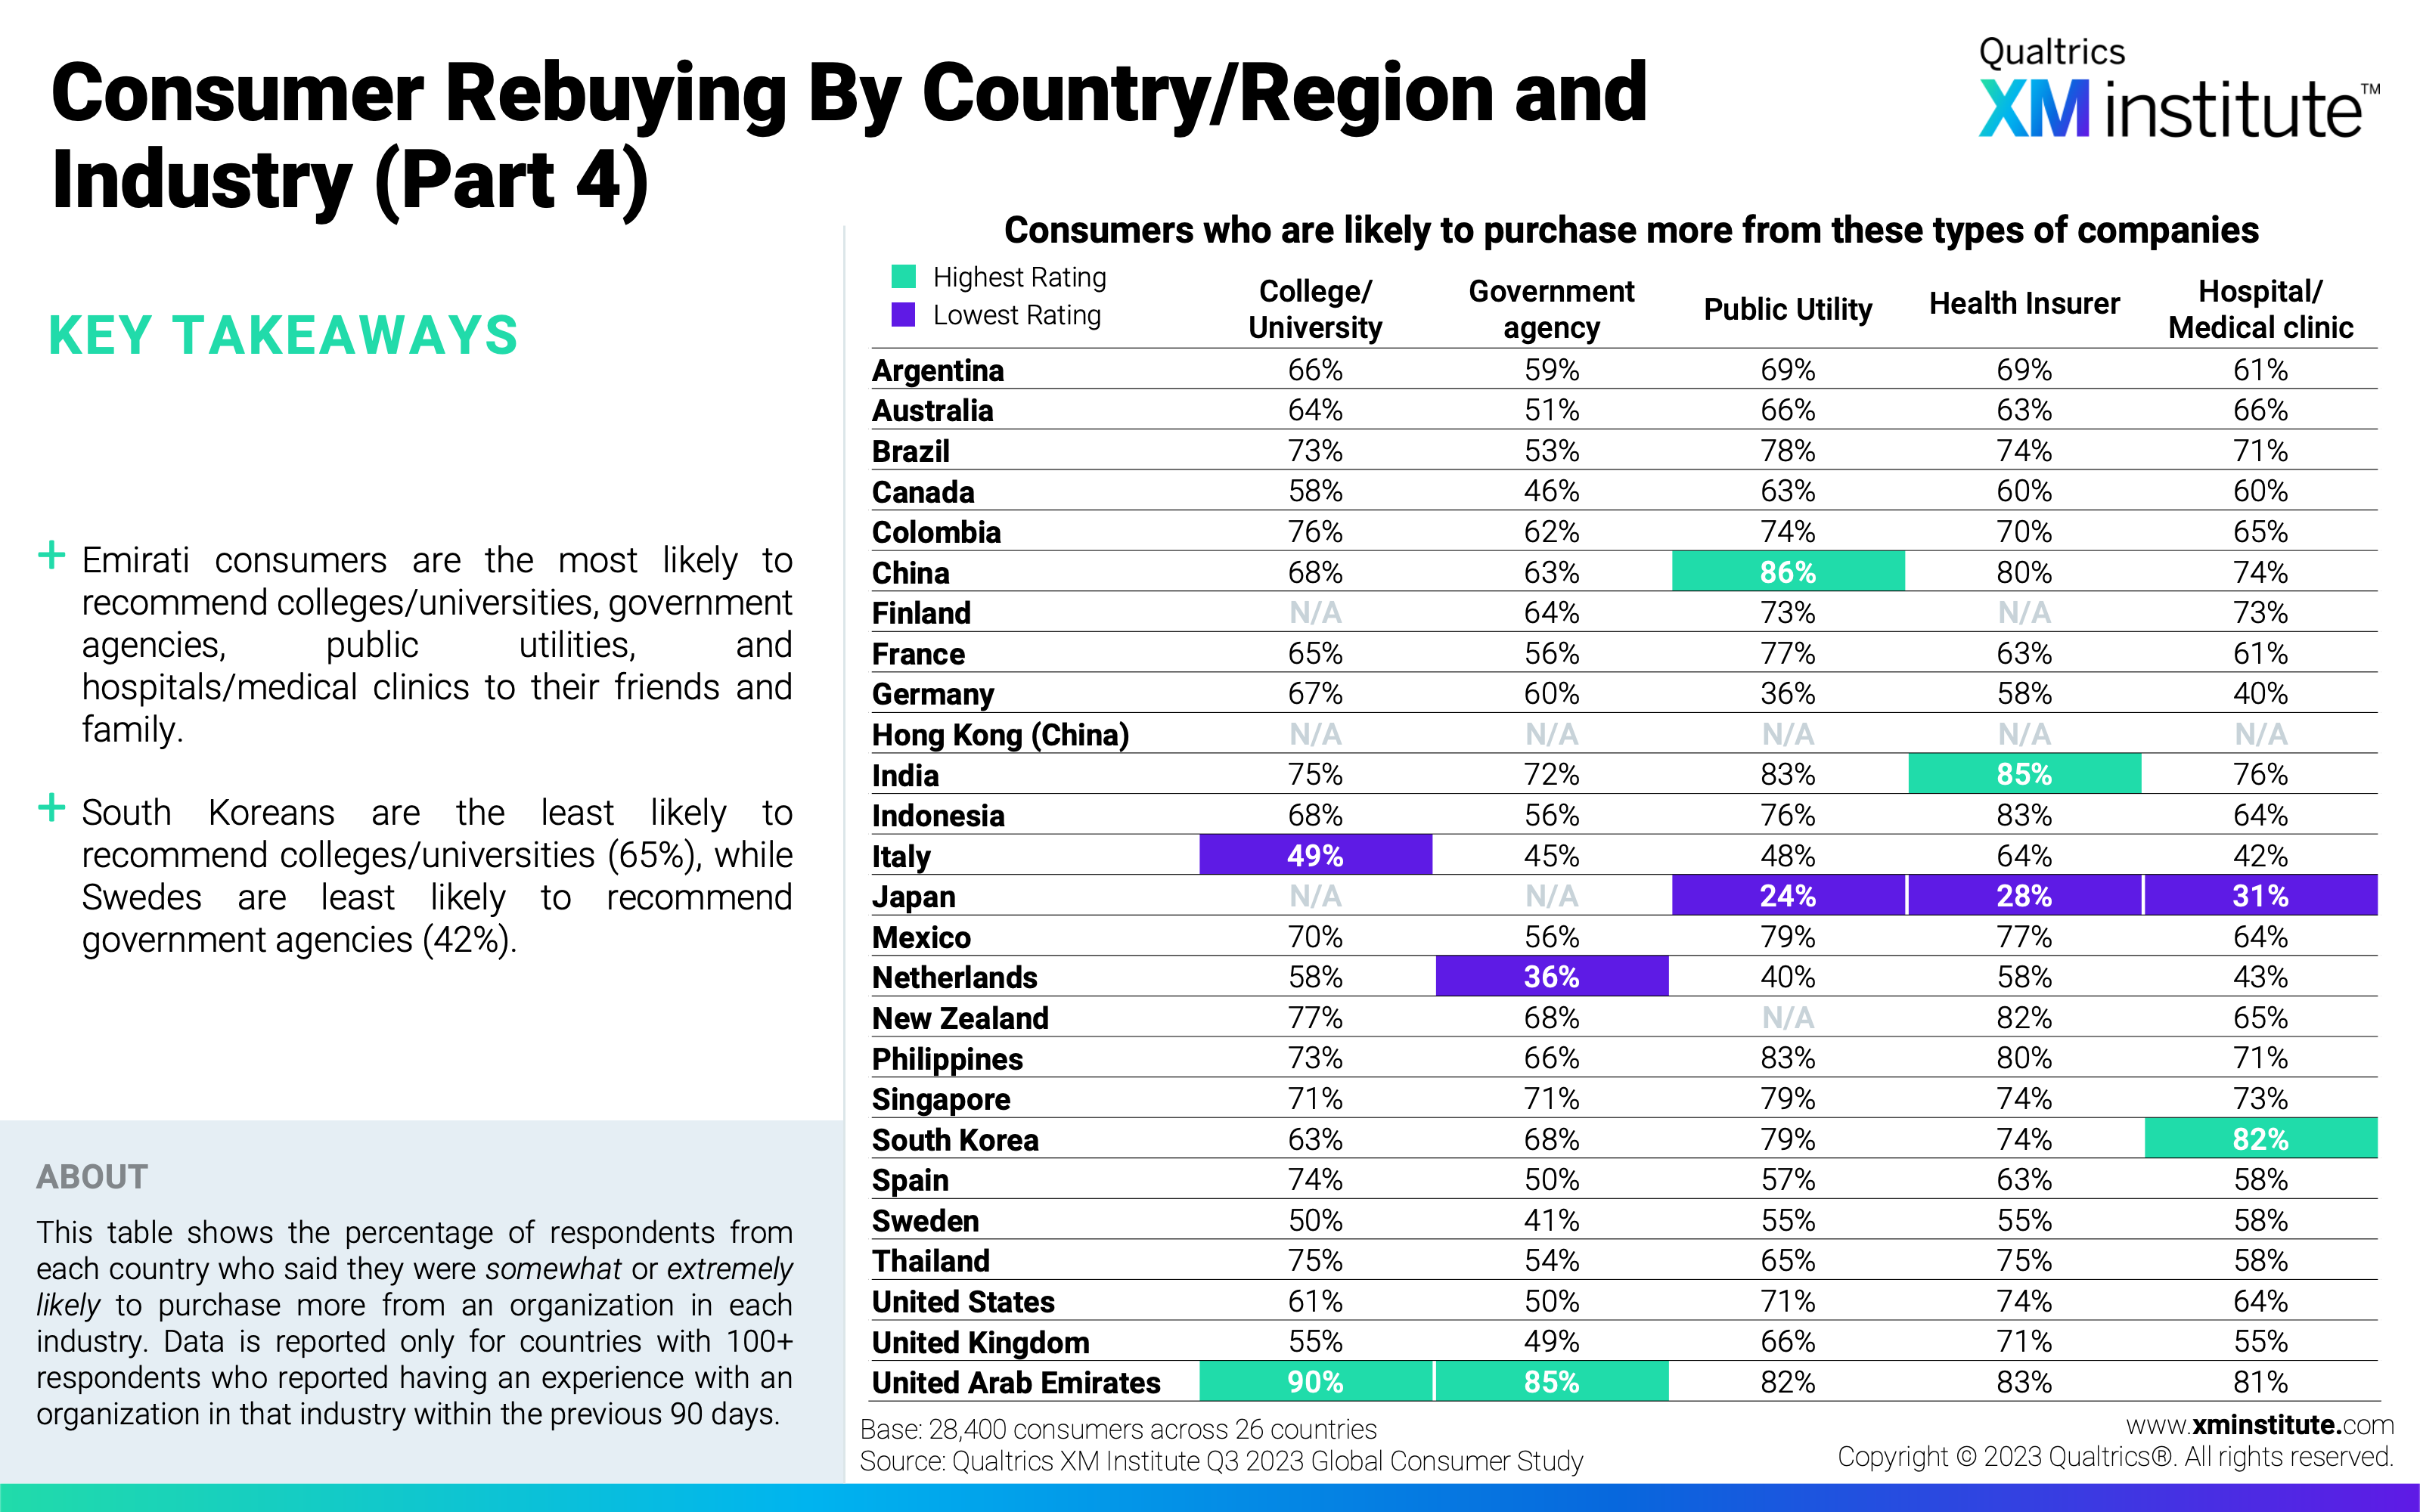
- Consumer Rebuying by Country/Region and Industry (Part 4) (see Figure 32)
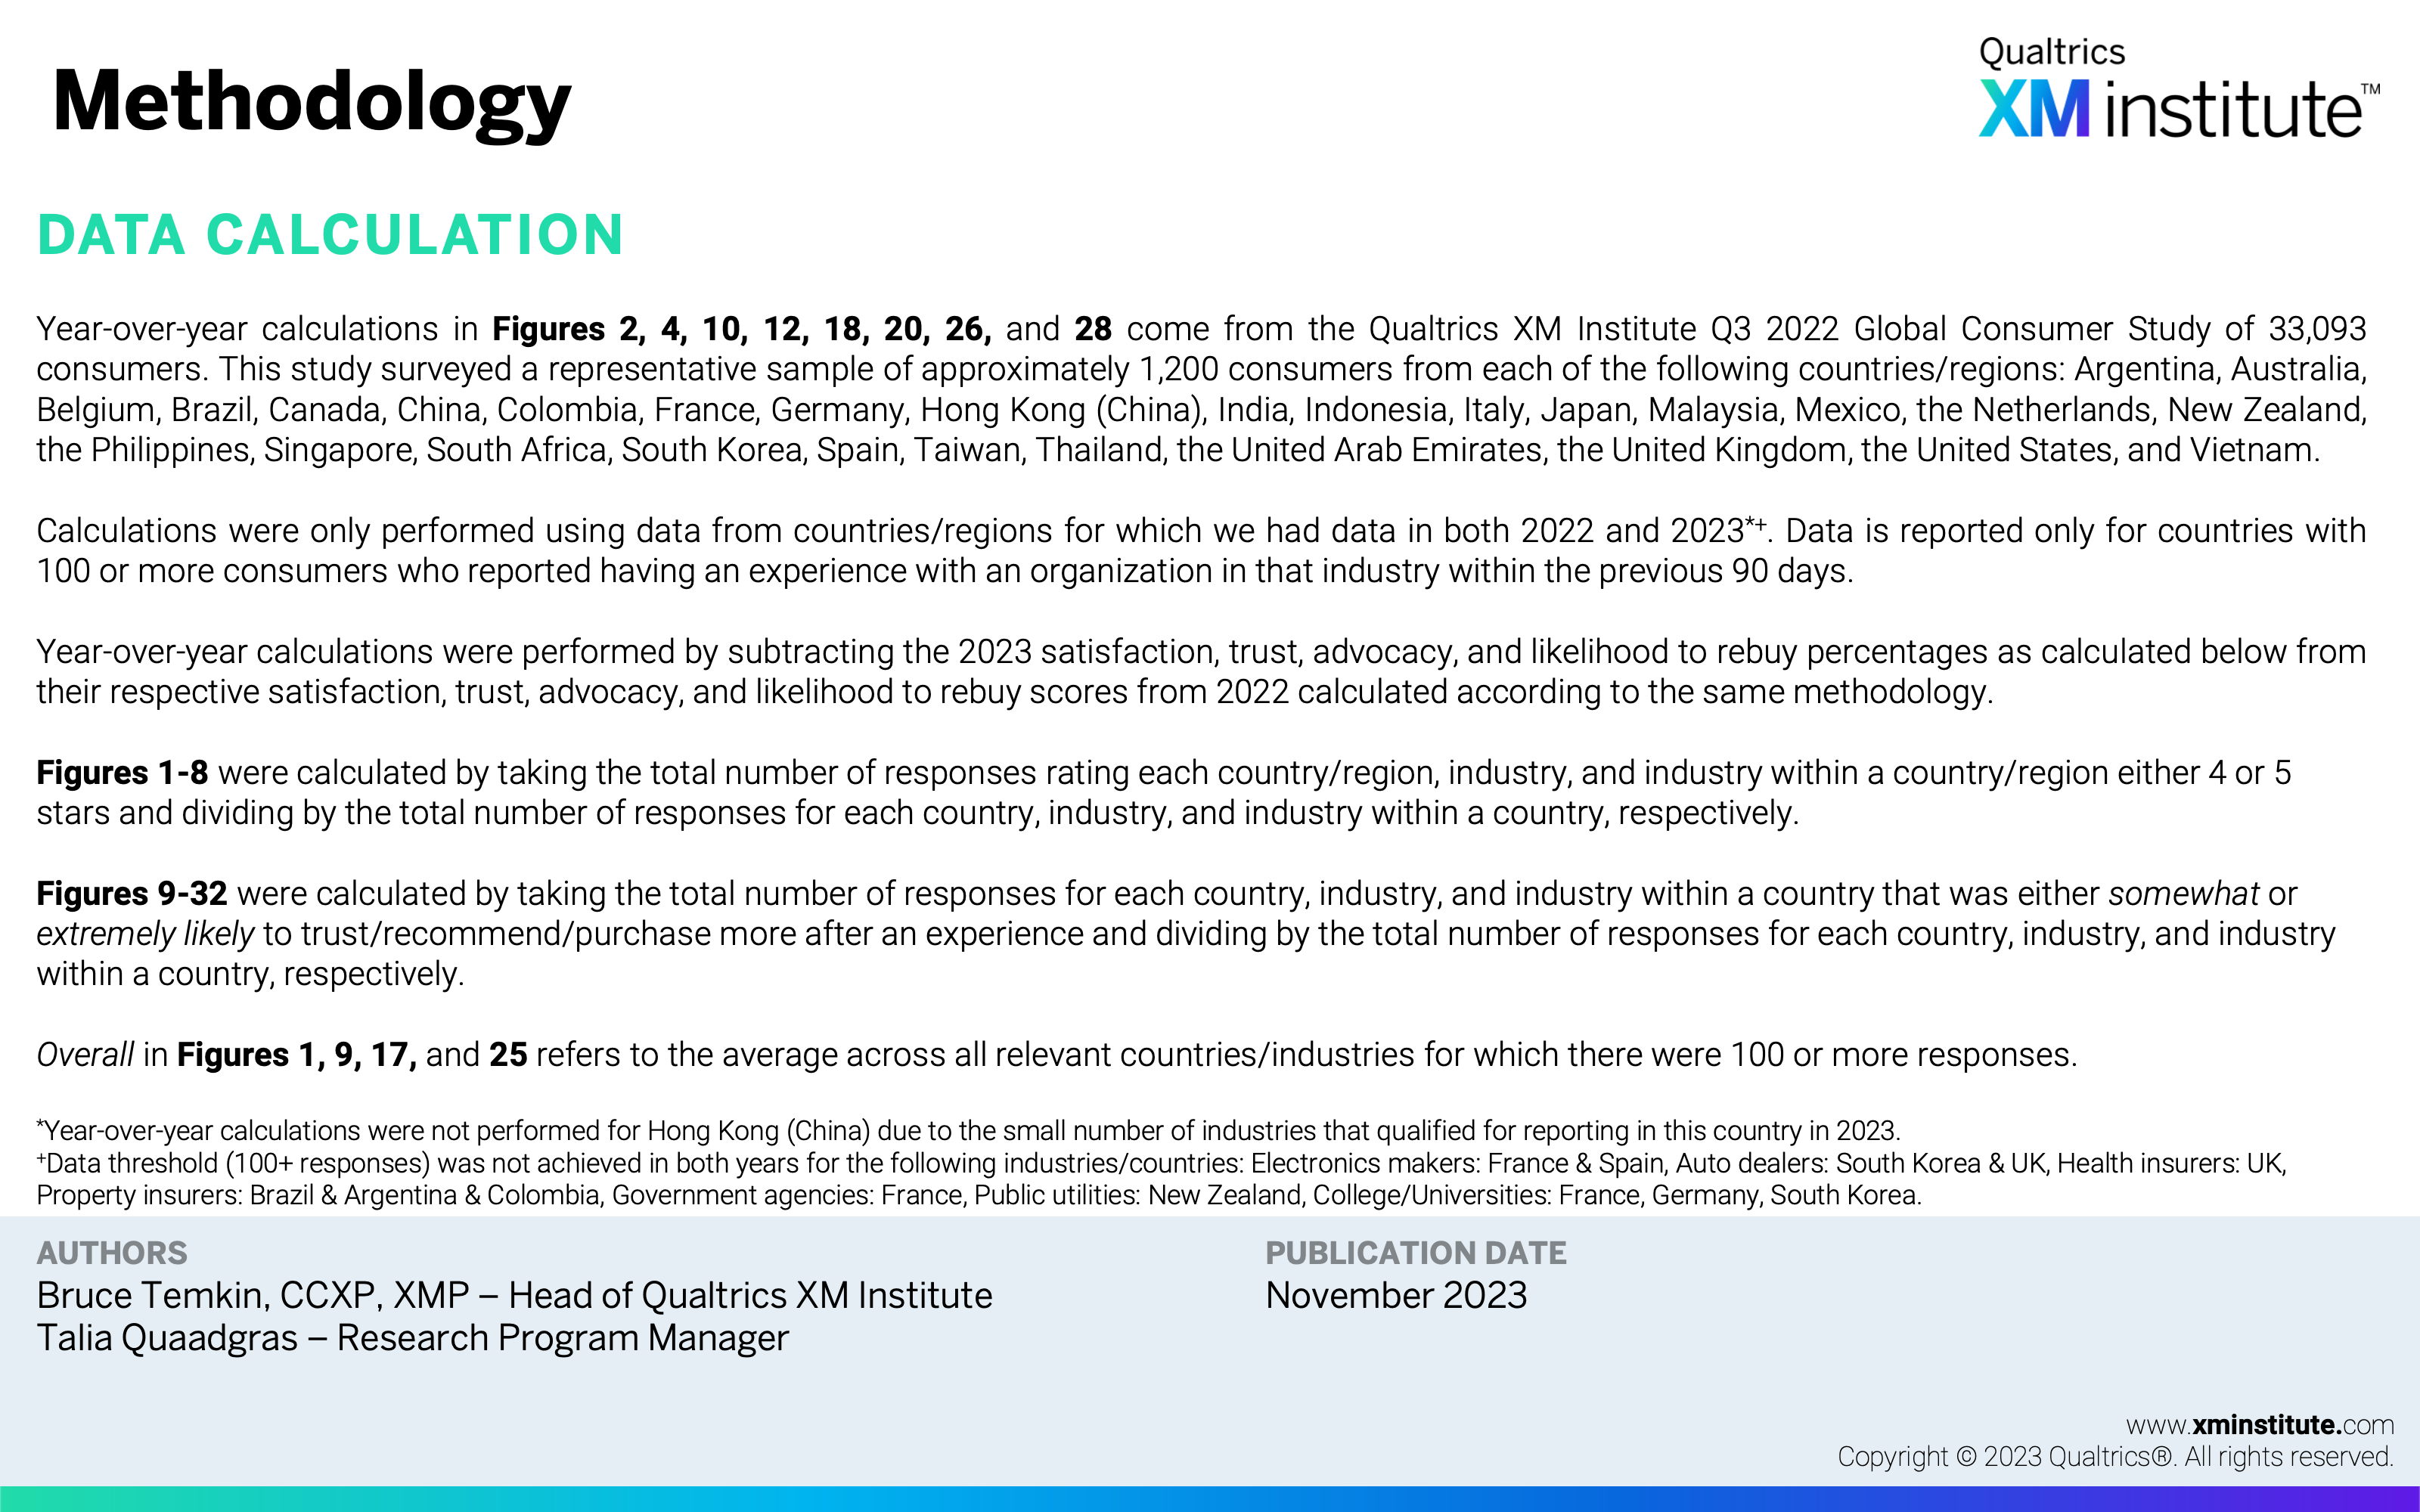
- Methodology (see Figure 33)


