Key Findings
Consumers from 29 countries rated their recent contact center interactions, evaluating their overall satisfaction with the experience, their satisfaction with the wait time, and their satisfaction with the agent’s knowledge, empathy, and helpfulness. These consumers then told us how likely they are to demonstrate three key loyalty behaviors — purchasing more from, trusting, and recommending the company — following their recent contact center experience. From our analysis, we found that:
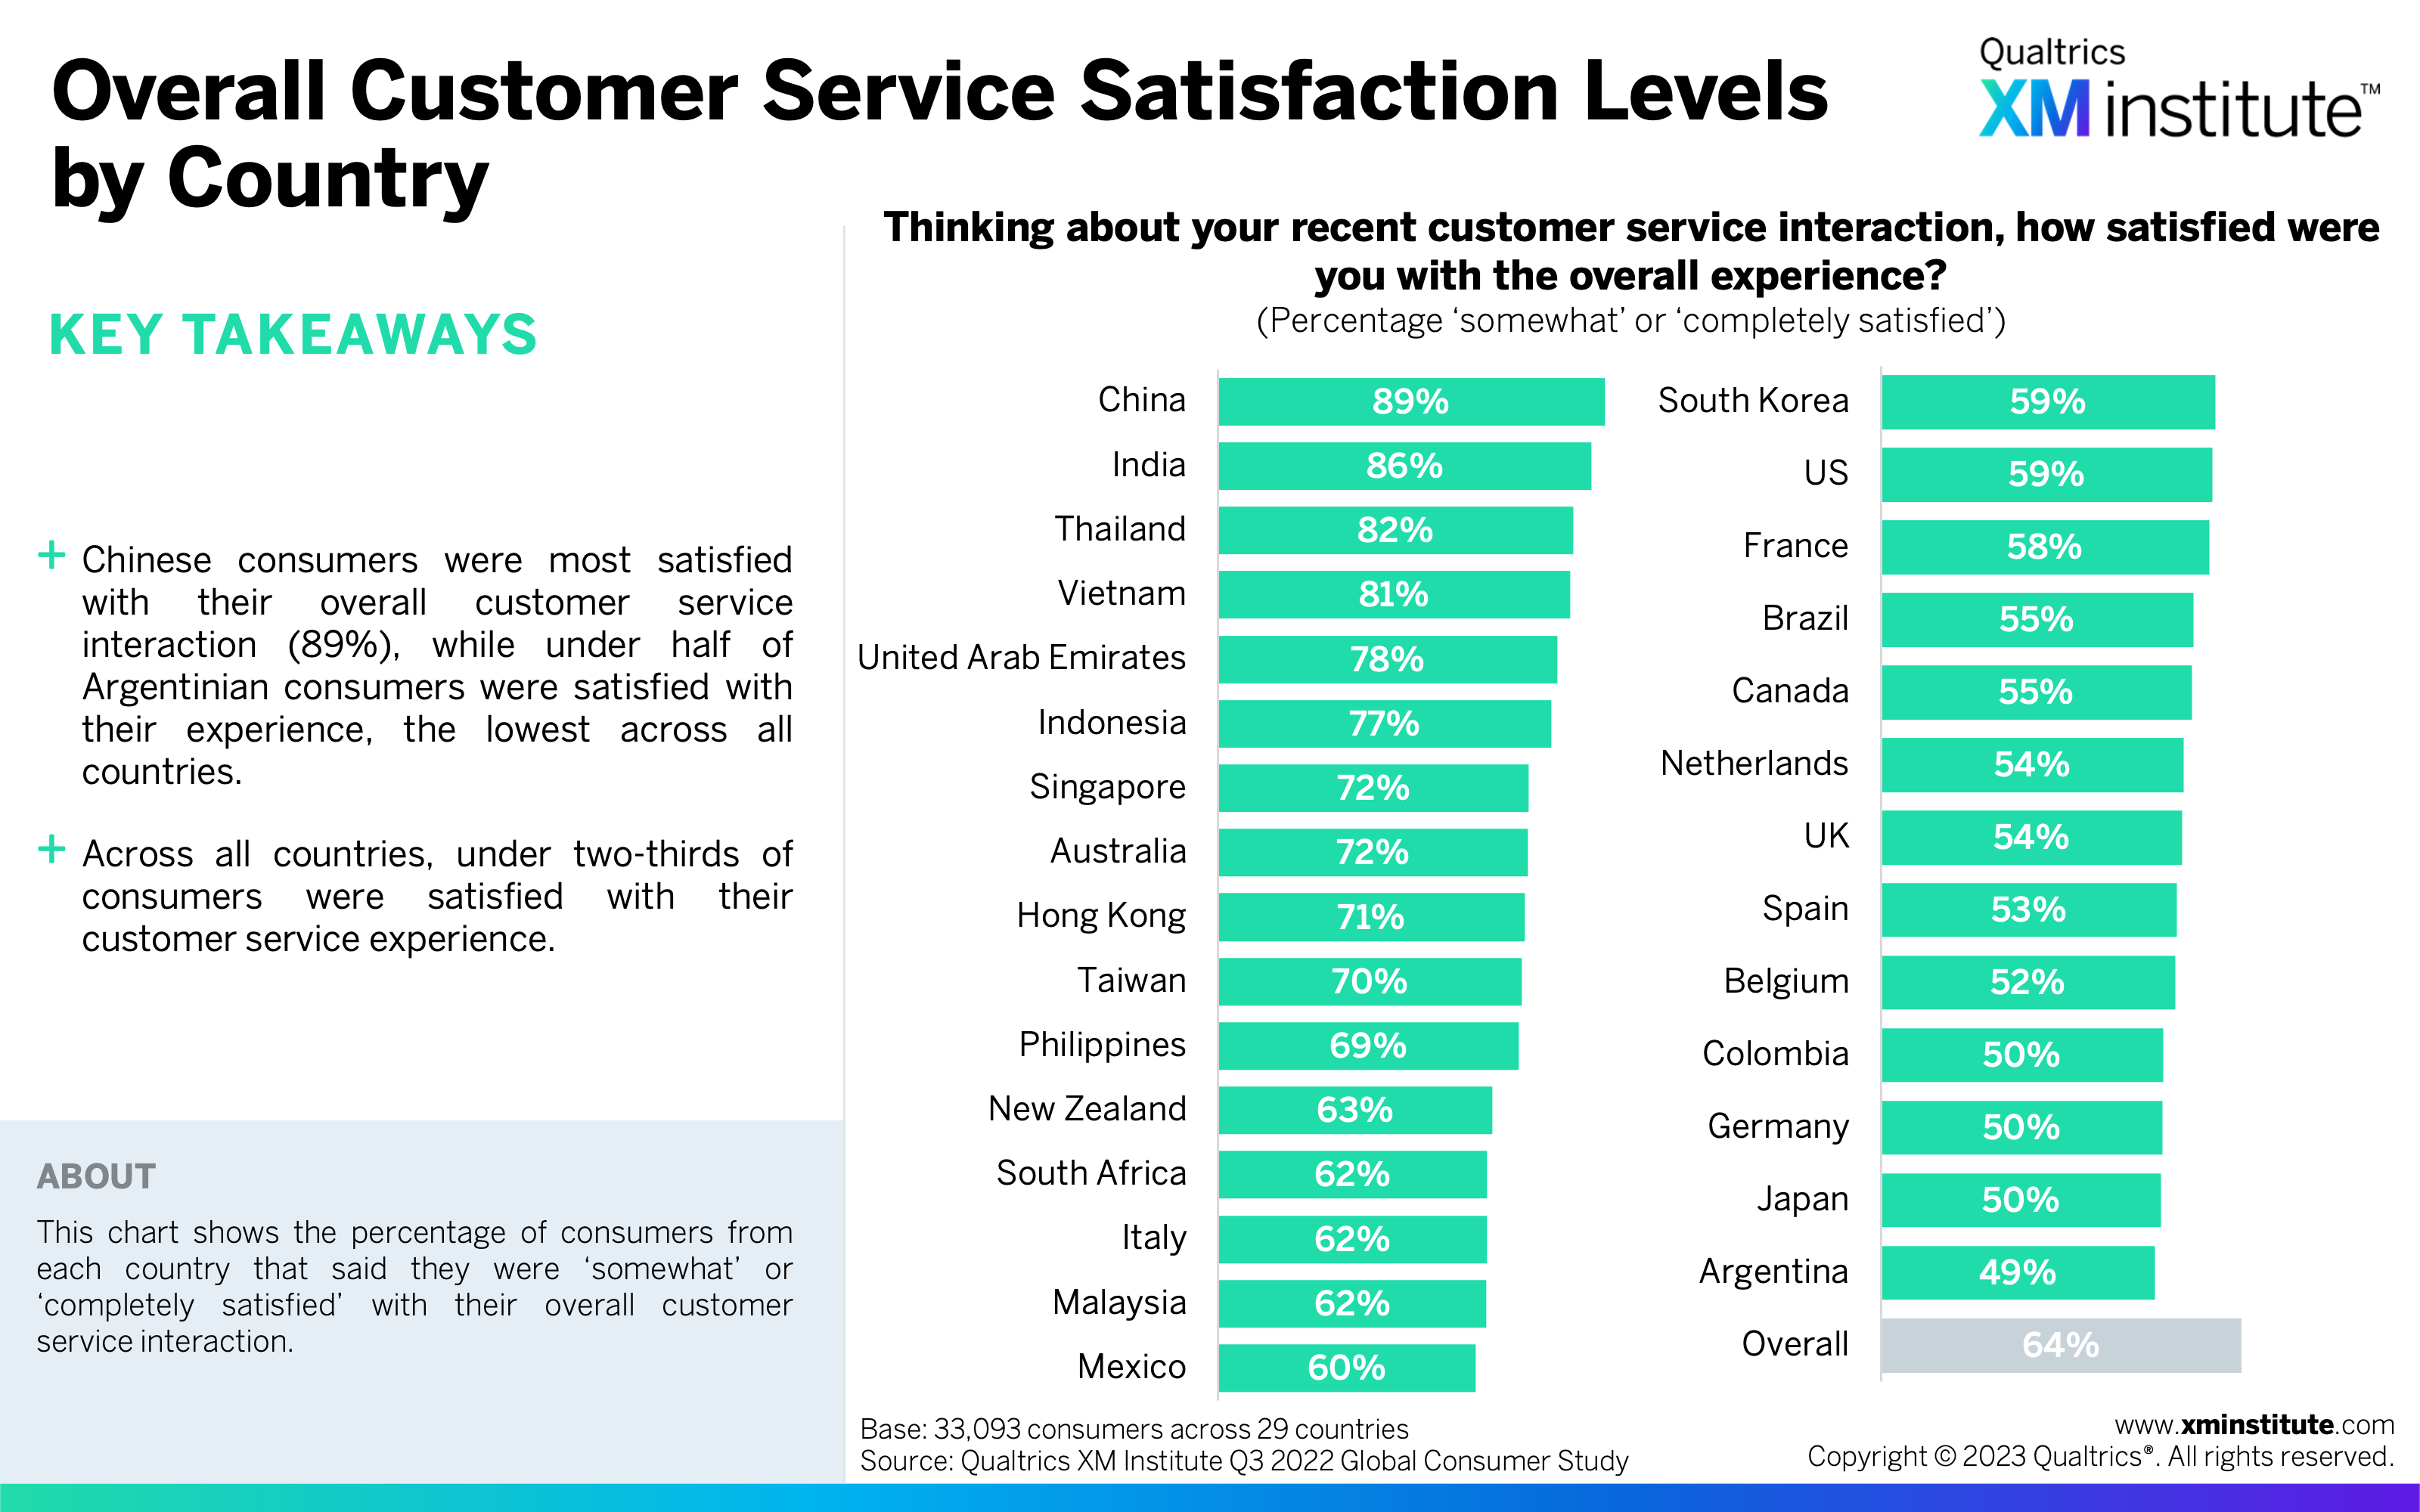
- Under two-thirds of customer service experiences are satisfactory. Across all countries, 64% of consumers were satisfied with their customer service experience. Chinese consumers were satisfied most frequently, at 69%, while Argentinian consumers were satisfied least frequently, at just 49%.
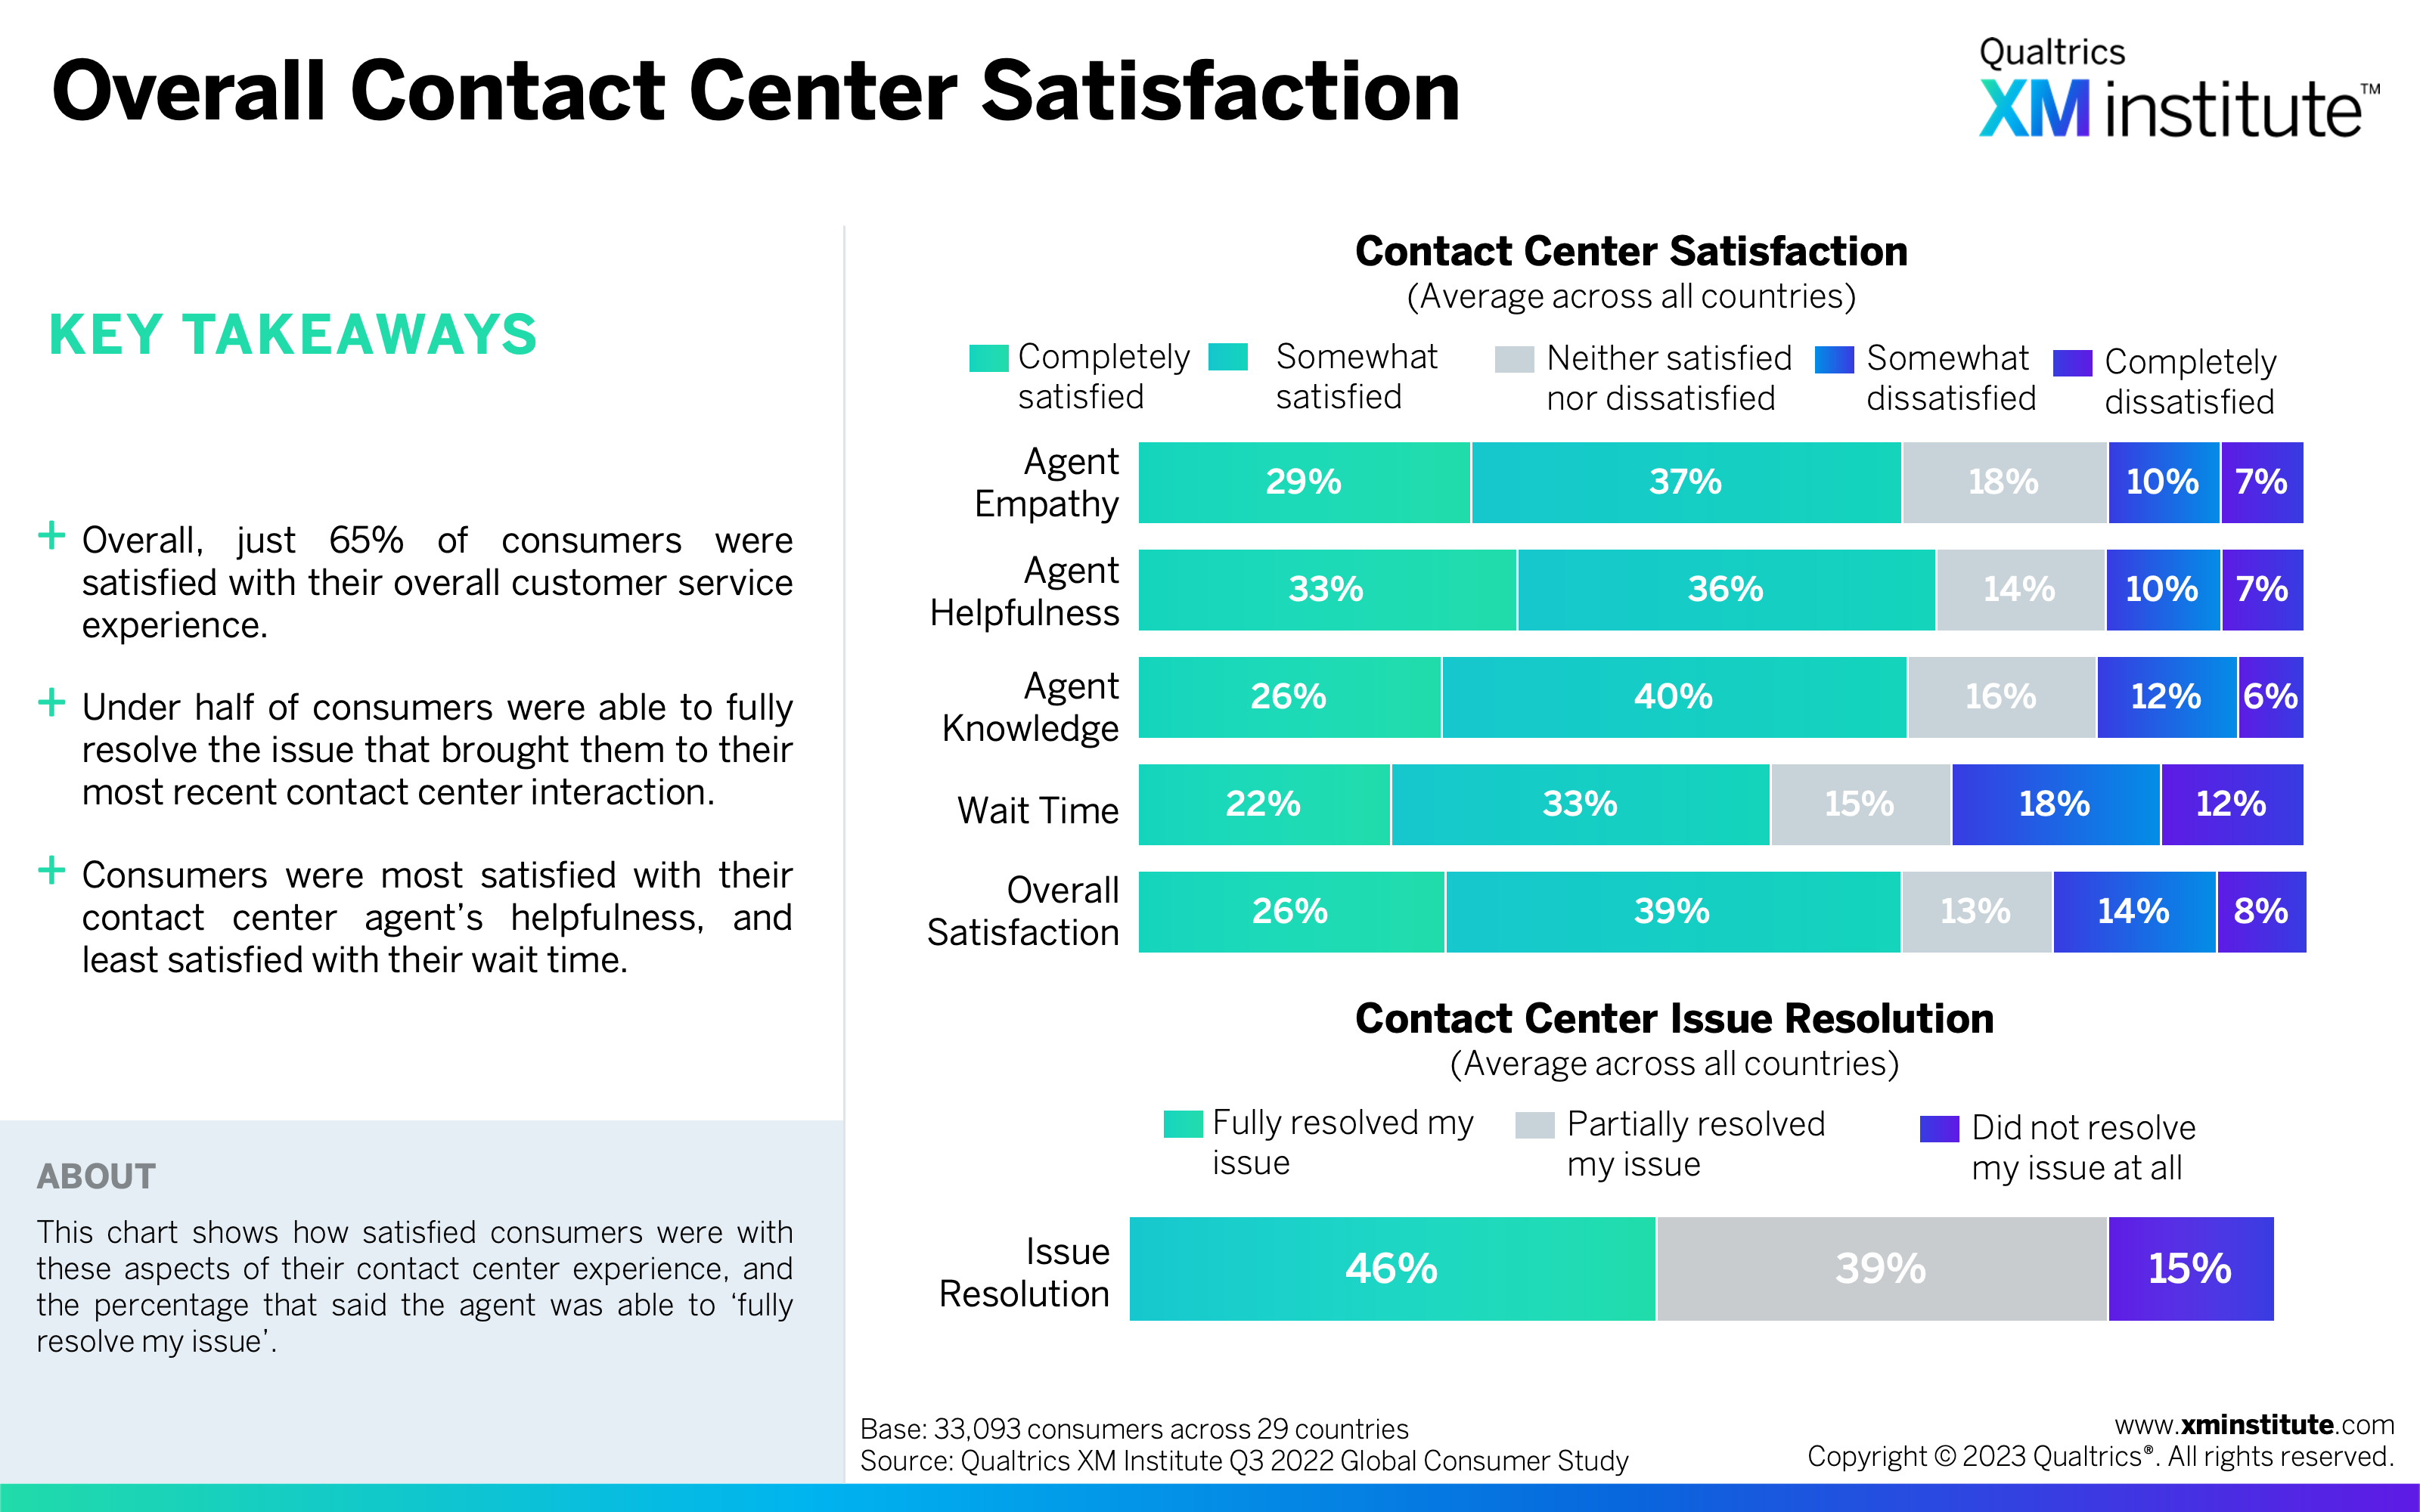
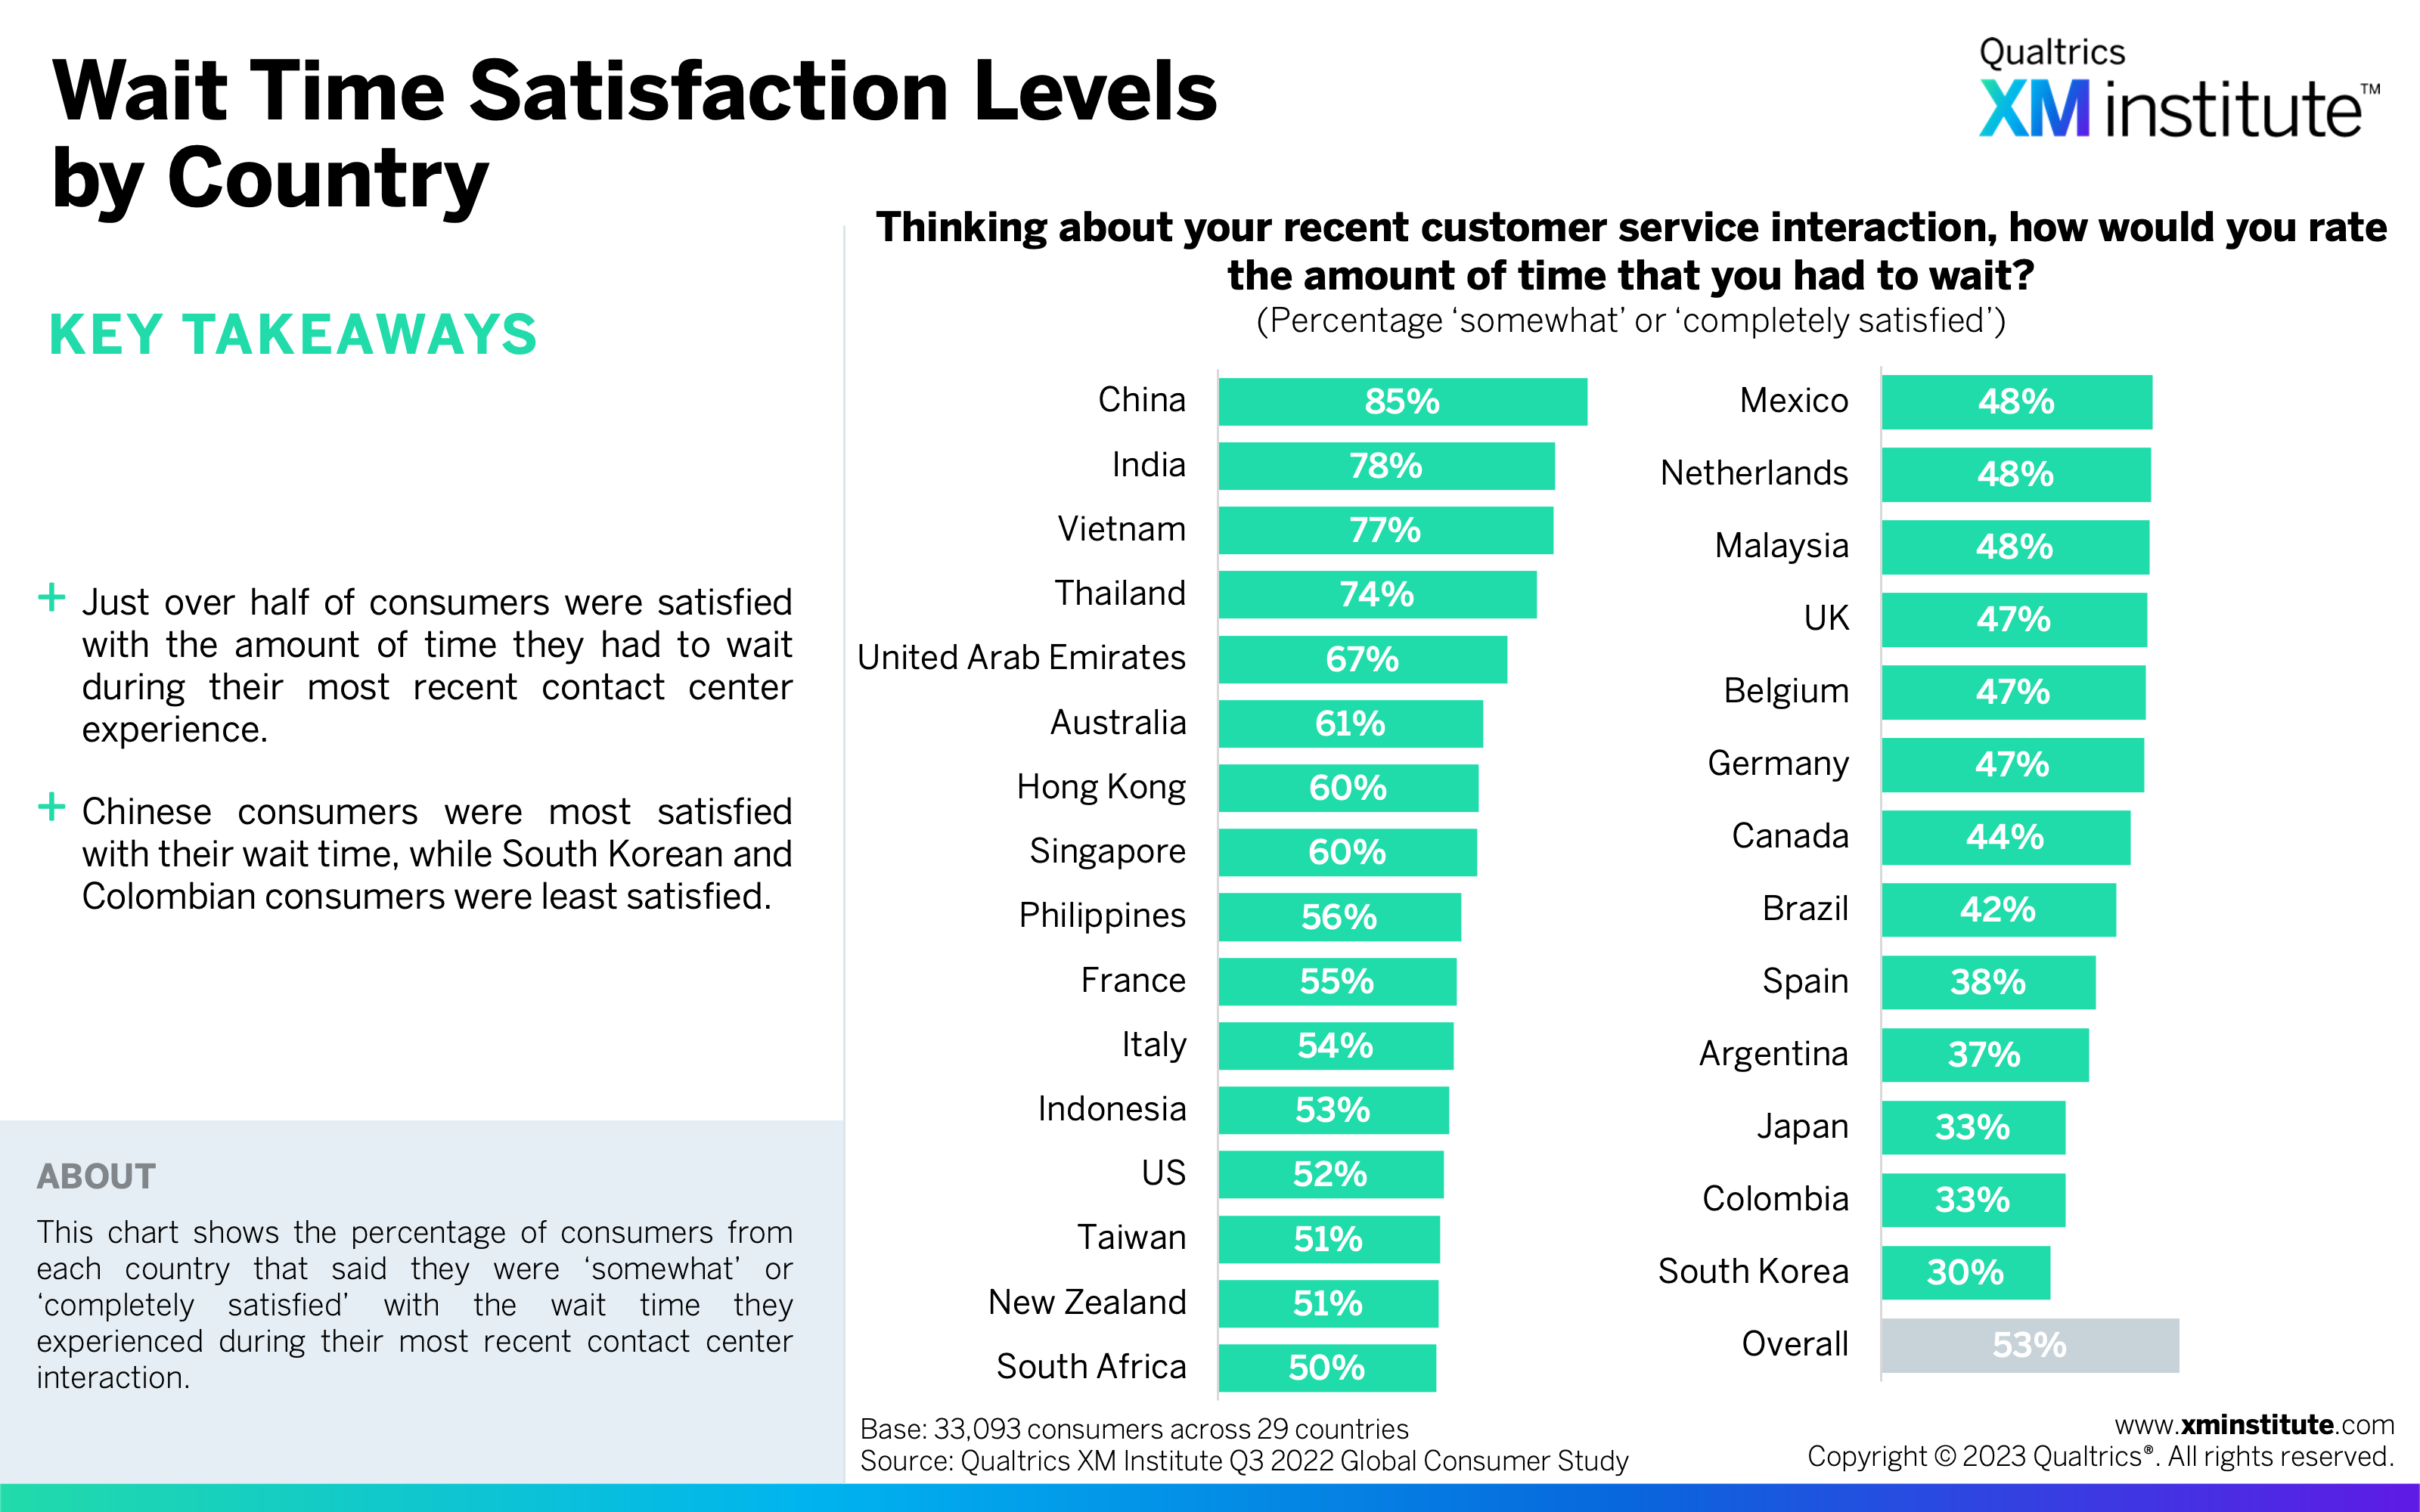
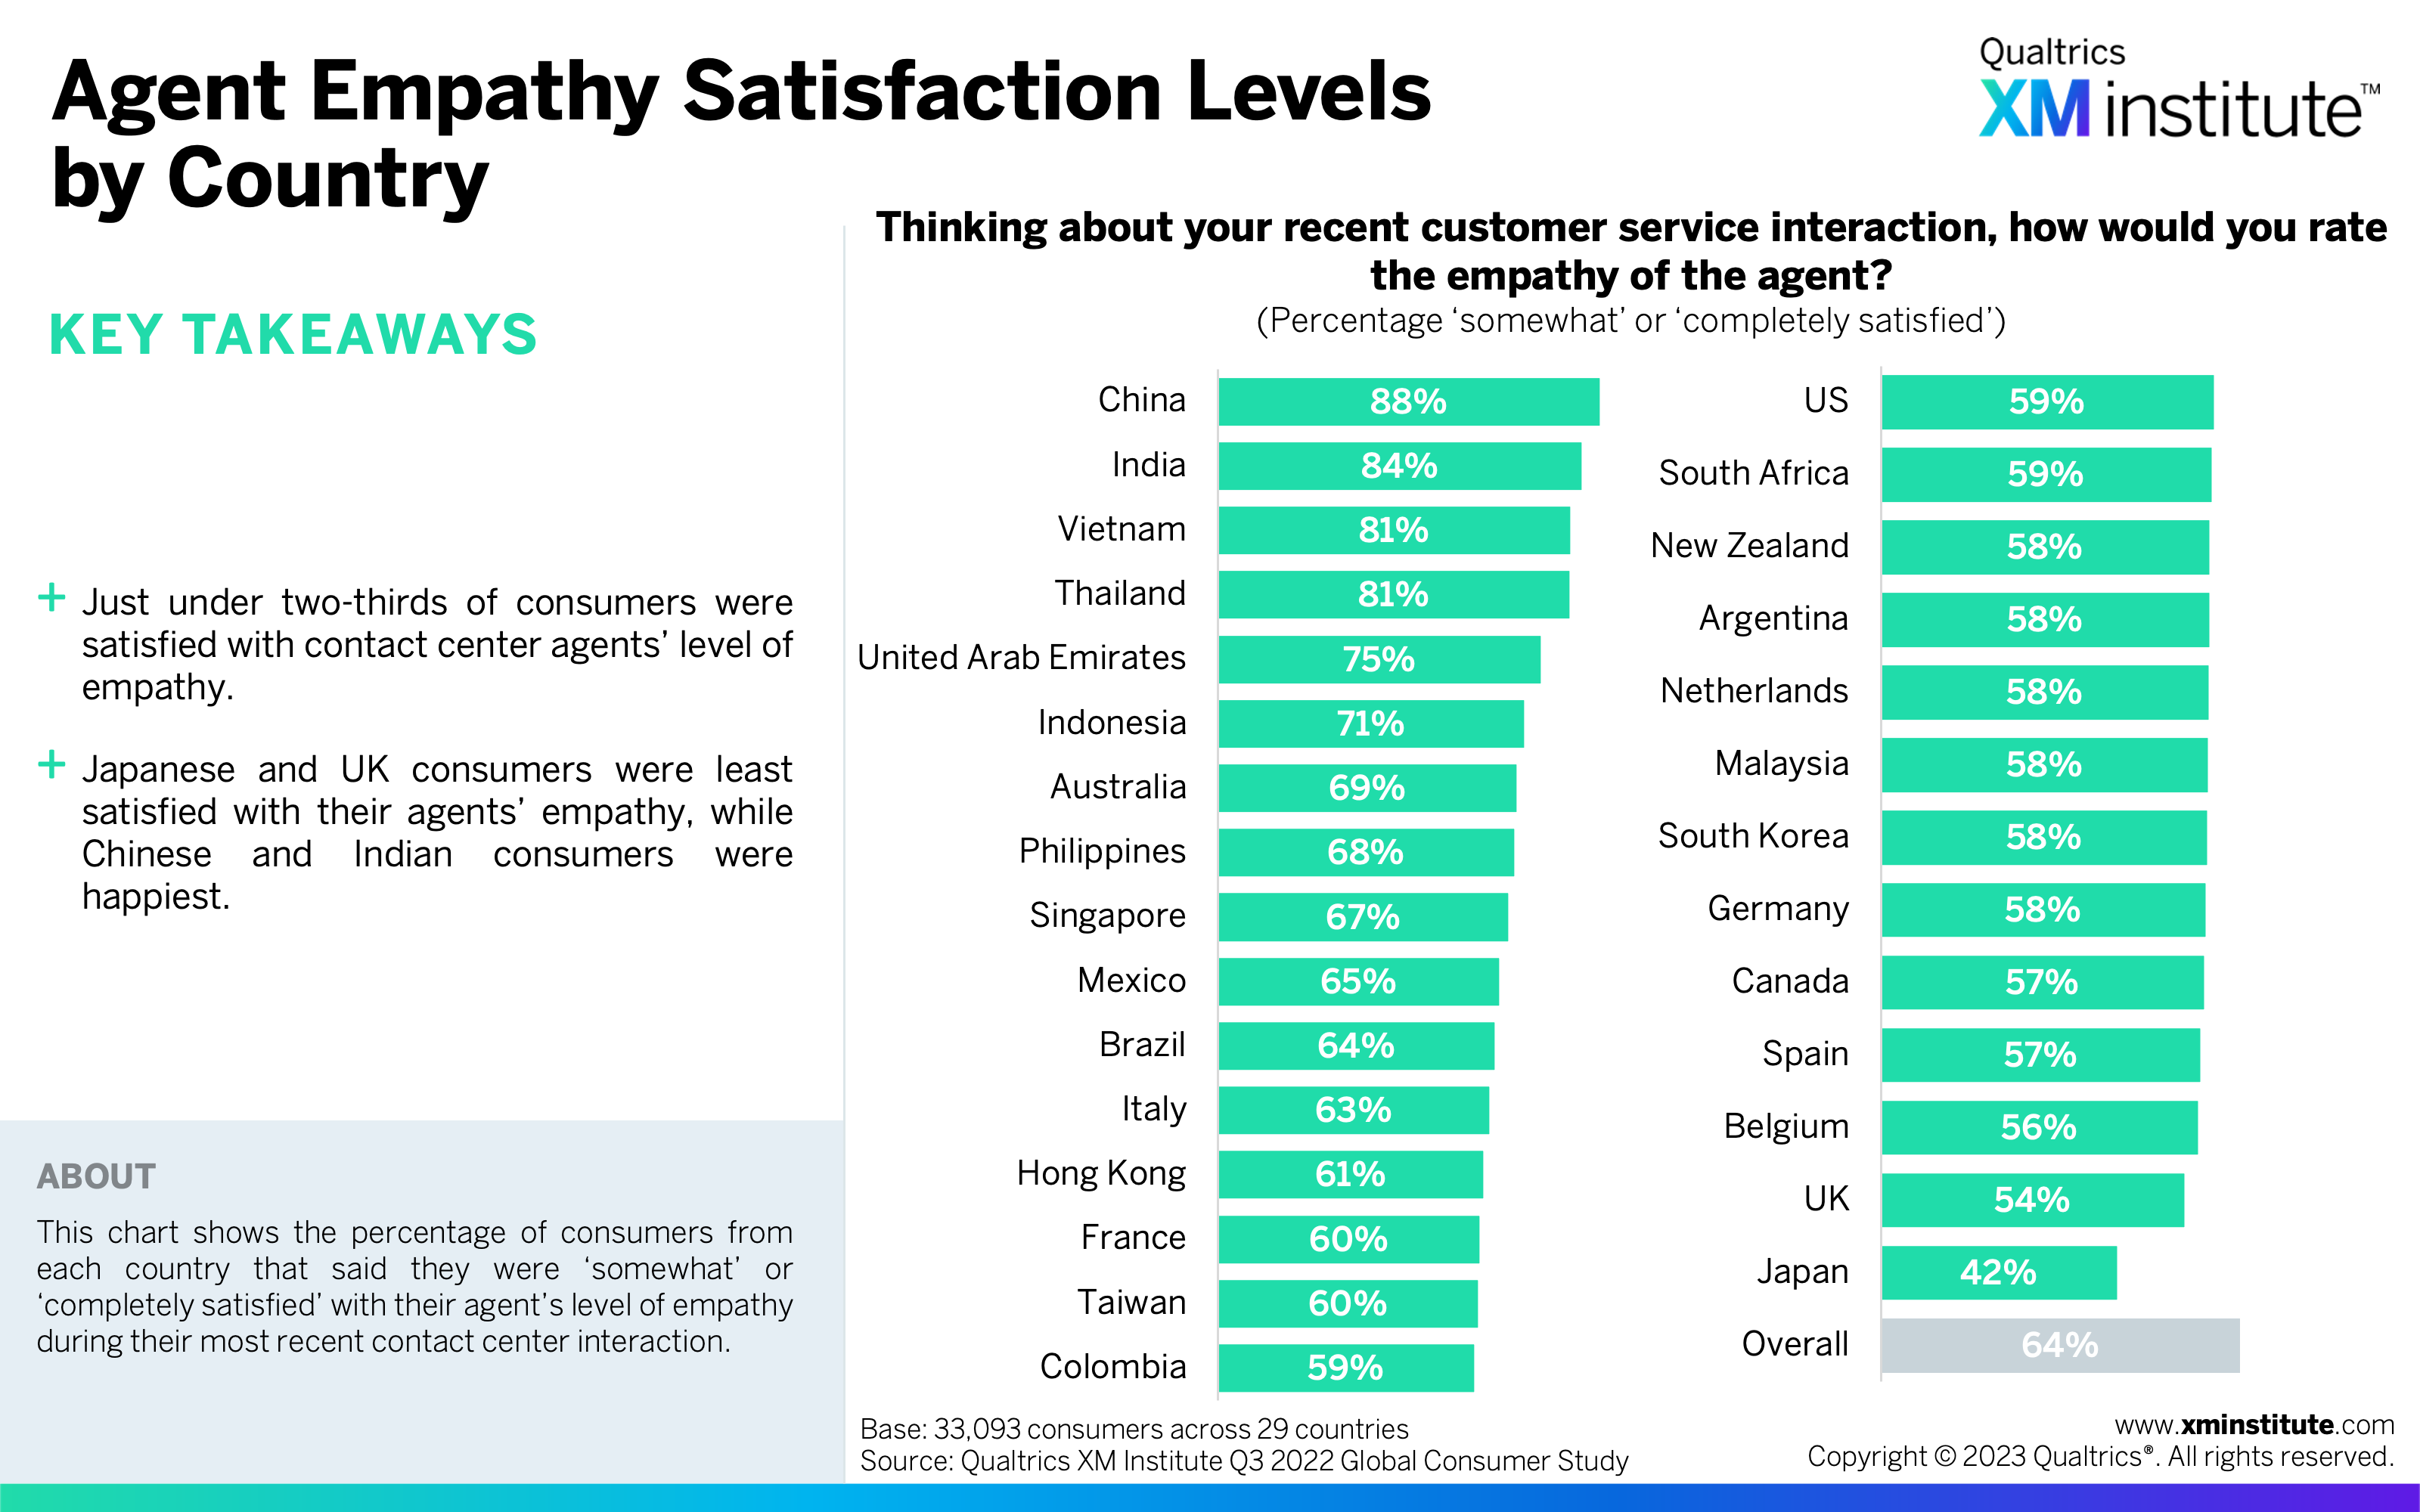
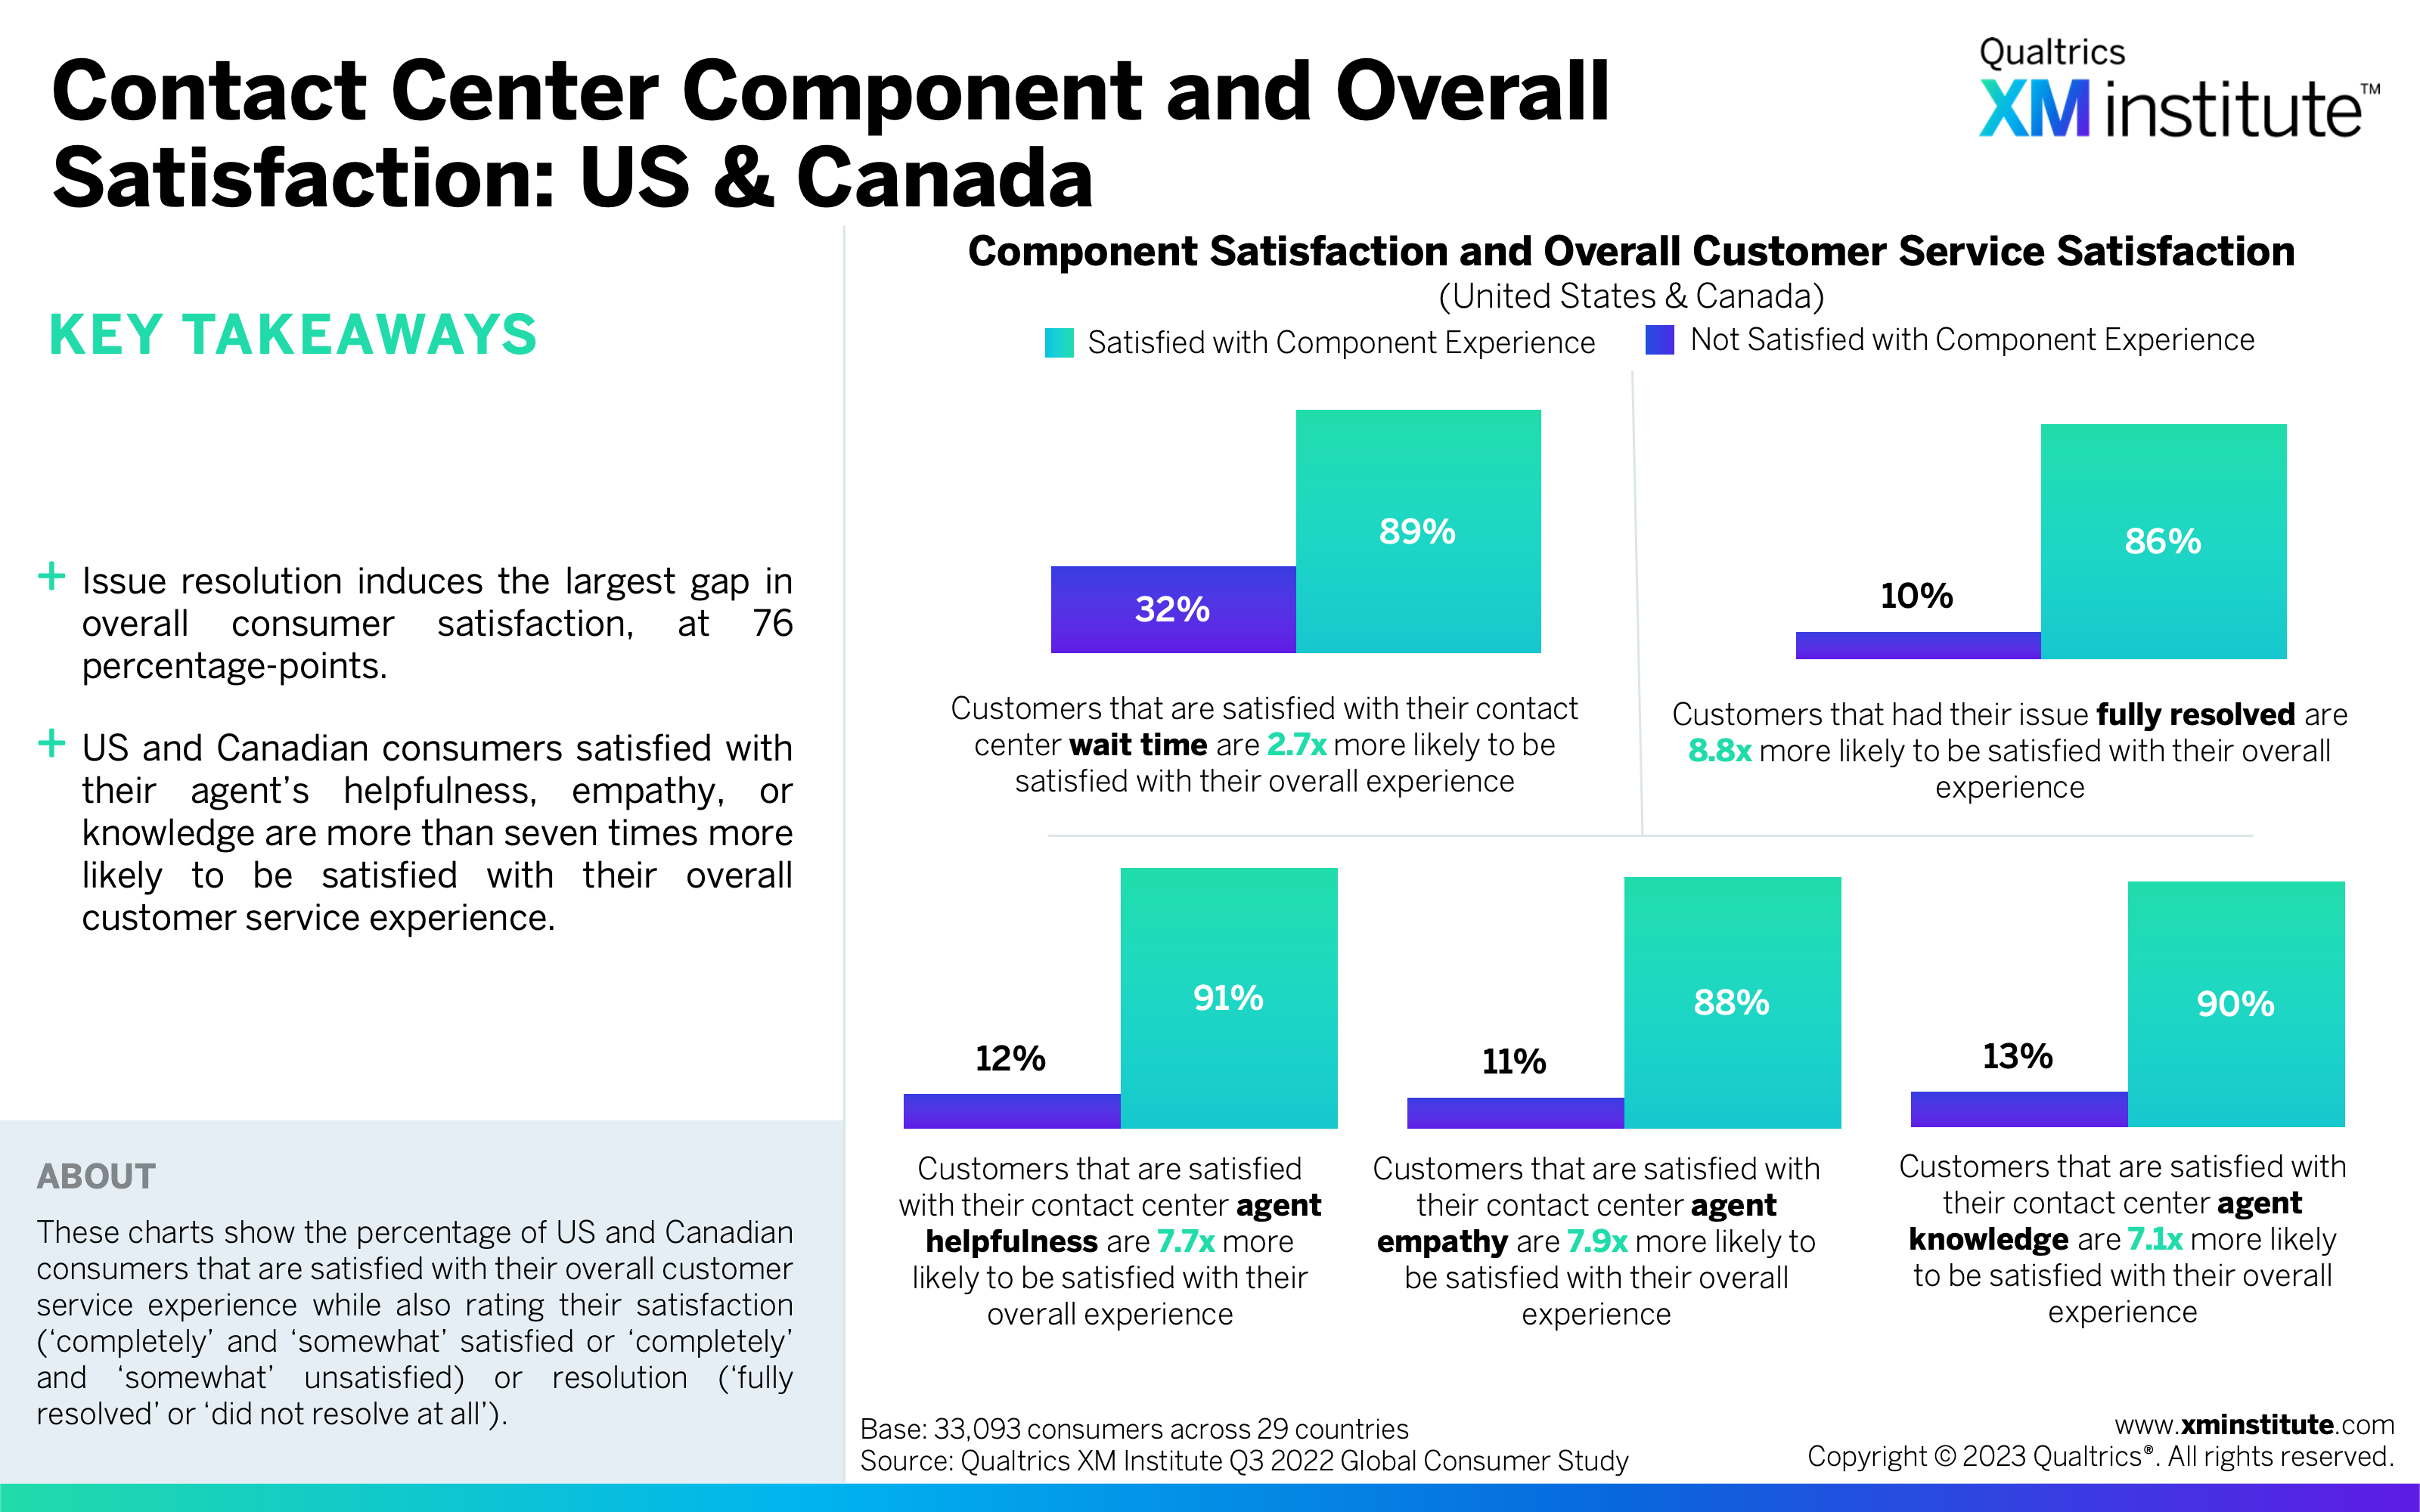
- Consumers also rated the components of their contact center experience poorly. One-third were not satisfied by the level of empathy their agent showed, while 45% were not satisfied by the length of the wait time they encountered during their most recent contact center experience.
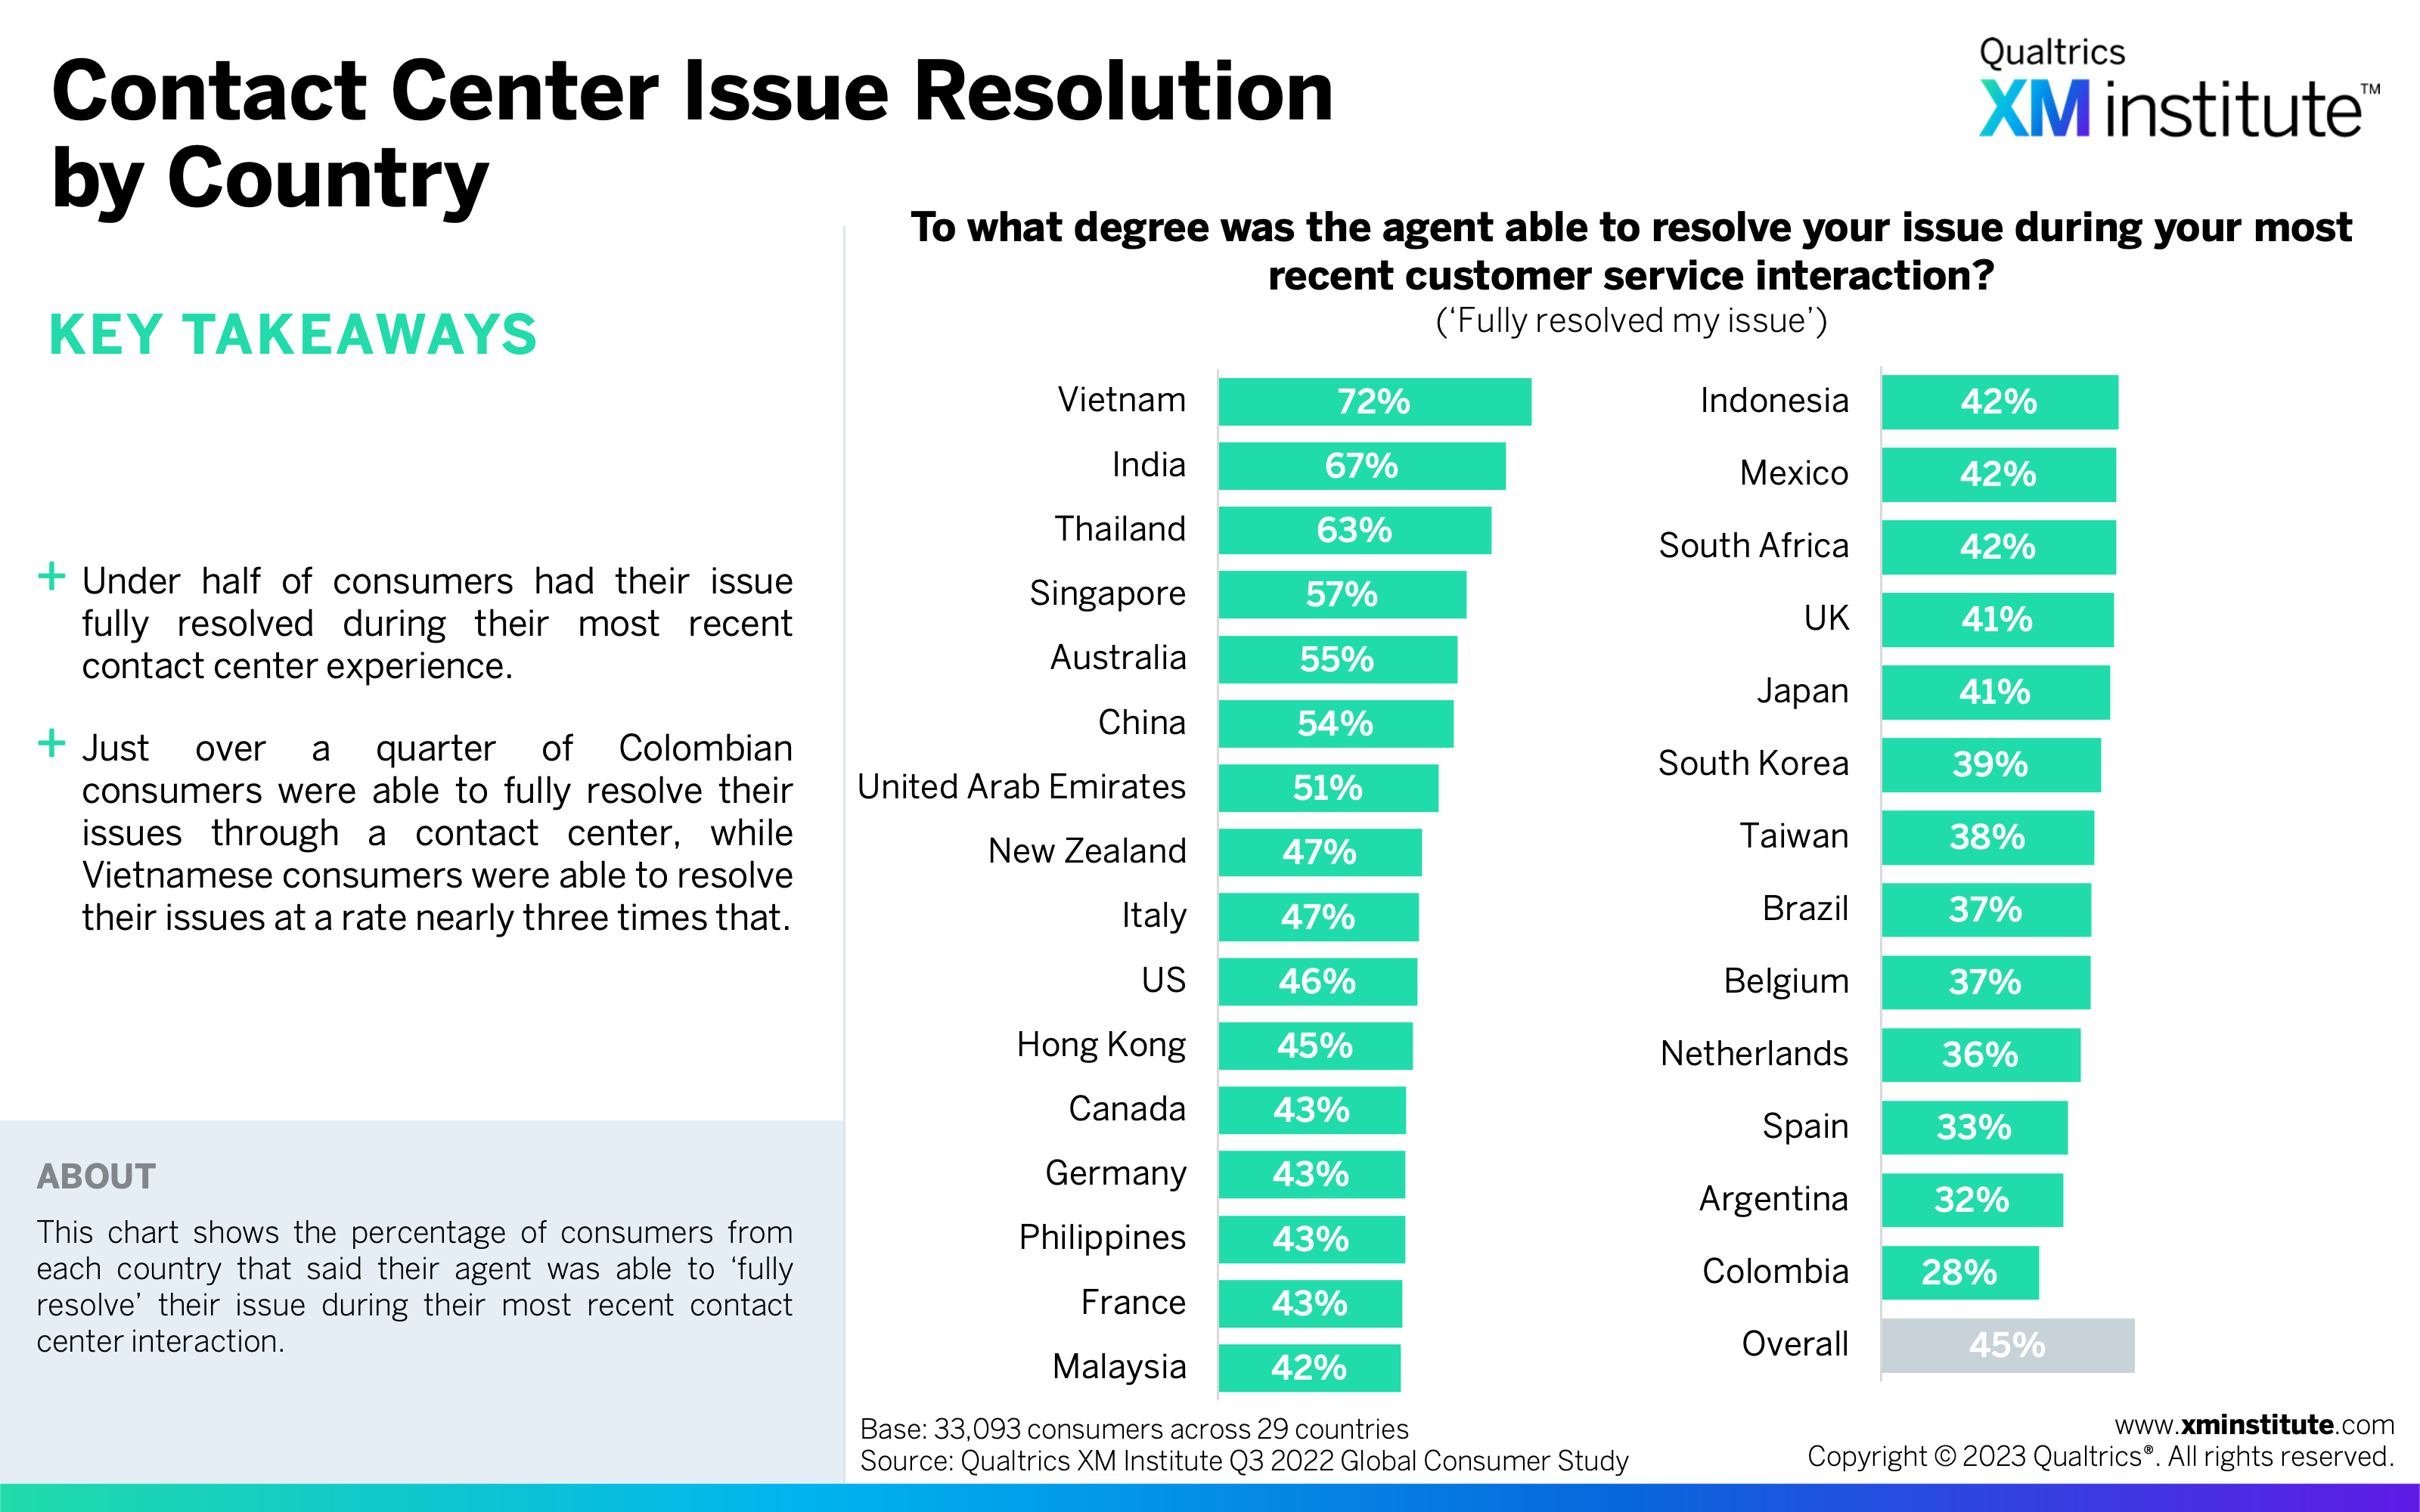
- Contact centers resolve less than half of consumer issues. Just 46% of consumers said that they were able to fully resolve their issue during their recent contact center experience. This number is lowest for Colombian and Argentinian consumers, less than one-third of whom said their issues were fully resolved during their contact center experience.
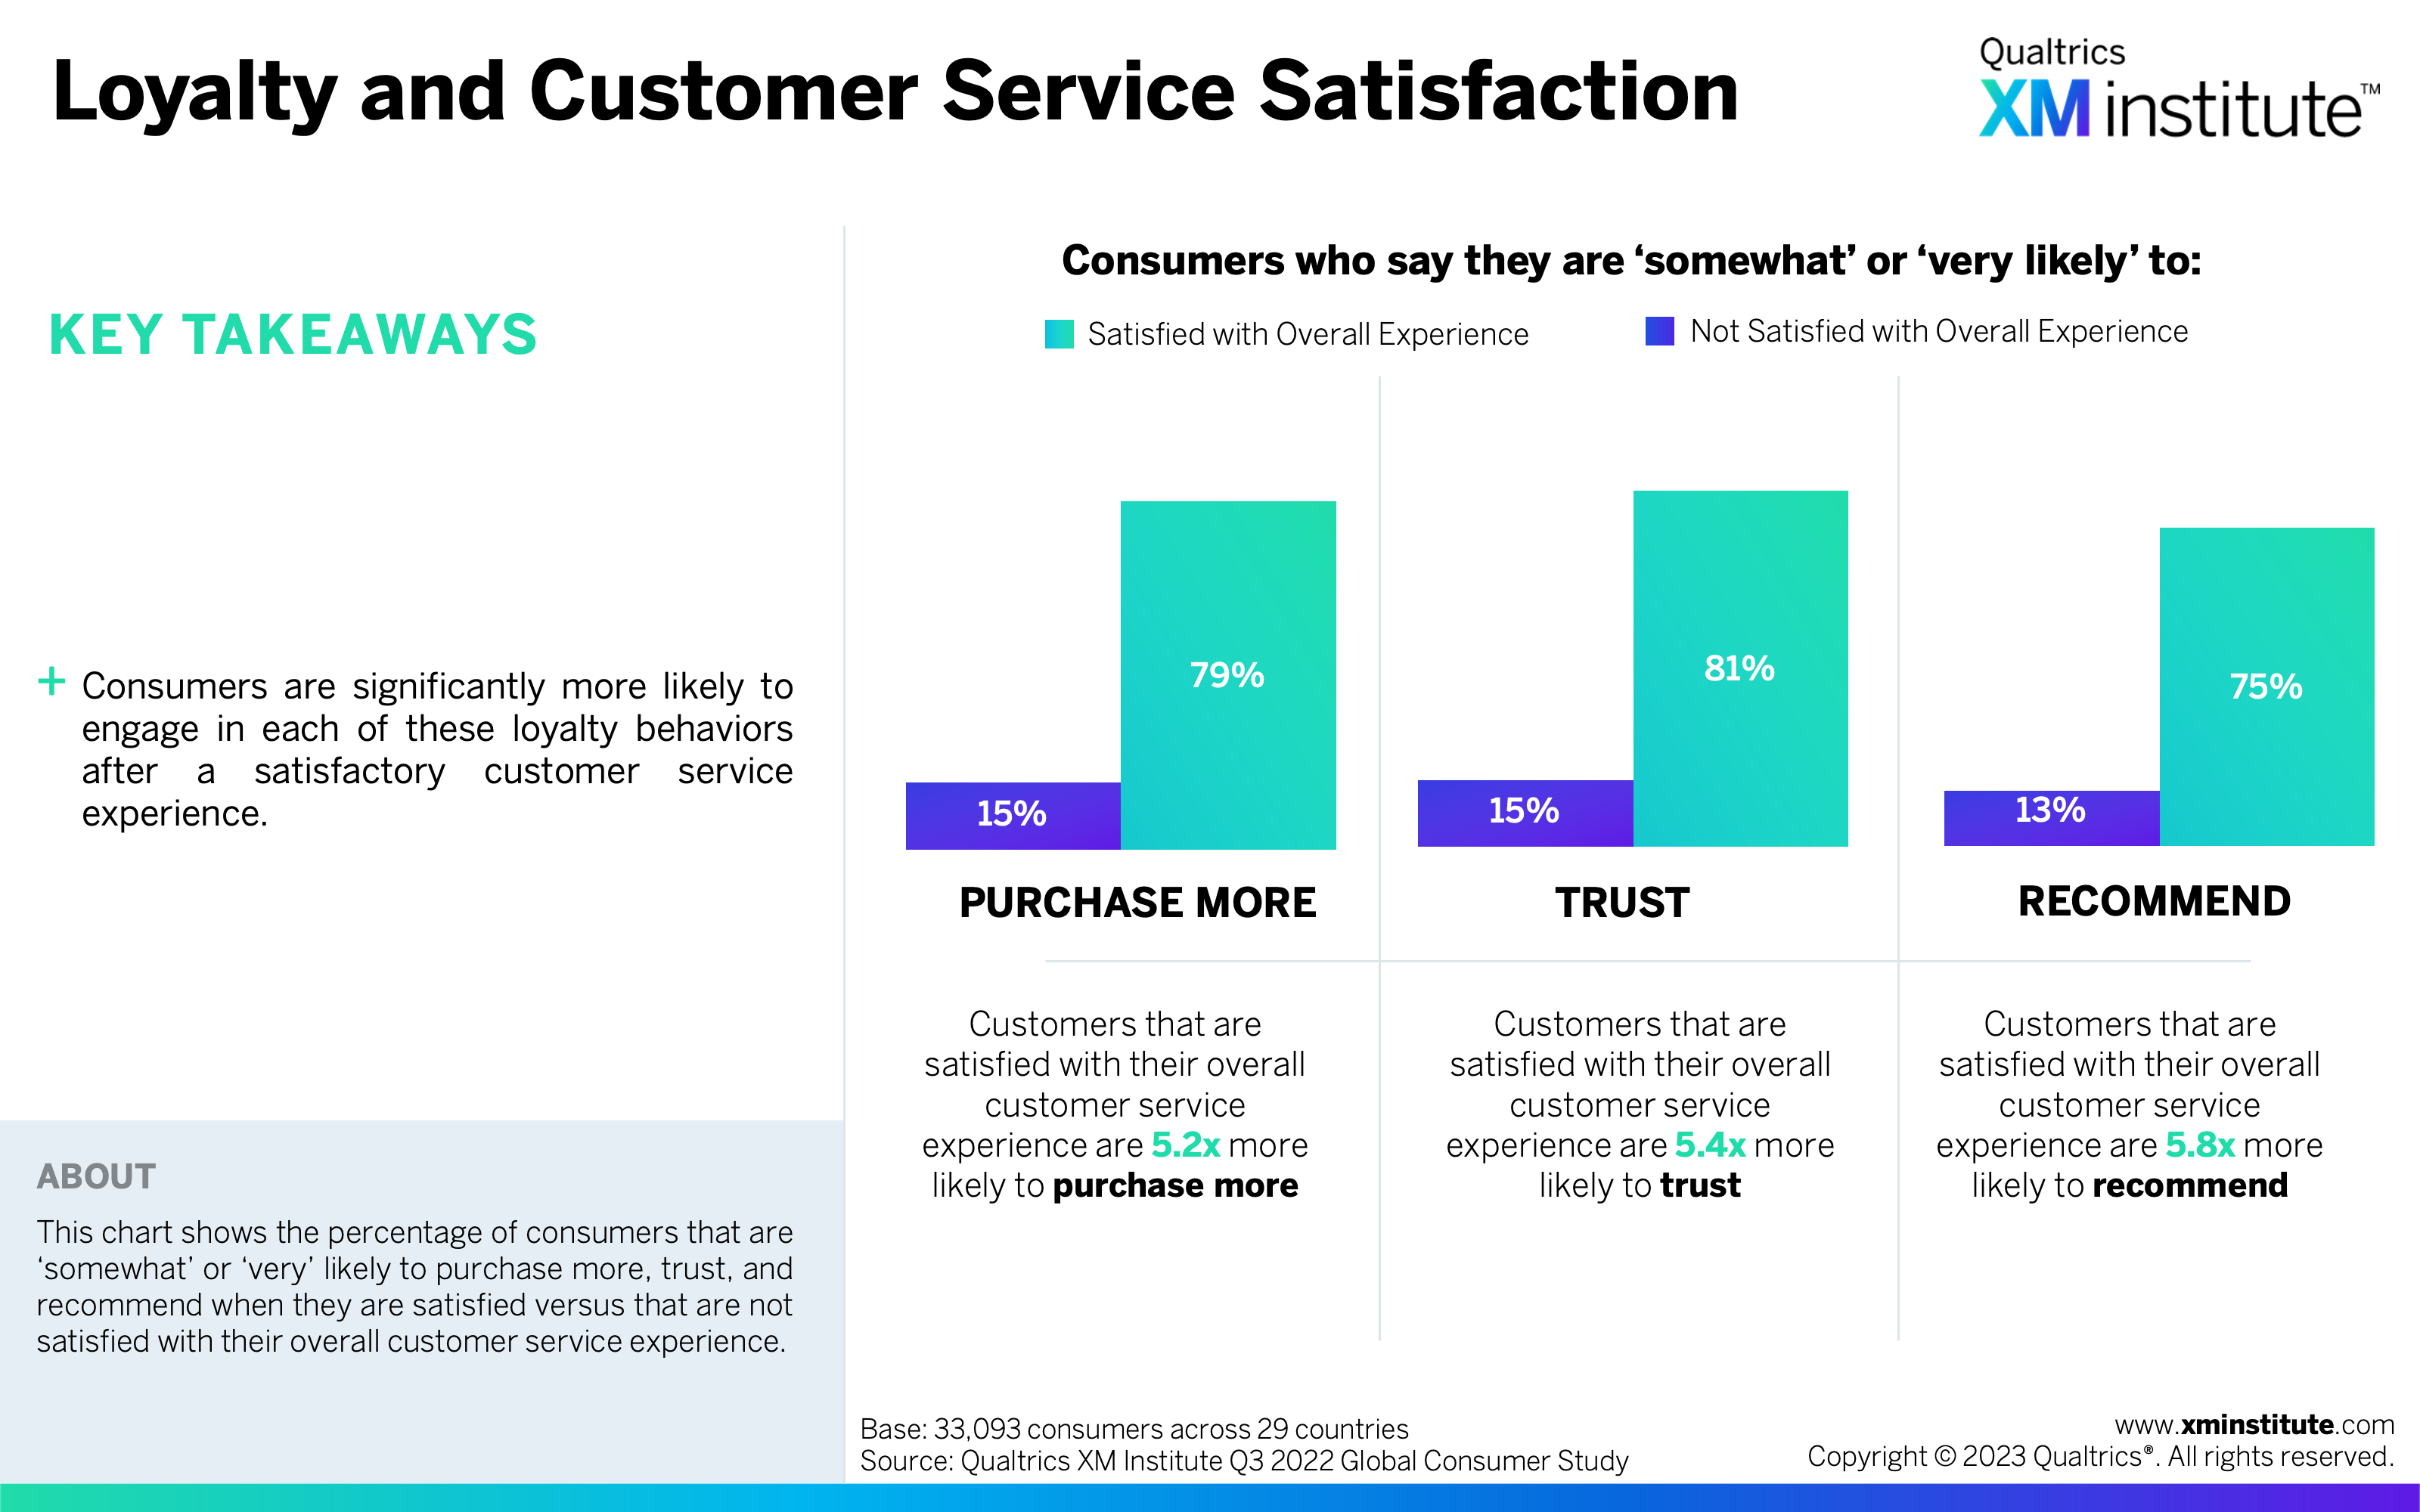
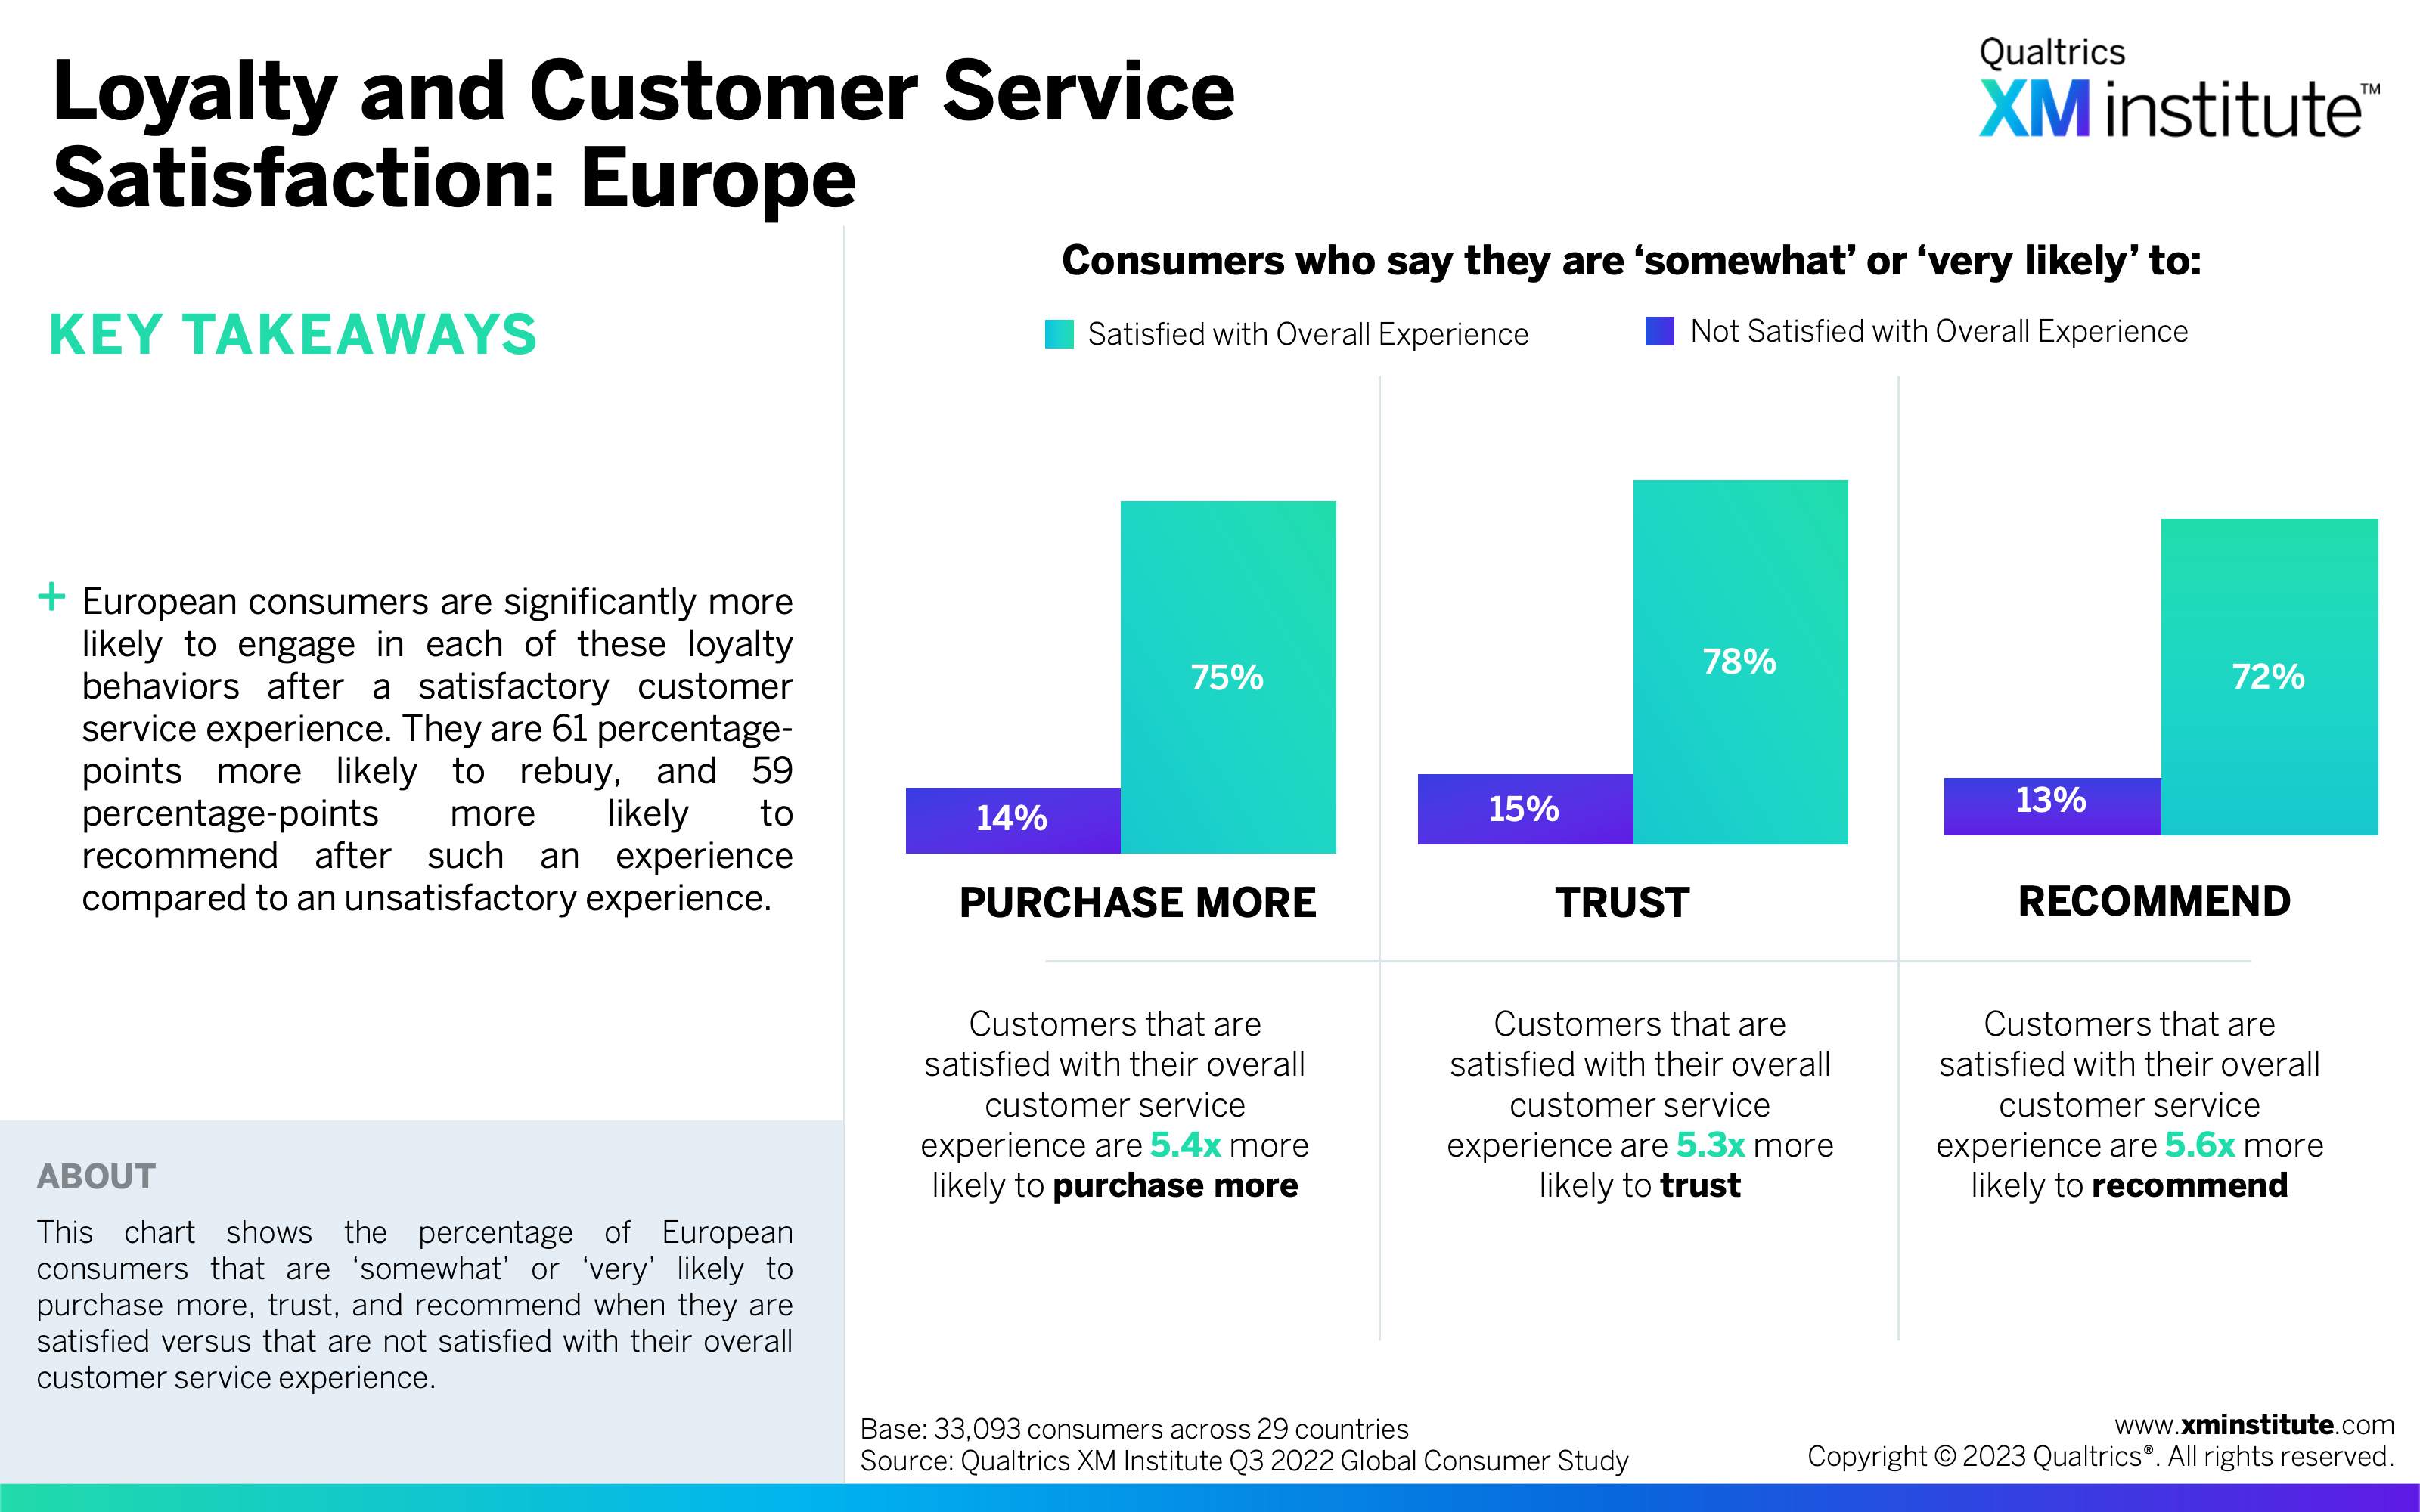
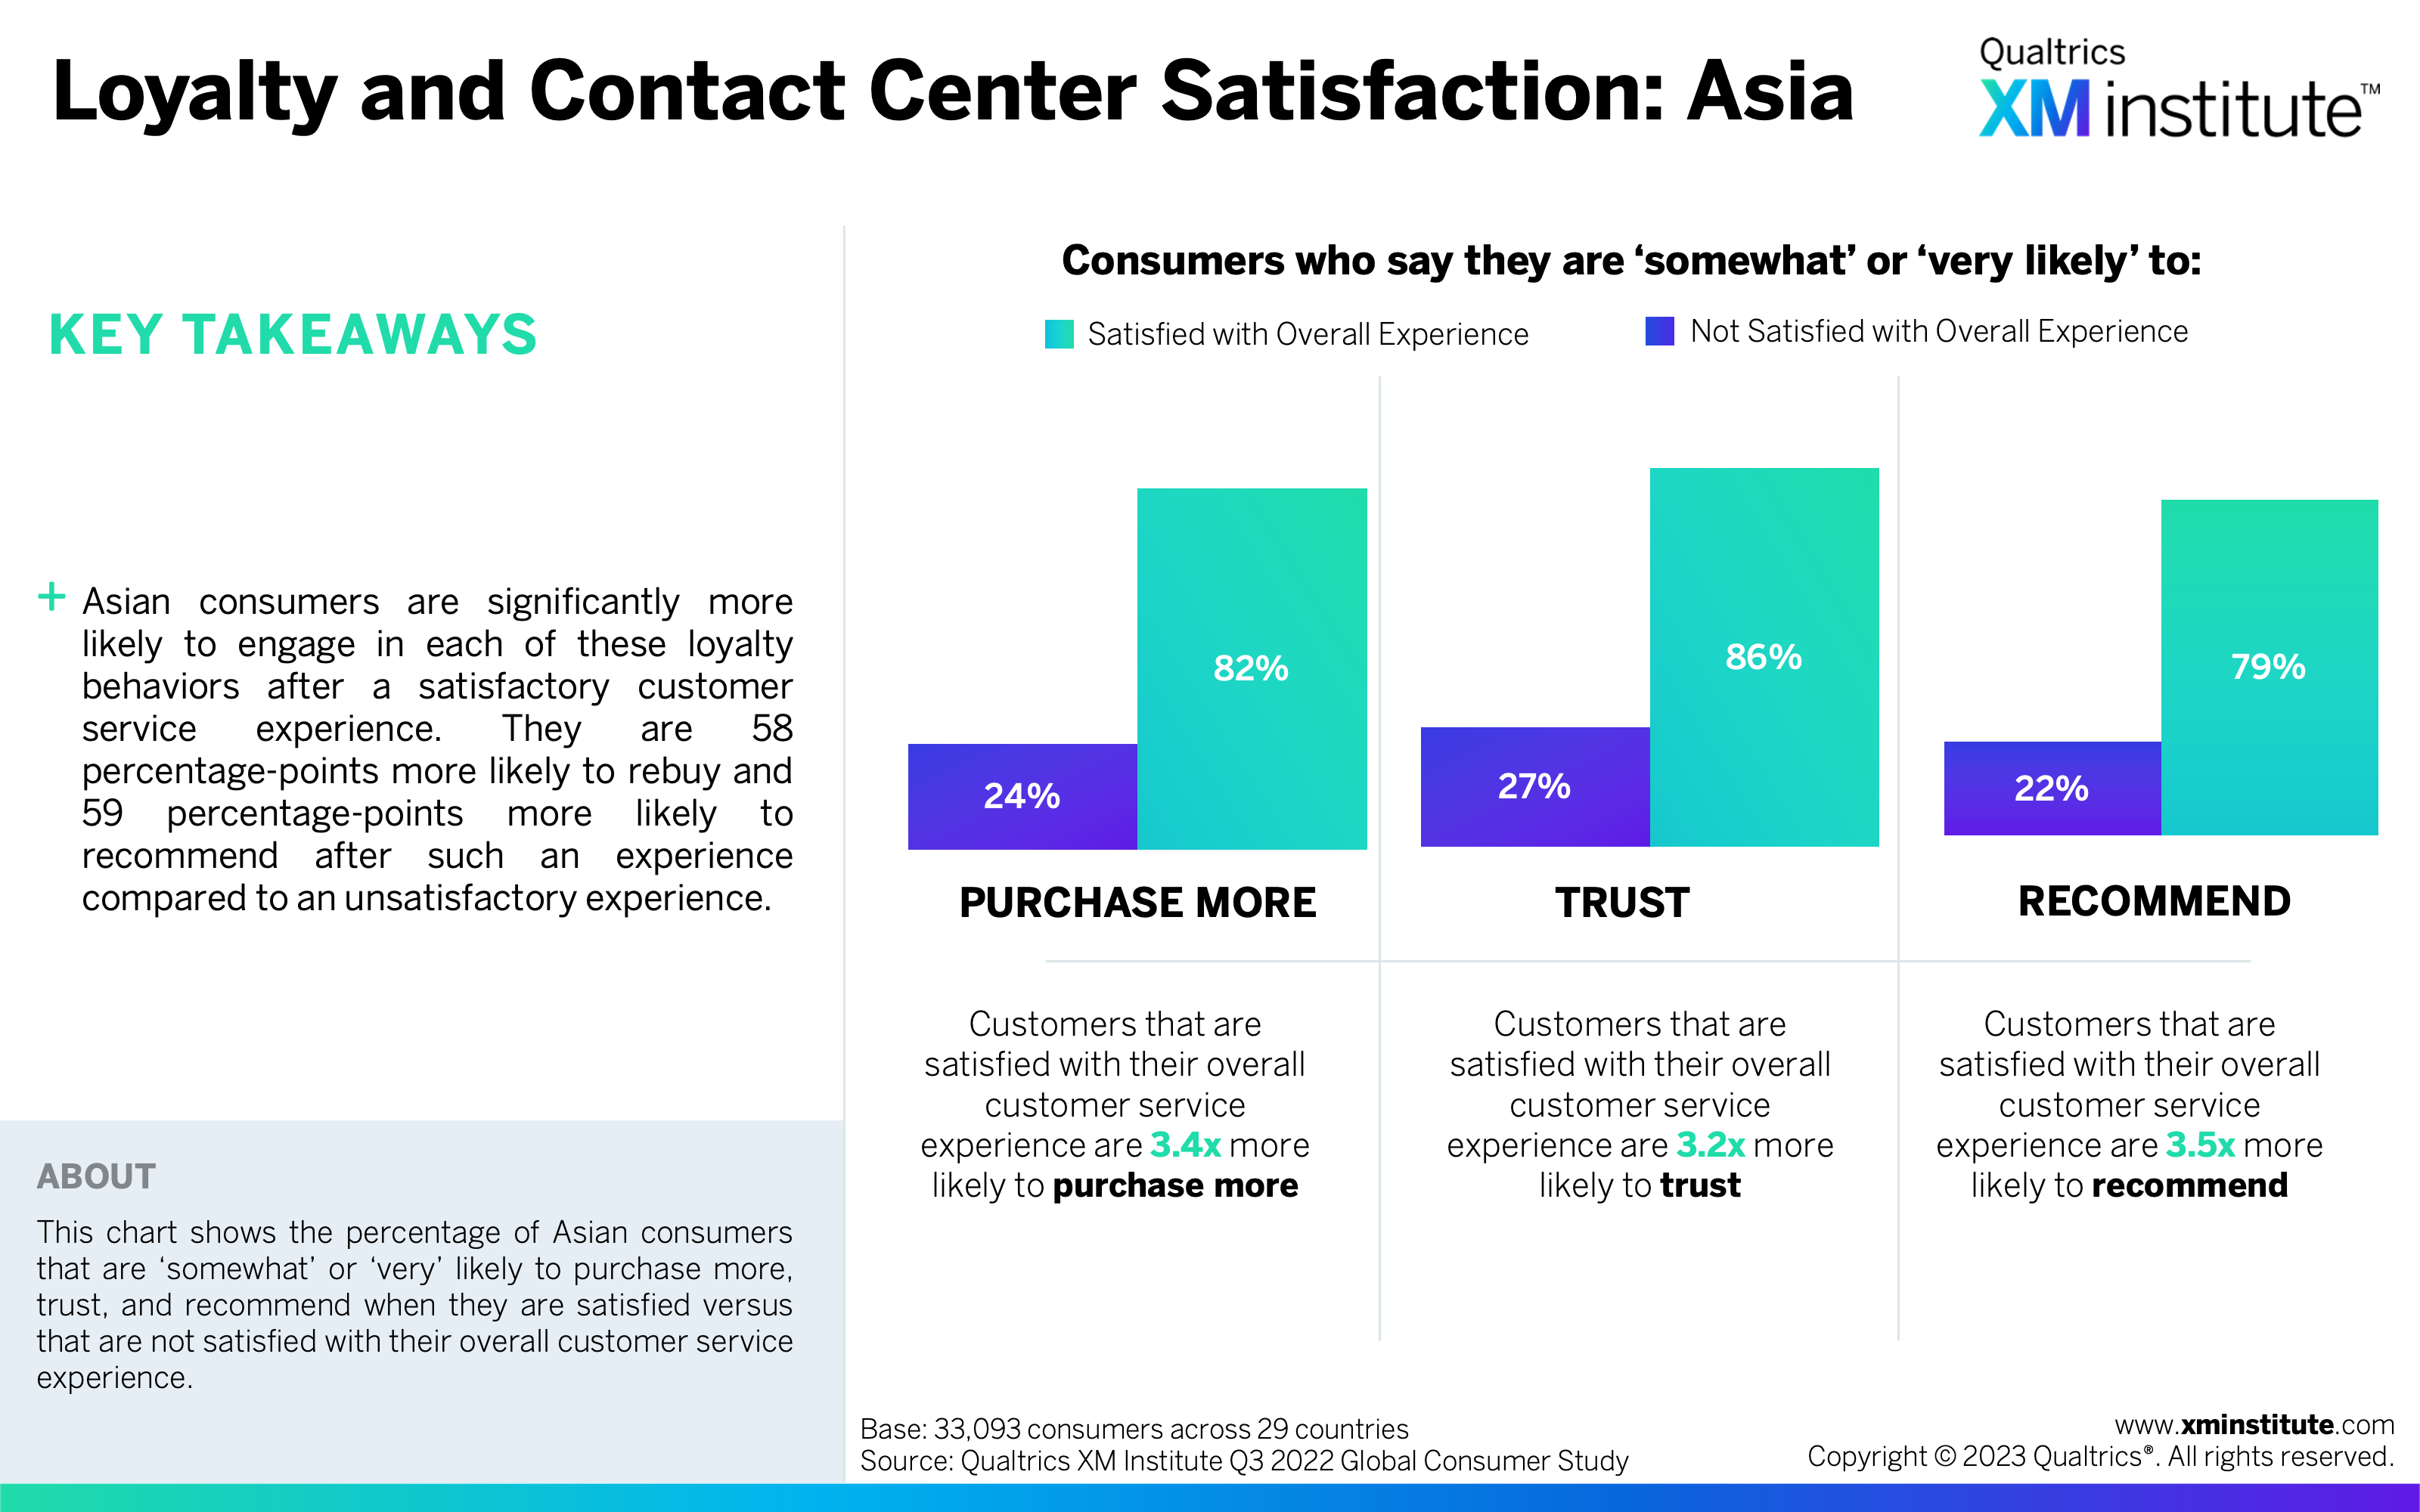
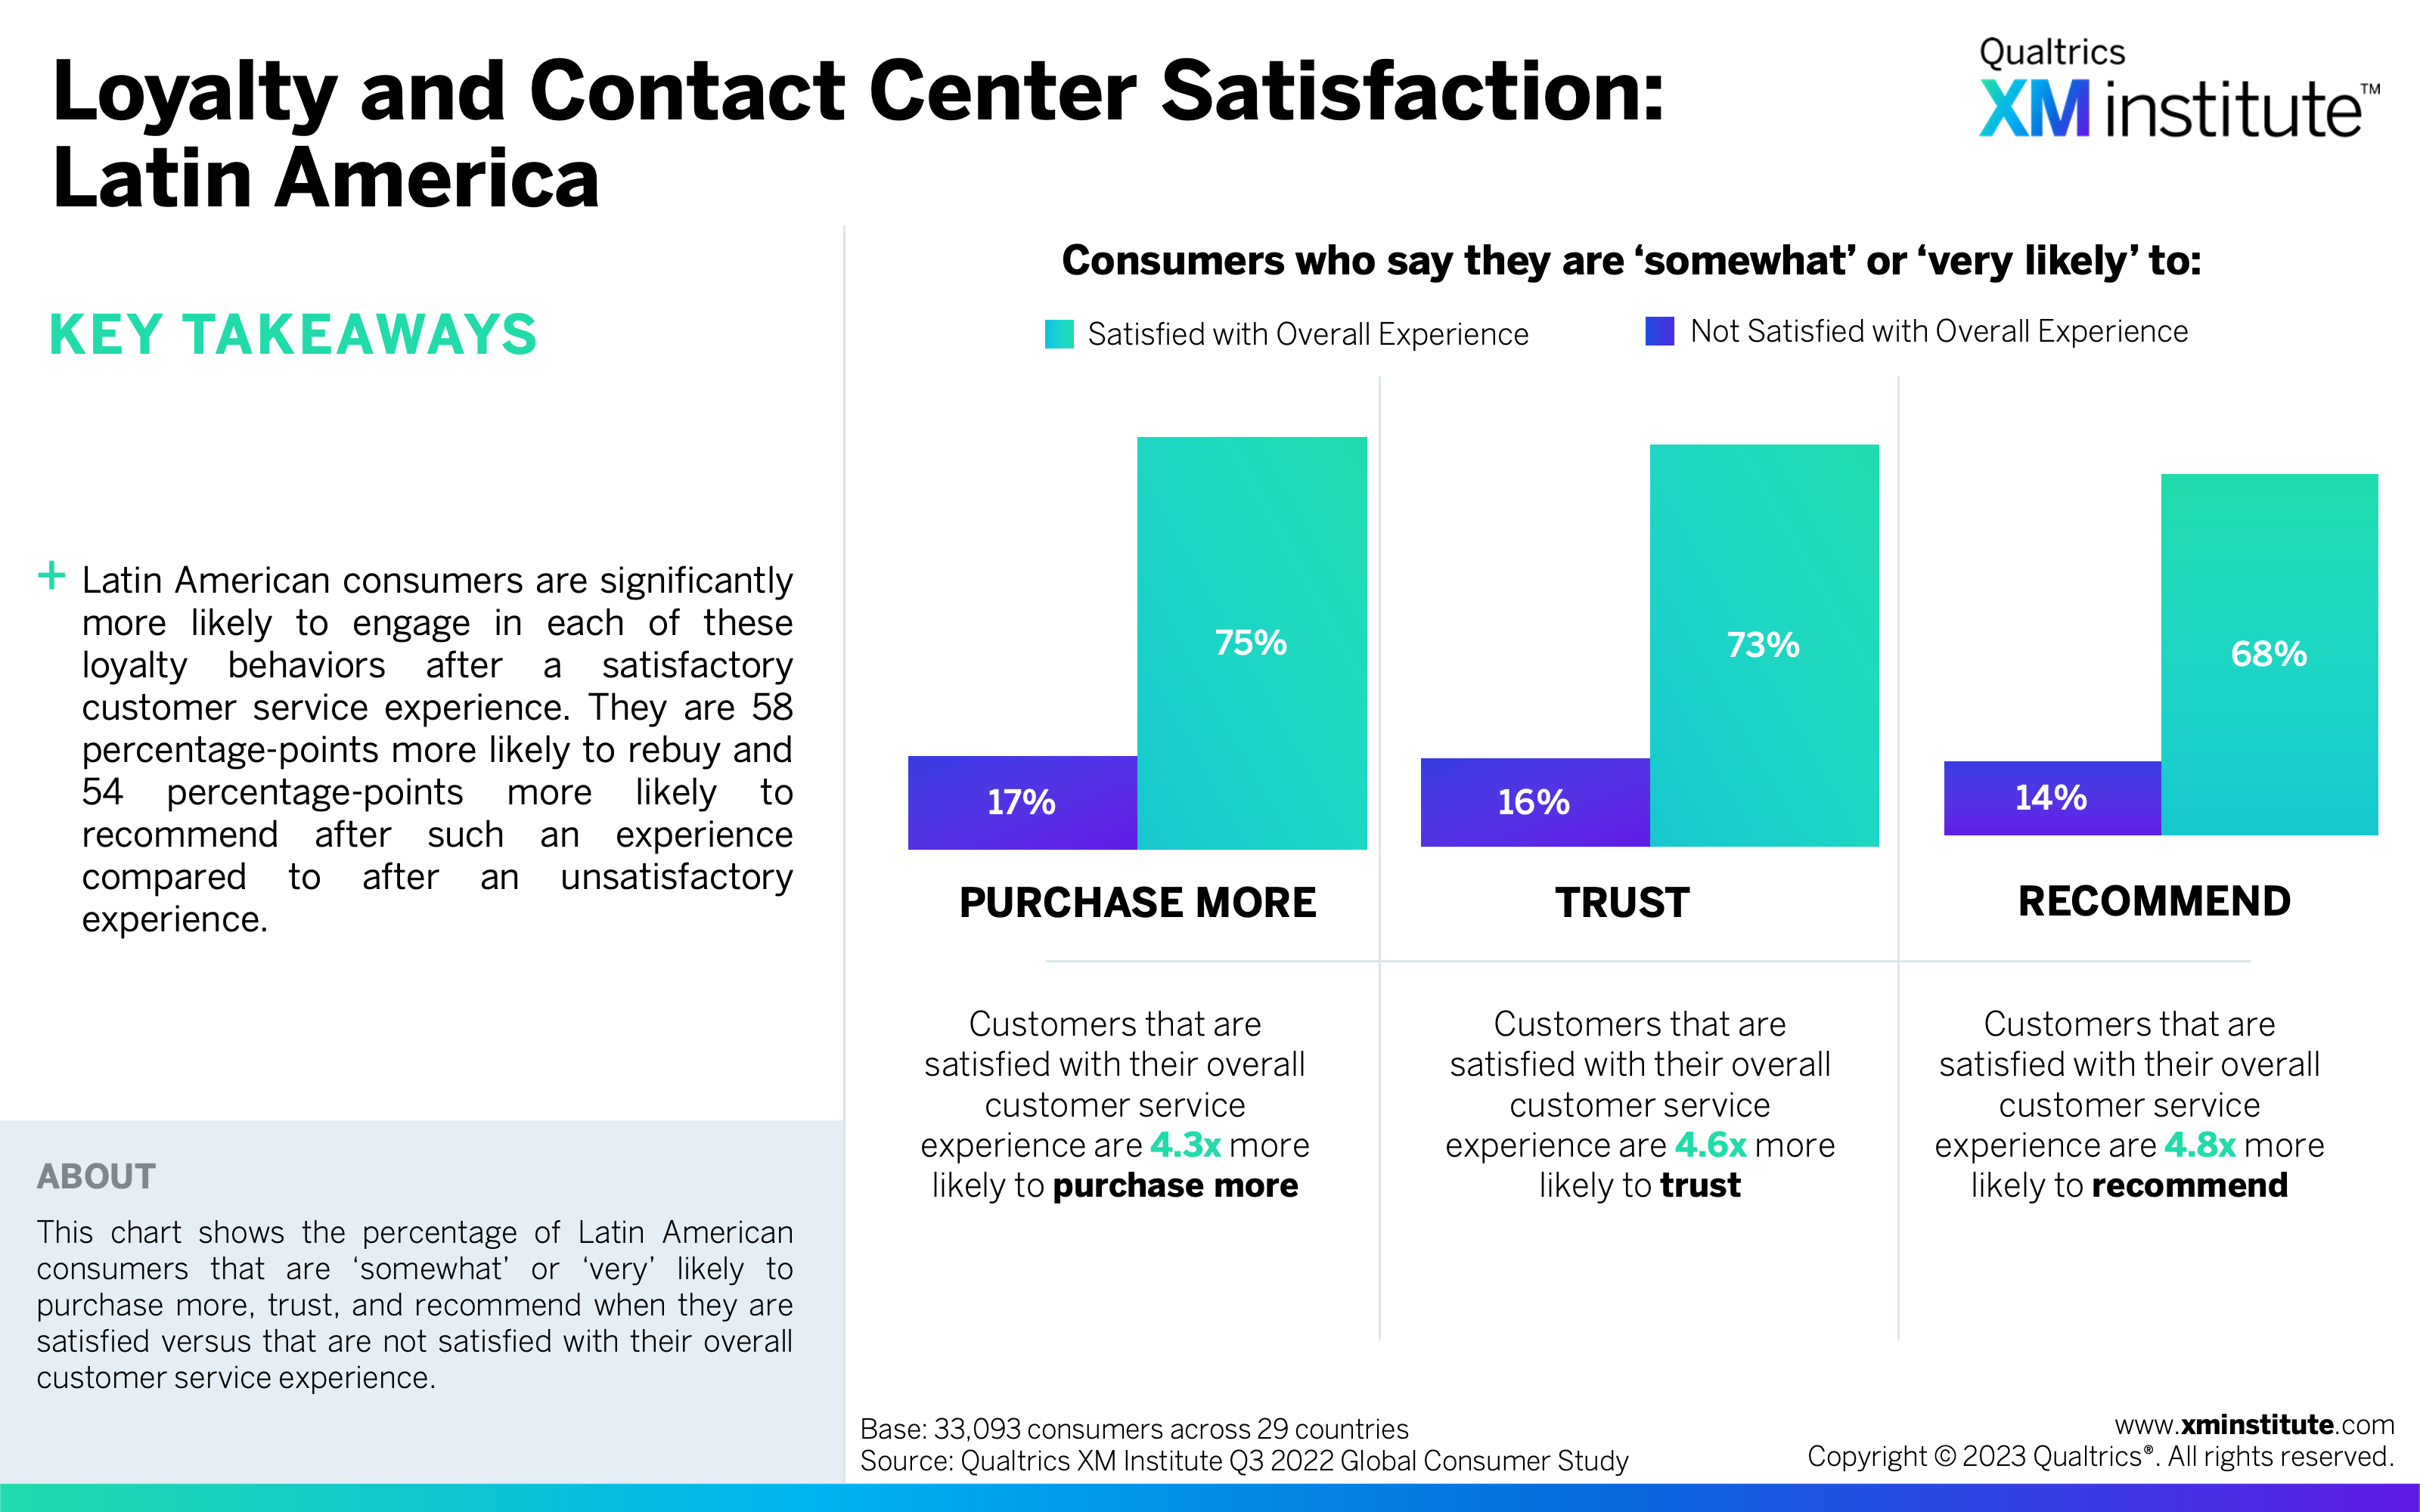
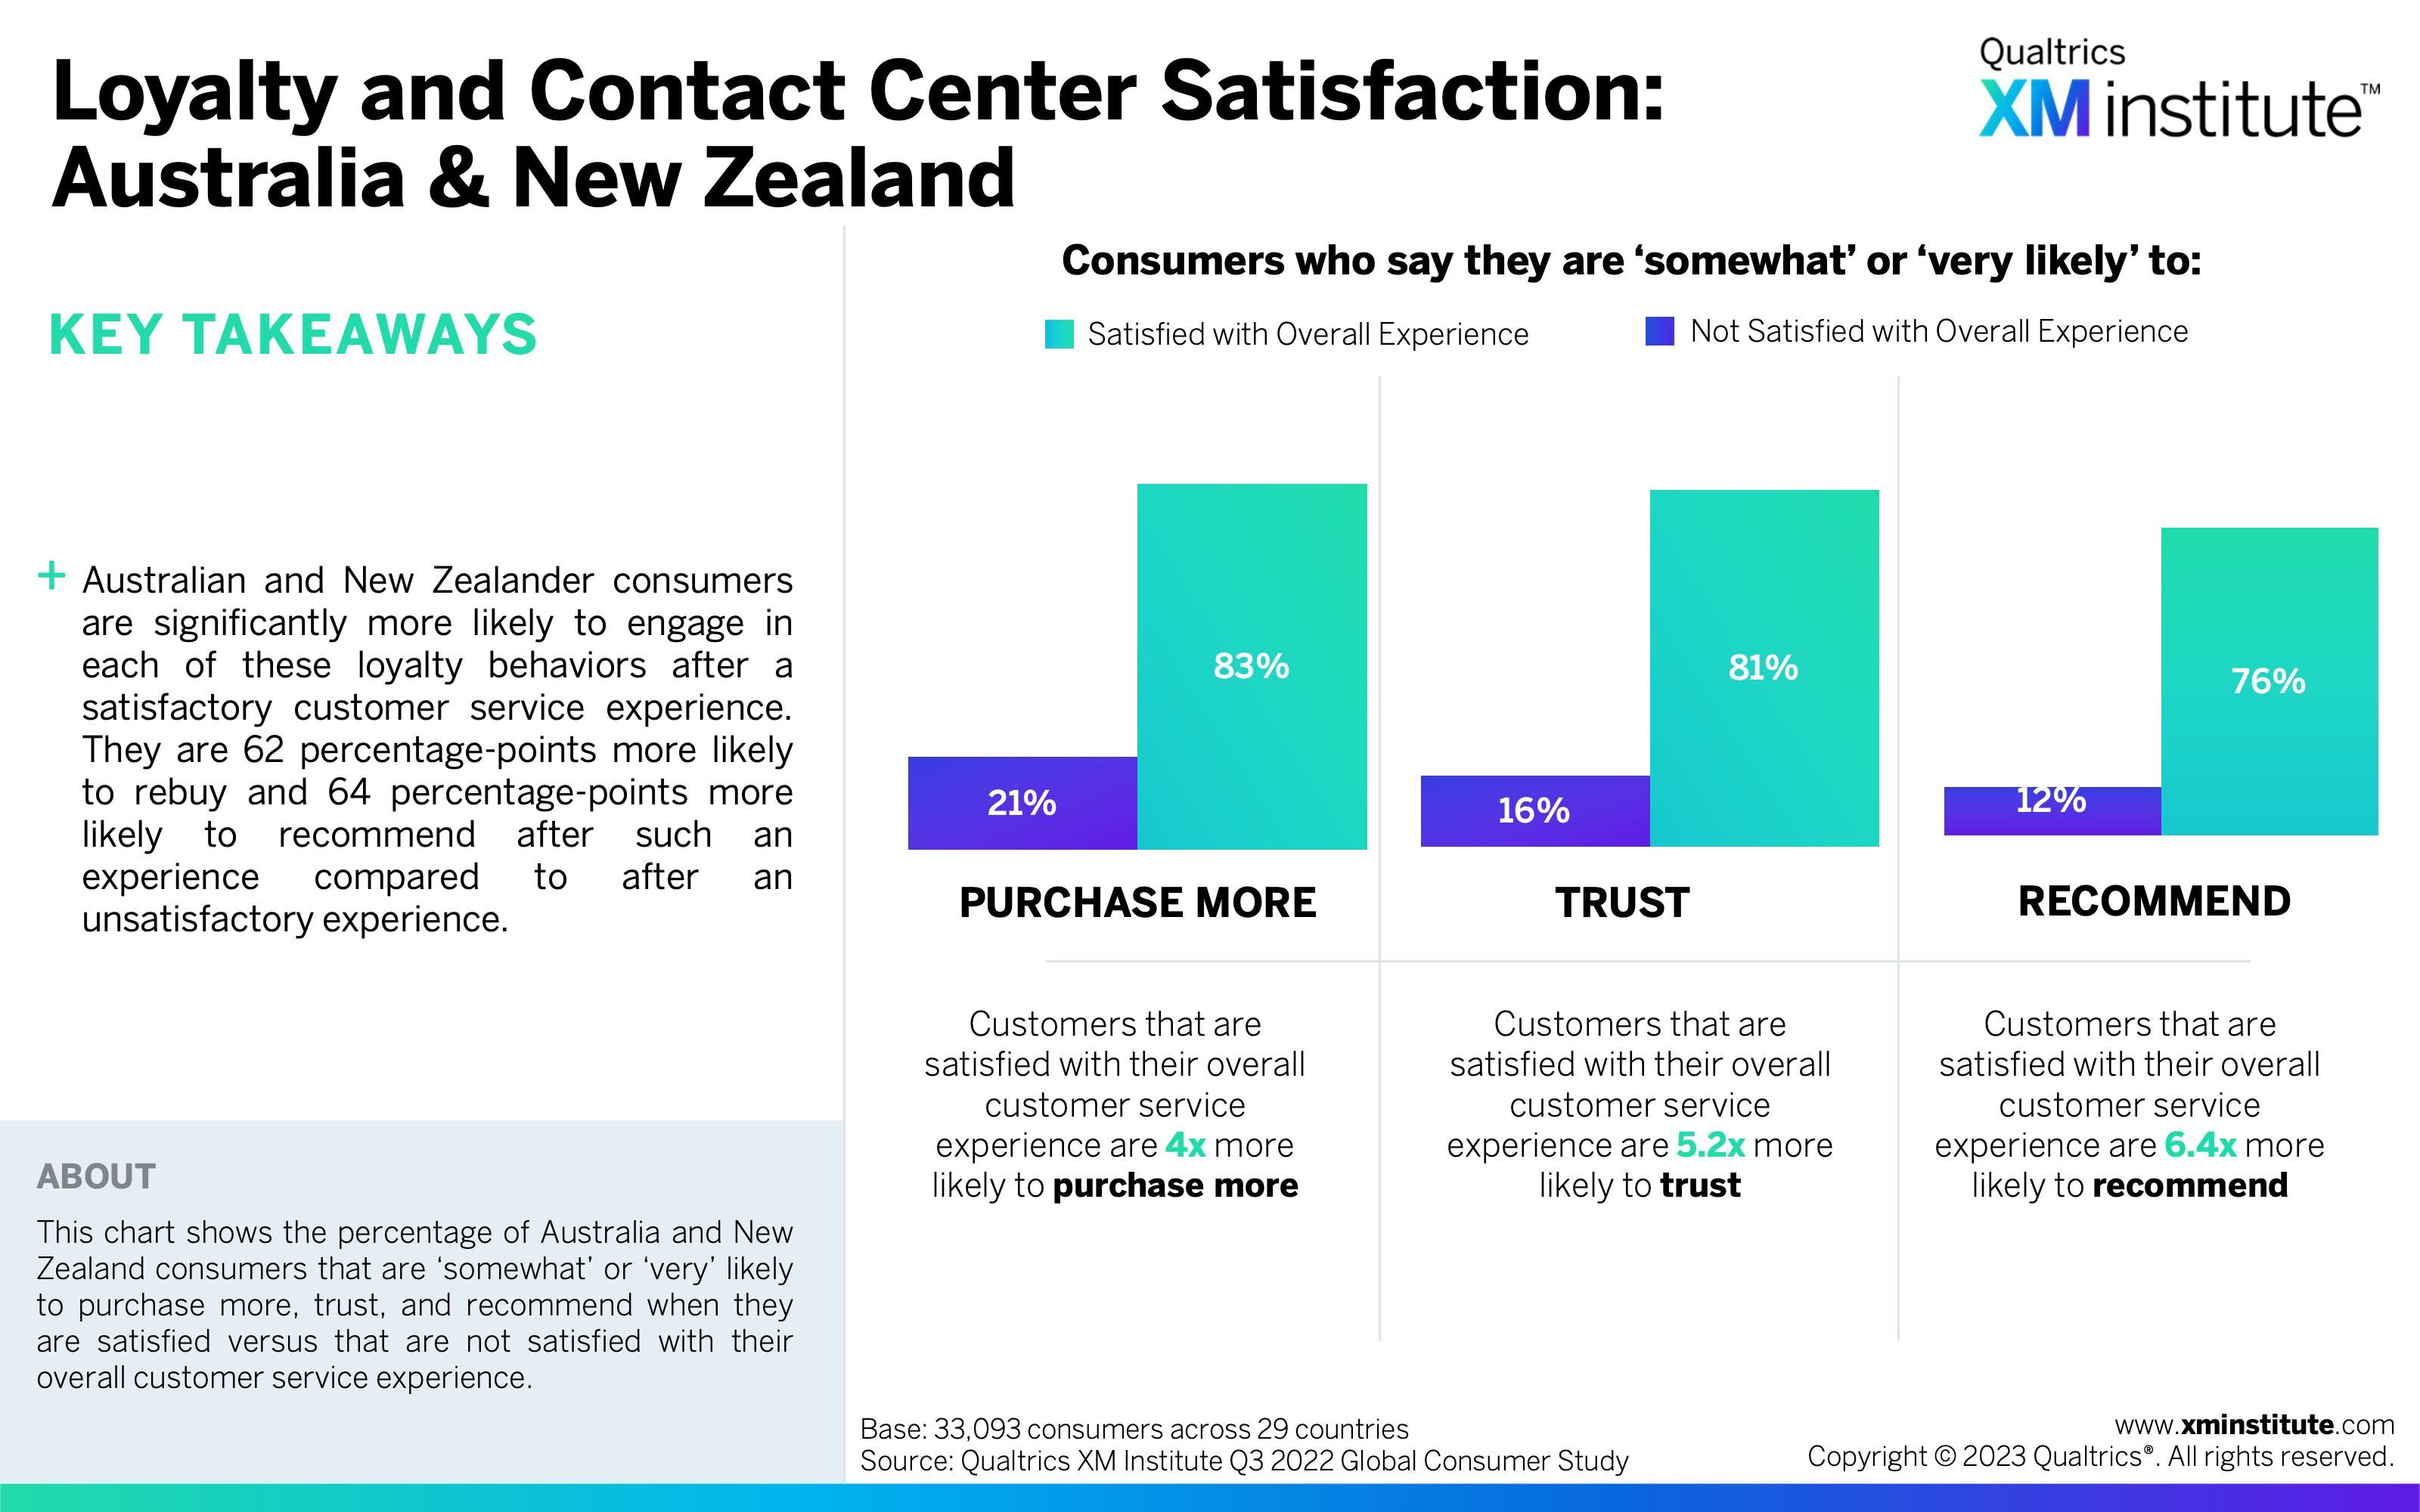
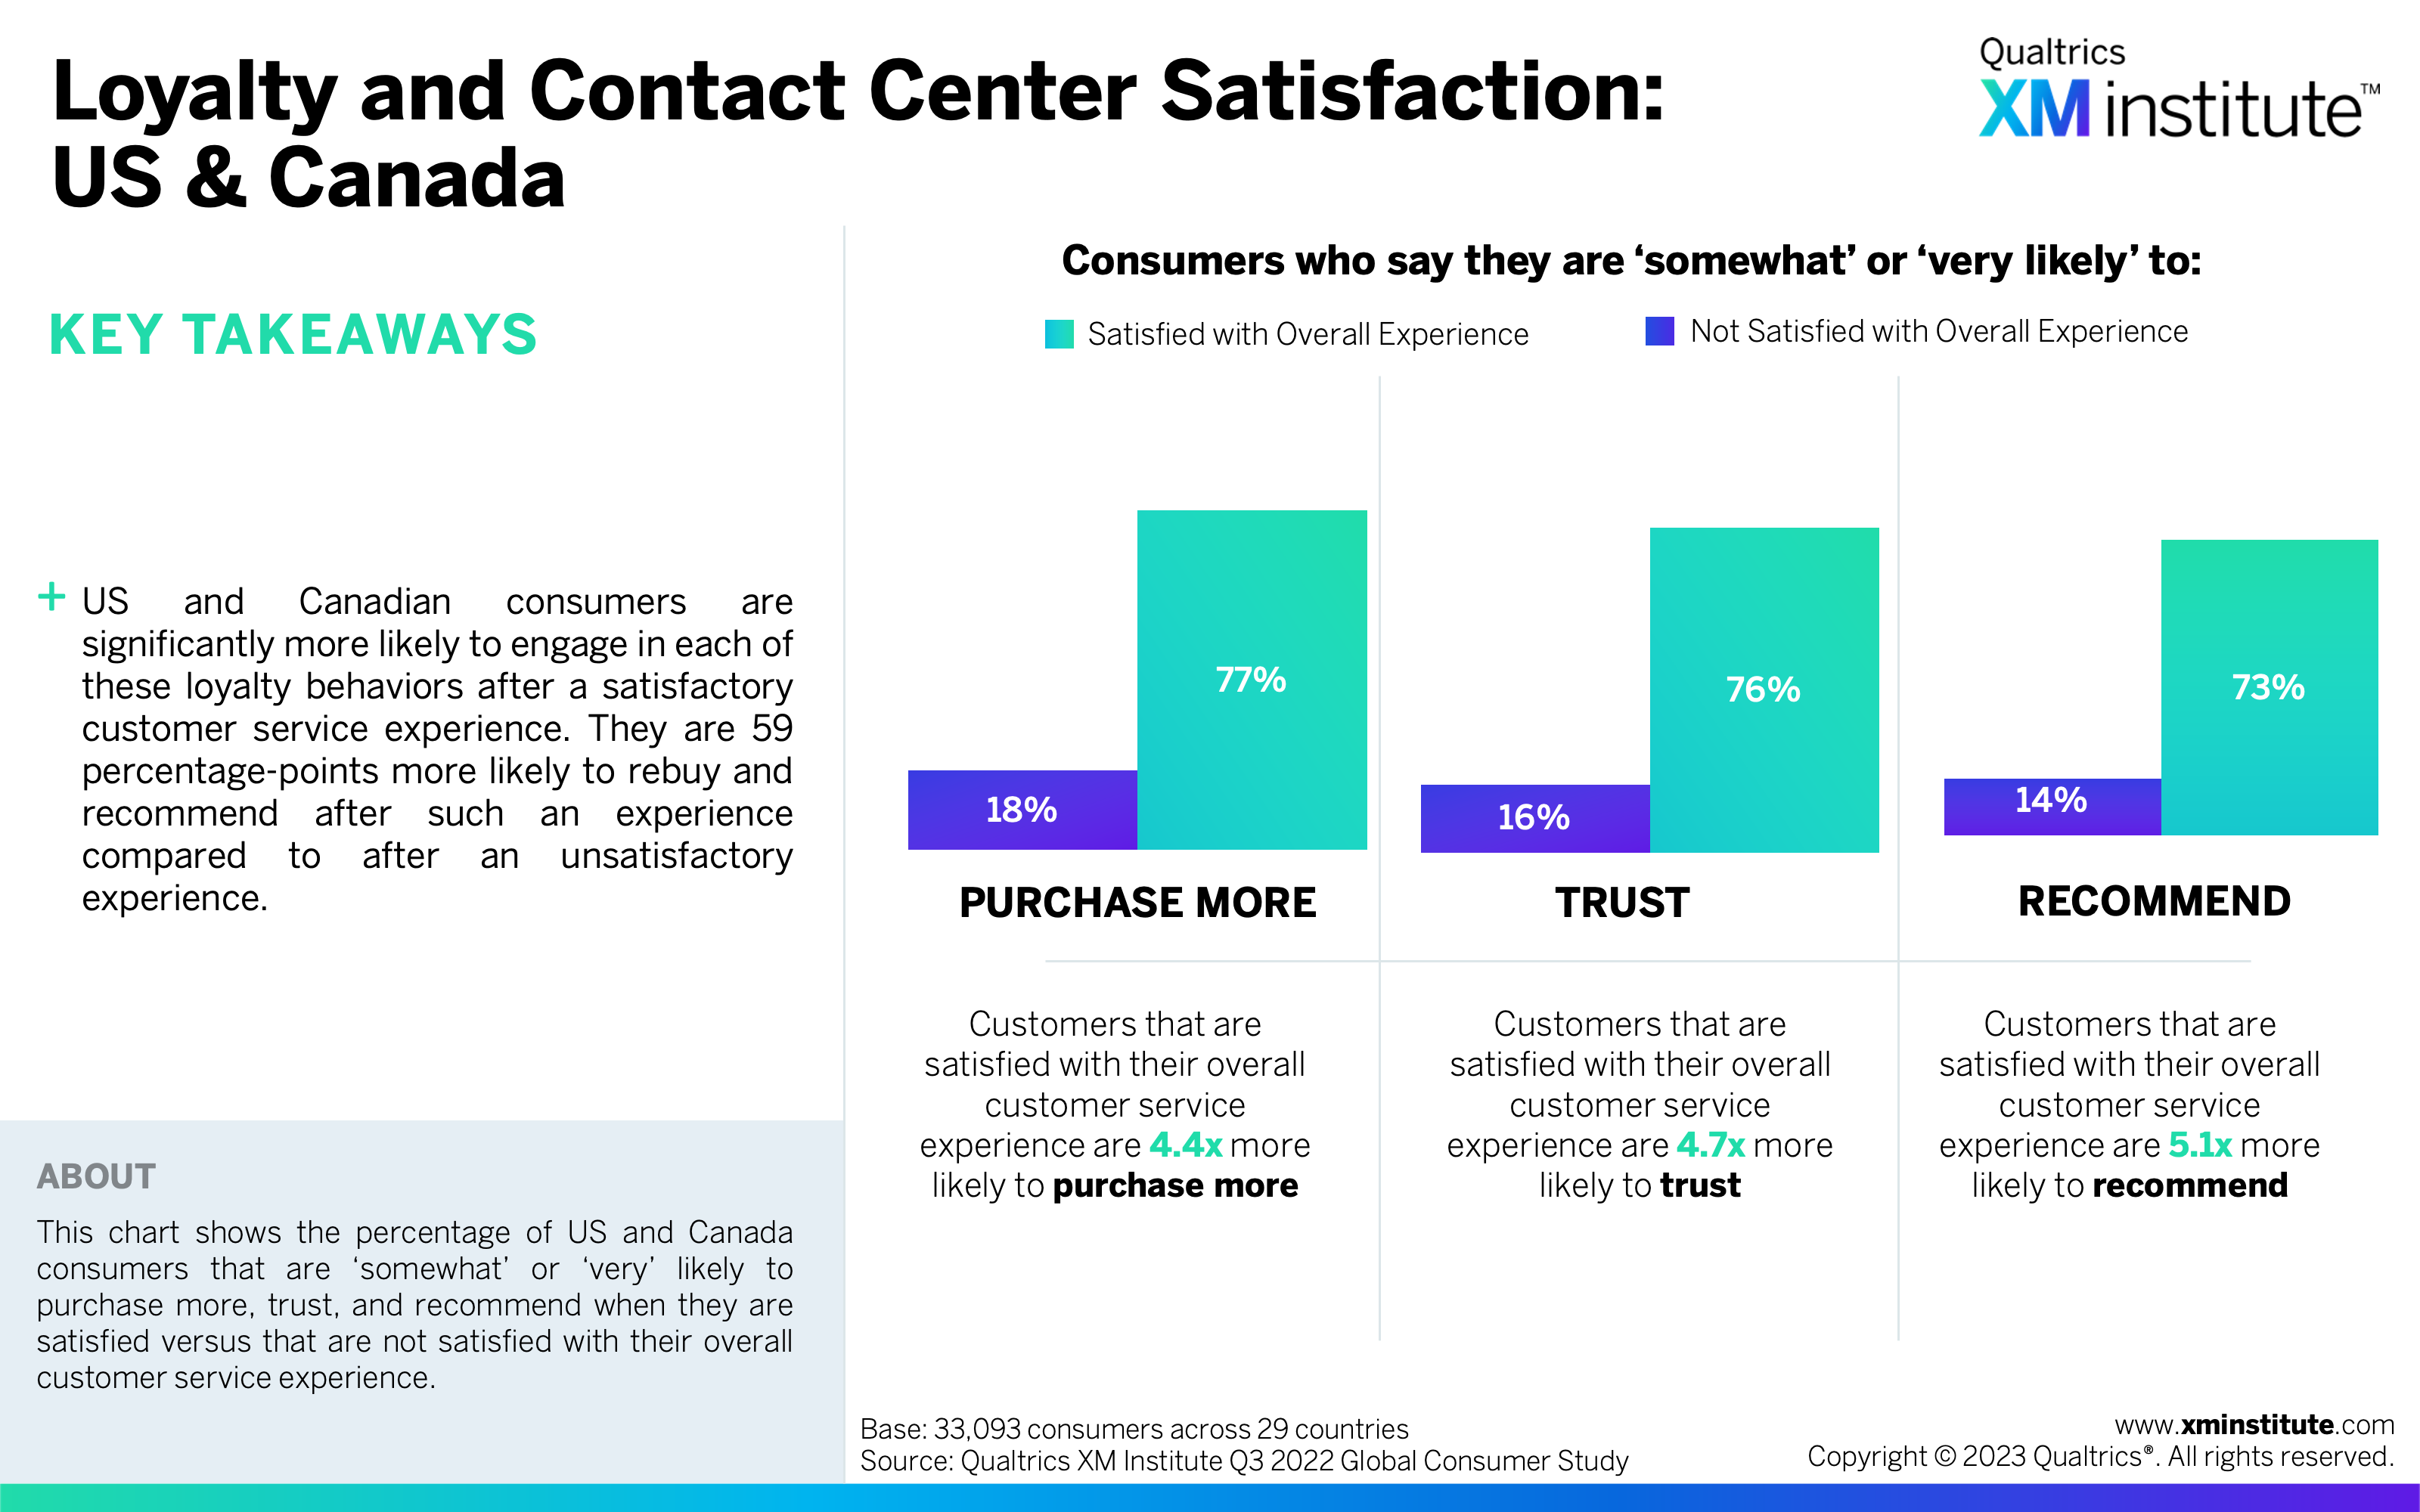
- Satisfaction with a customer service experience correlates with stronger loyalty behaviors. Compared to an unsatisfying experience, after an overall satisfying experience, consumers are 5.2 times more likely to purchase more and 5.6 times more likely to recommend an organization. The benefits of delivering a satisfying customer service experience are largest in Europe, where consumers are 5.4 times more likely to rebuy, and in Australia and New Zealand, where consumers are 6.4 times more likely to recommend.
Figures
Here are the figures in this data snapshot:
- Overall Contact Center Satisfaction (see Figure 1)
- Overall Contact Center Satisfaction Levels by Country (see Figure 2)
- Wait Time Satisfaction Levels by Country (see Figure 3)
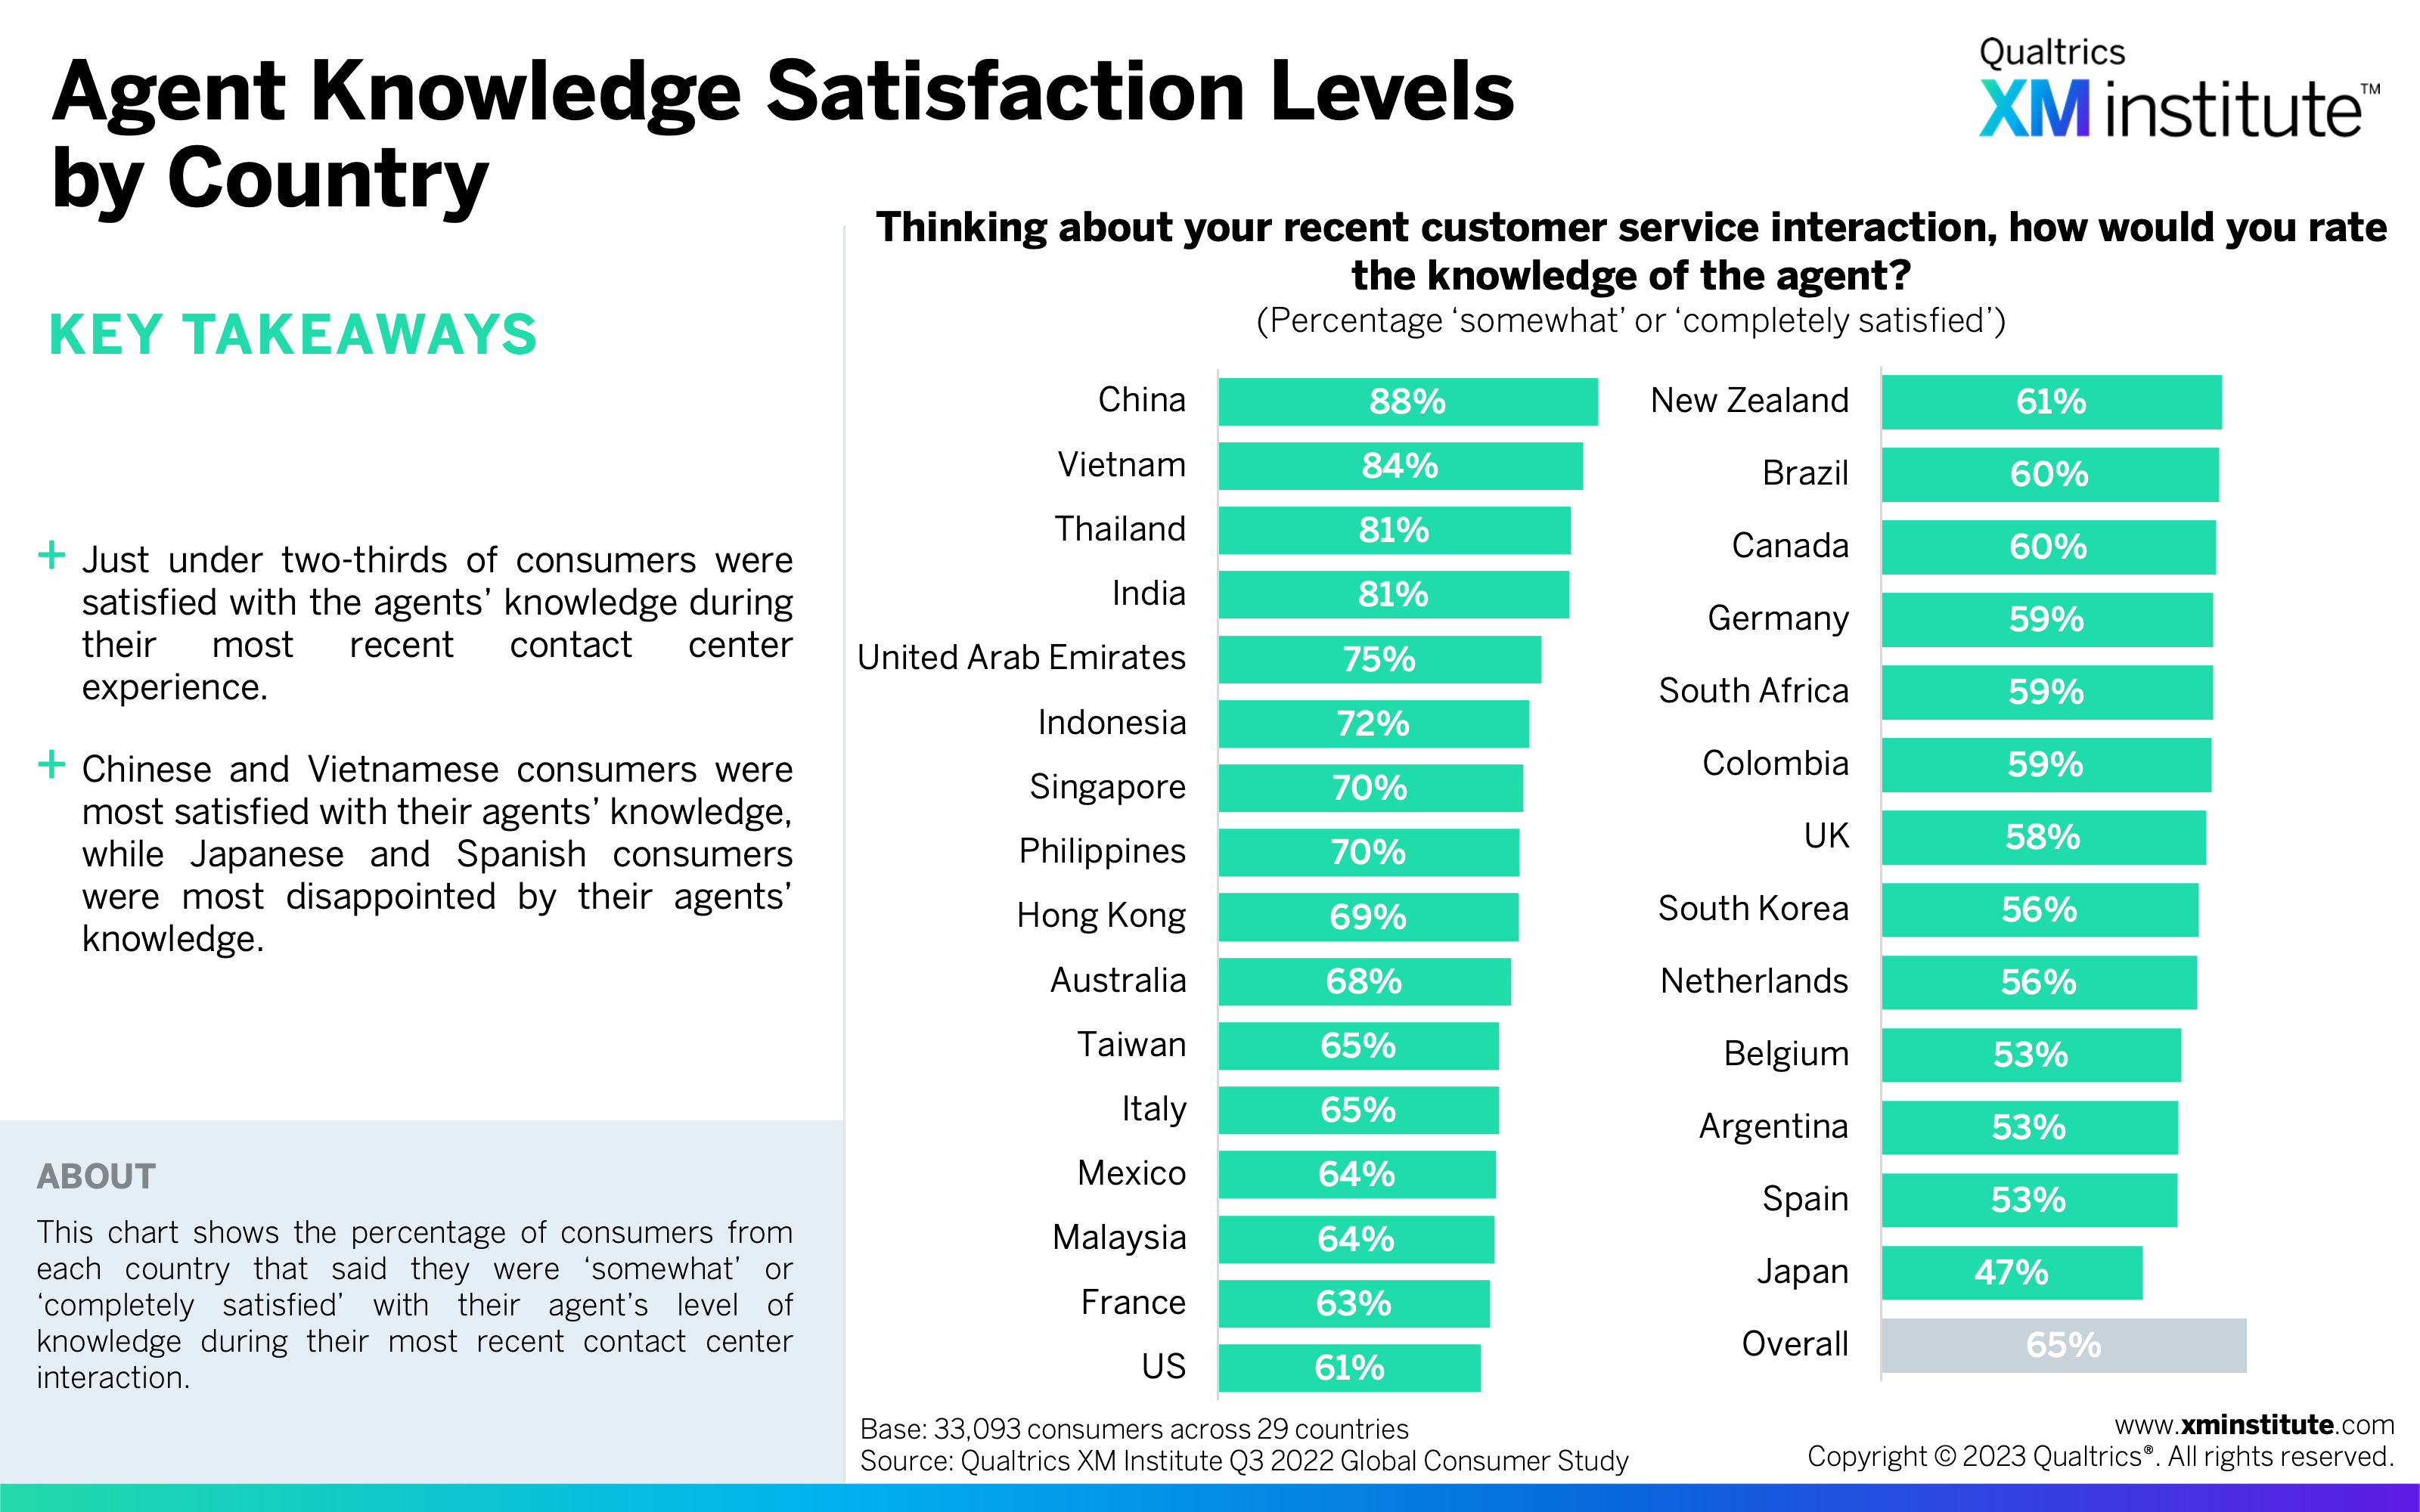
- Agent Knowledge Satisfaction Levels by Country (see Figure 4)
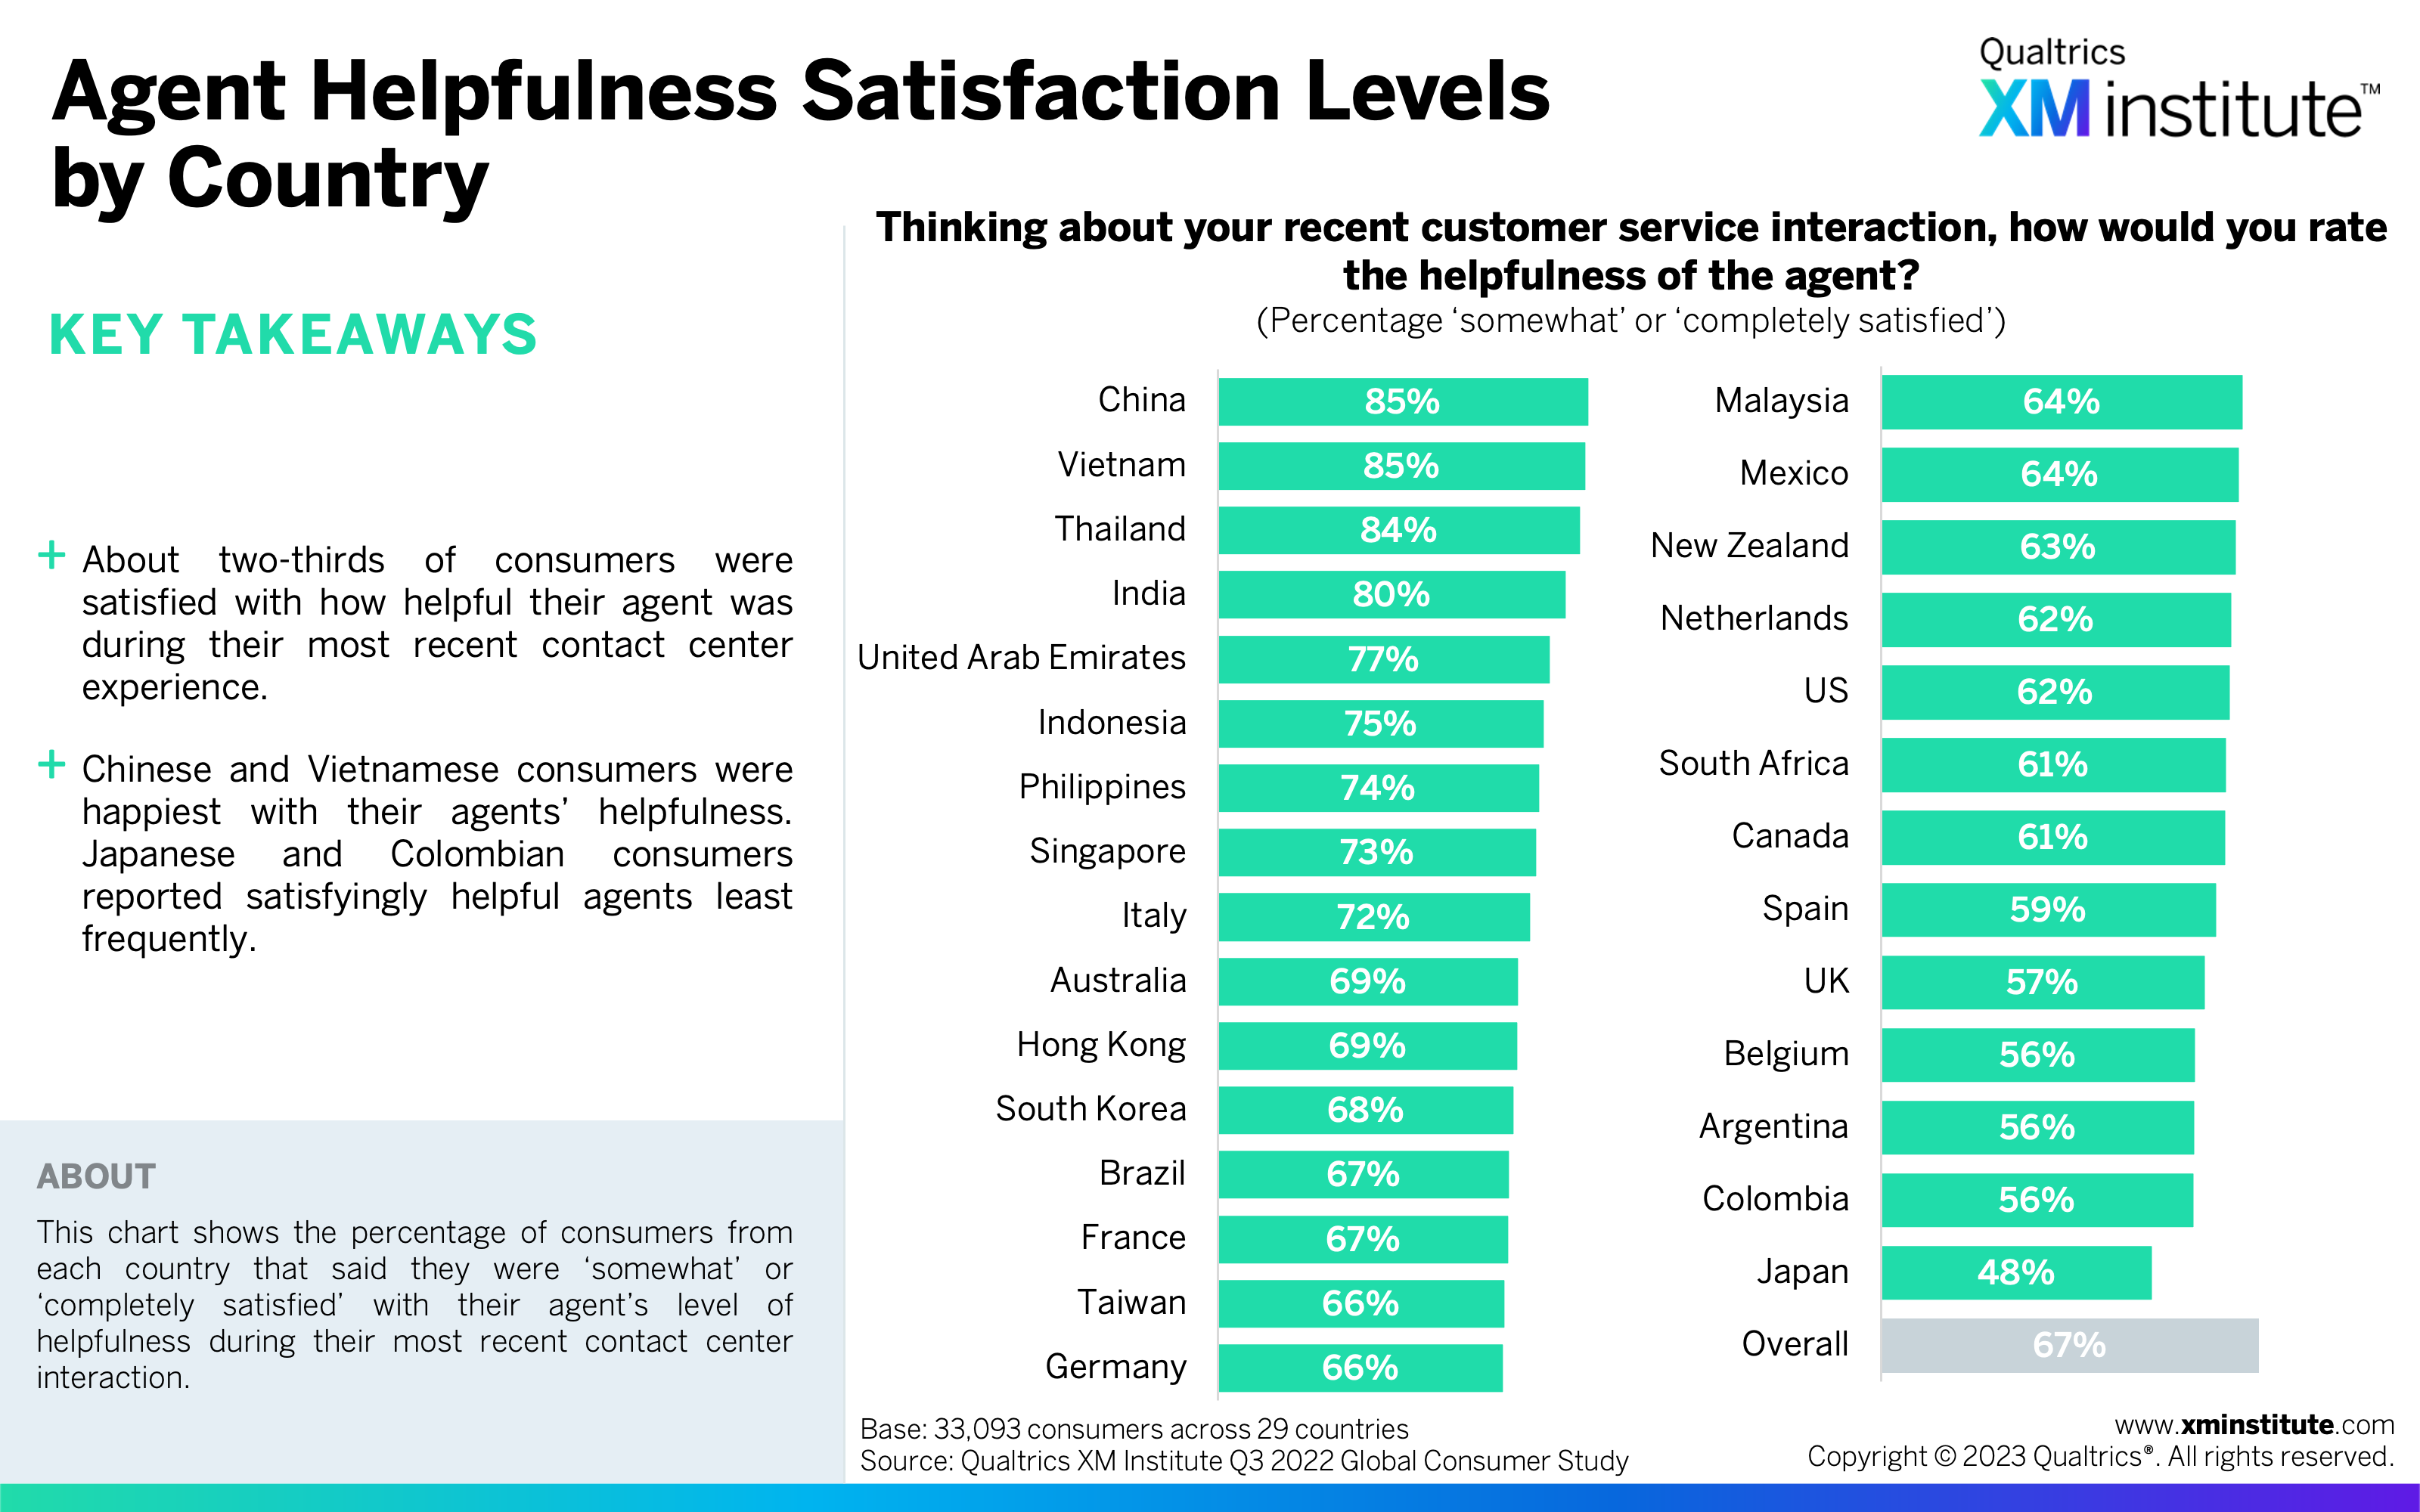
- Agent Helpfulness Satisfaction Levels by Country (see Figure 5)
- Agent Empathy Satisfaction Levels by Country (see Figure 6)
- Contact Center Issue Resolution by Country (see Figure 7)
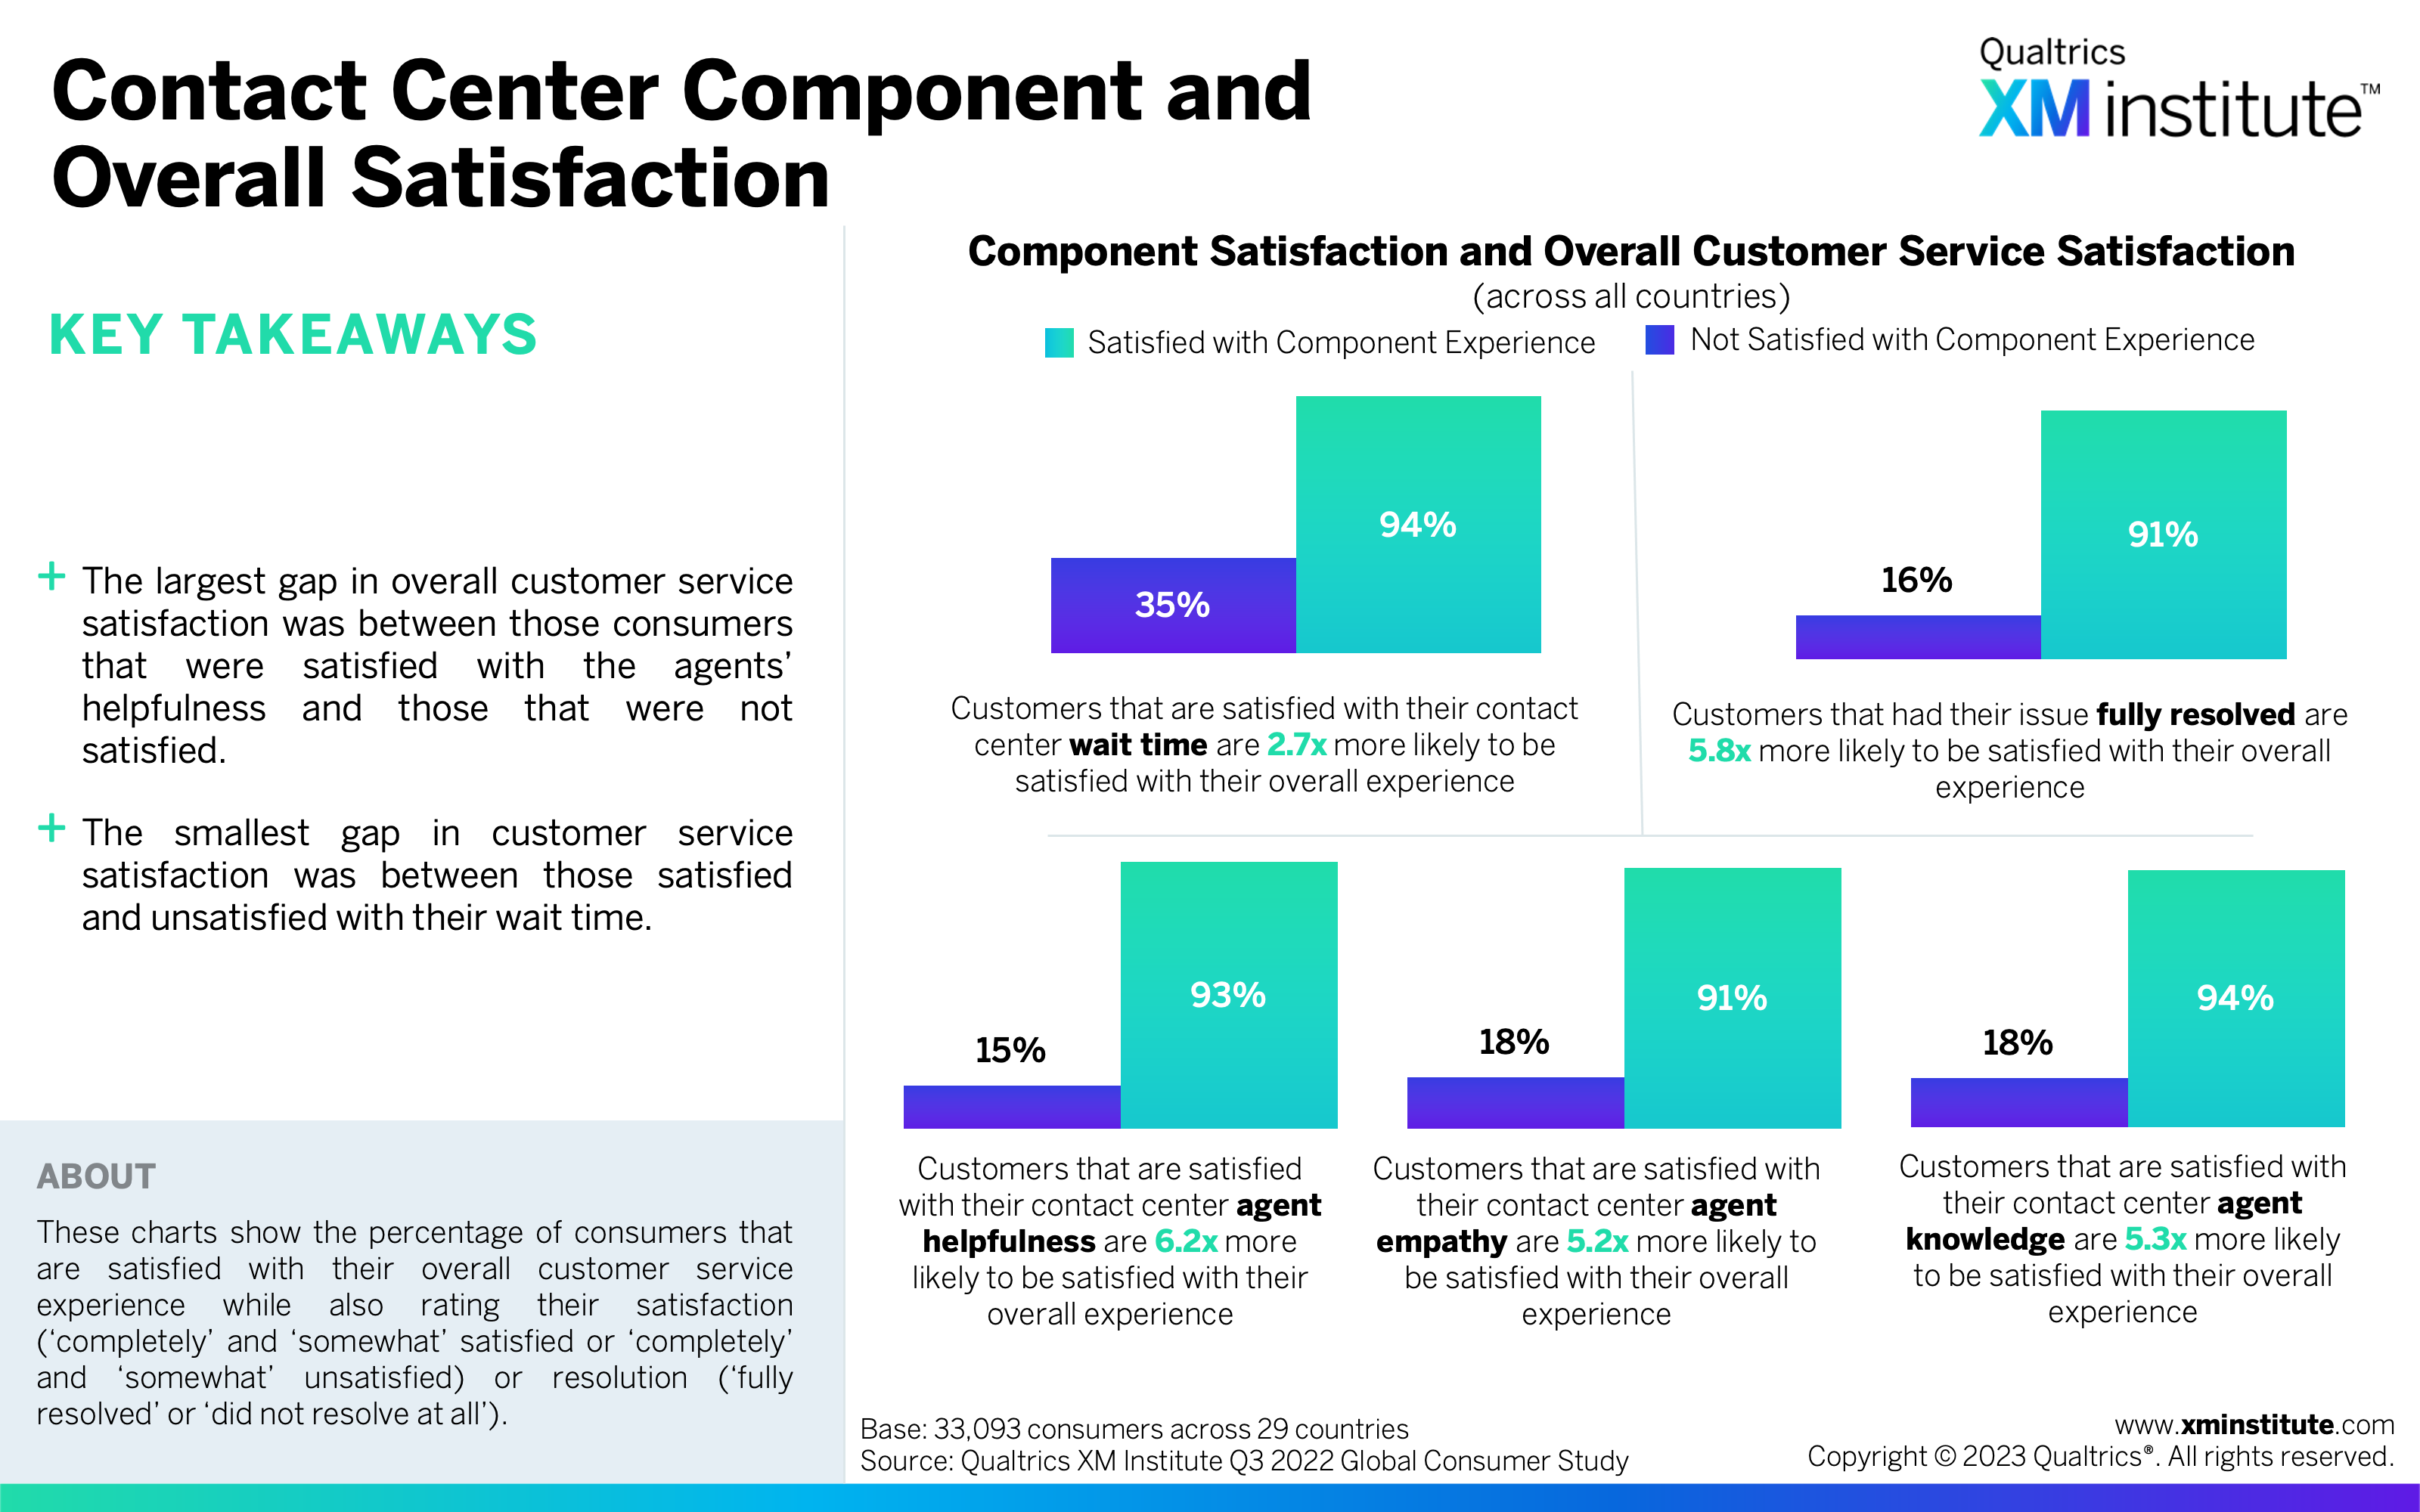
- Contact Center Component and Overall Satisfaction (see Figure 8)
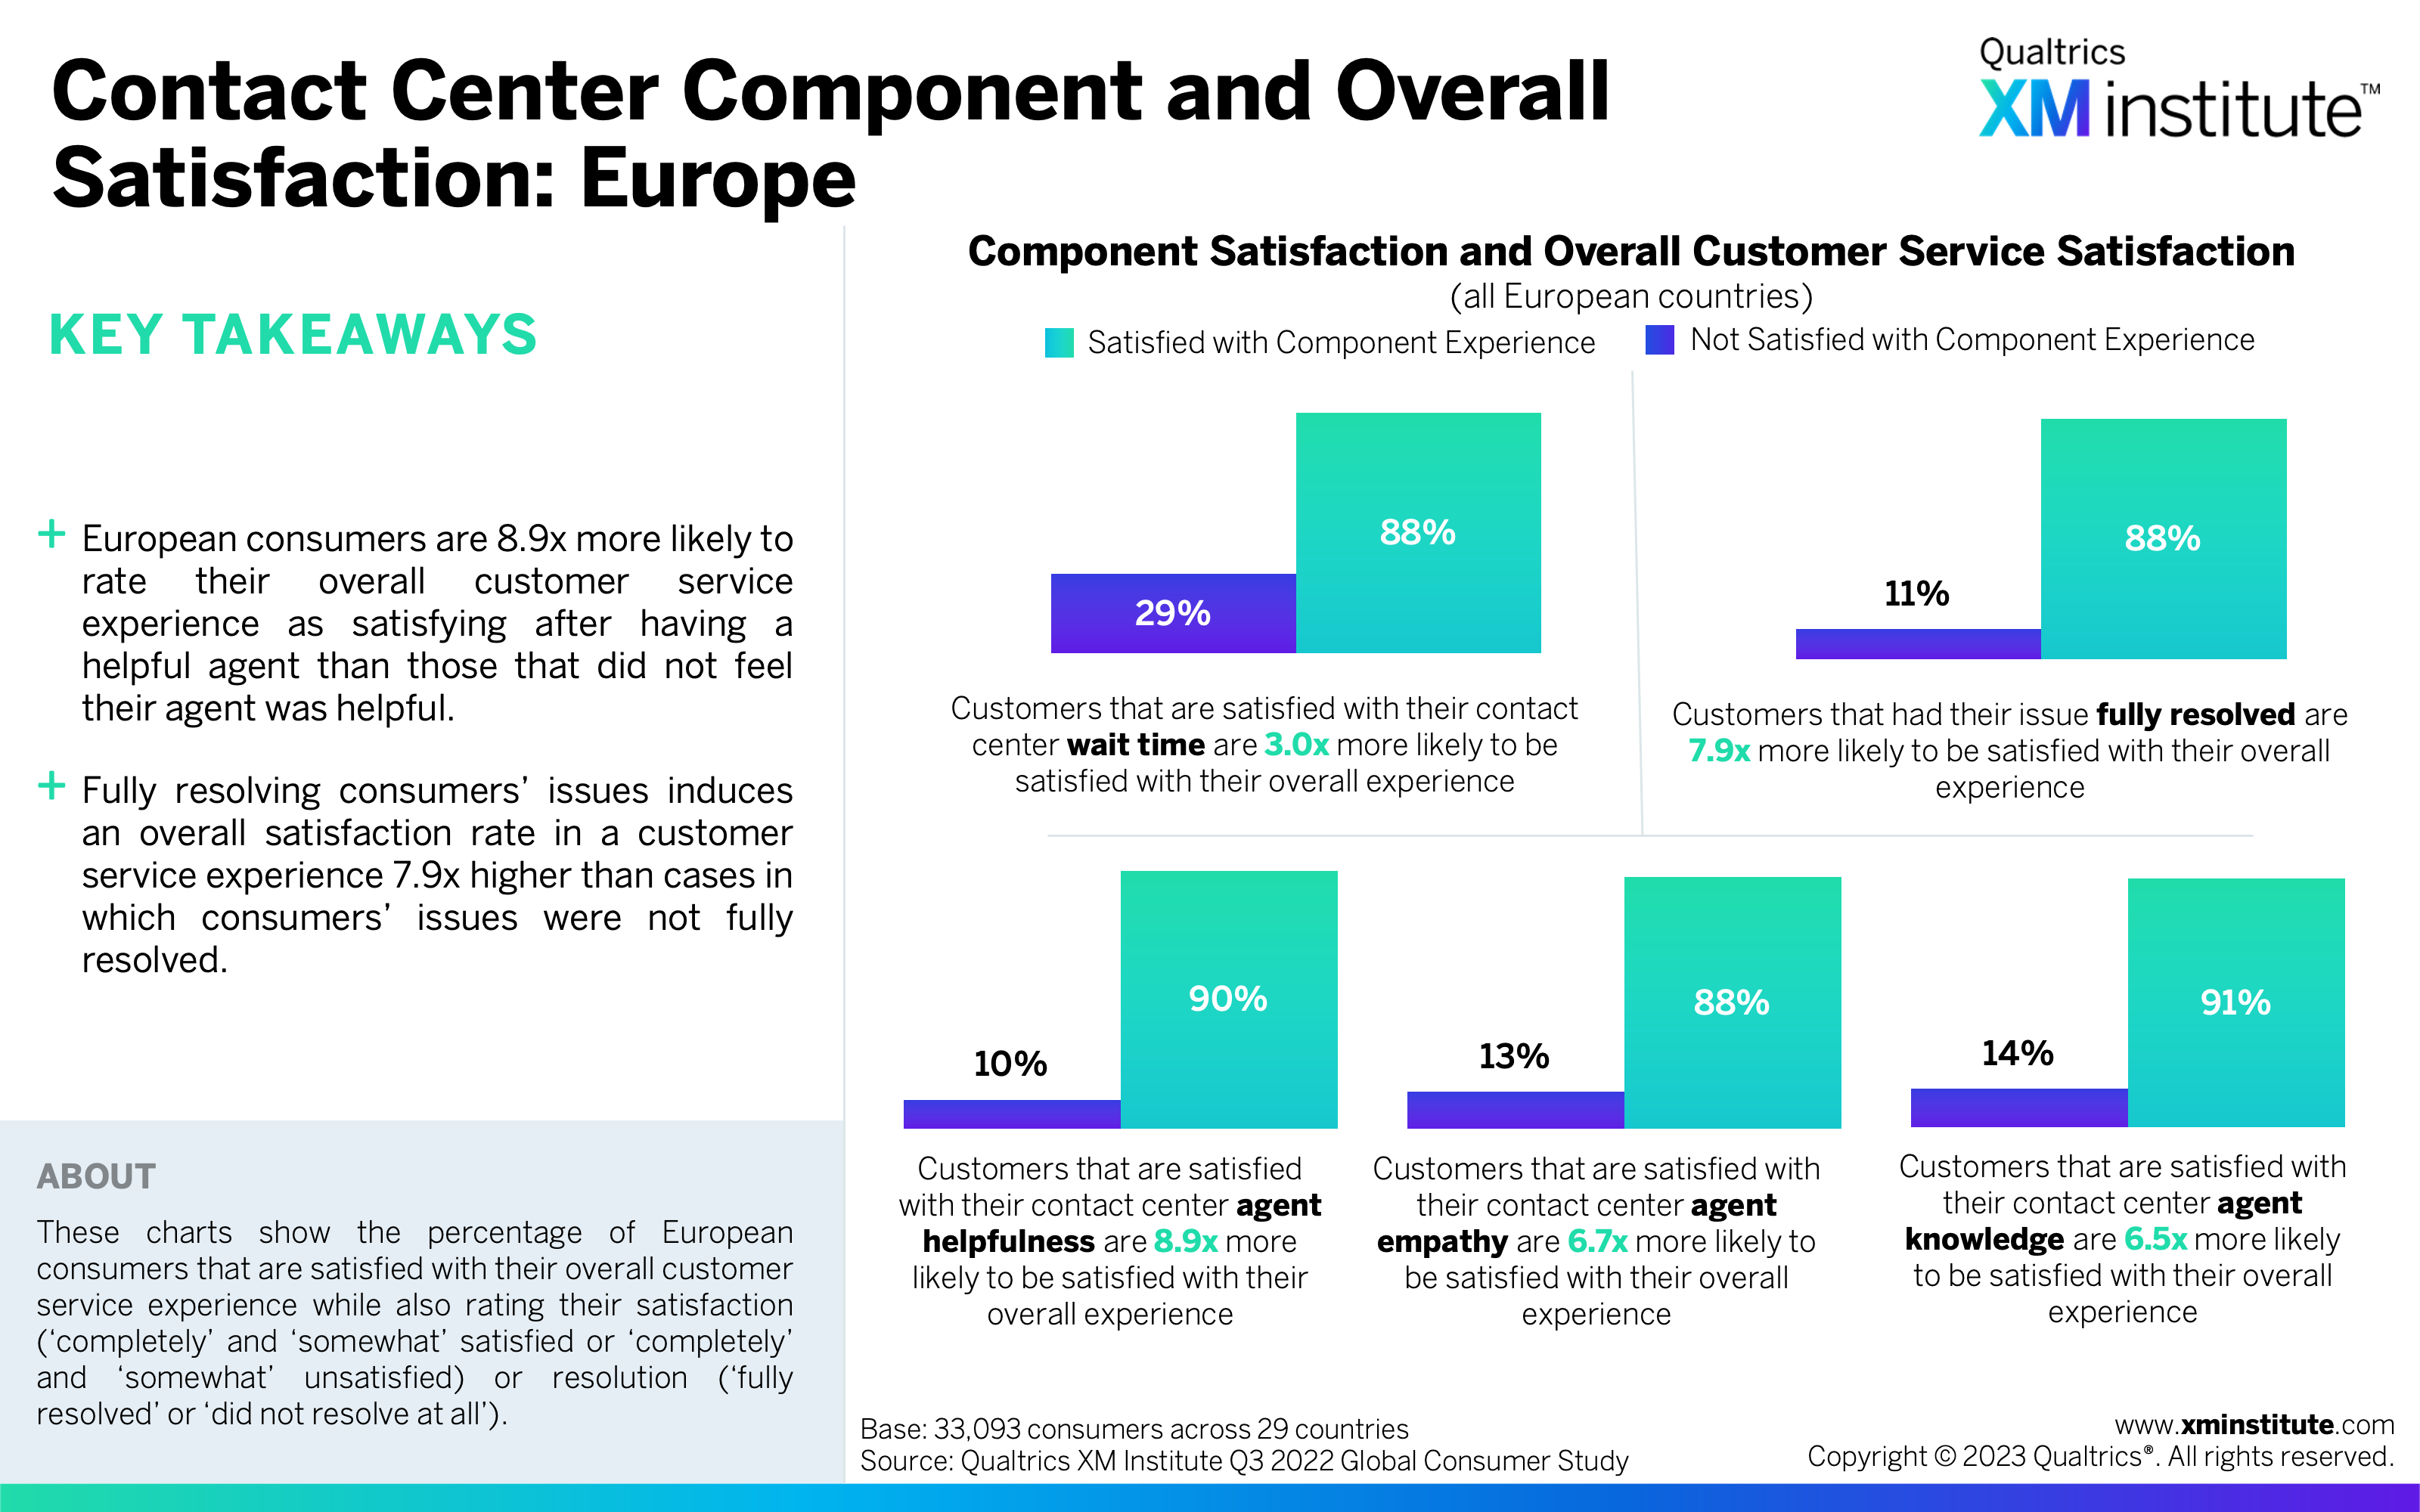
- Contact Center Component and Overall Satisfaction: Europe (see Figure 9)
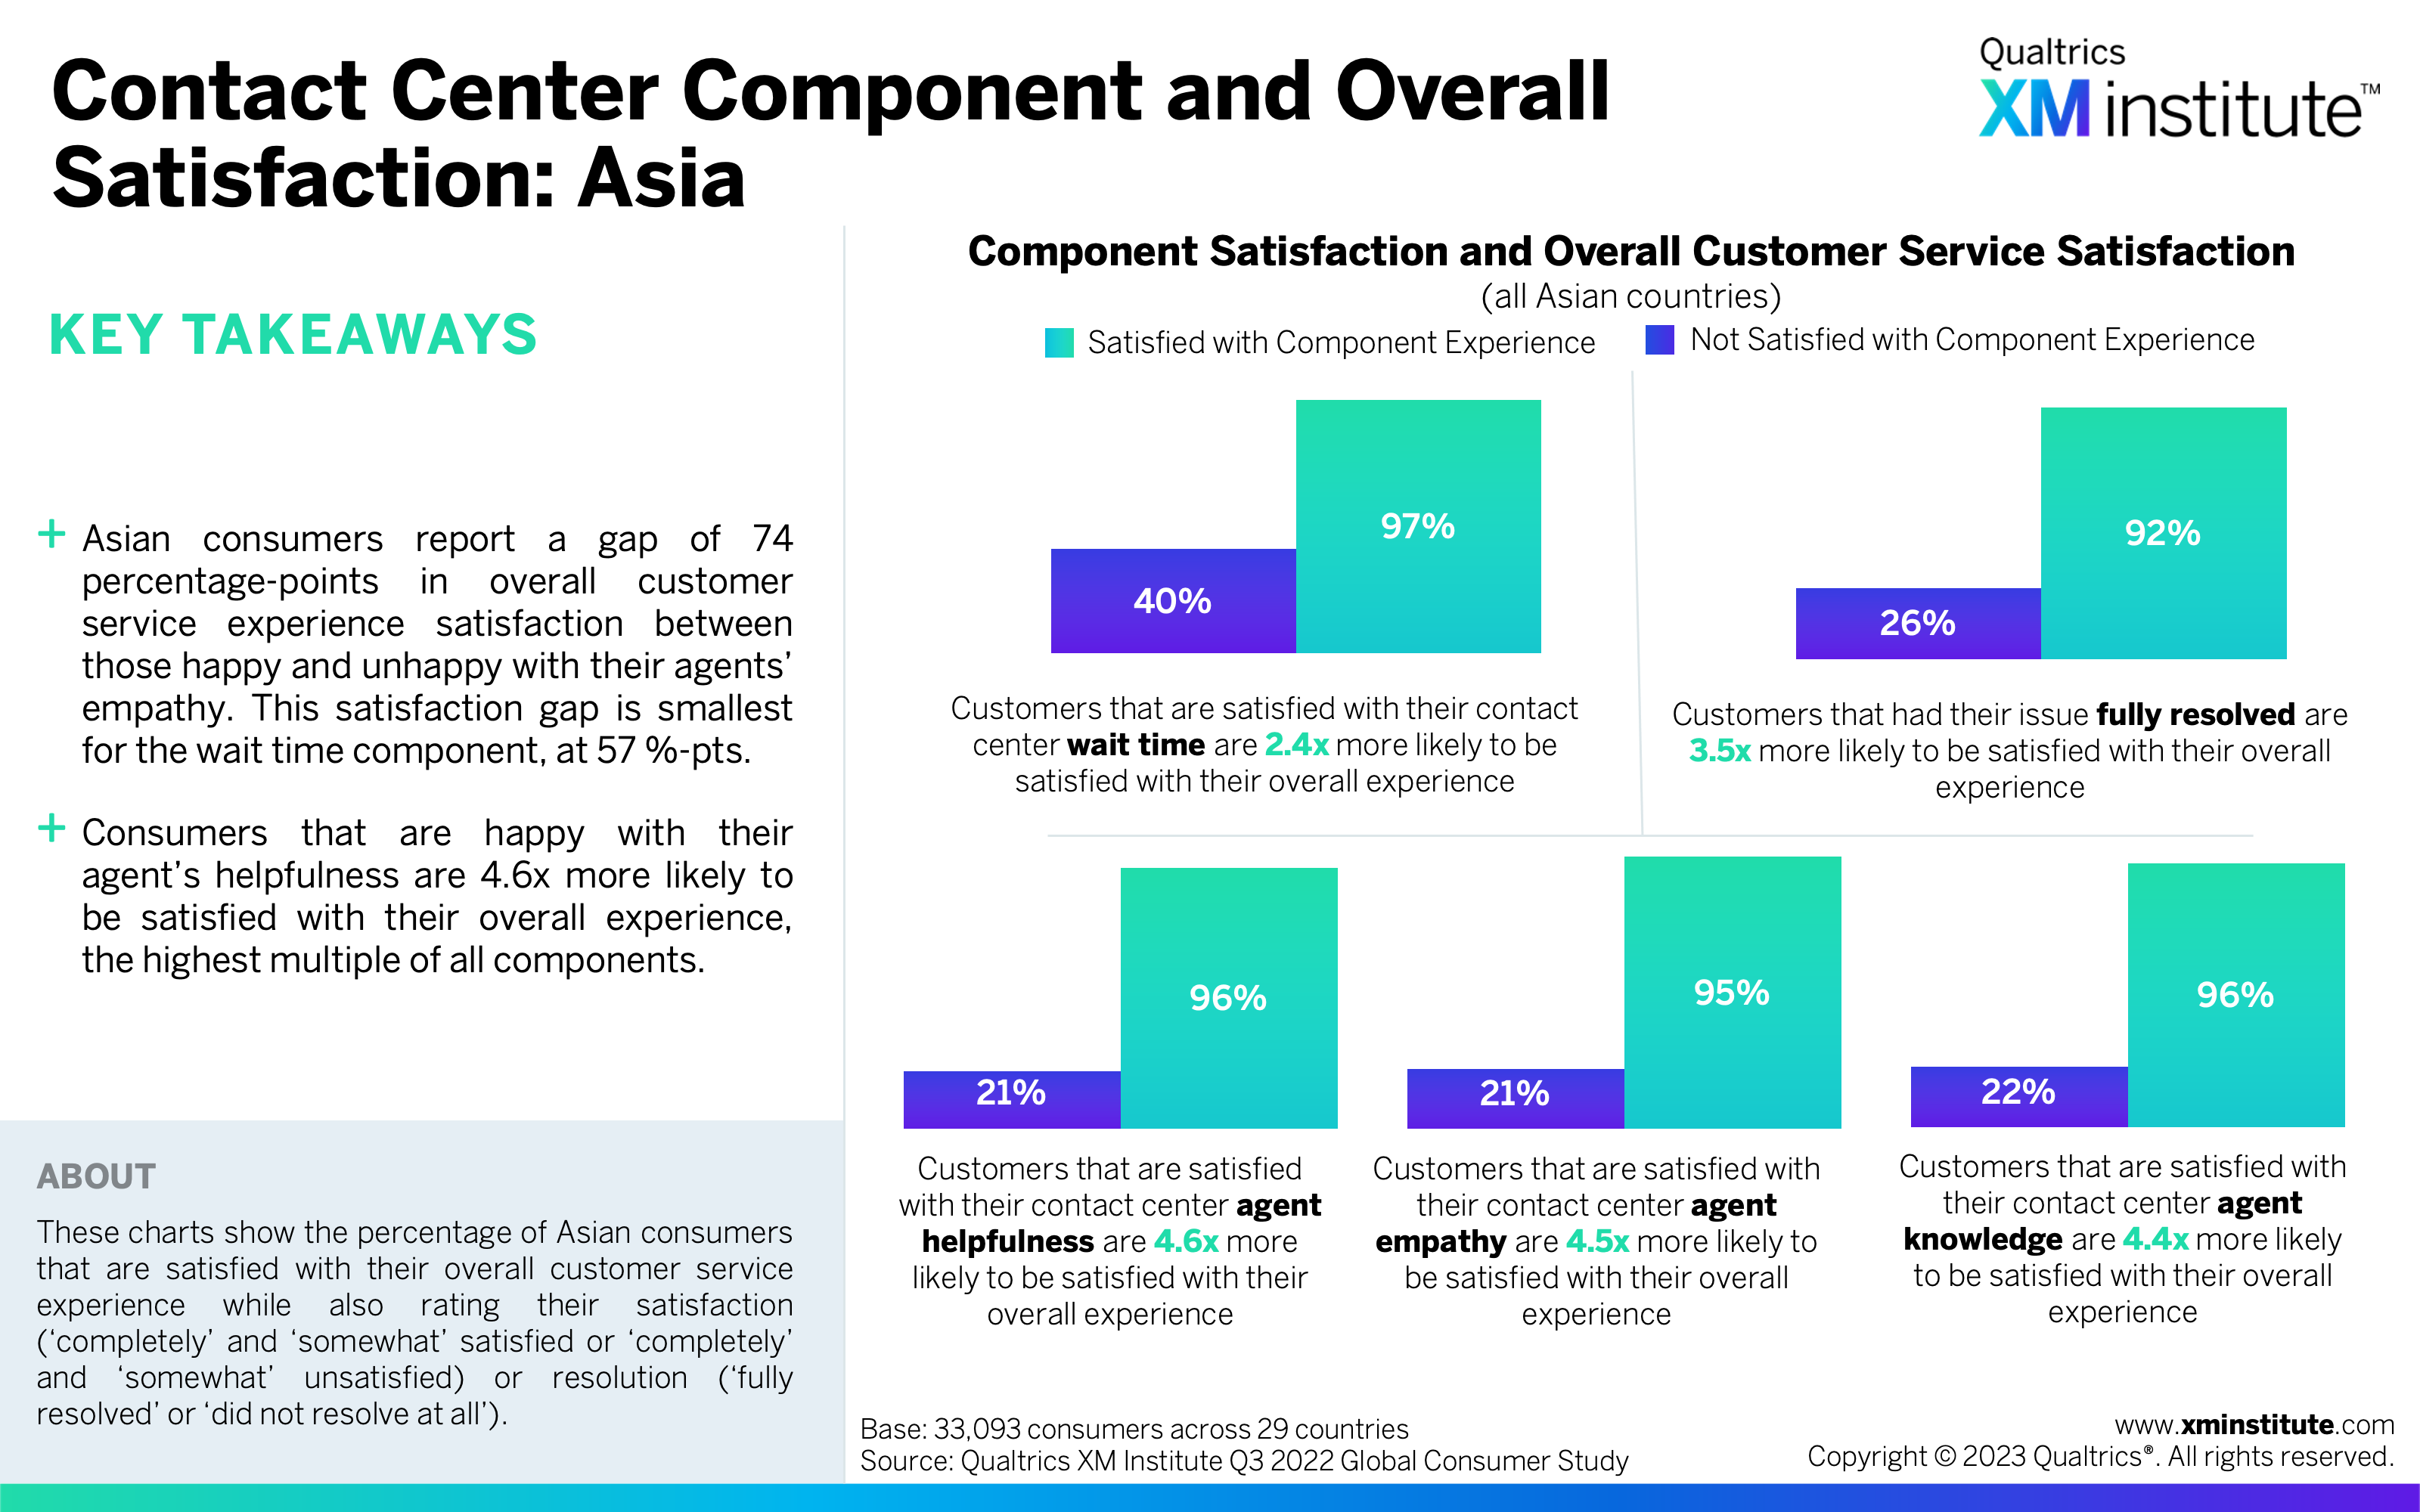
- Contact Center Component and Overall Satisfaction: Asia (see Figure 10)
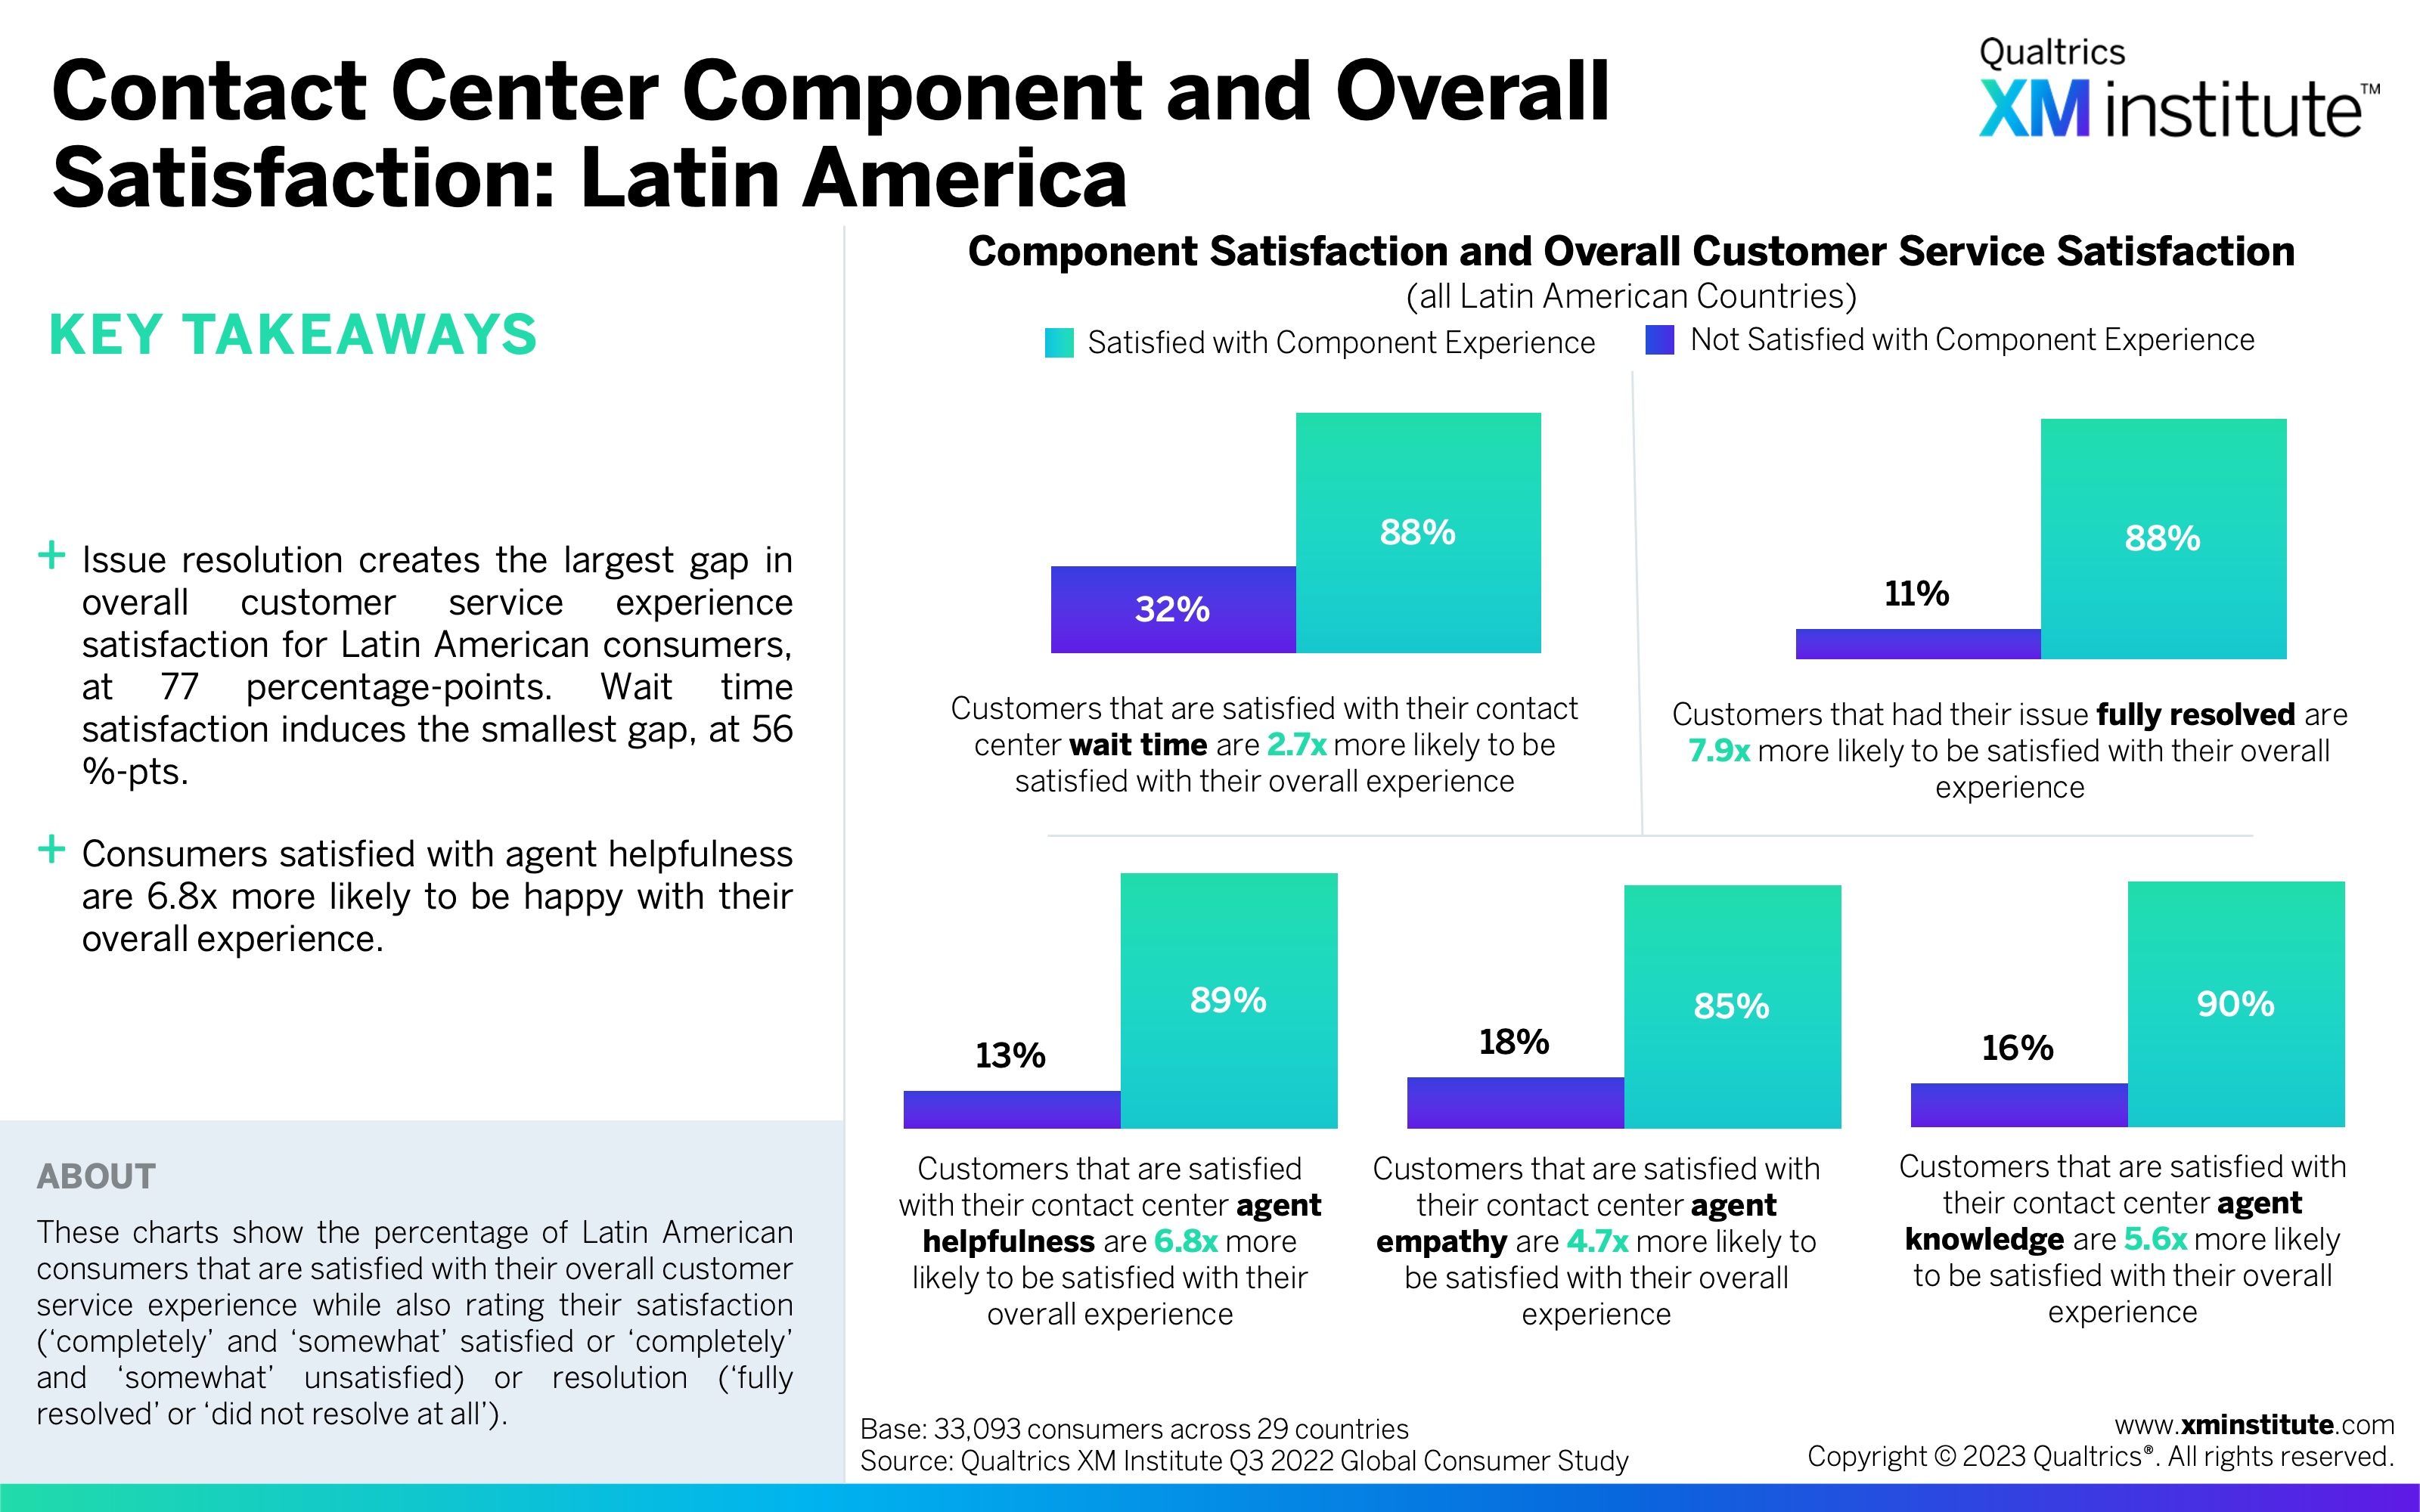
- Contact Center Component and Overall Satisfaction: Latin America (see Figure 11)
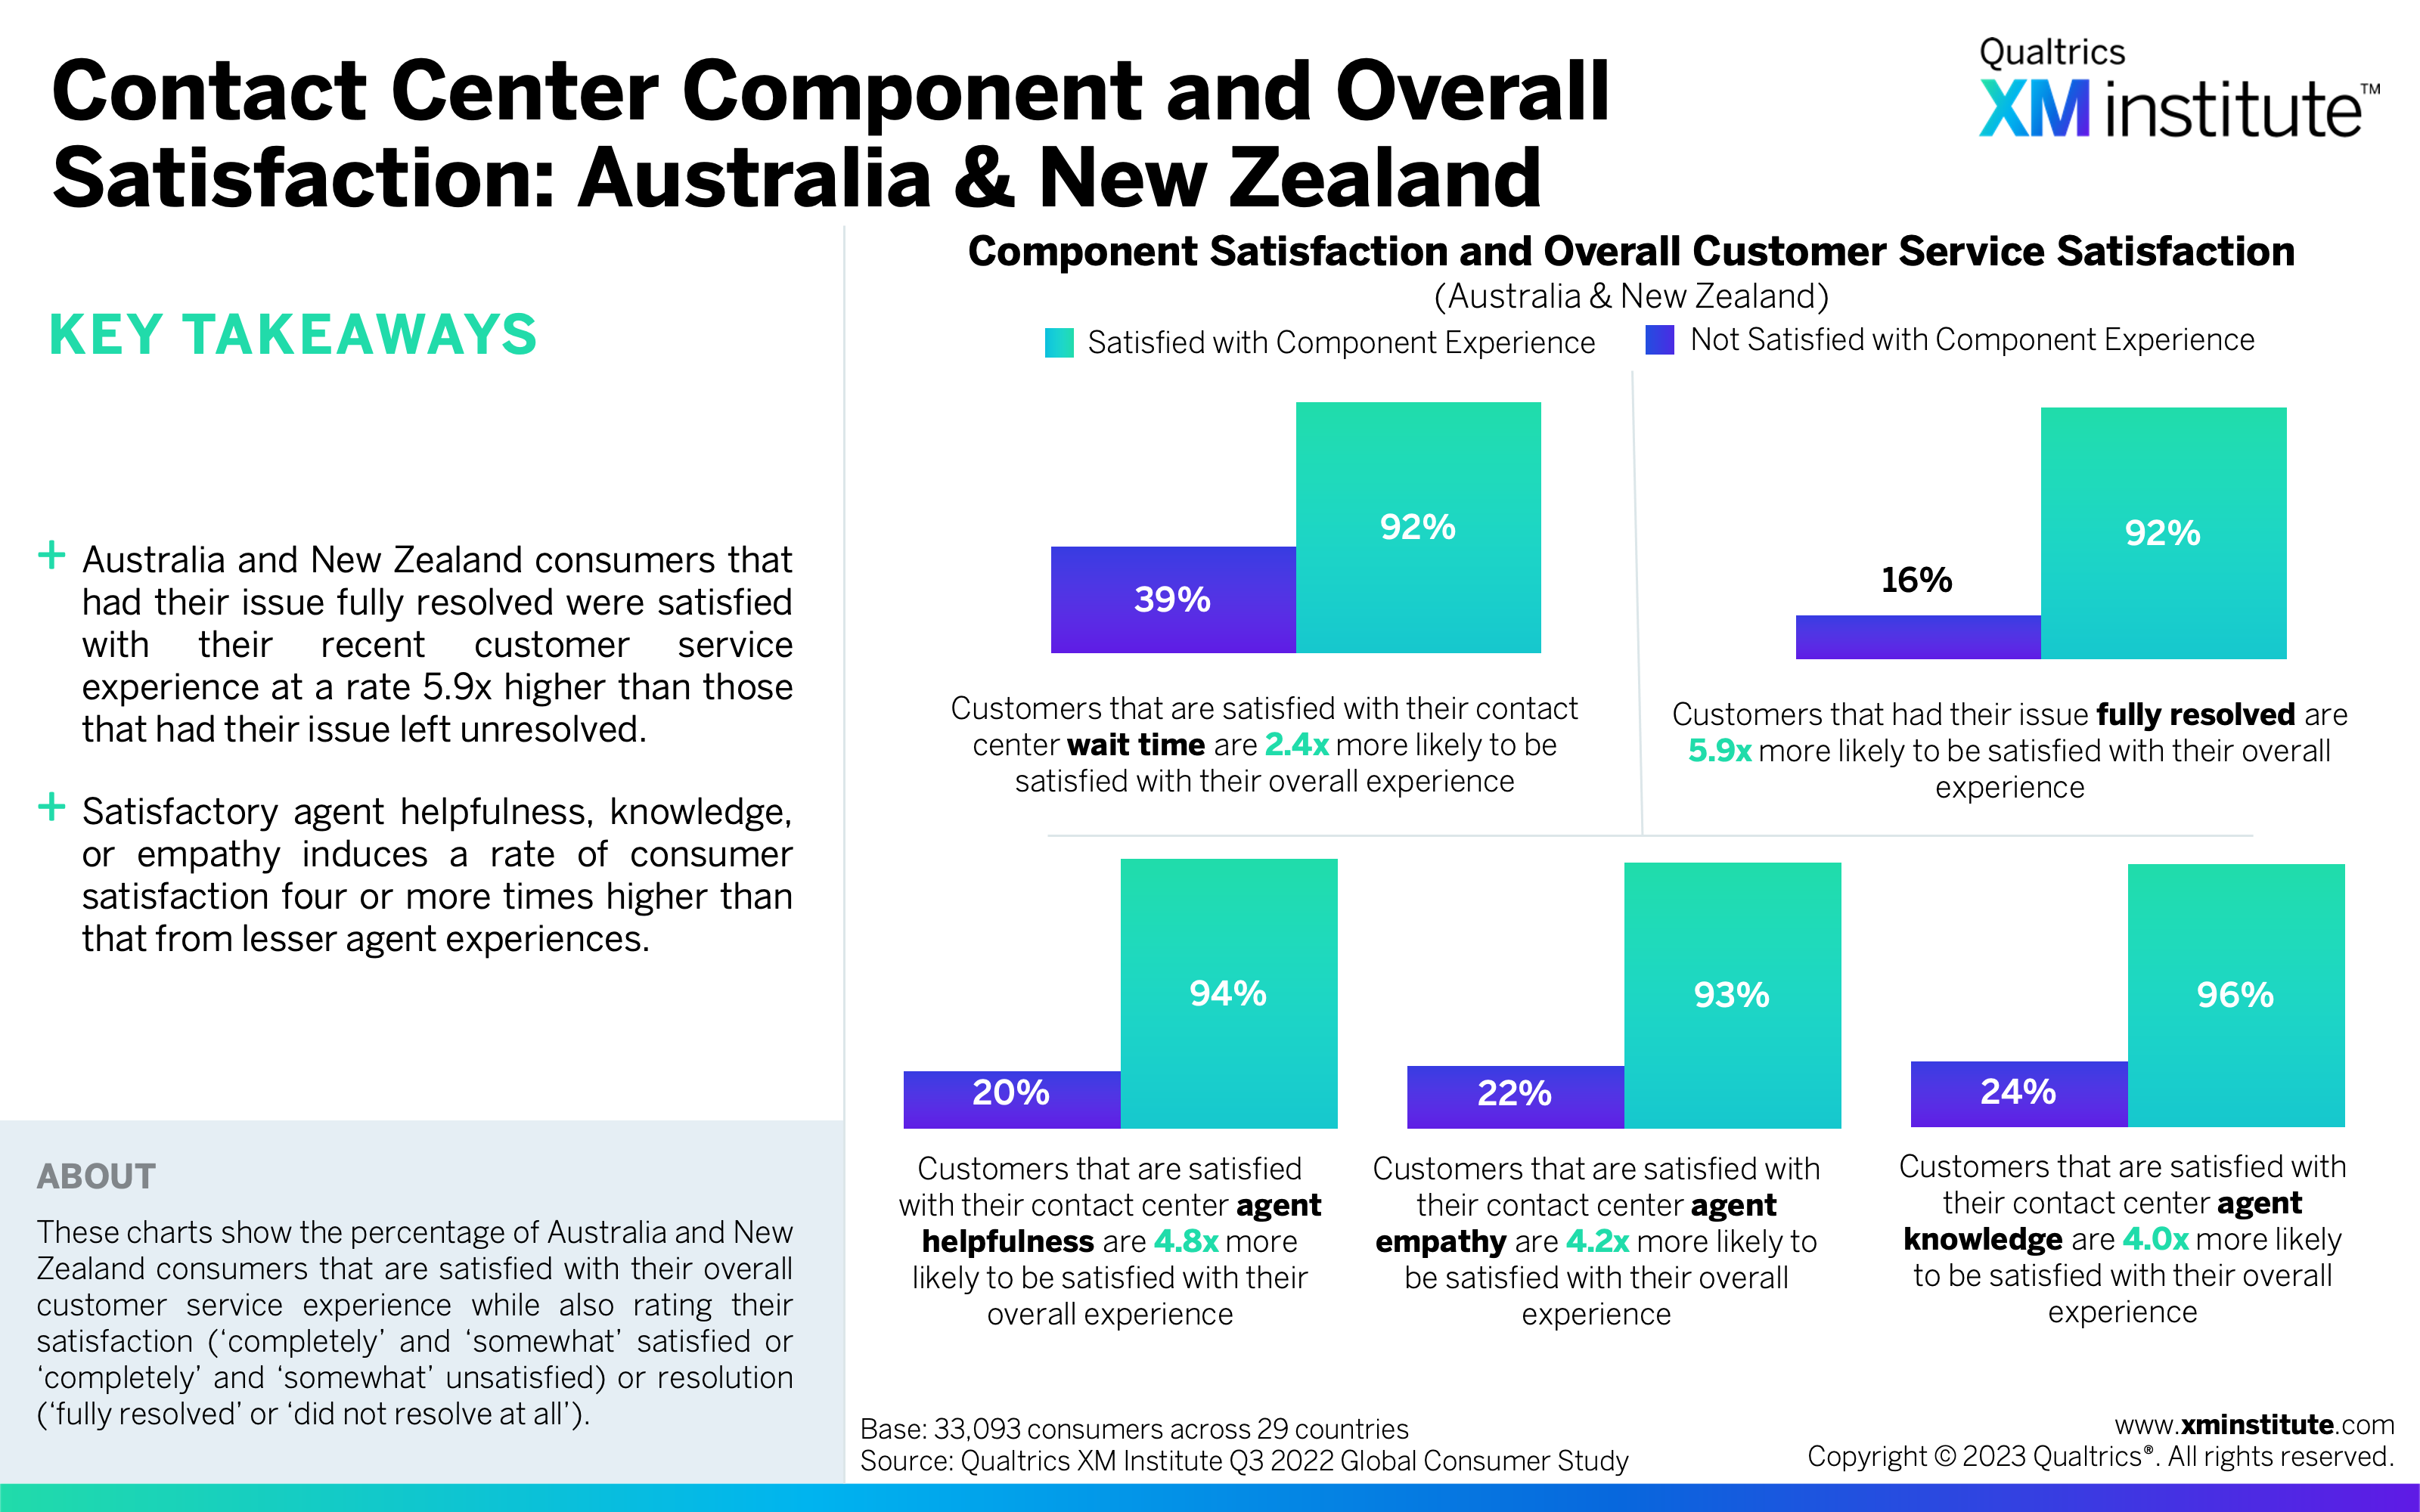
- Contact Center Component and Overall Satisfaction: Australia & New Zealand (see Figure 12)
- Contact Center Component and Overall Satisfaction: US & Canada (see Figure 13)
- Loyalty and Customer Service Satisfaction (see Figure 14)
- Loyalty and Customer Service Satisfaction: Europe (see Figure 15)
- Loyalty and Customer Service Satisfaction: Asia (see Figure 16)
- Loyalty and Customer Service Satisfaction: Latin America (see Figure 17)
- Loyalty and Customer Service Satisfaction: Australia & New Zealand (see Figure 18)
- Loyalty and Customer Service Satisfaction: US & Canada (see Figure 19)
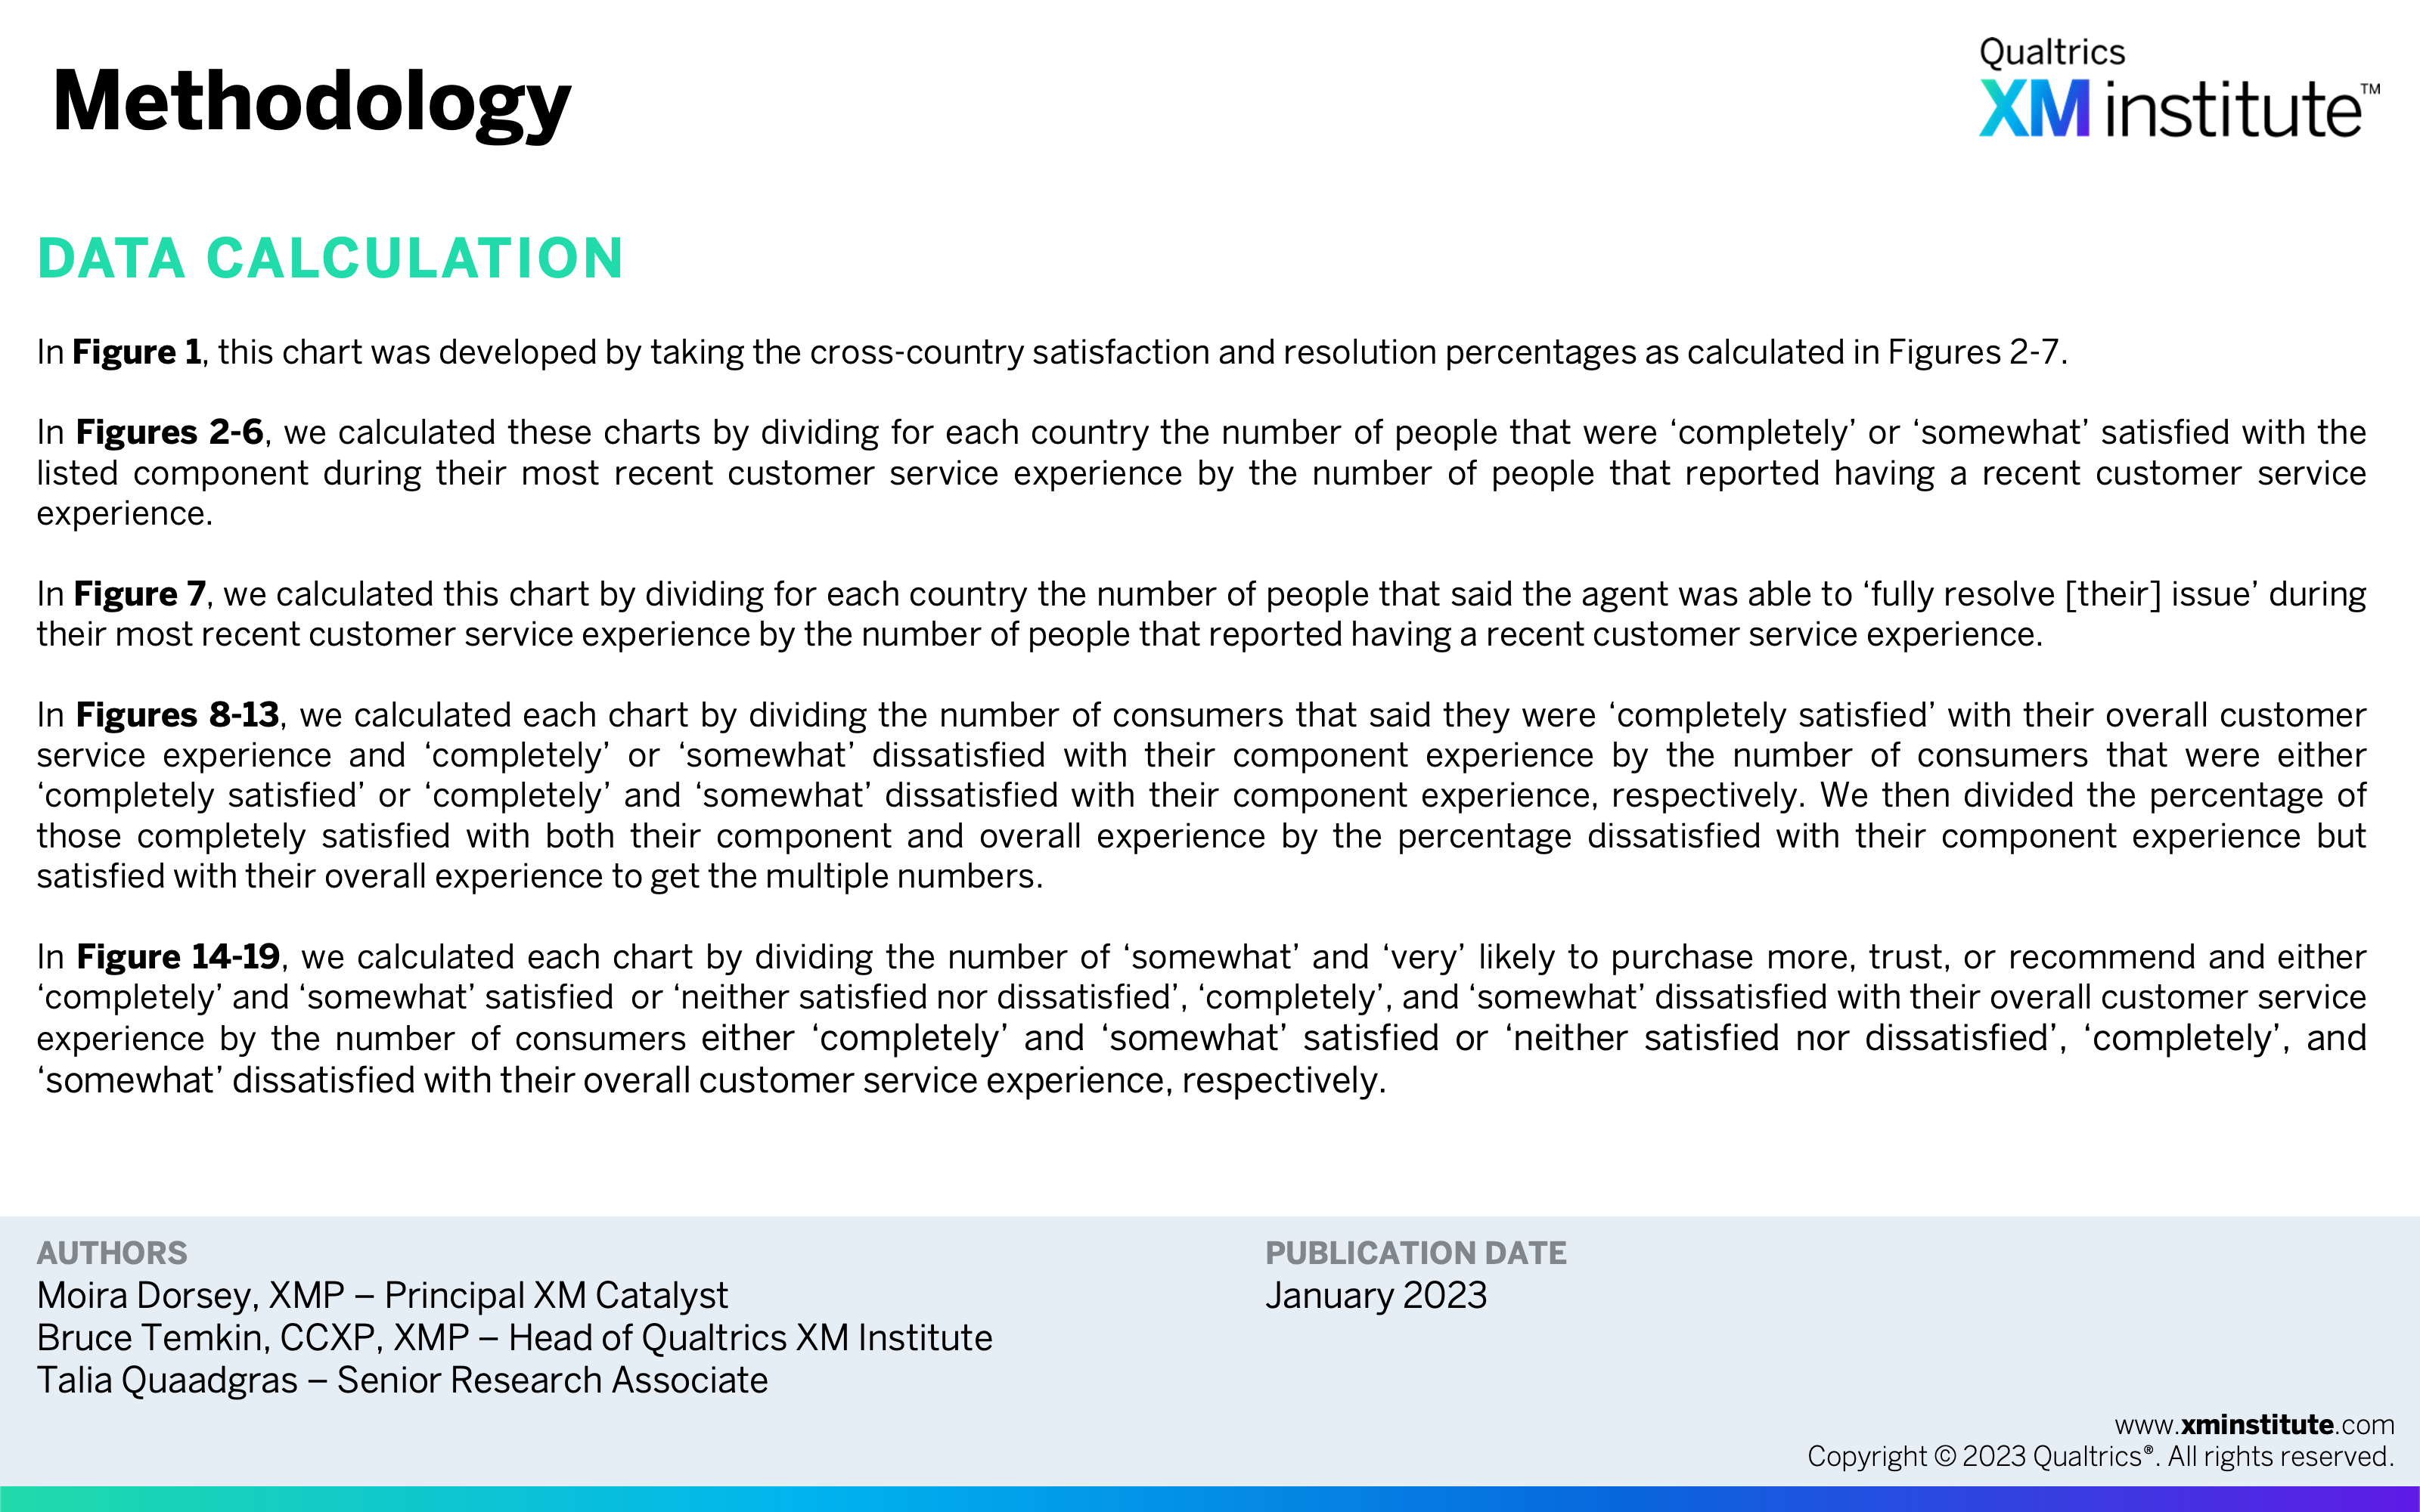
- Methodology (see Figure 20)