Key Takeaways
As part of our latest global consumer study, consumers from 29 countries rated their recent experiences with 20 industries on a satisfaction scale of 1-5 stars and told us how likely they are to trust, recommend, and purchase more after that experience. From this study and the global study that we conducted in Q3 of 2021, we were able to analyze the current state of customer experience and year-over-year changes to consumer sentiment. We found that:
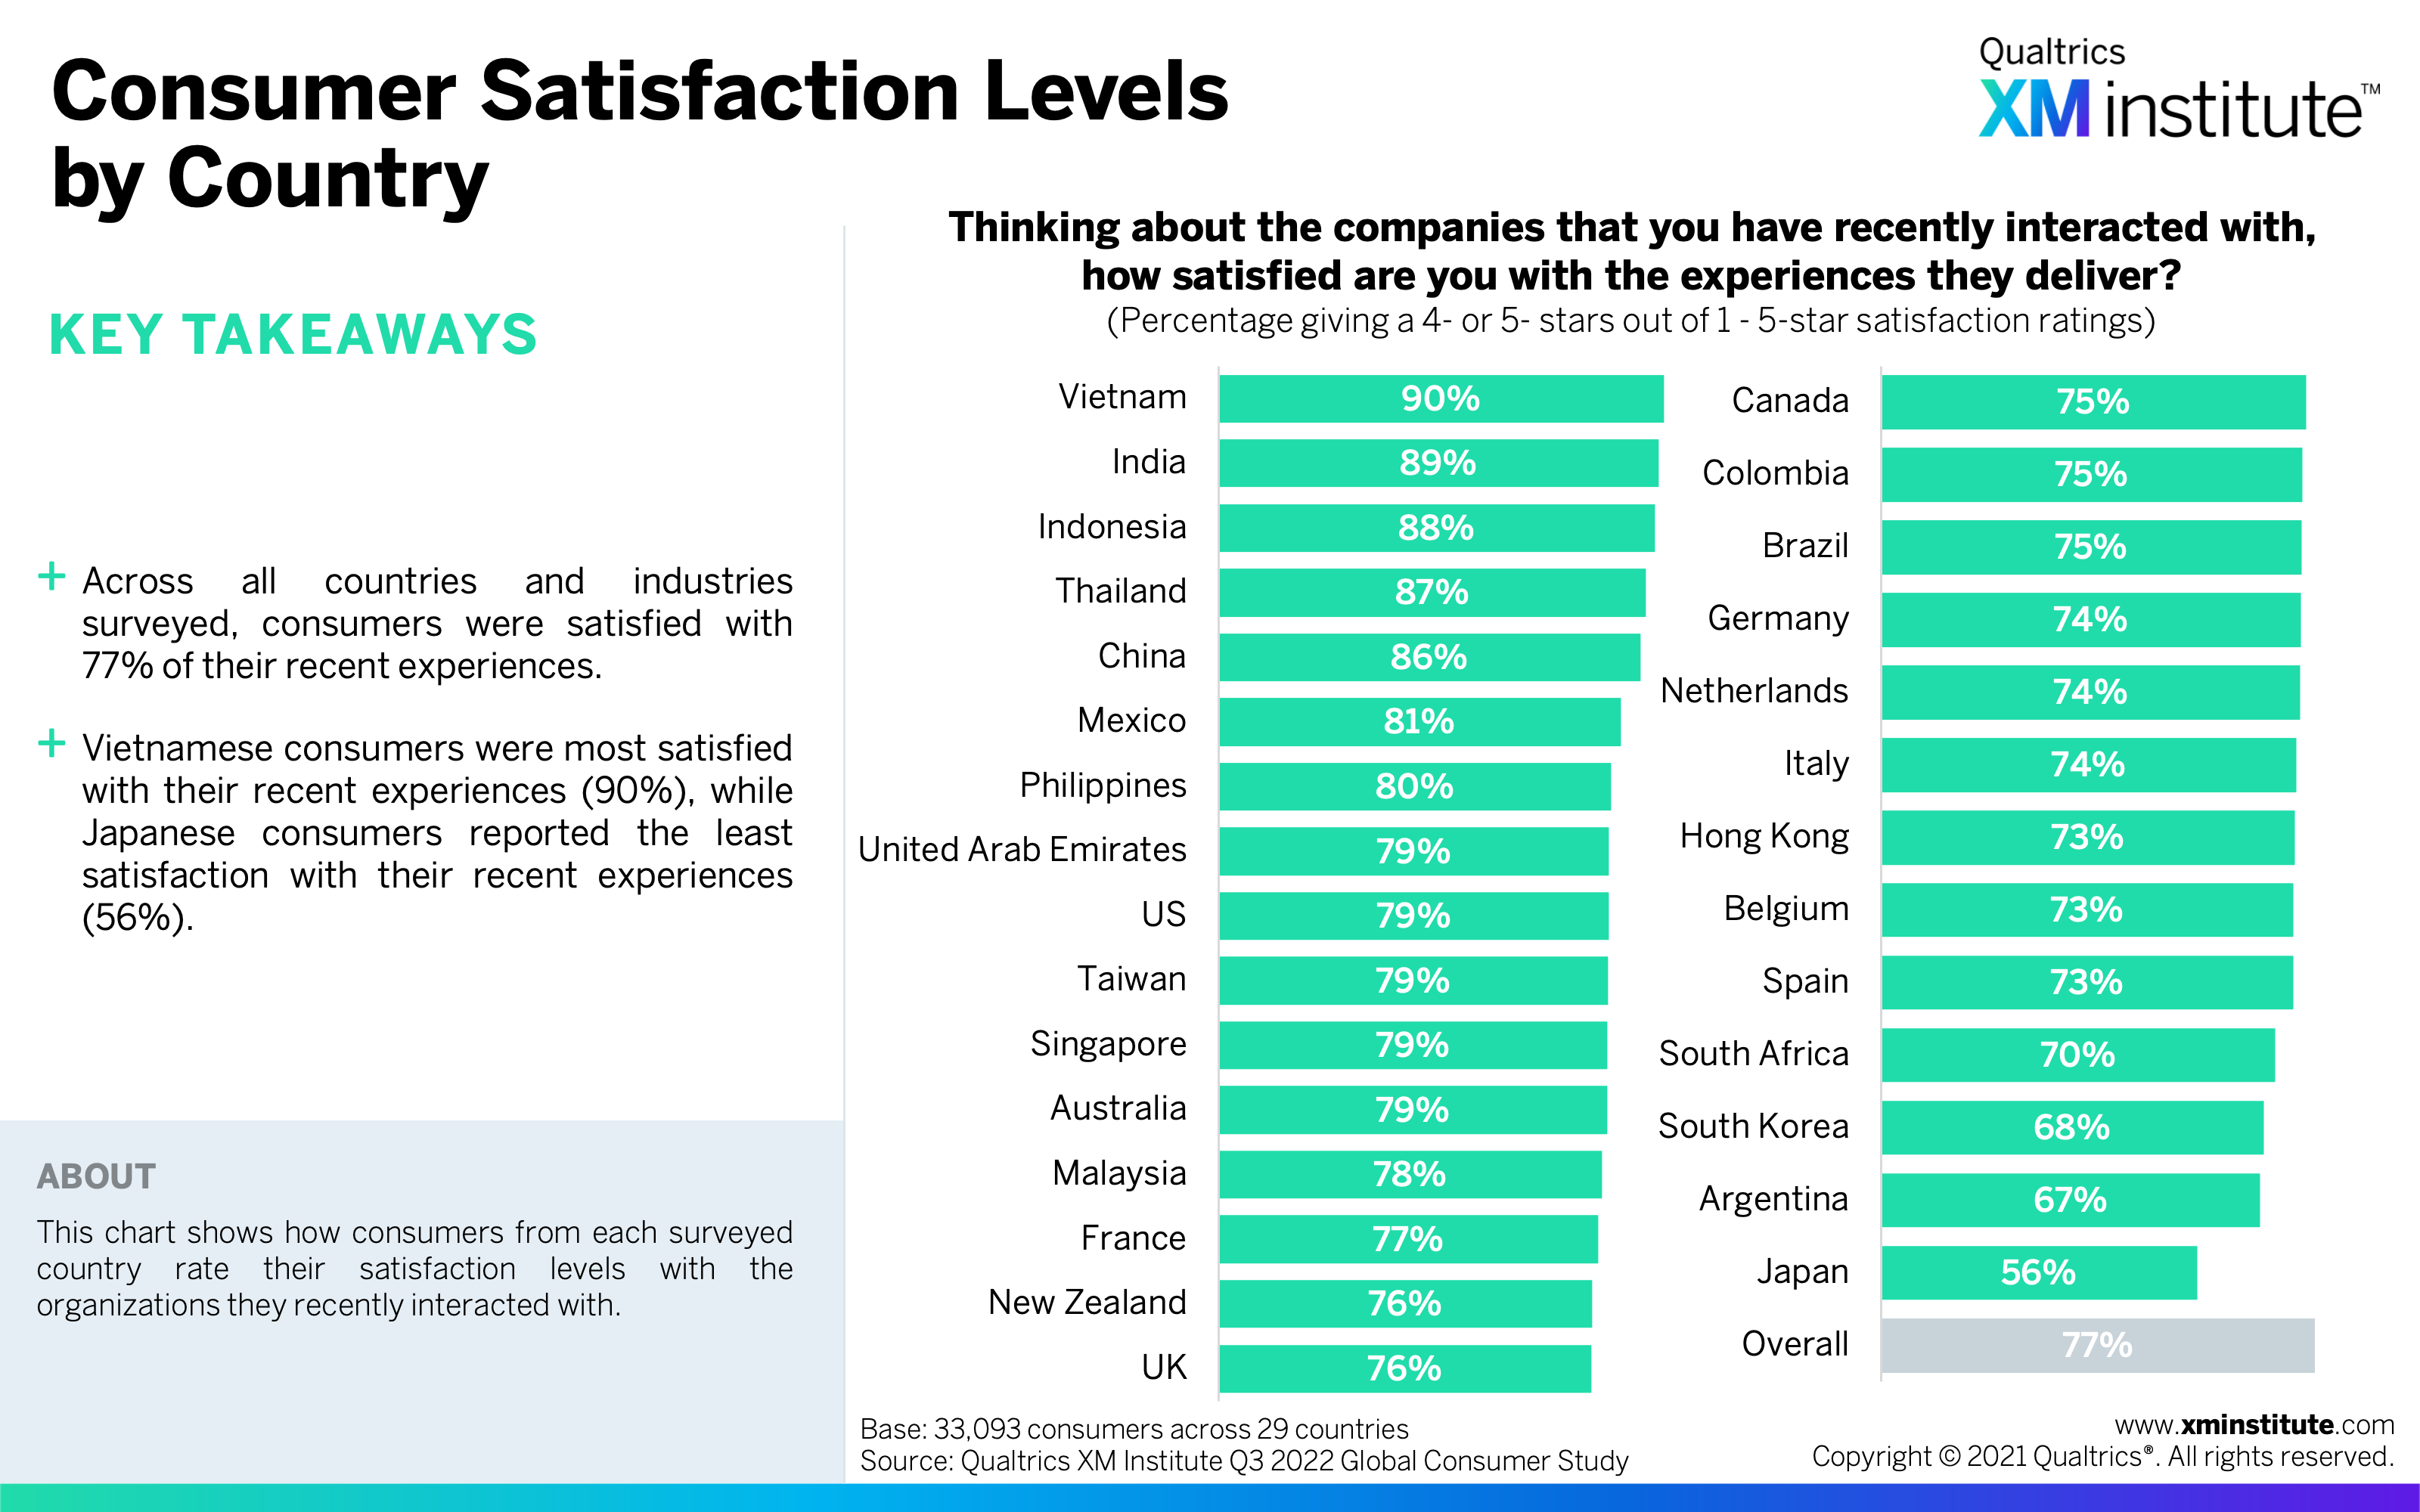
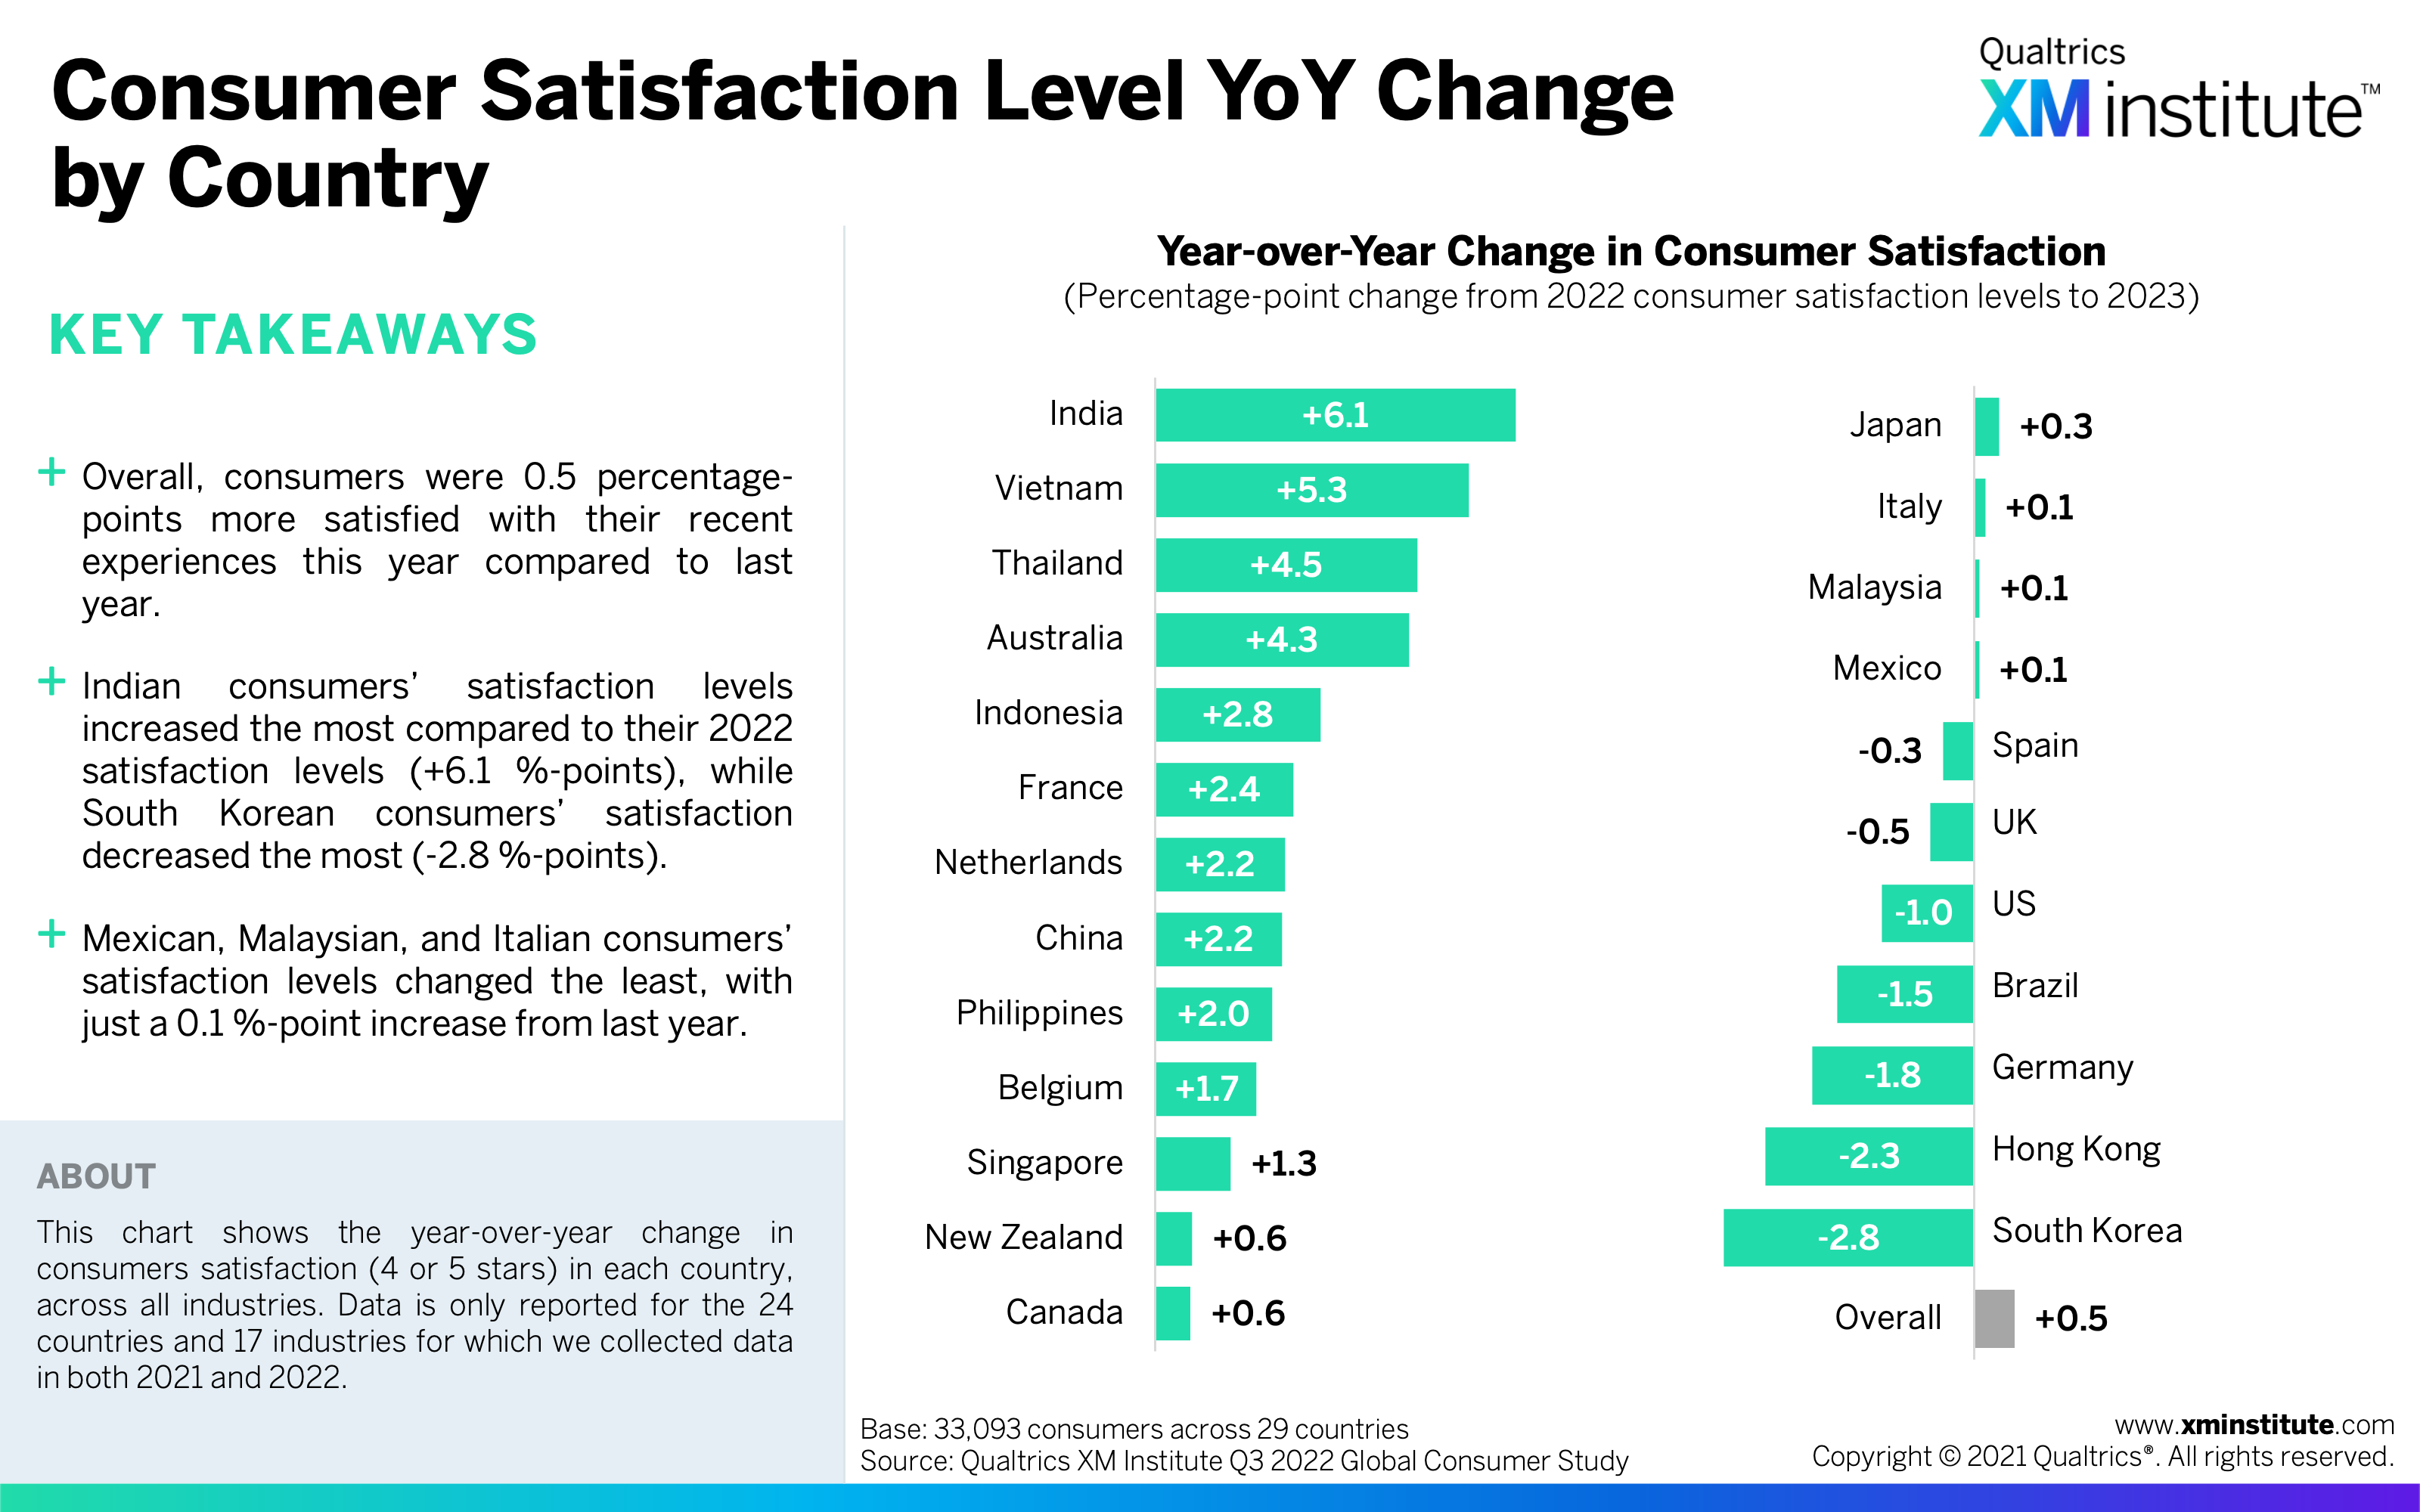
- Global consumer satisfaction remains steady – on average. Consumer satisfaction – on average across countries – increased by just 0.5 percentage-points from the previous year. Indian and Vietnamese consumers’ satisfaction increased the most, bringing them to the top of the satisfaction rankings, while Japanese consumers’ satisfaction lags more than 20 percentage-points behind the global average of 77%.
- Consumer trust and advocacy are up – barely. Globally, consumers’ likelihood to trust and recommend increased from 2021 by under 1 %-point each. Spanish and Belgian consumers’ loyalty metrics increased the most, while Vietnamese industries experienced more than a 3 %-point decrease in both trust and advocacy.
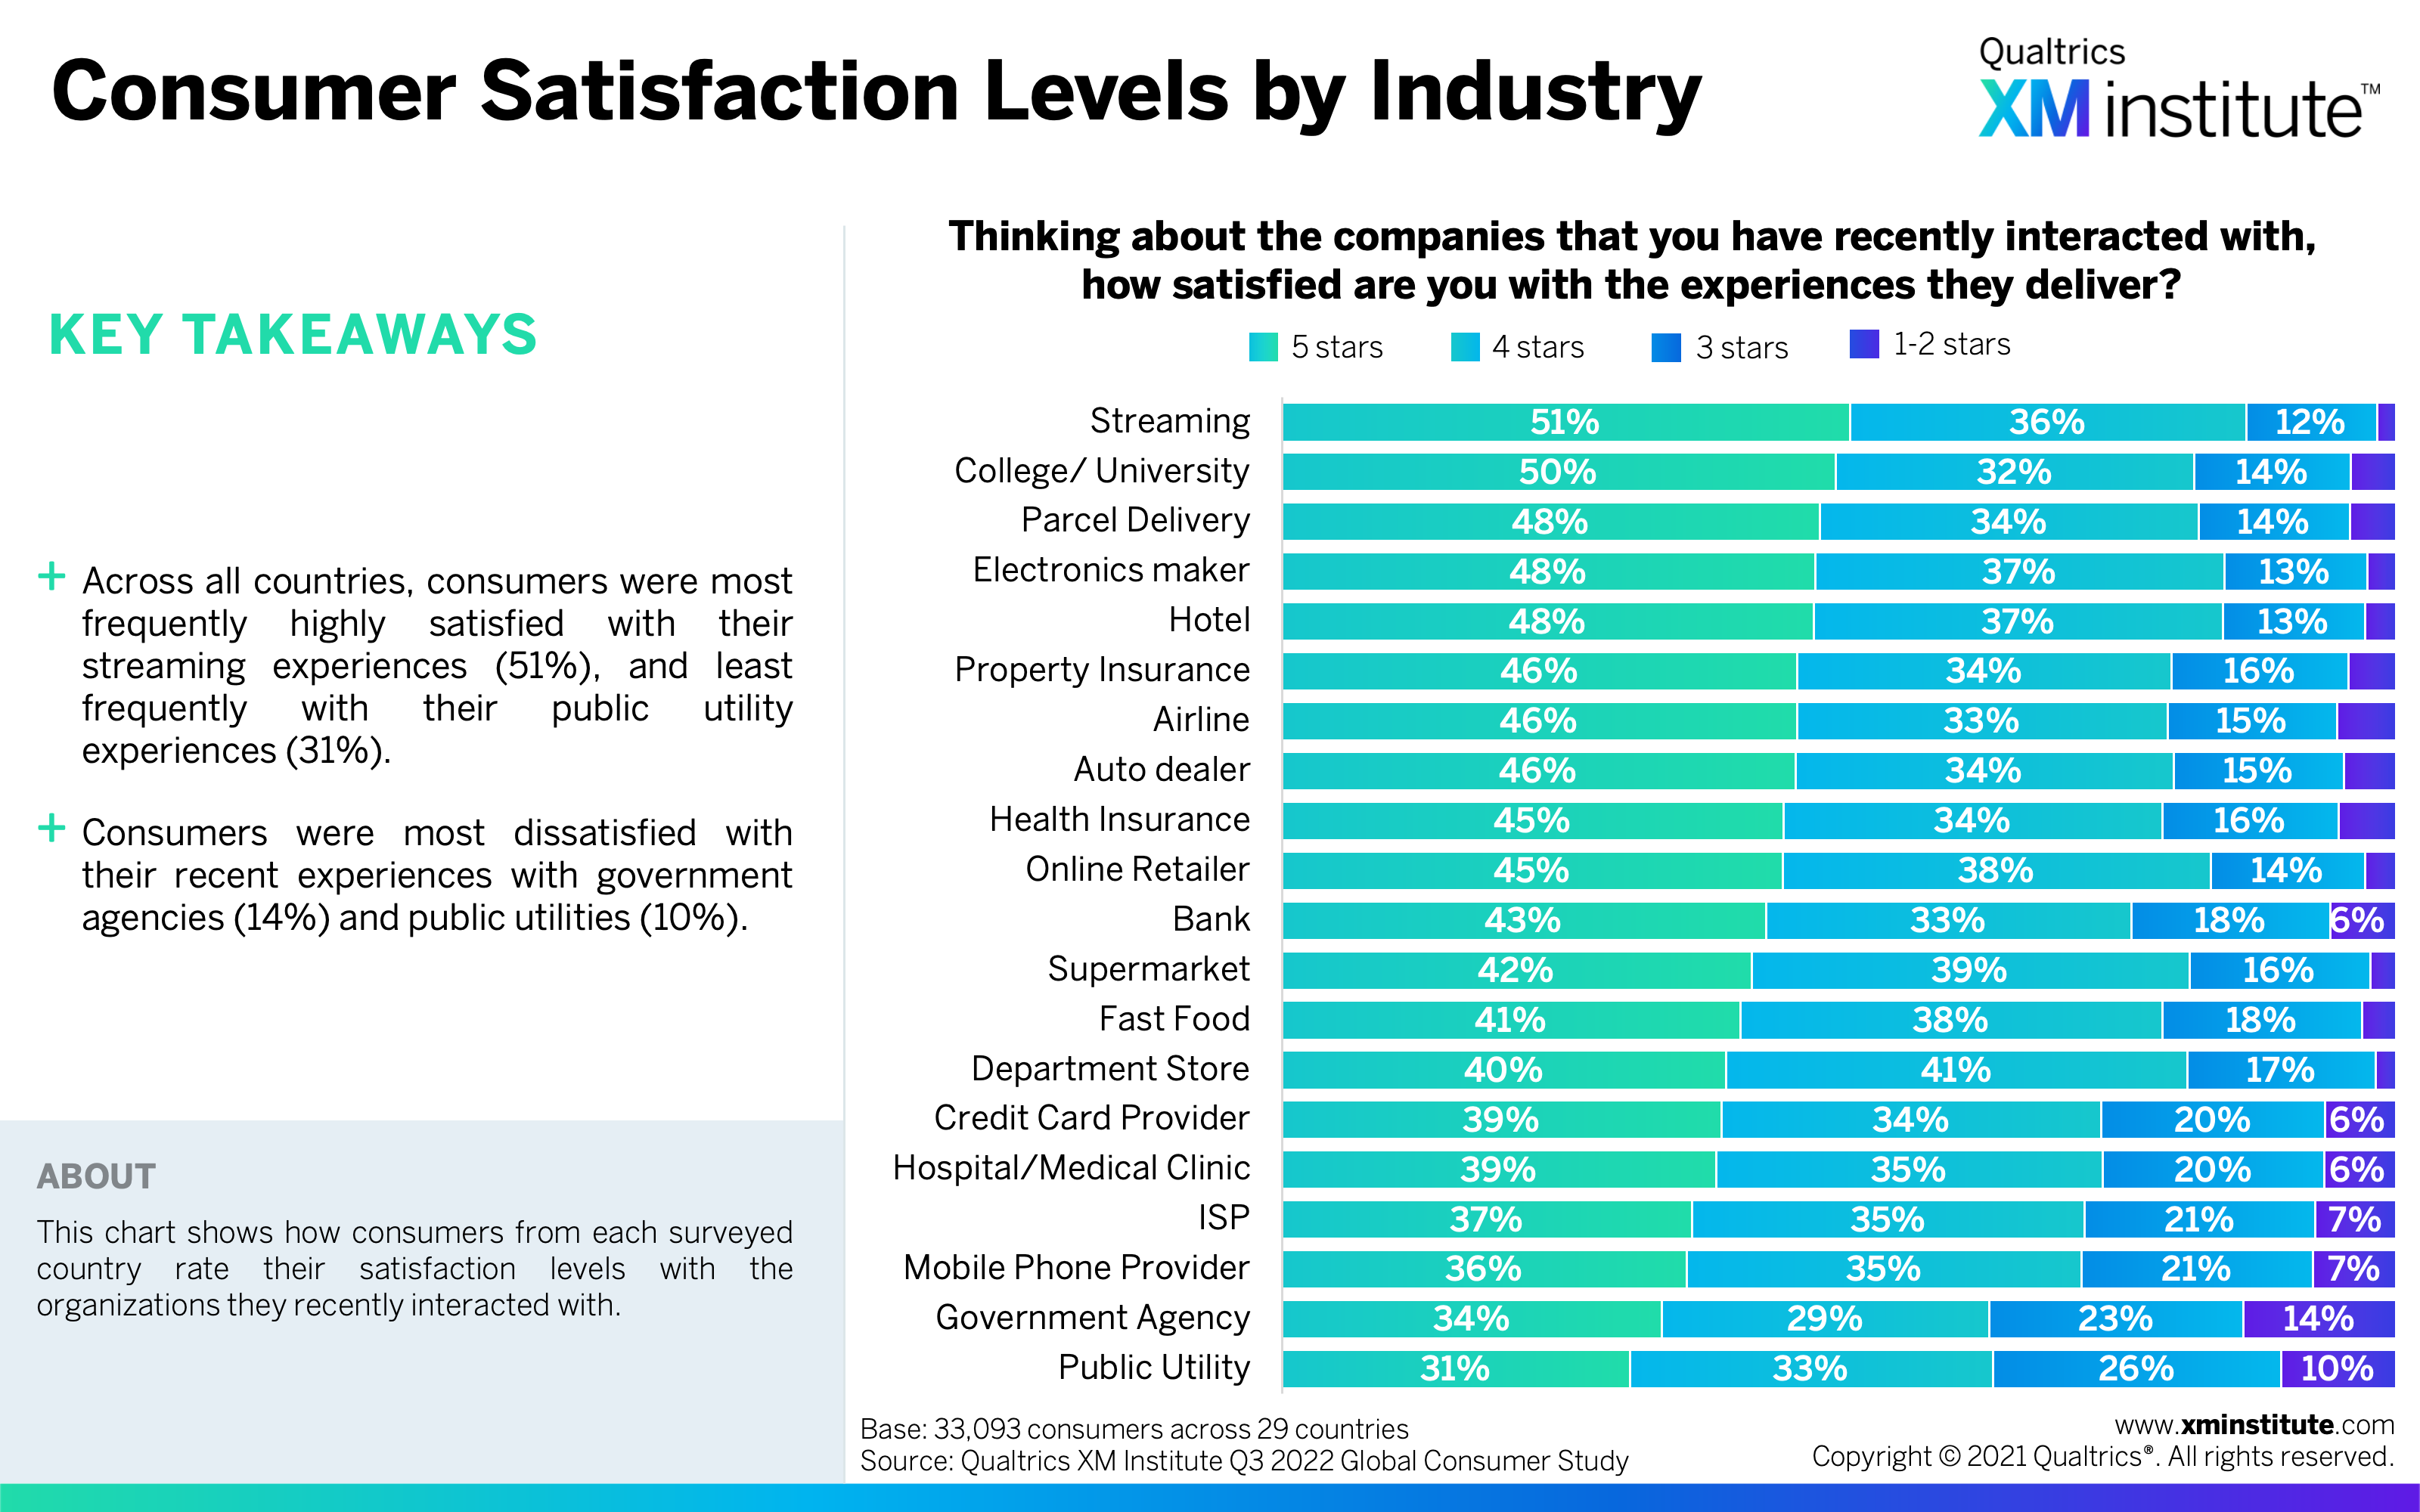
- Satisfaction stayed low for government agencies and public utilities. Consumers were least frequently satisfied by their government agency and public utility experiences in 2022. In fact, they were most frequently dissatisfied with these industries. With an under 1 %-point increase in satisfaction for government agencies and a drop in satisfaction for public utilities, government agencies and public utilities maintained their low standing from the previous year.
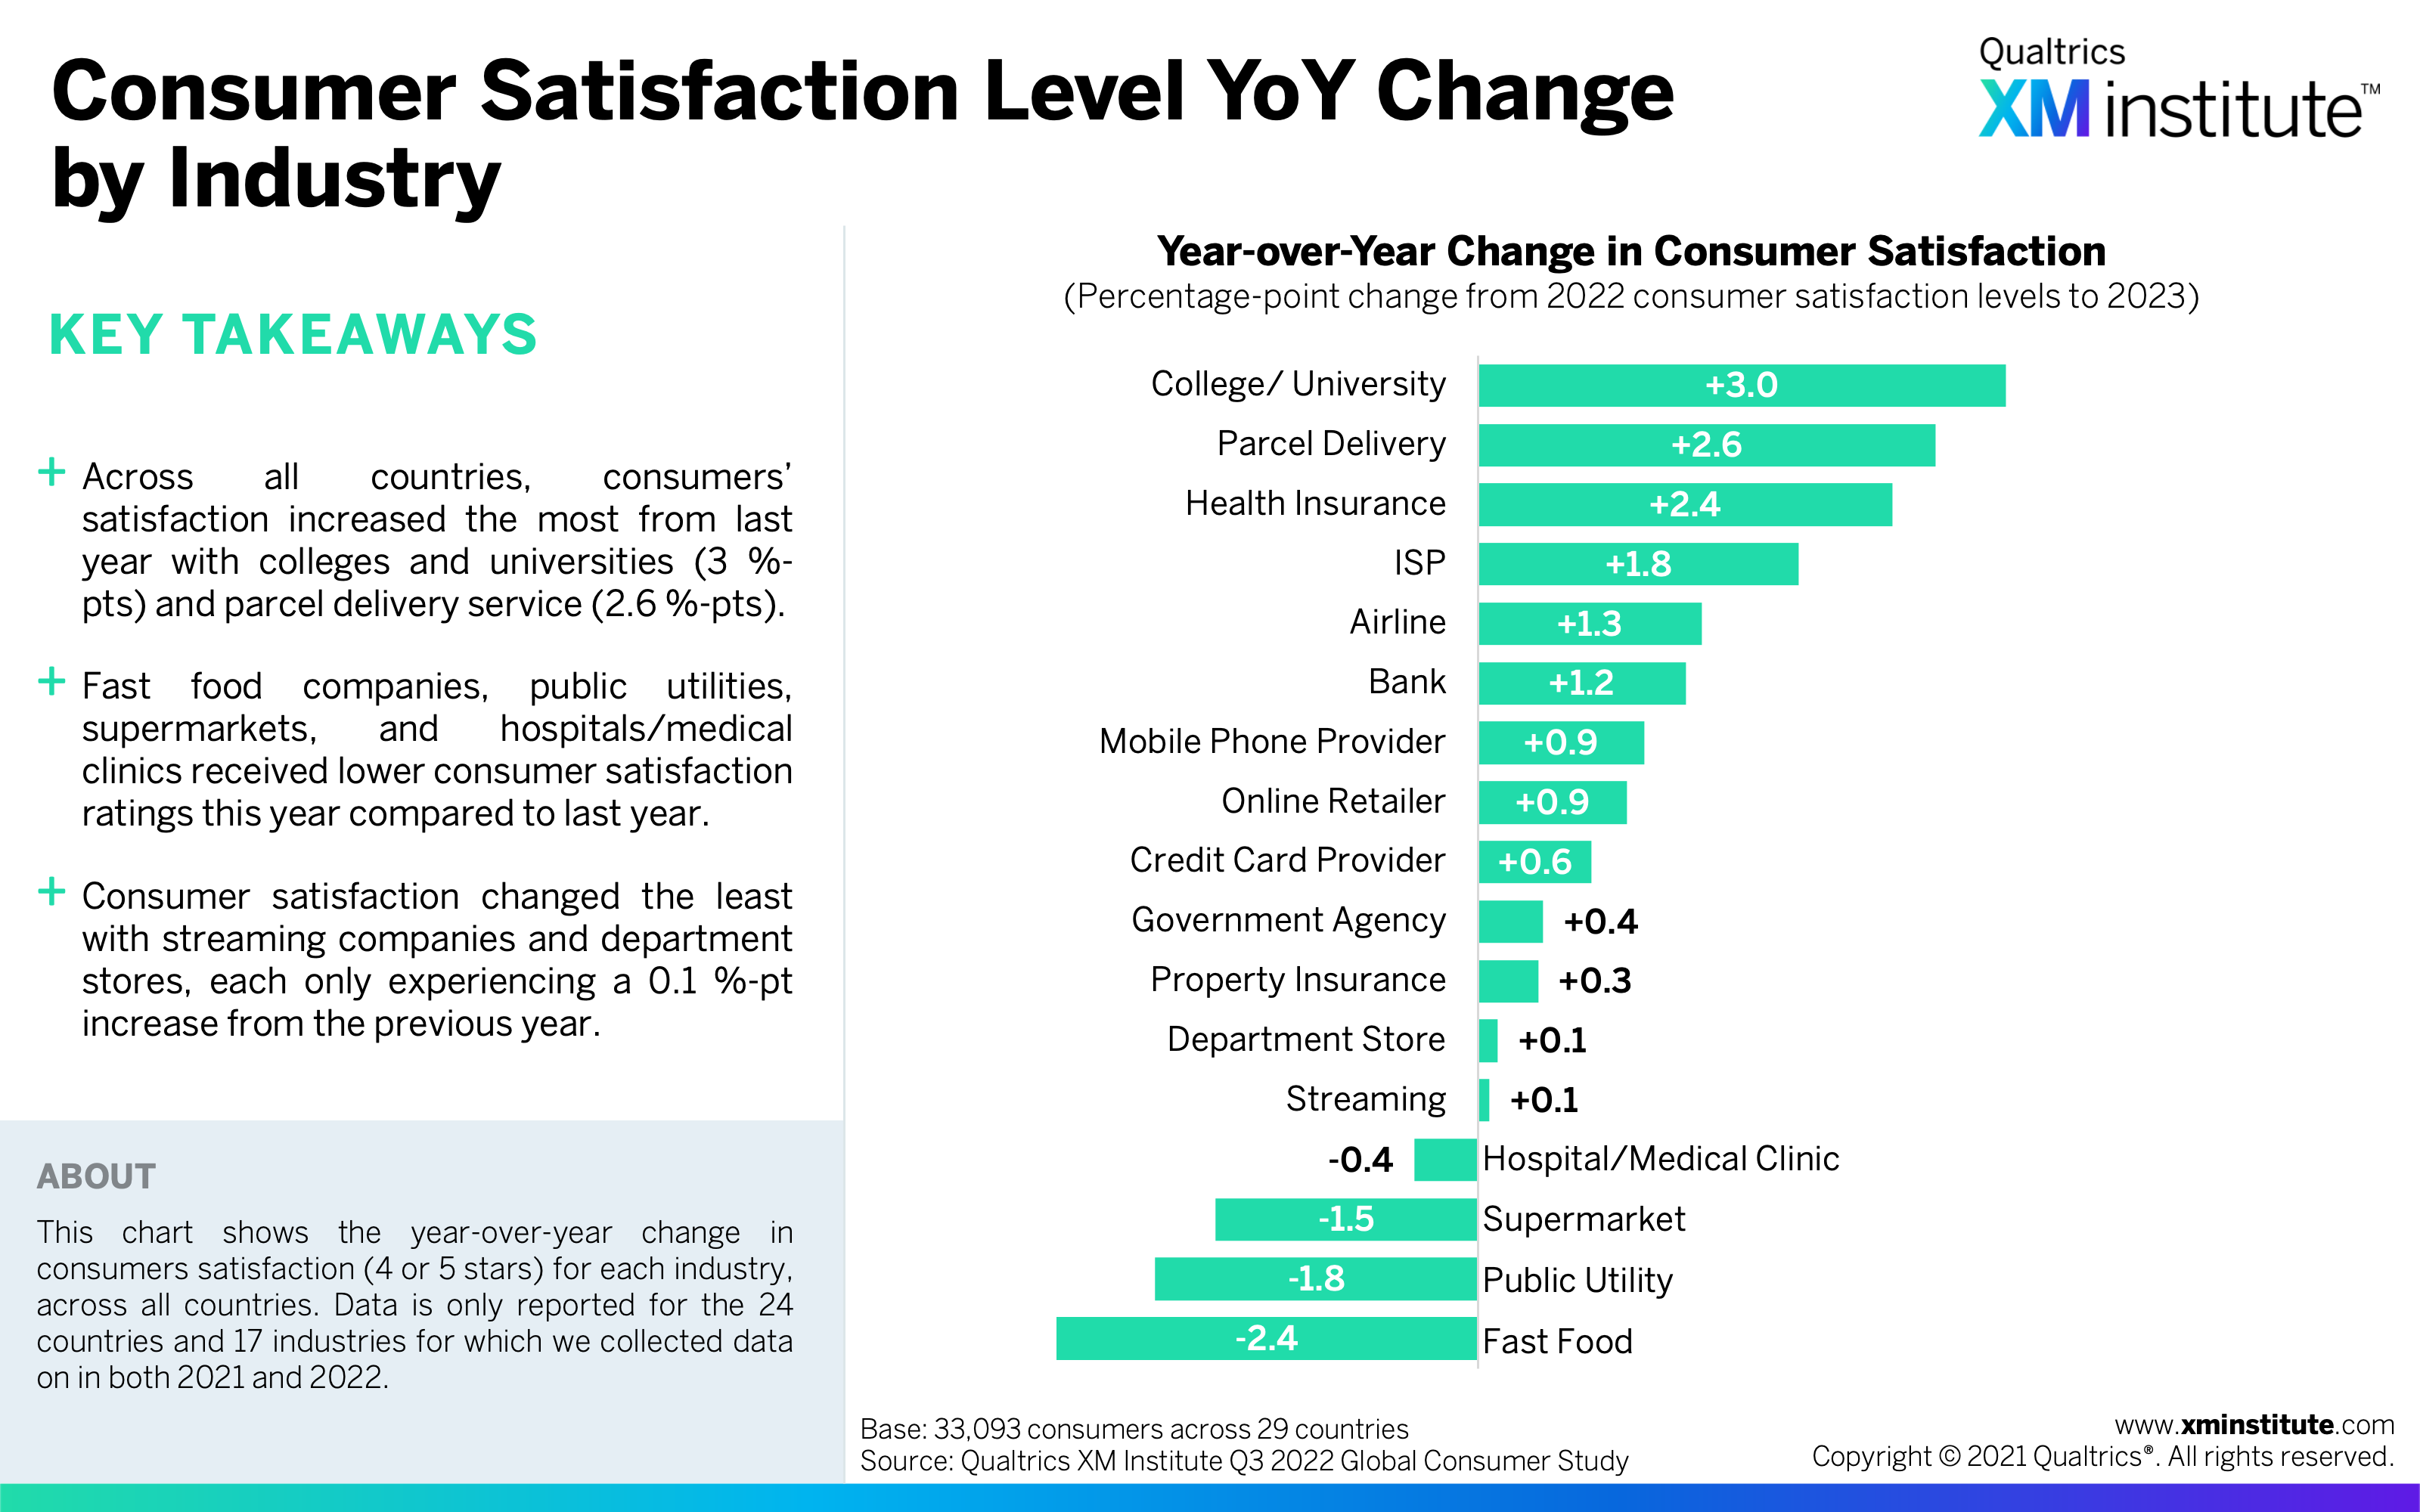
- Higher education received the greatest increases in satisfaction and loyalty. Out of 17 industries, consumer satisfaction increased the most (3 %-points) for colleges and universities. Coinciding with this rise in favor, consumers are 5.1 %-points more likely to rebuy, 4 %-points more likely to trust, and 5 %-points more likely to recommend their college or university in 2022 than they were in 2021.
Figures
Here are the figures in this Data Snapshot:
- Consumer Satisfaction Levels by Country (see Figure 1)
- Consumer Satisfaction Level YoY Change by Country (see Figure 2)
- Consumer Satisfaction Level by Industry (see Figure 3)
- Consumer Satisfaction Level YoY Change by Industry (see Figure 4)
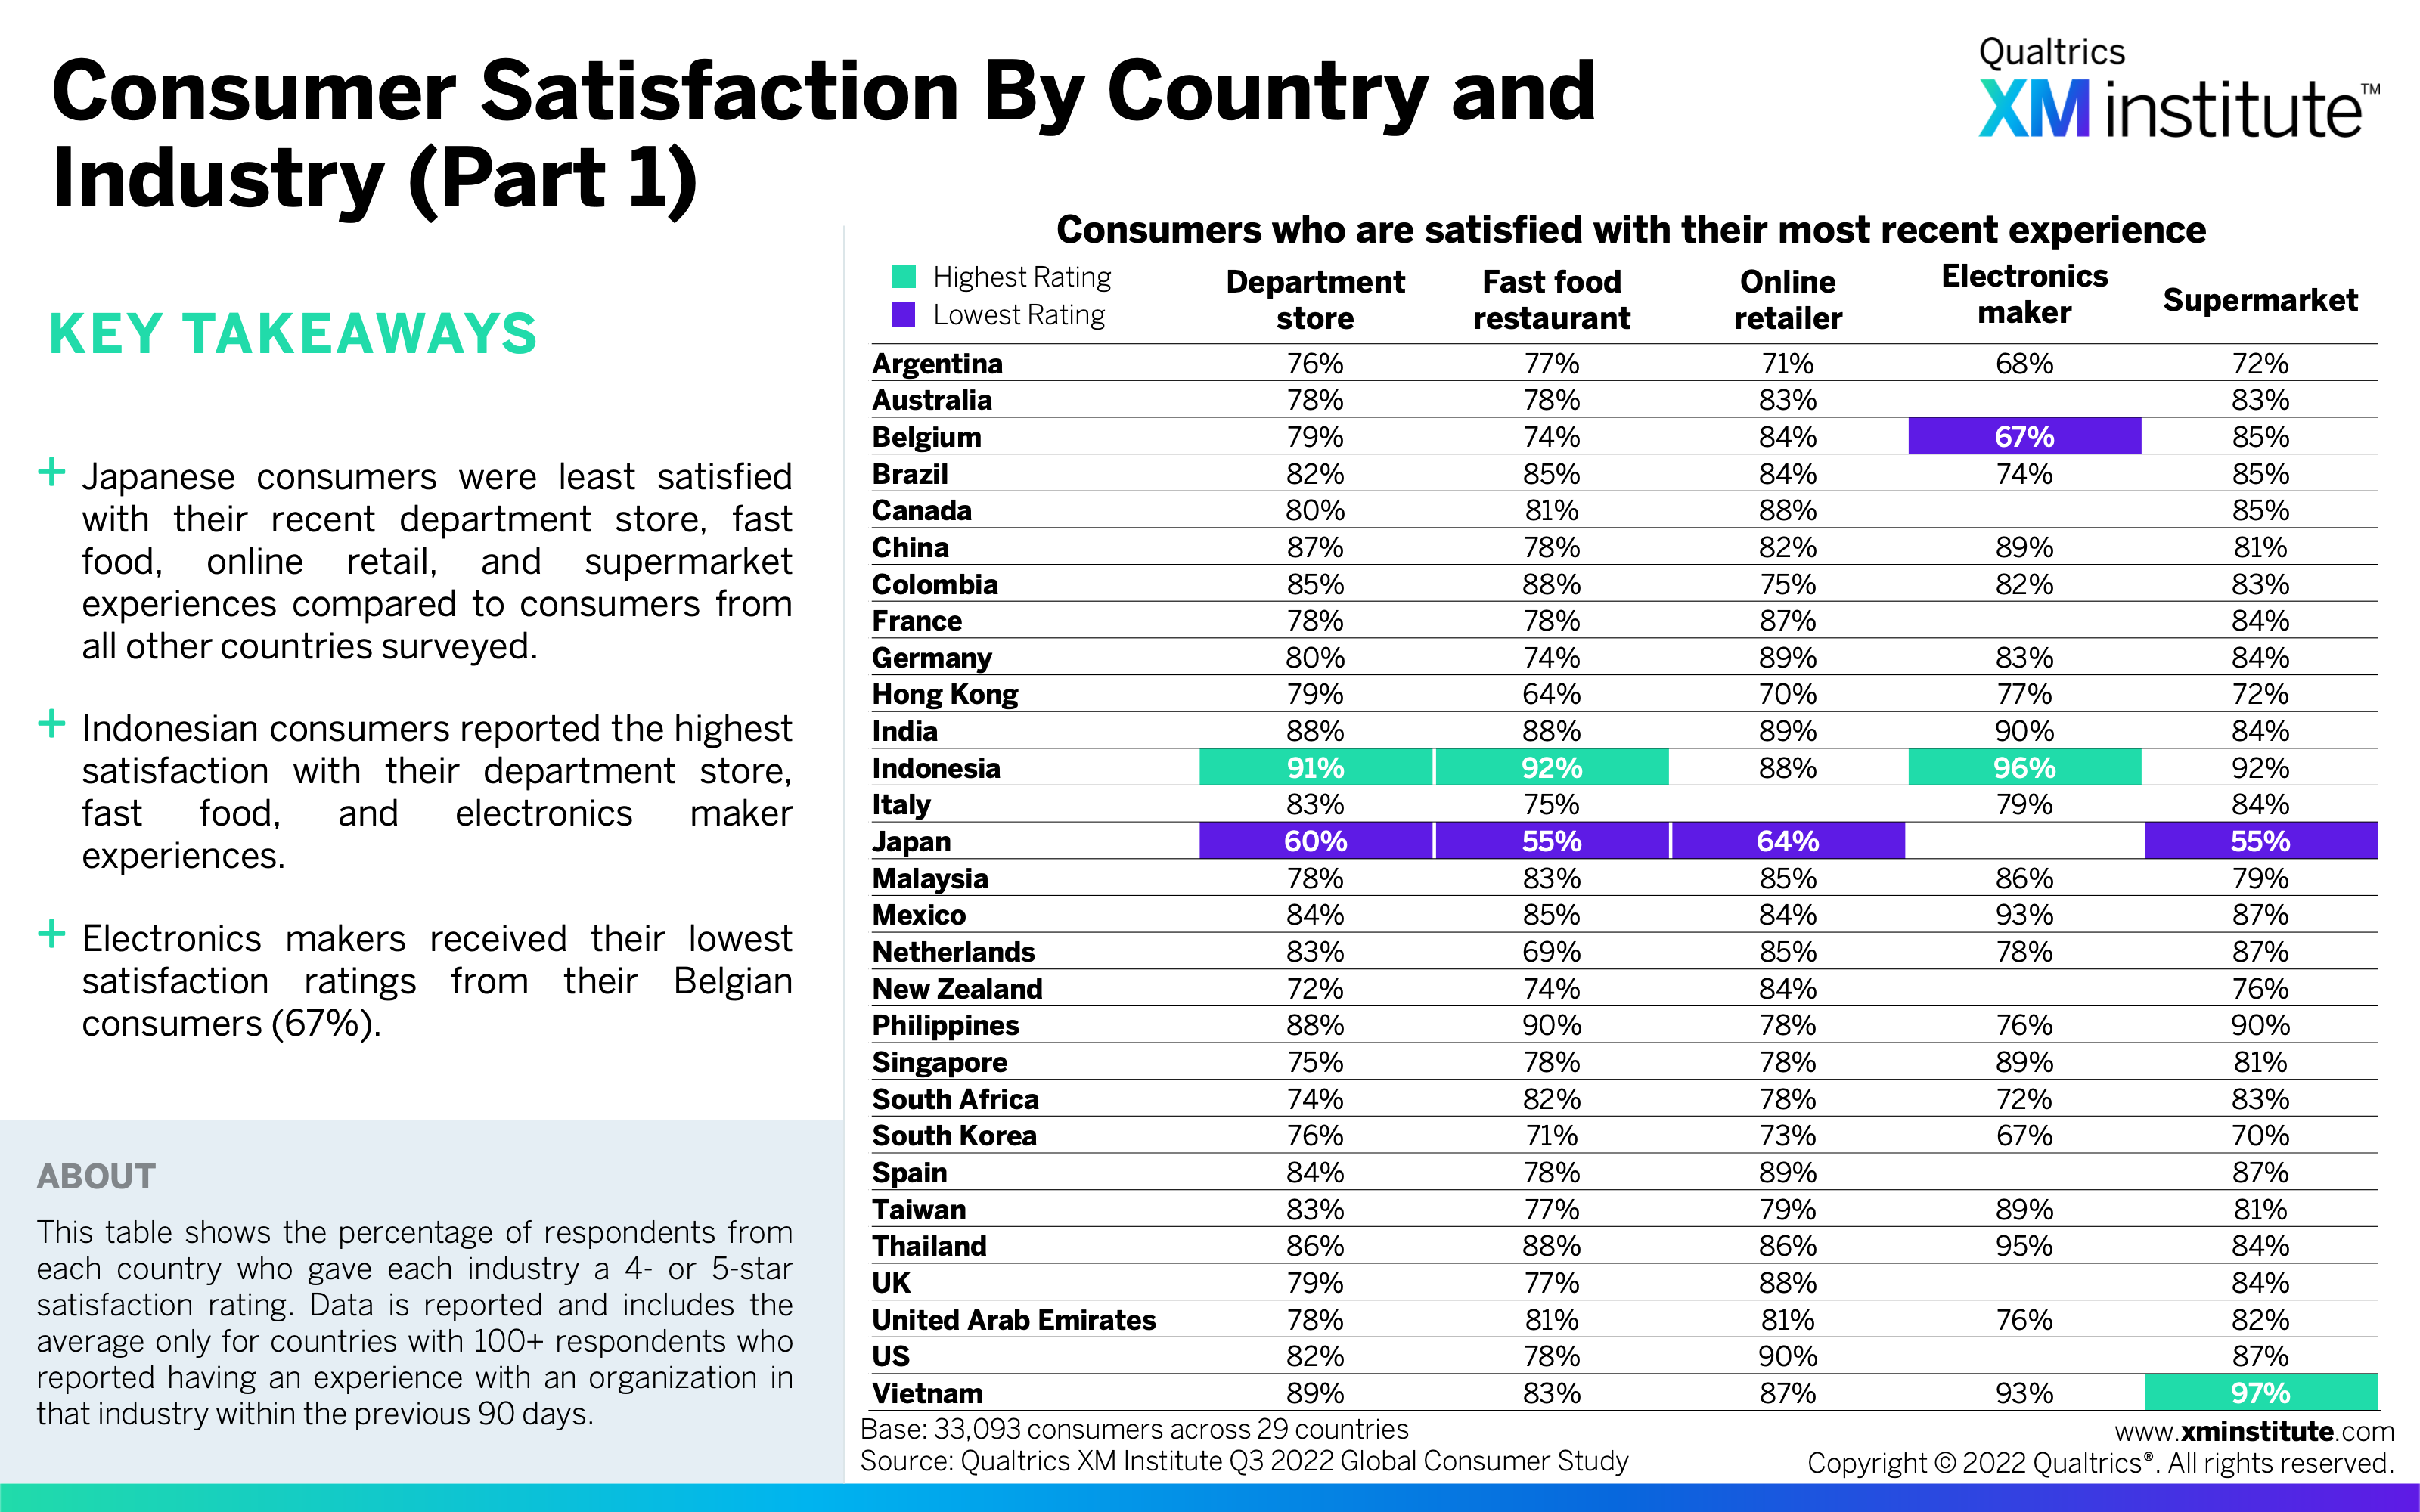
- Consumer Satisfaction by Country and Industry (Part 1) (see Figure 5)
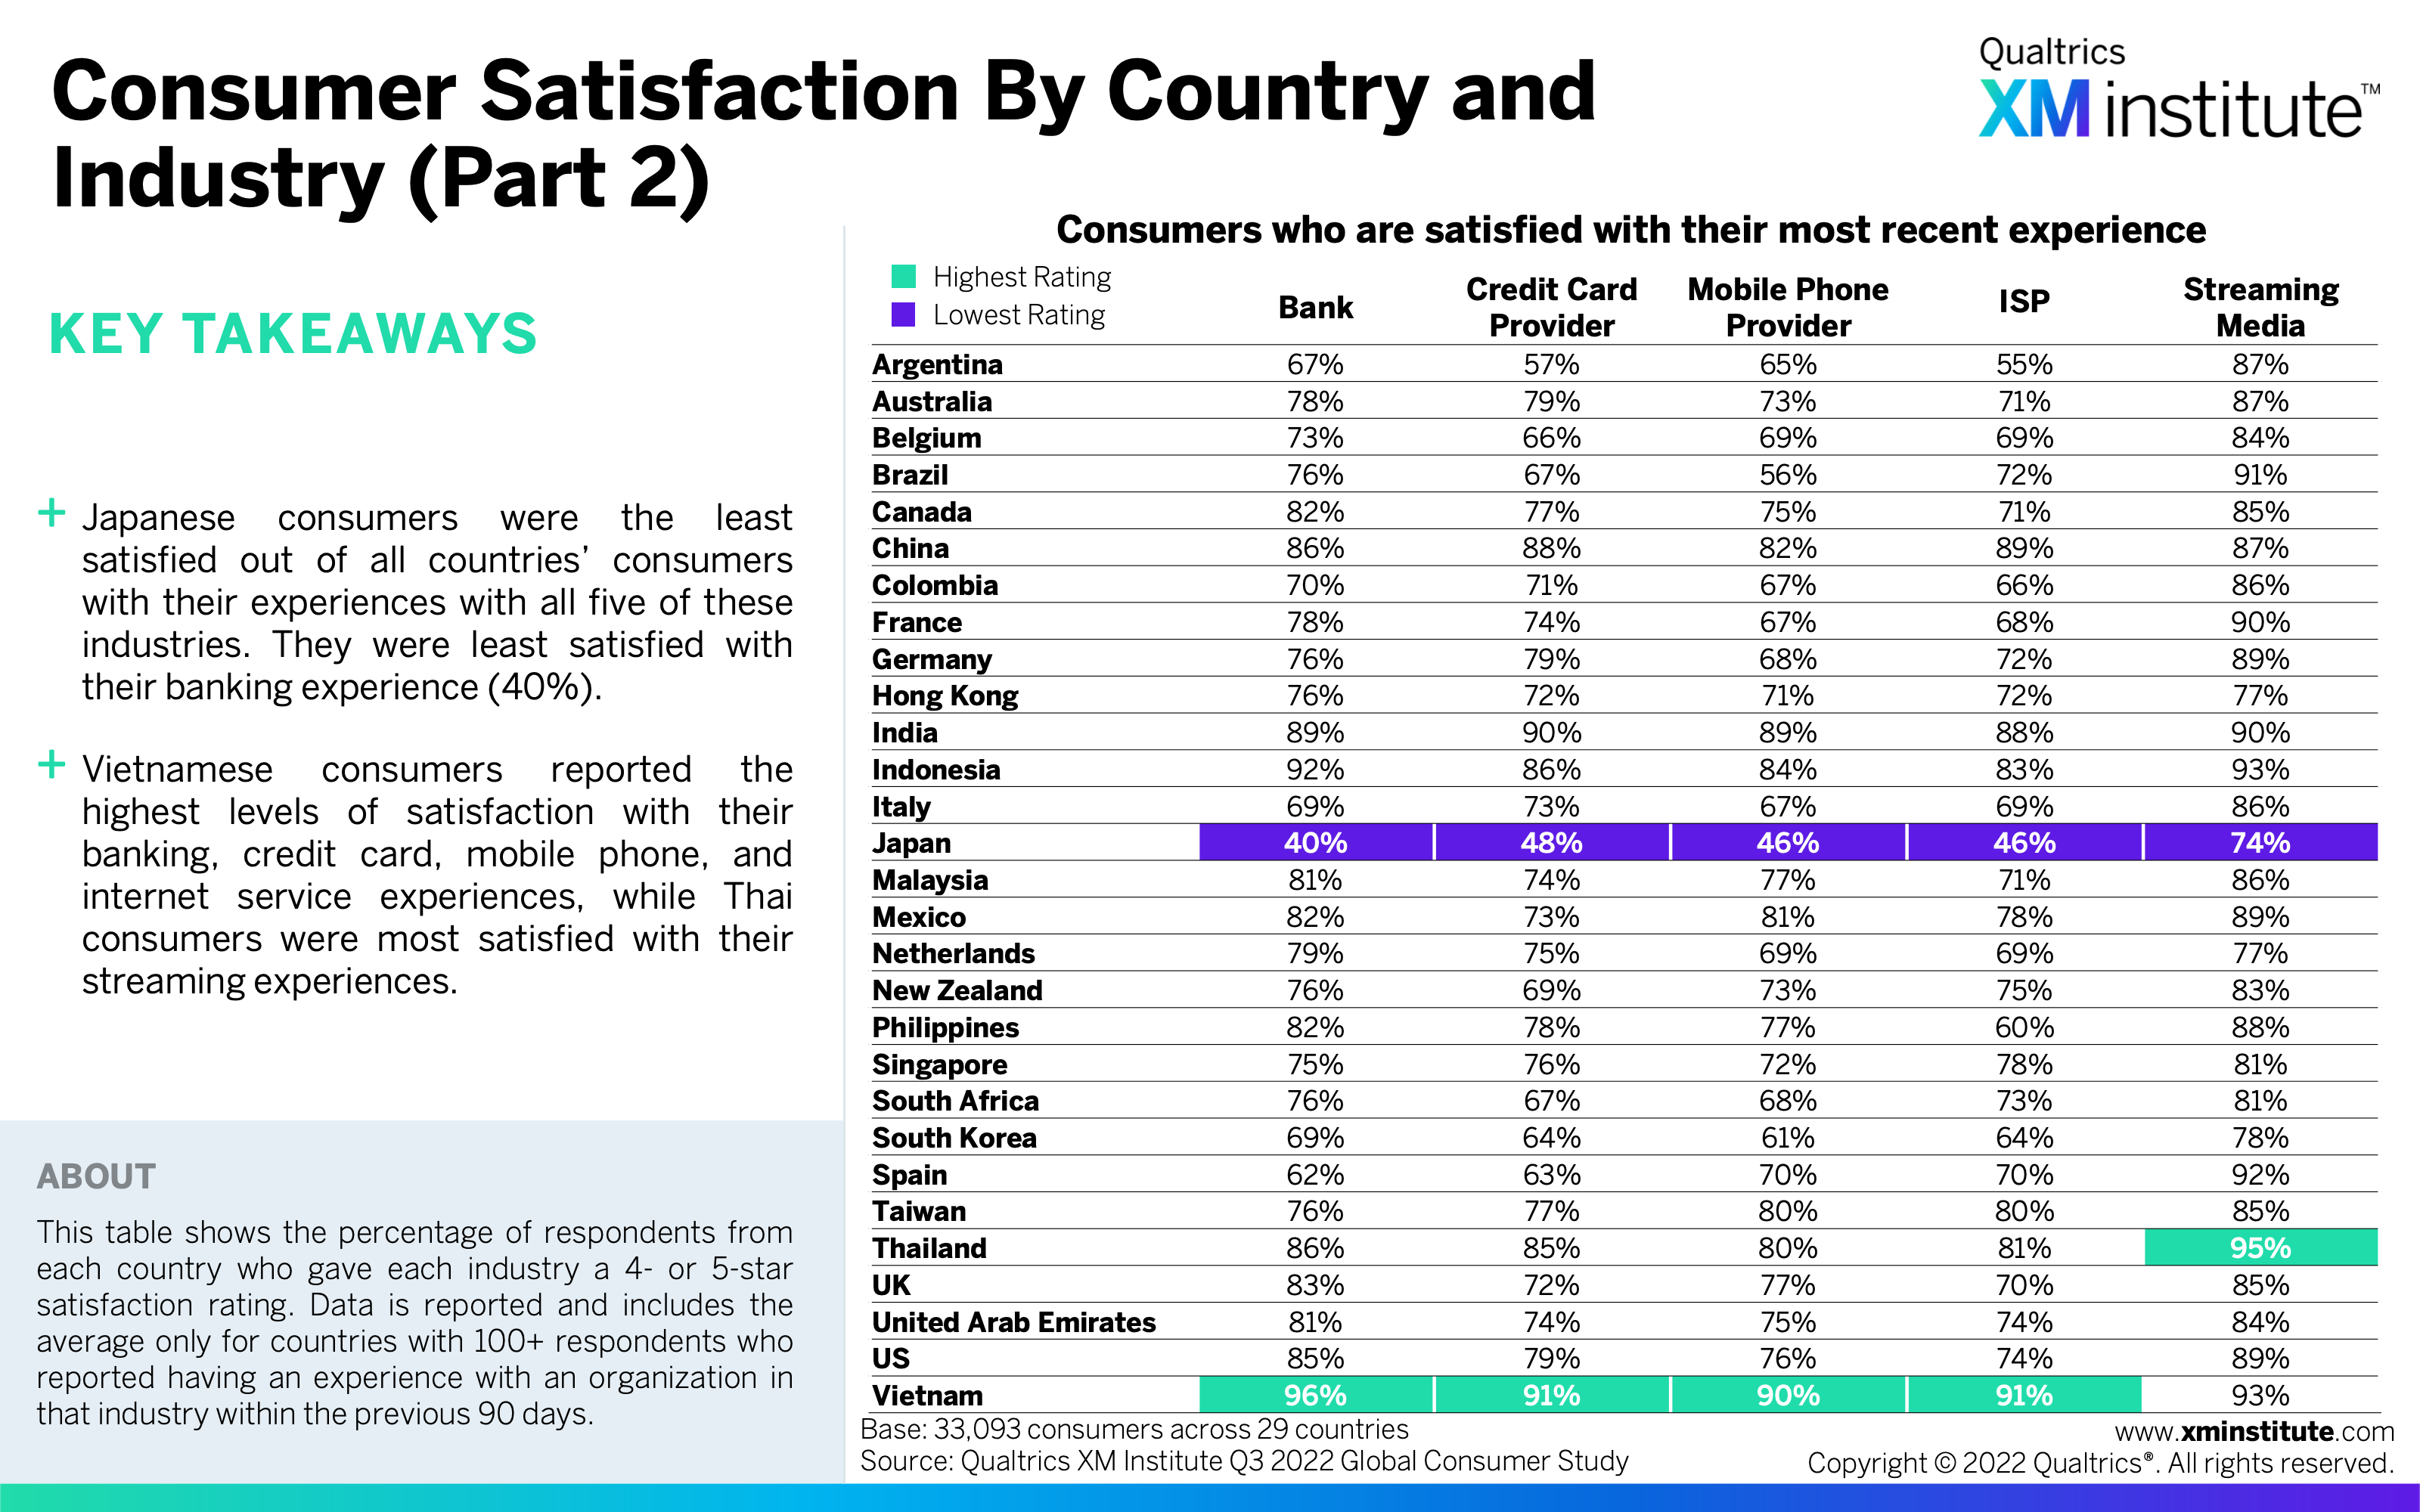
- Consumer Satisfaction by Country and Industry (Part 2) (see Figure 6)
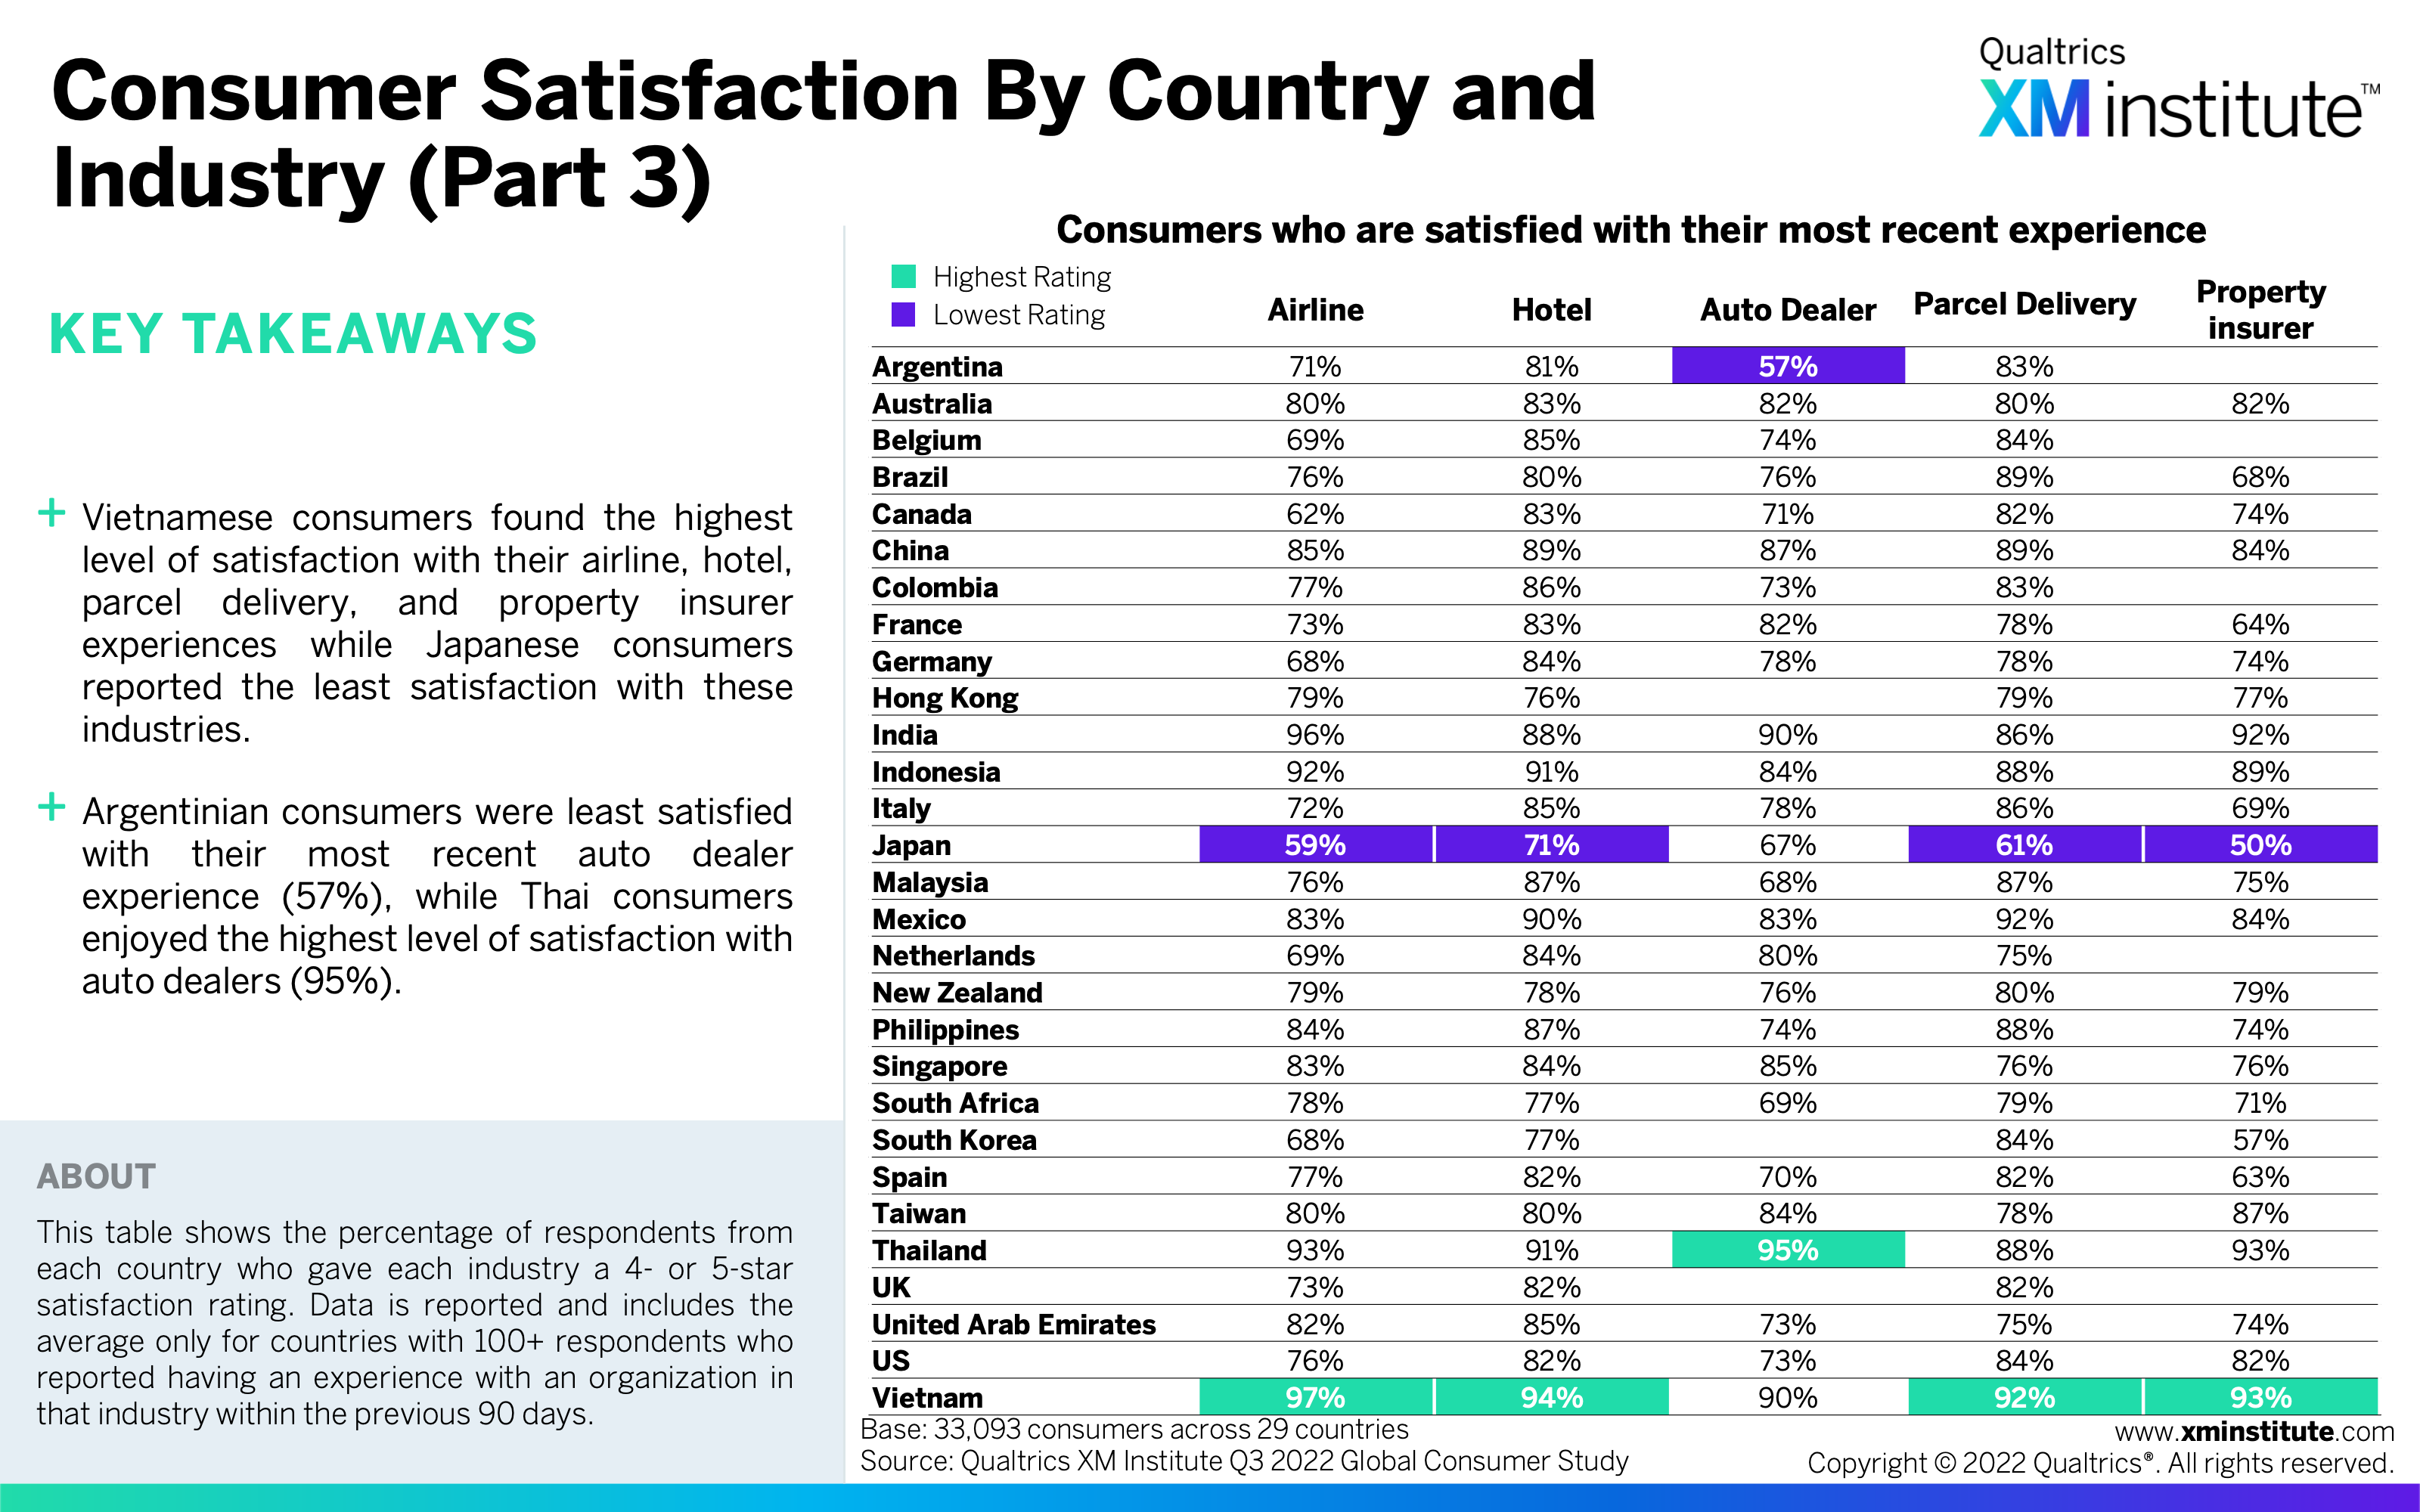
- Consumer Satisfaction by Country and Industry (Part 3) (see Figure 7)
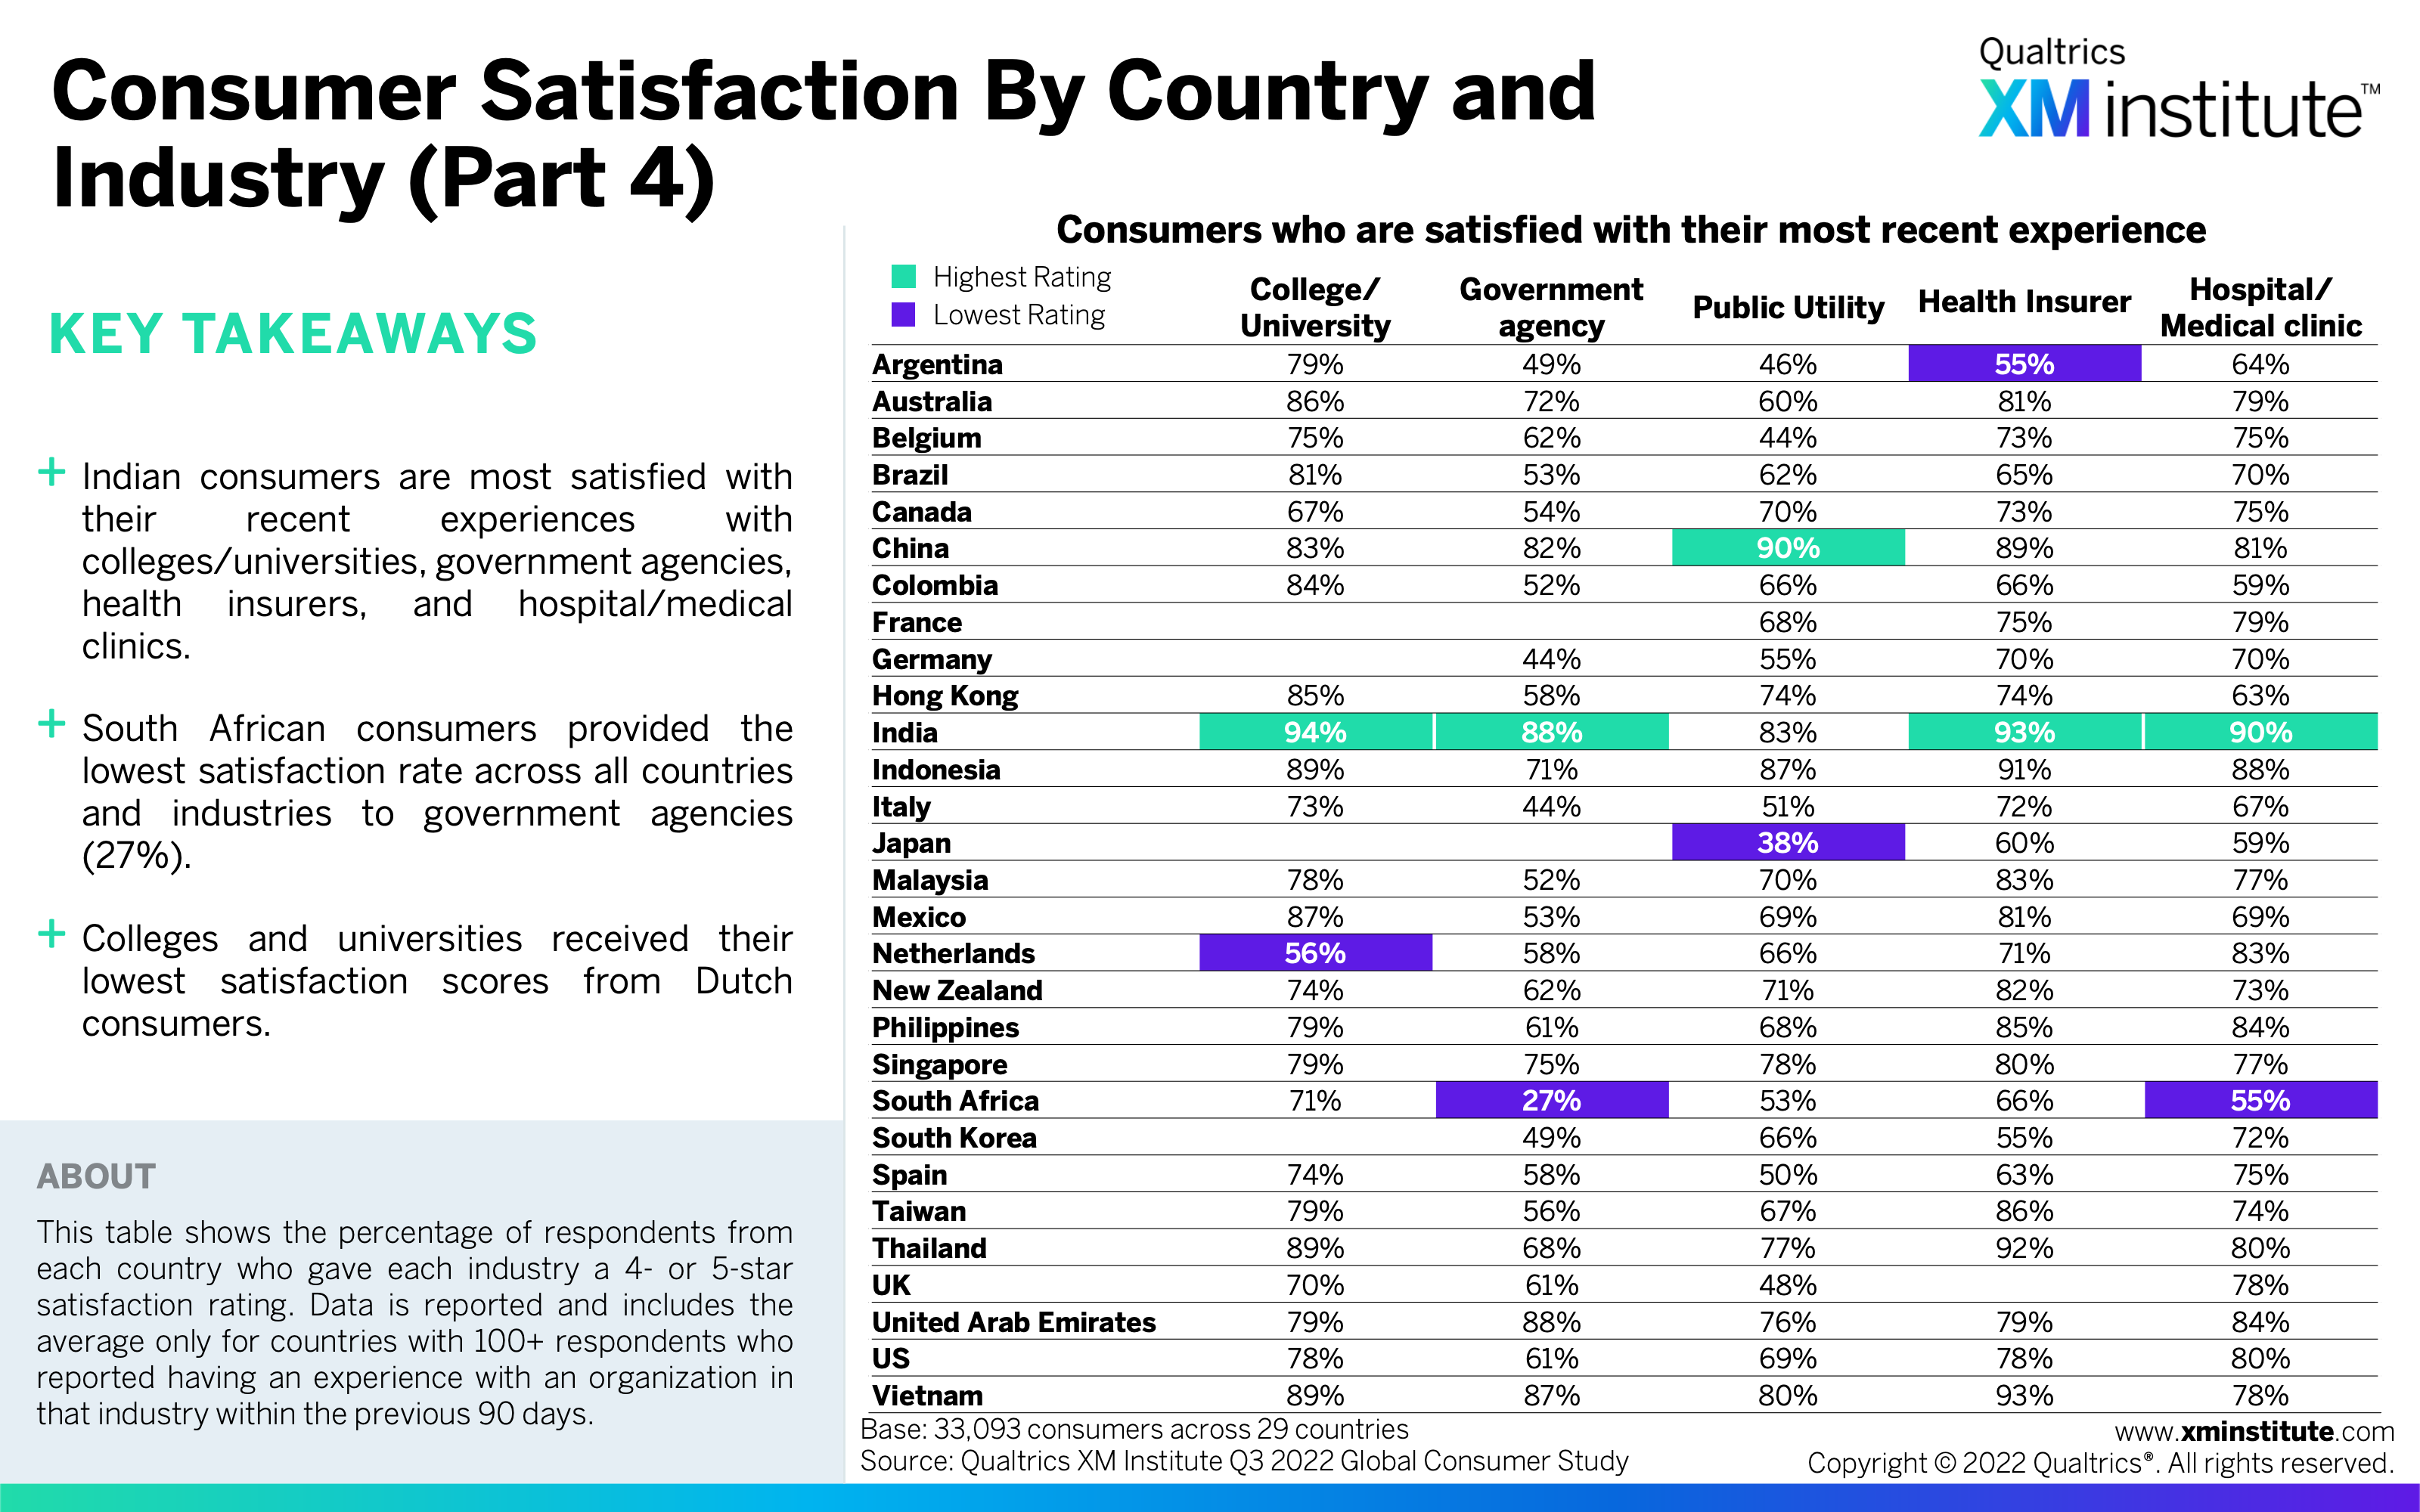
- Consumer Satisfaction by Country and Industry (Part 4) (see Figure 8)
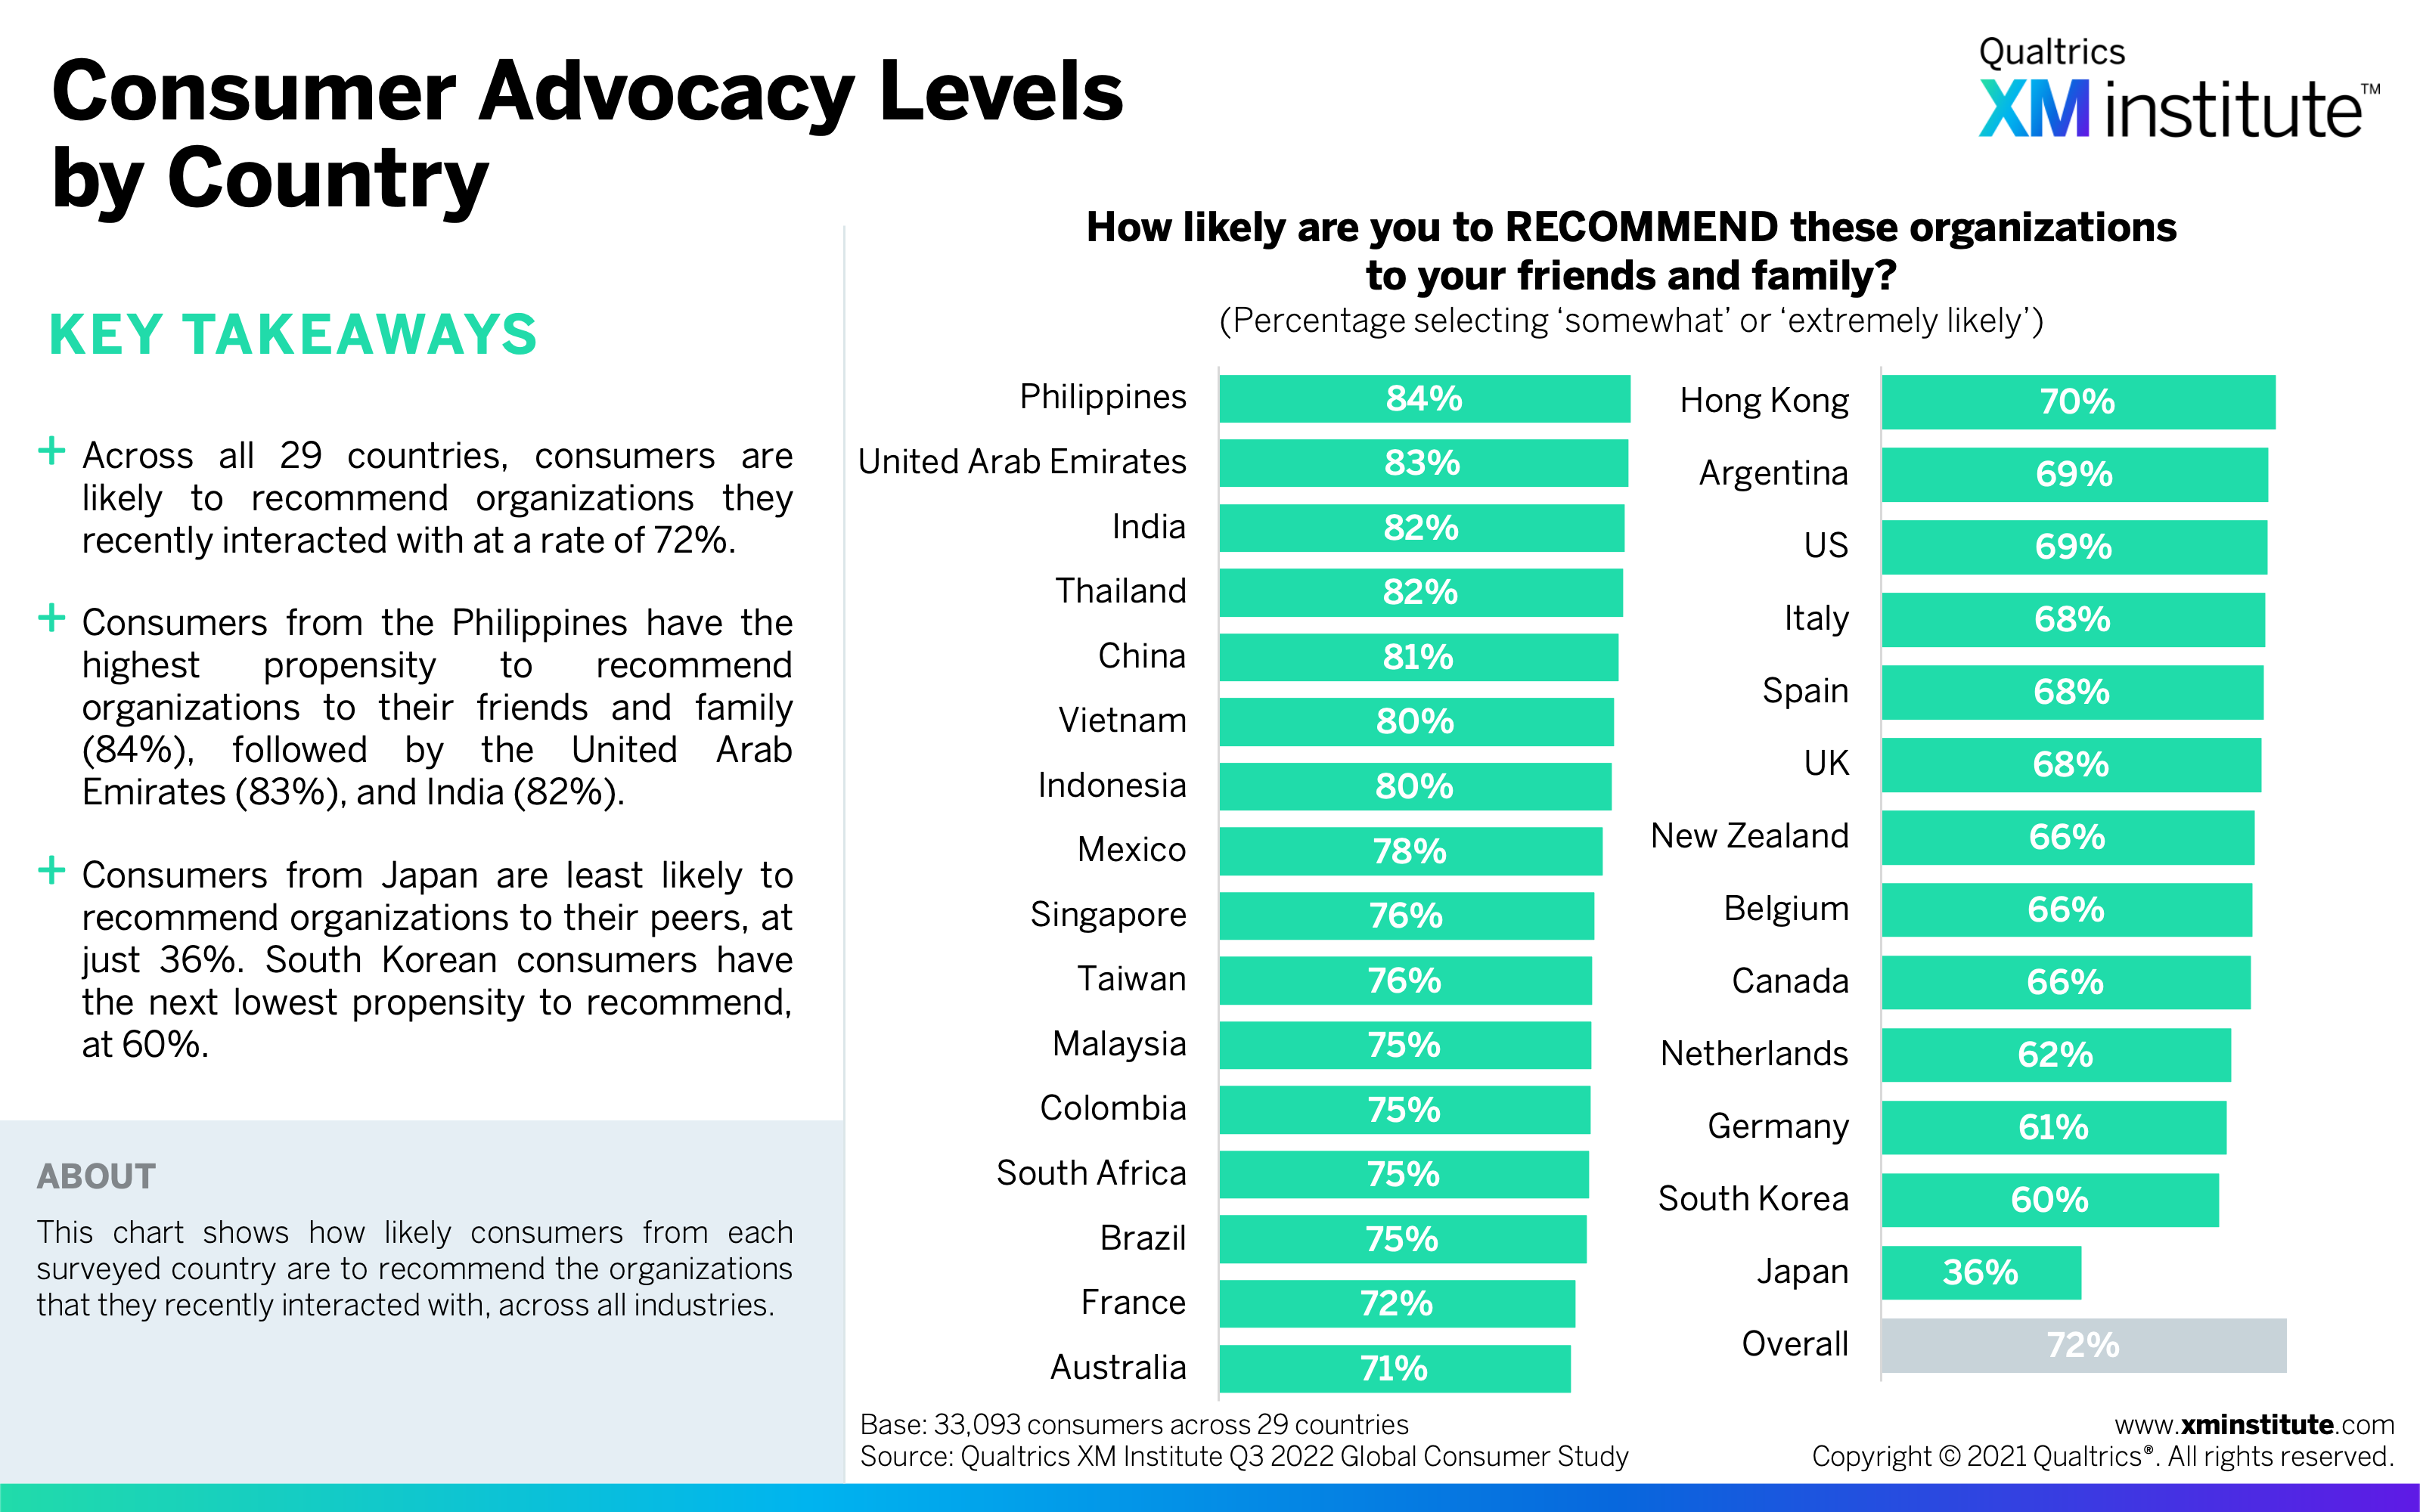
- Consumer Advocacy Levels by Country (see Figure 9)
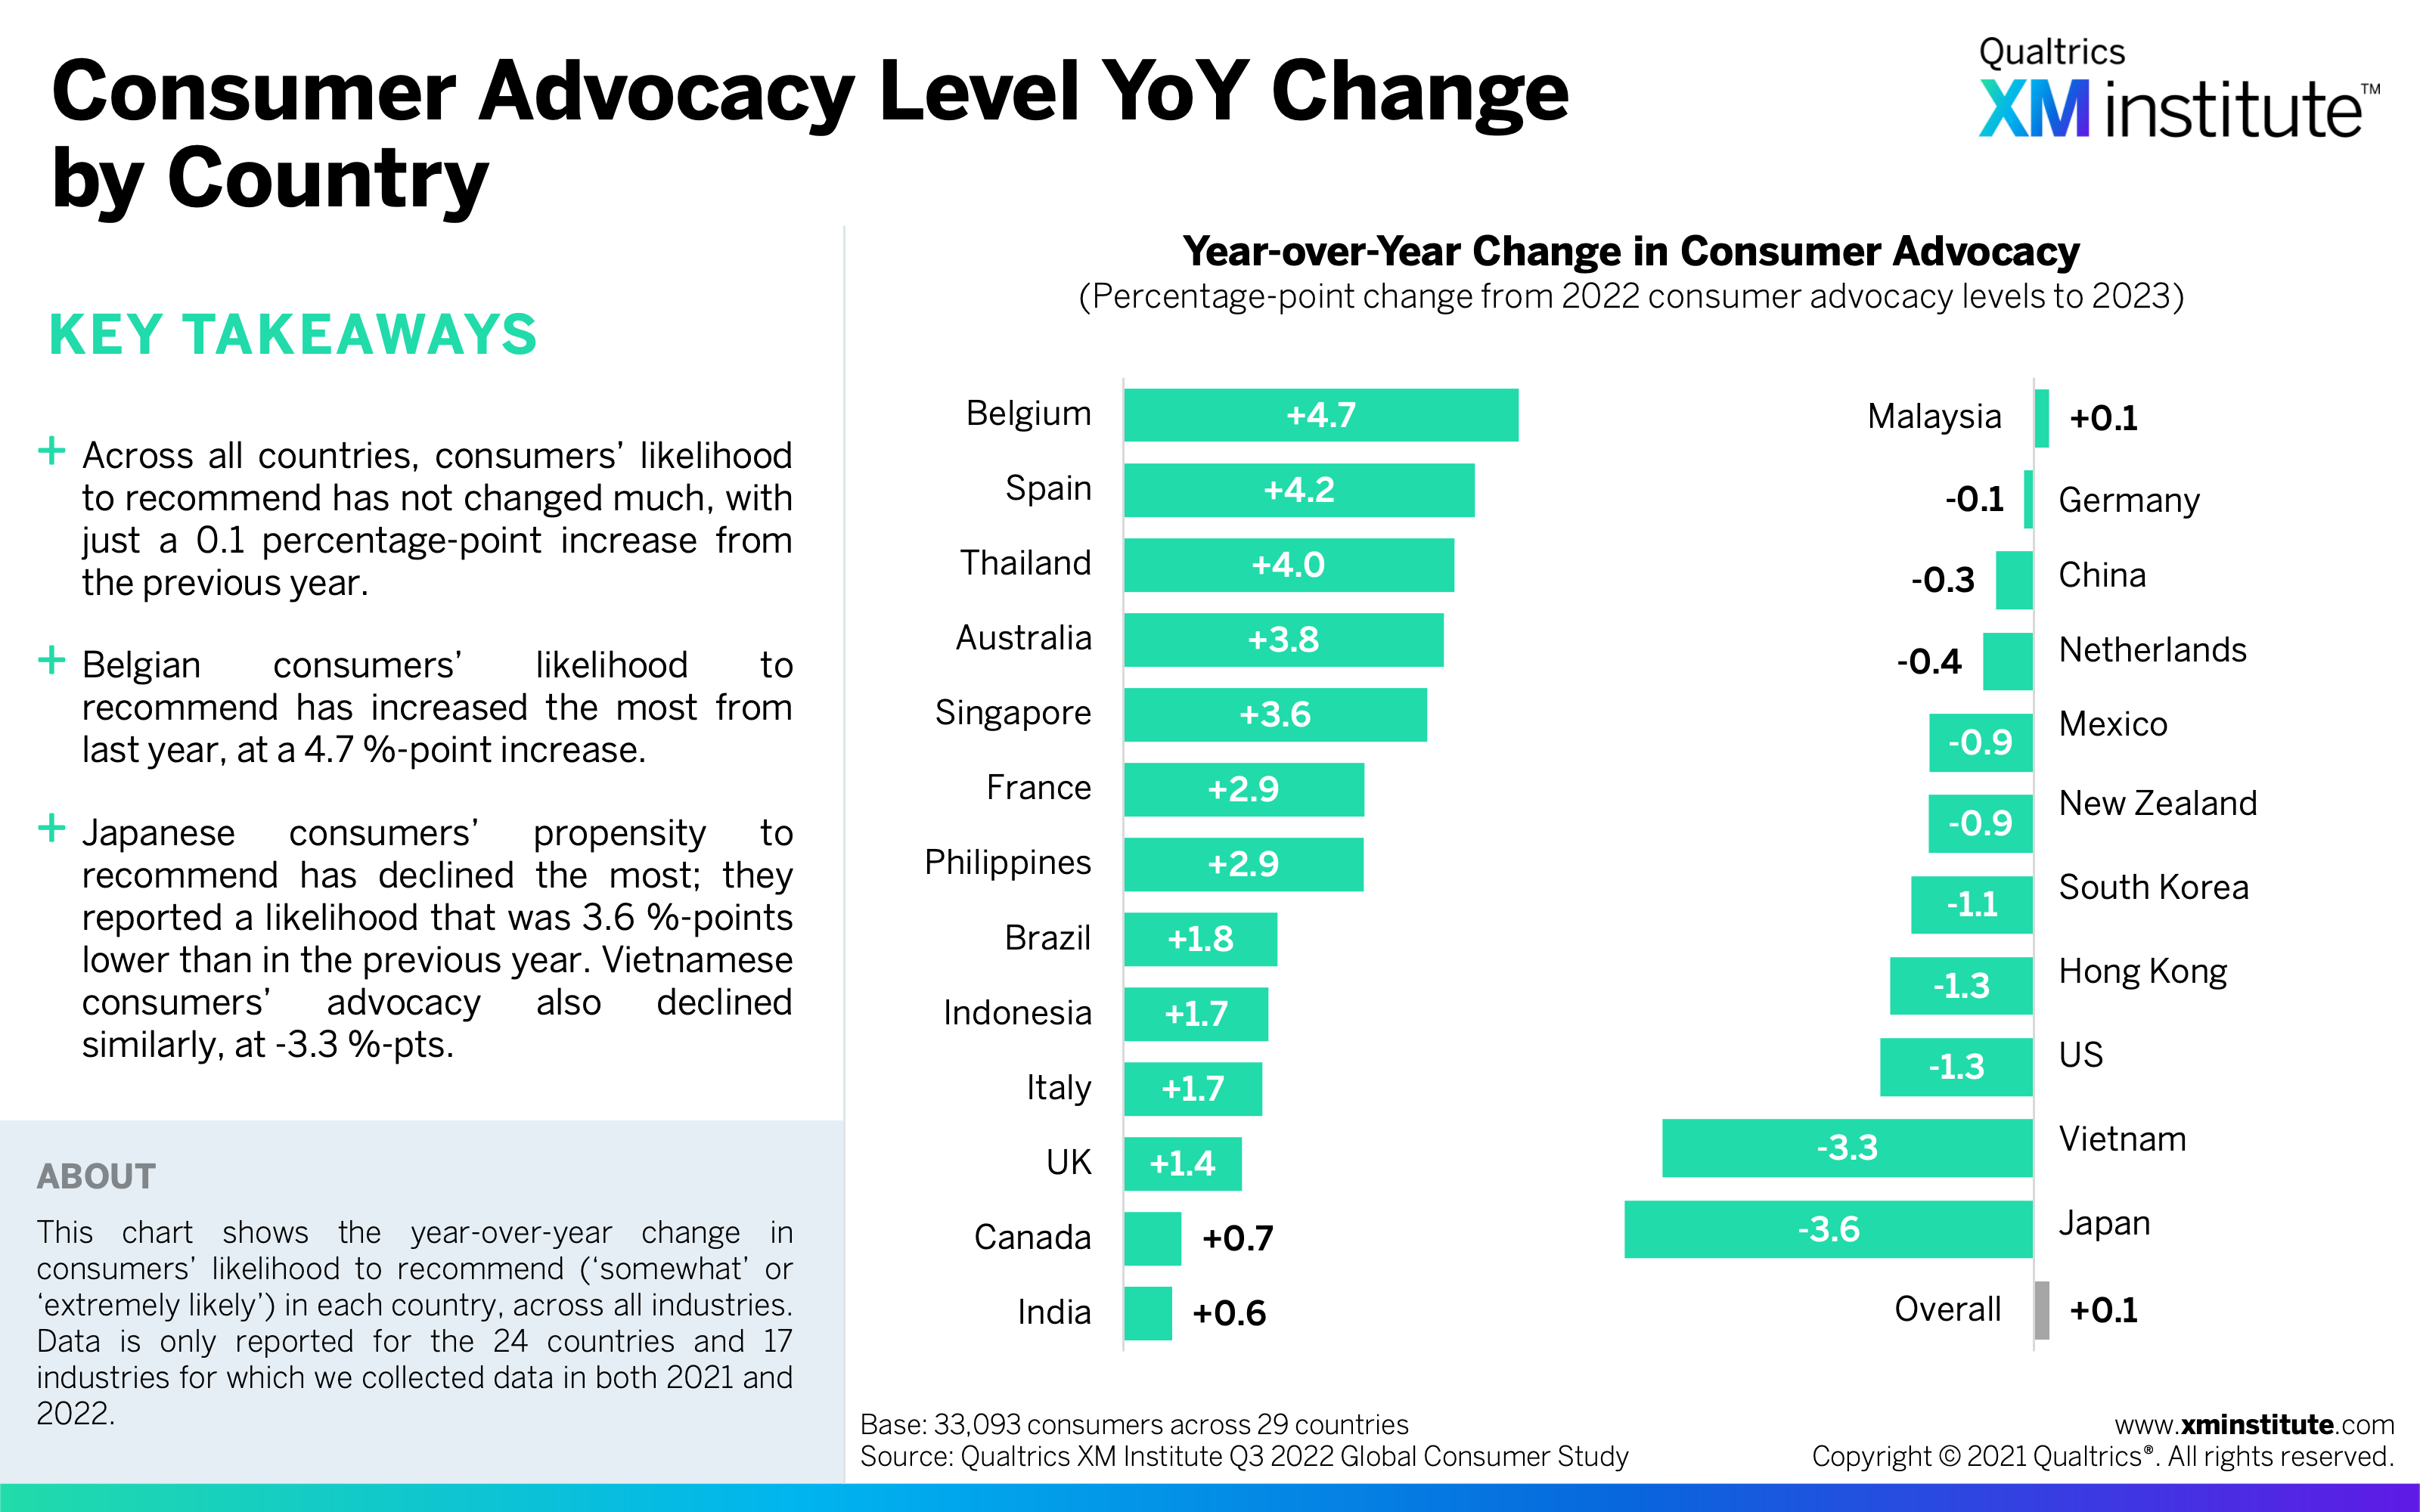
- Consumer Advocacy Level YoY Change by Country (see Figure 10)
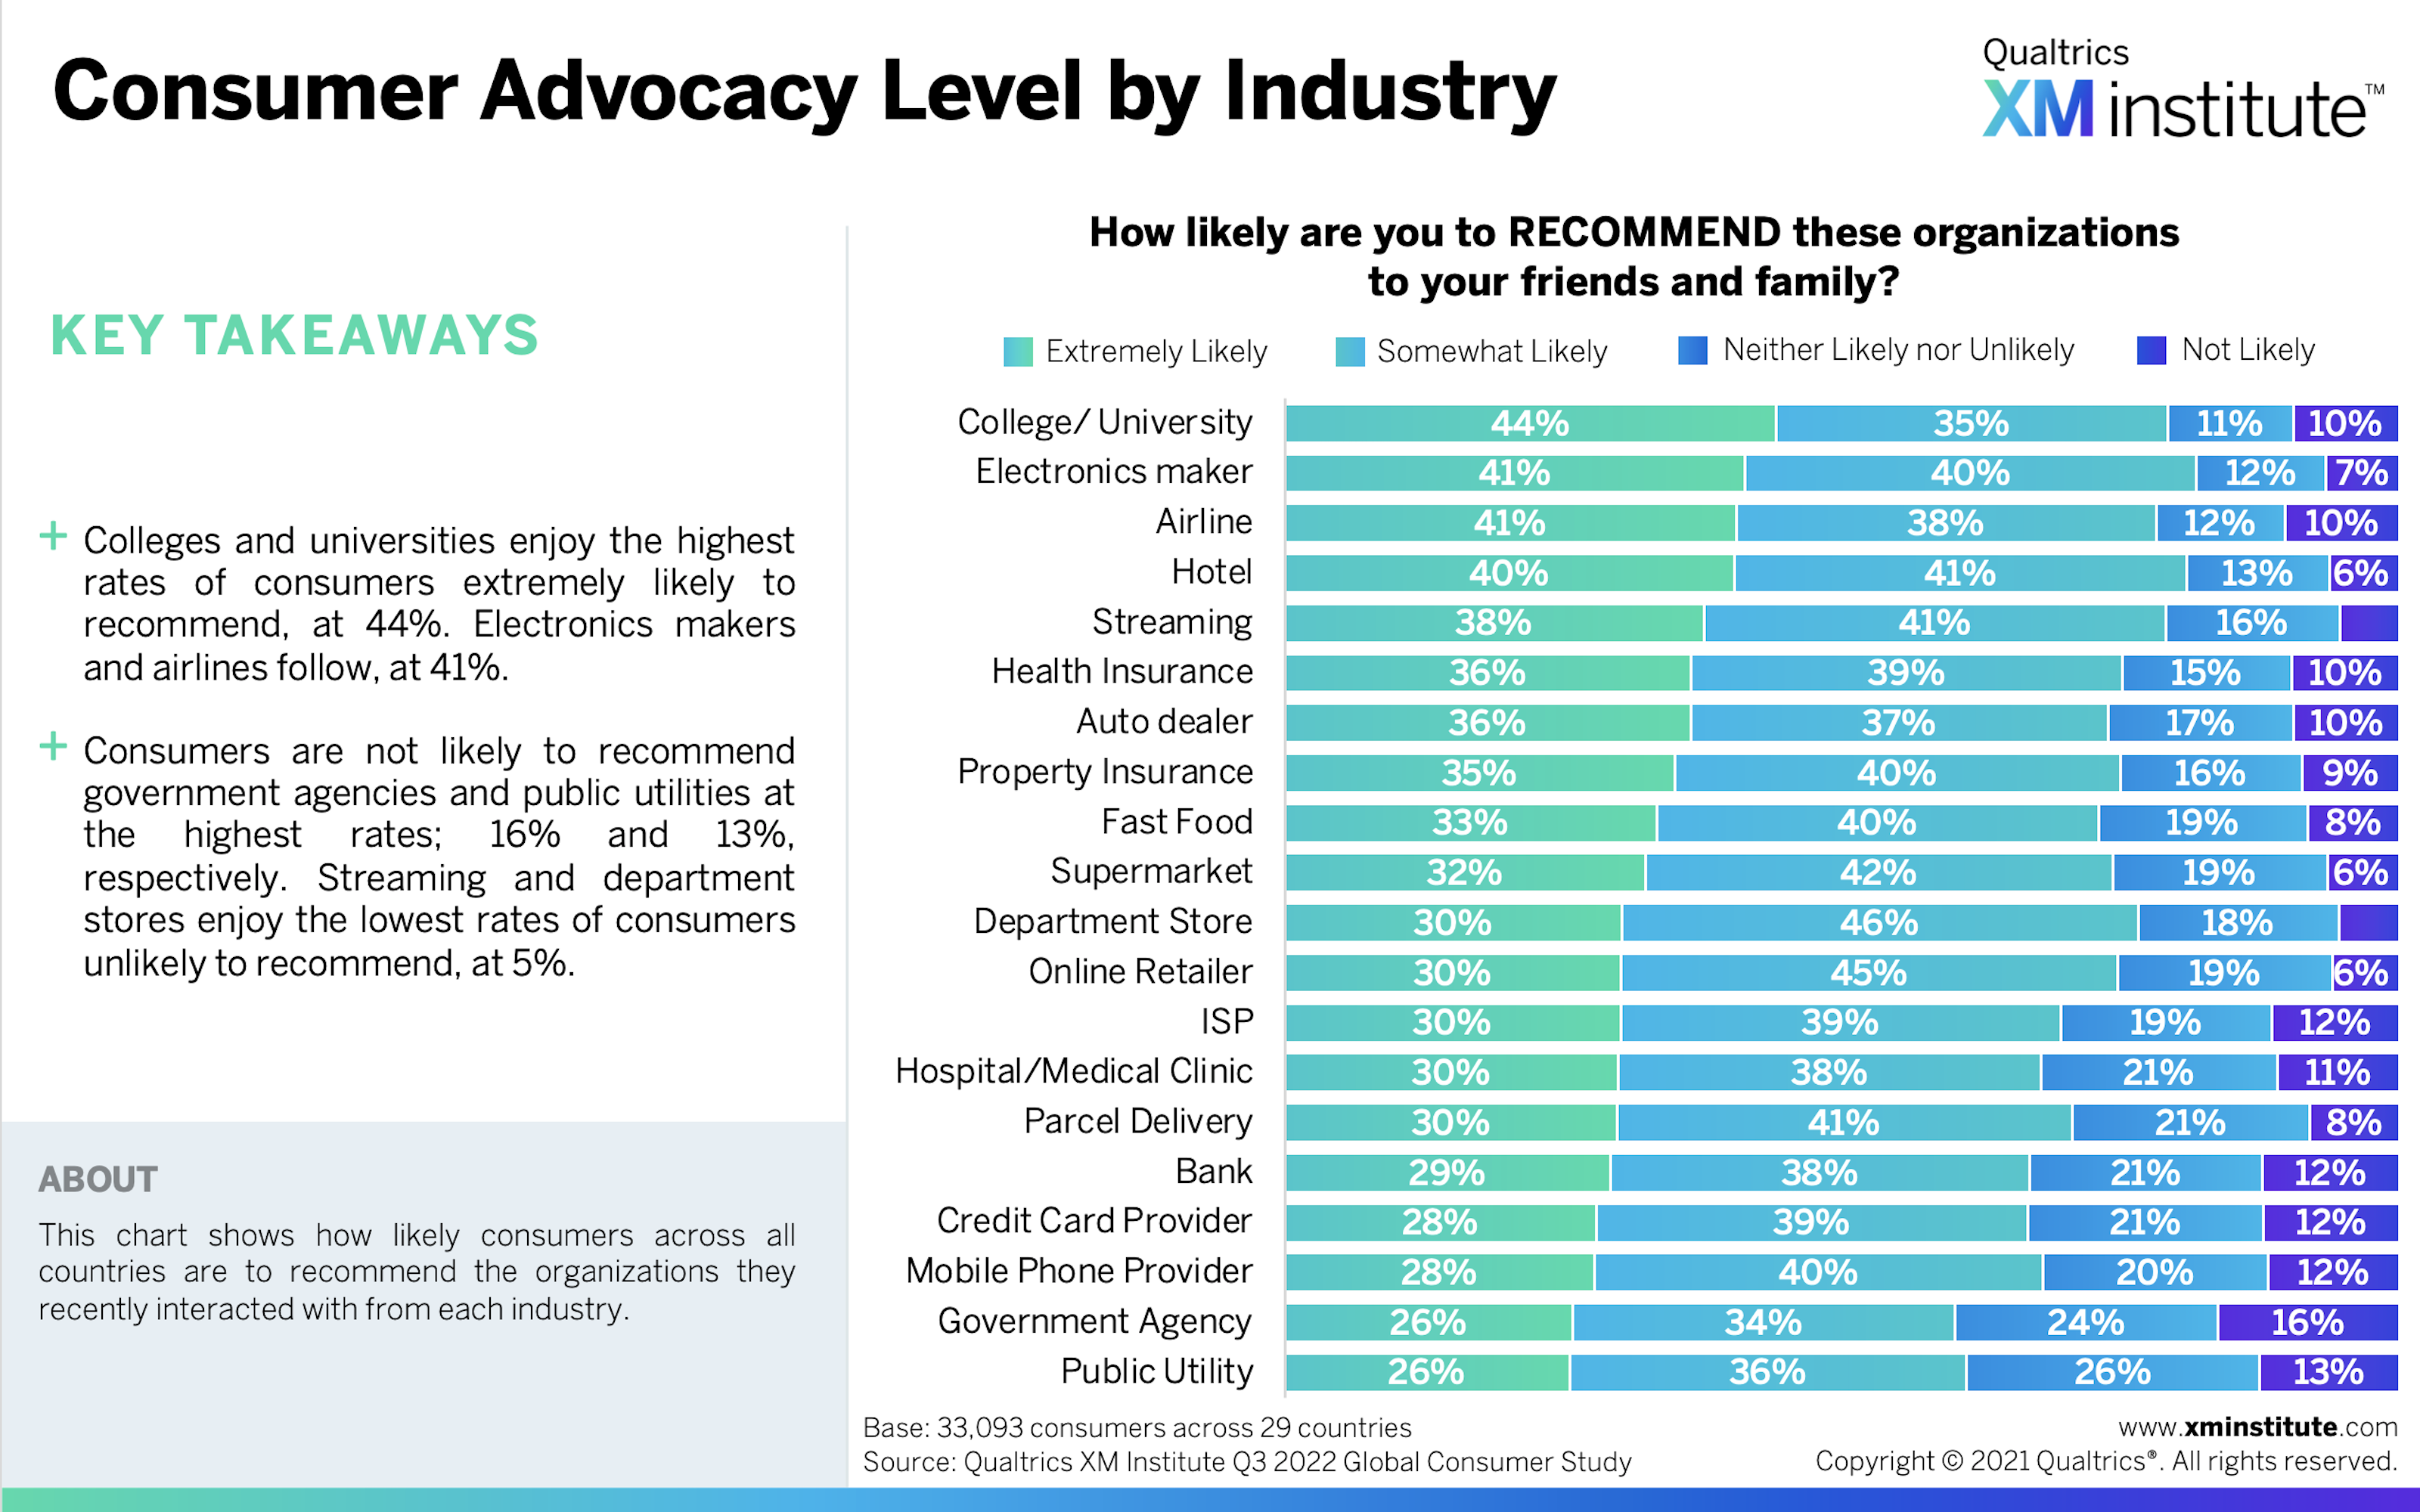
- Consumer Advocacy Level by Industry (see Figure 11)
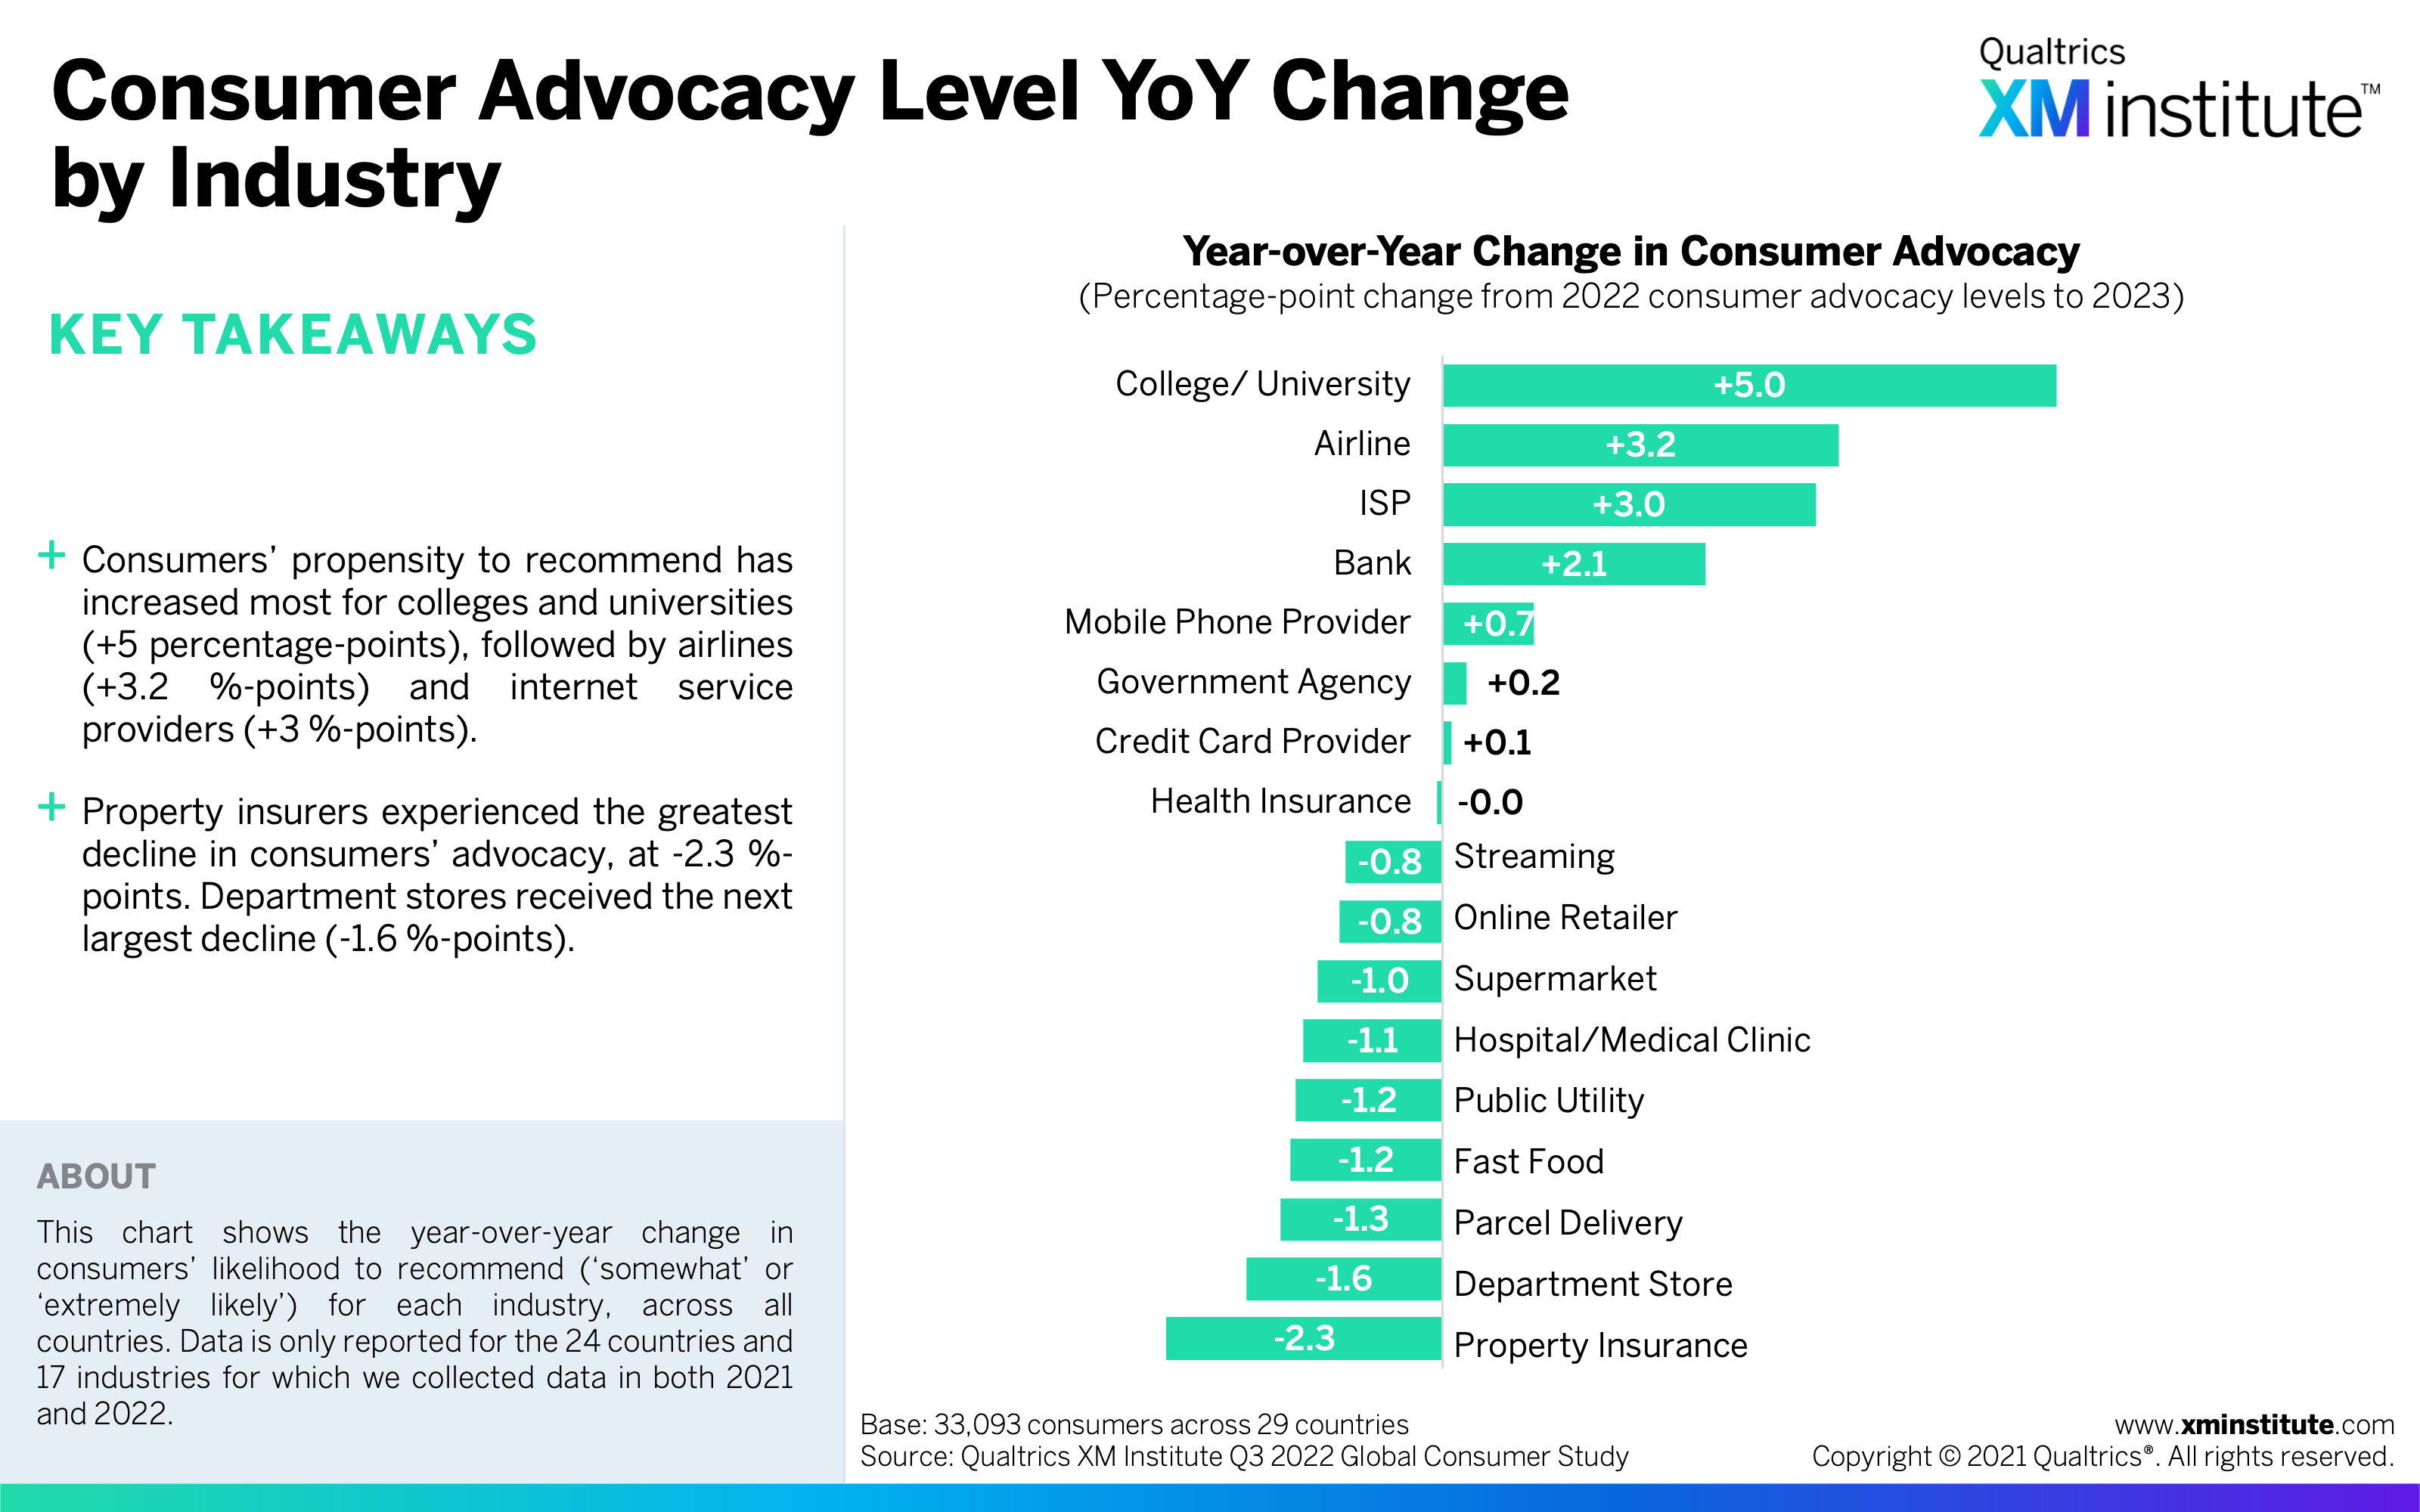
- Consumer Advocacy Level YoY Change by Industry (see Figure 12)
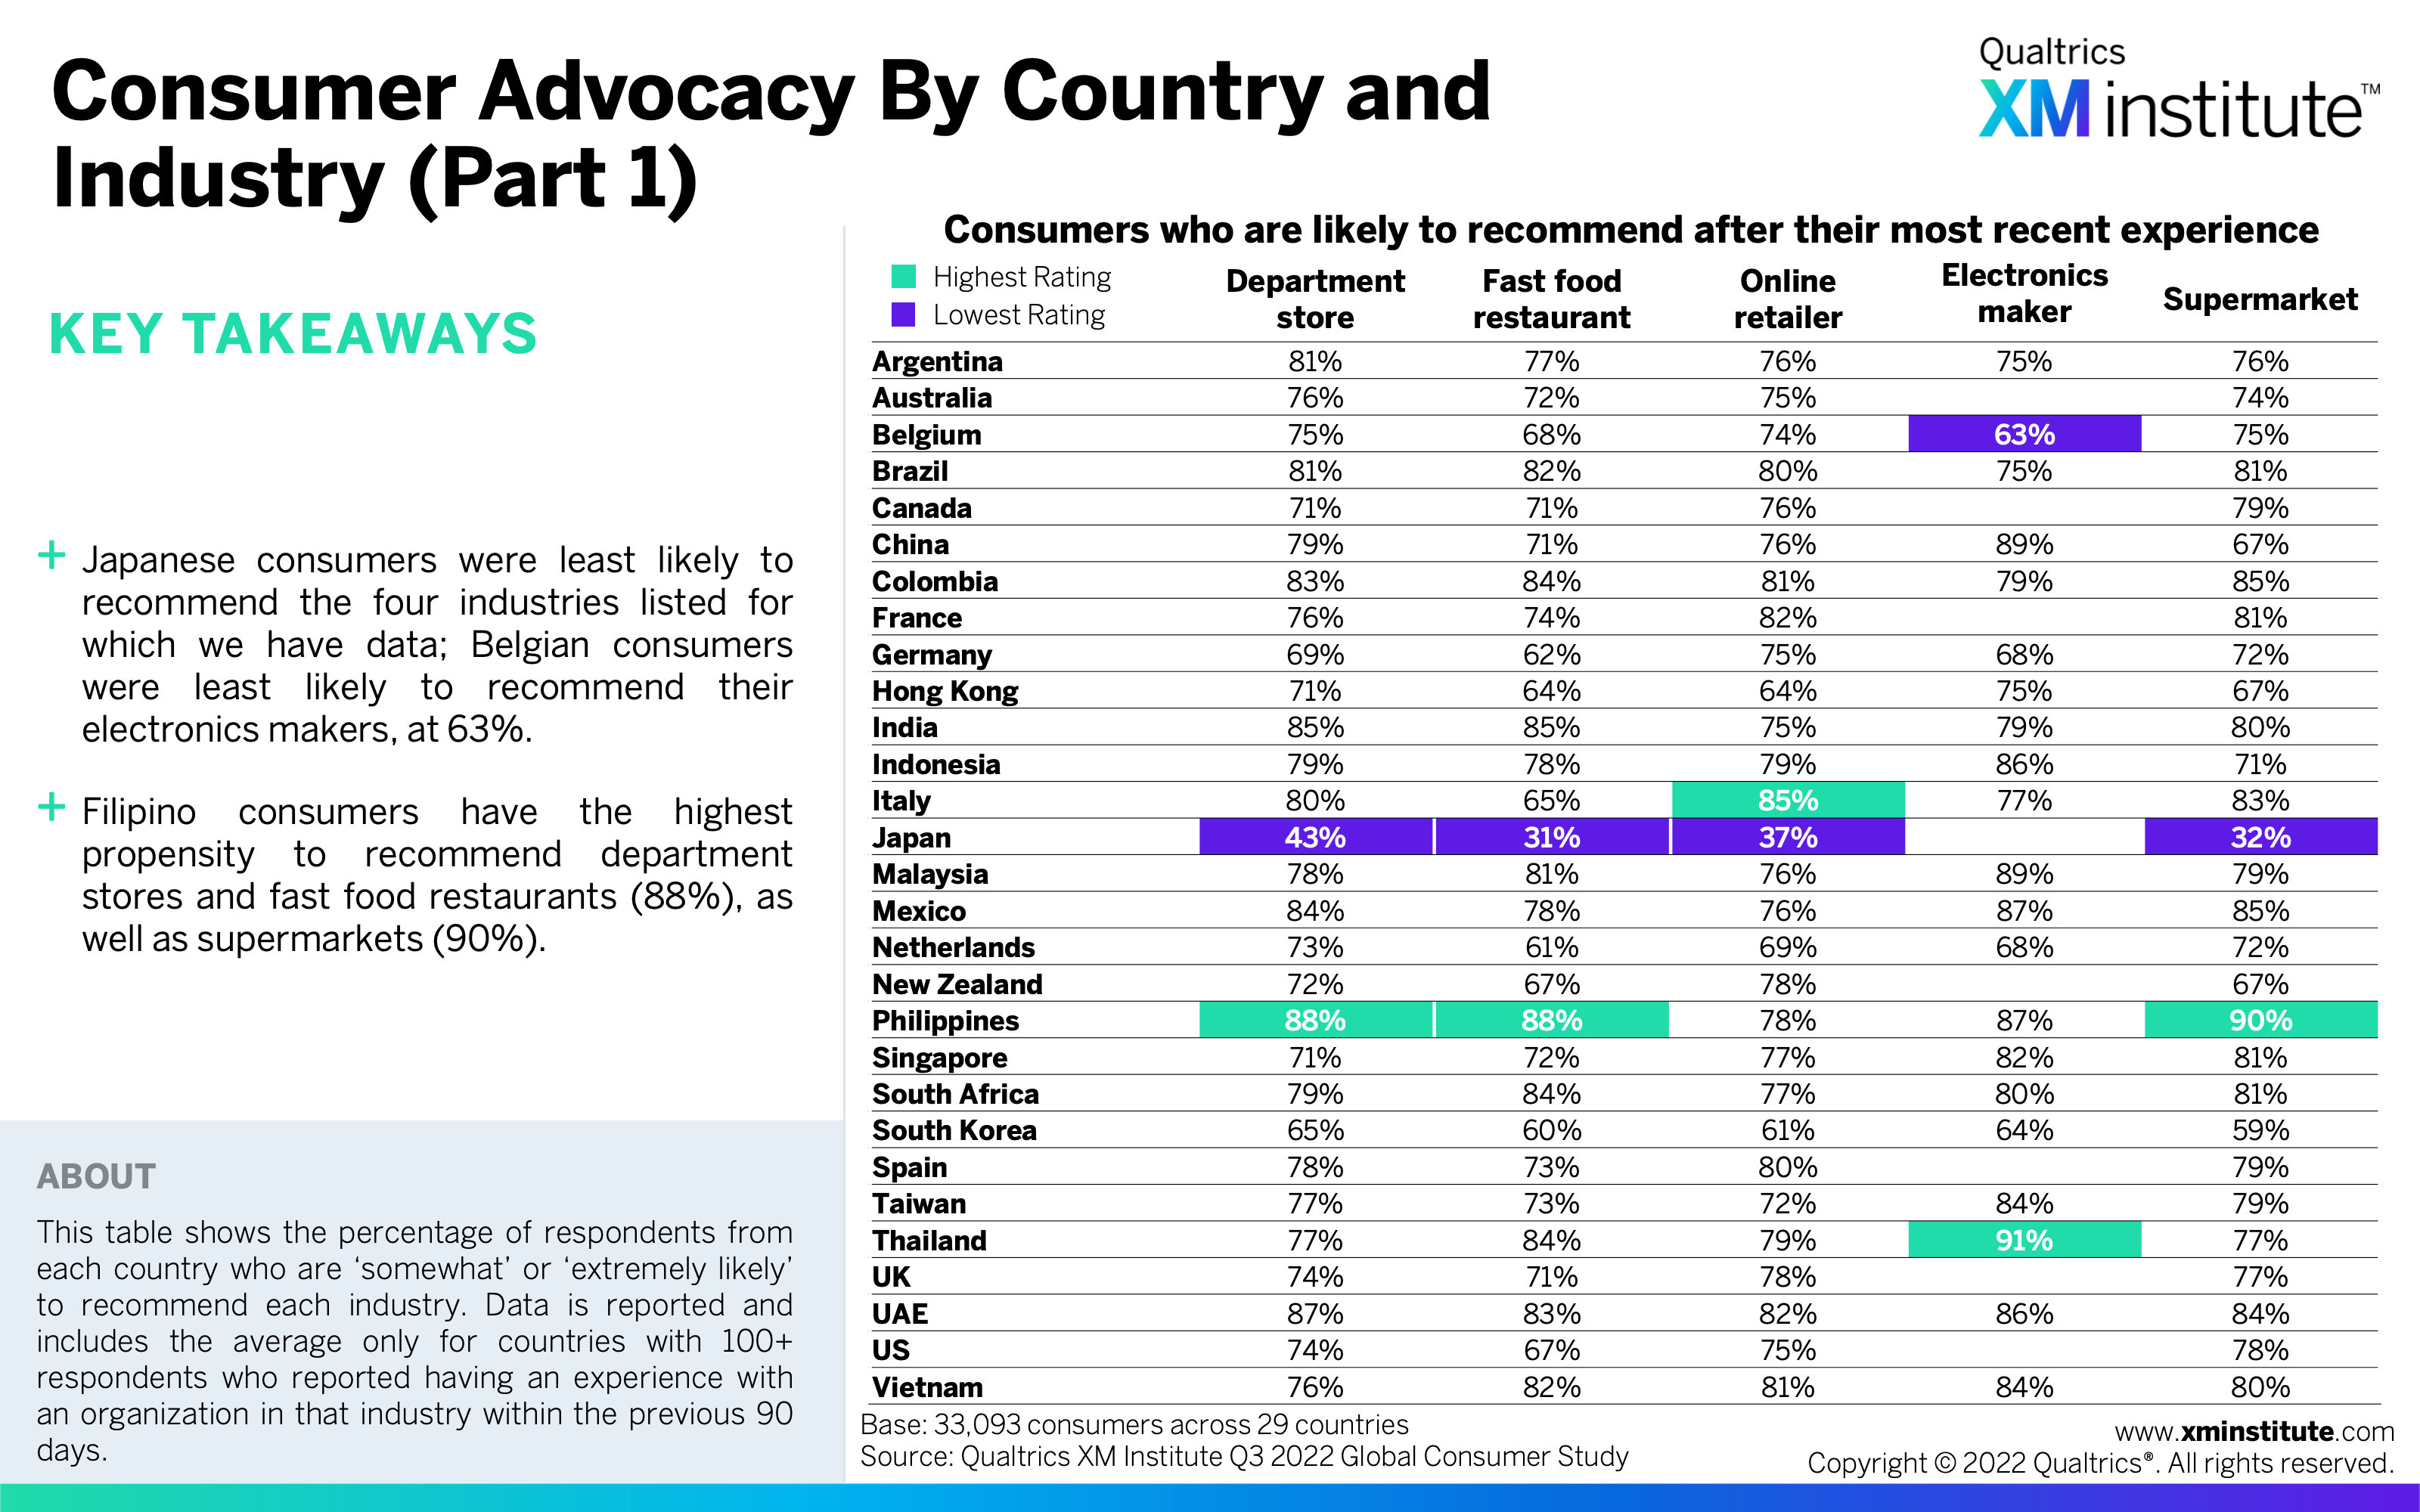
- Consumer Advocacy by Country and Industry (Part 1) (see Figure 13)
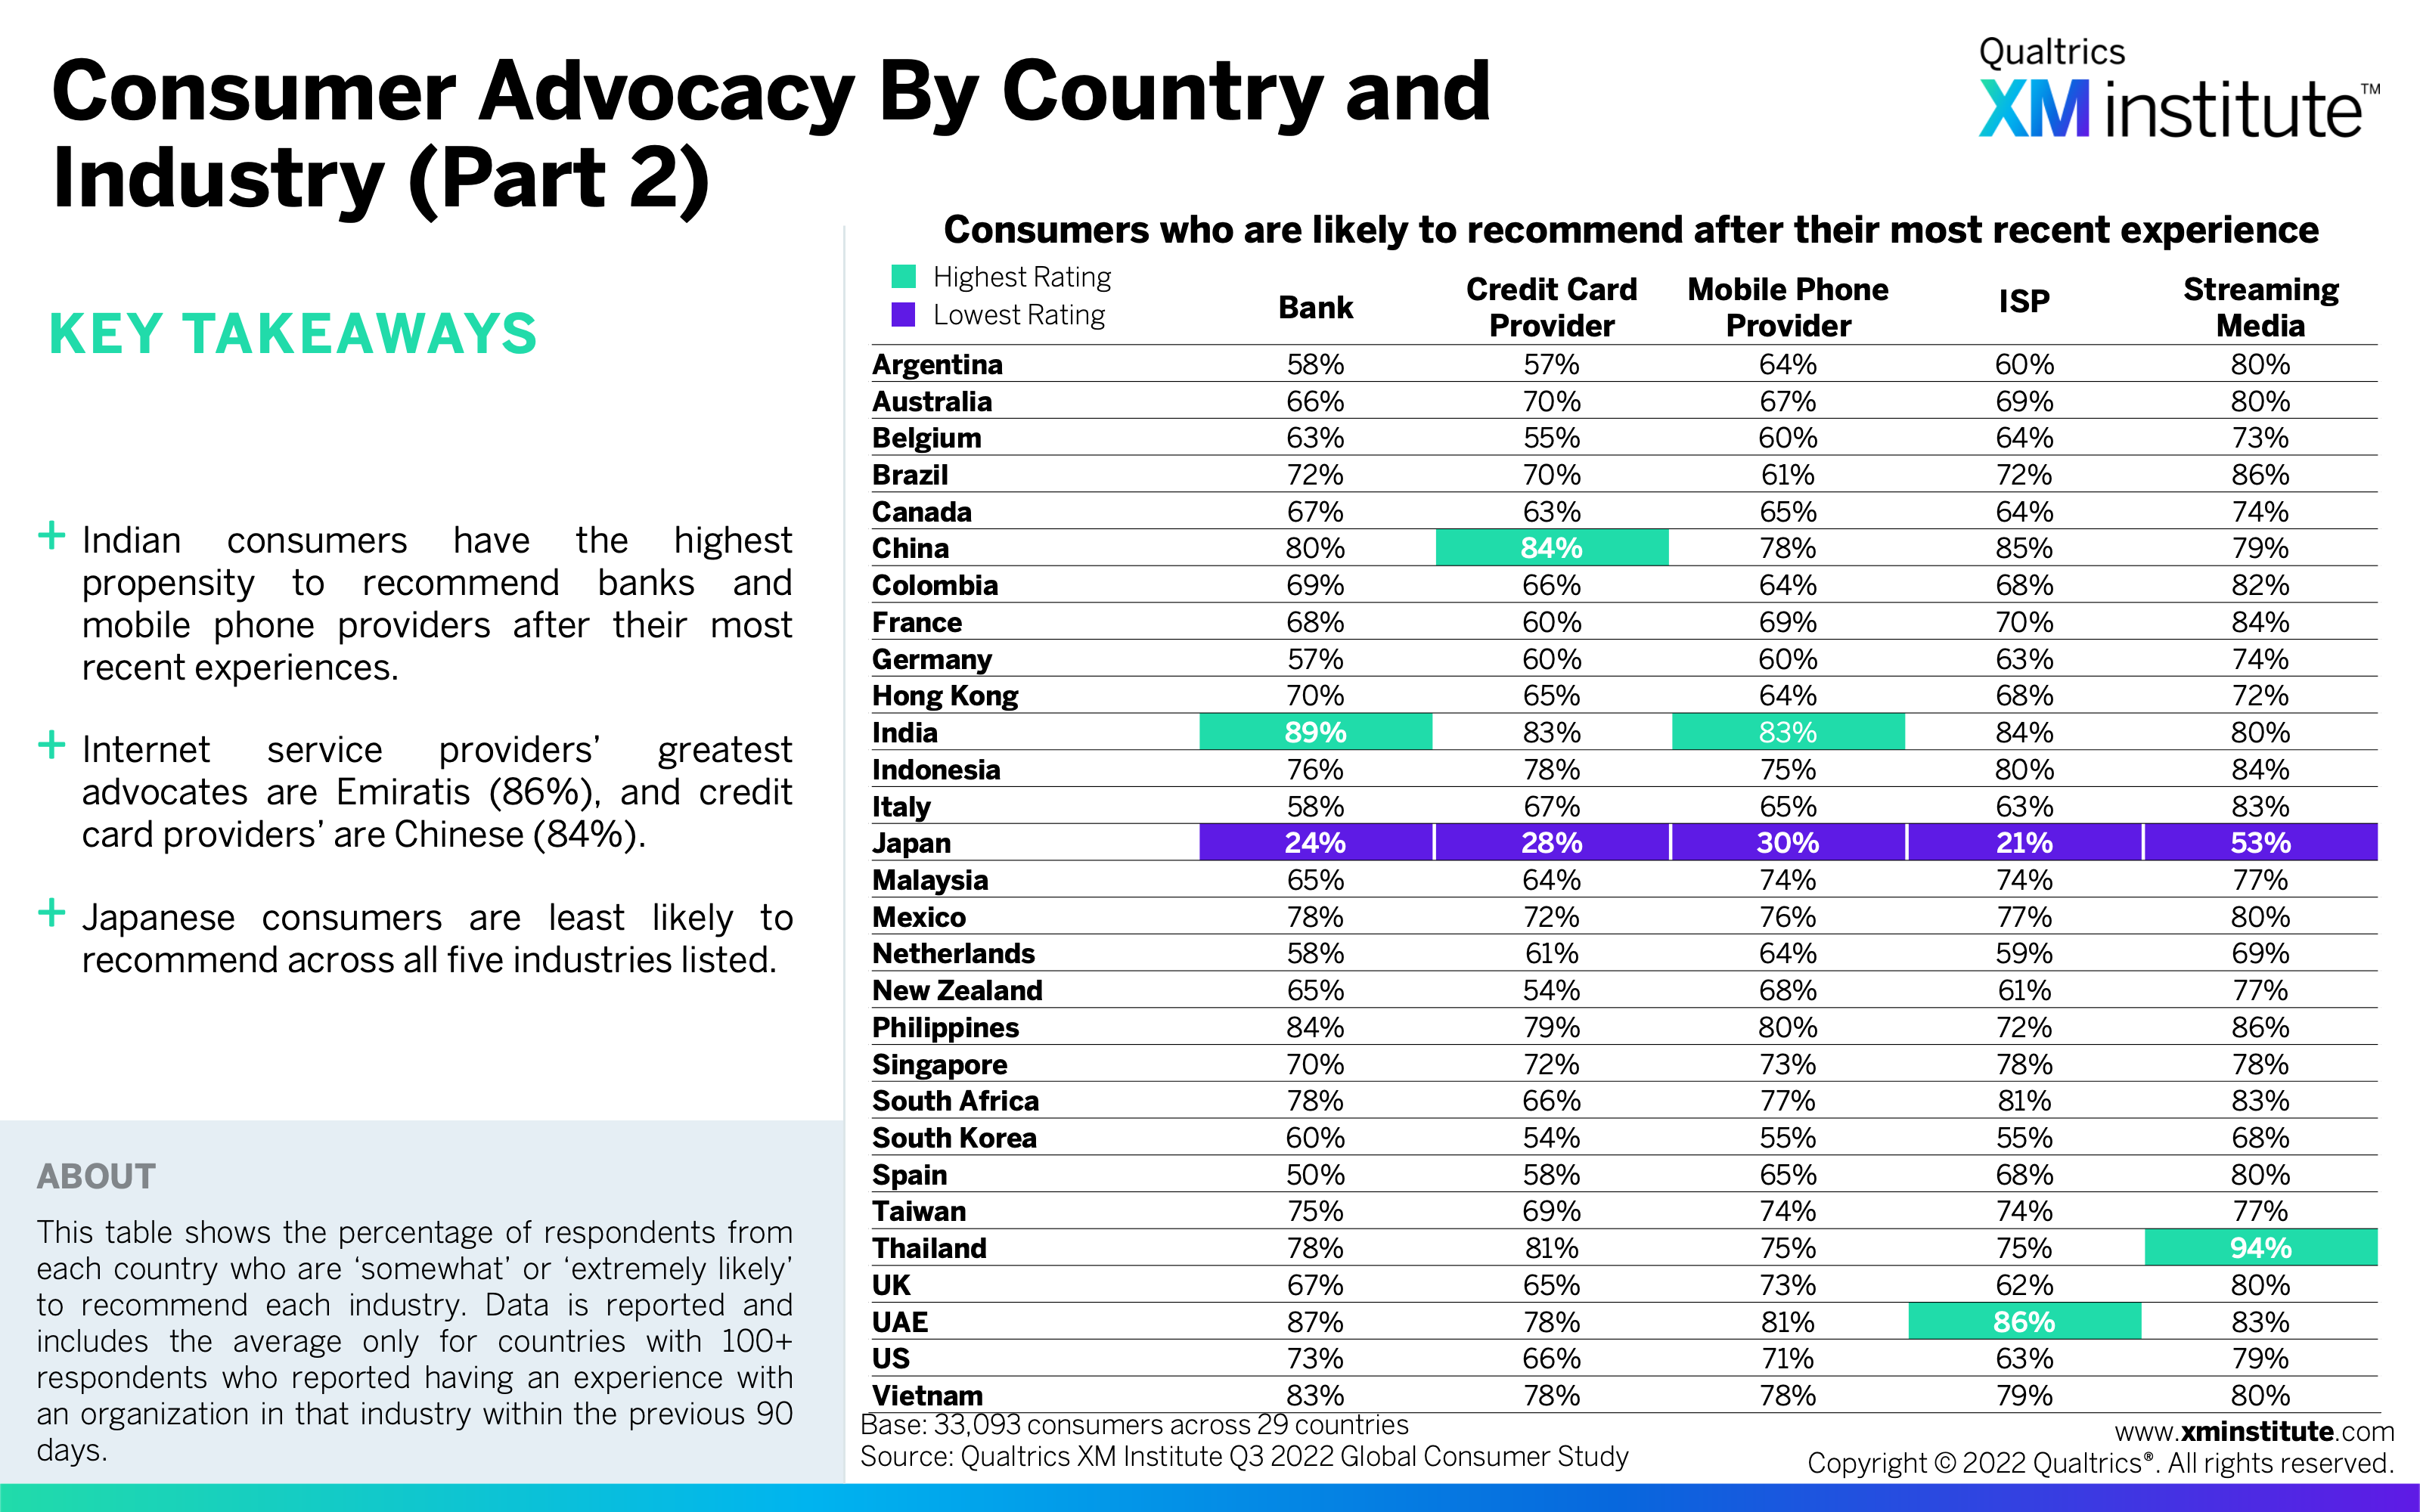
- Consumer Advocacy by Country and Industry (Part 2) (see Figure 14)
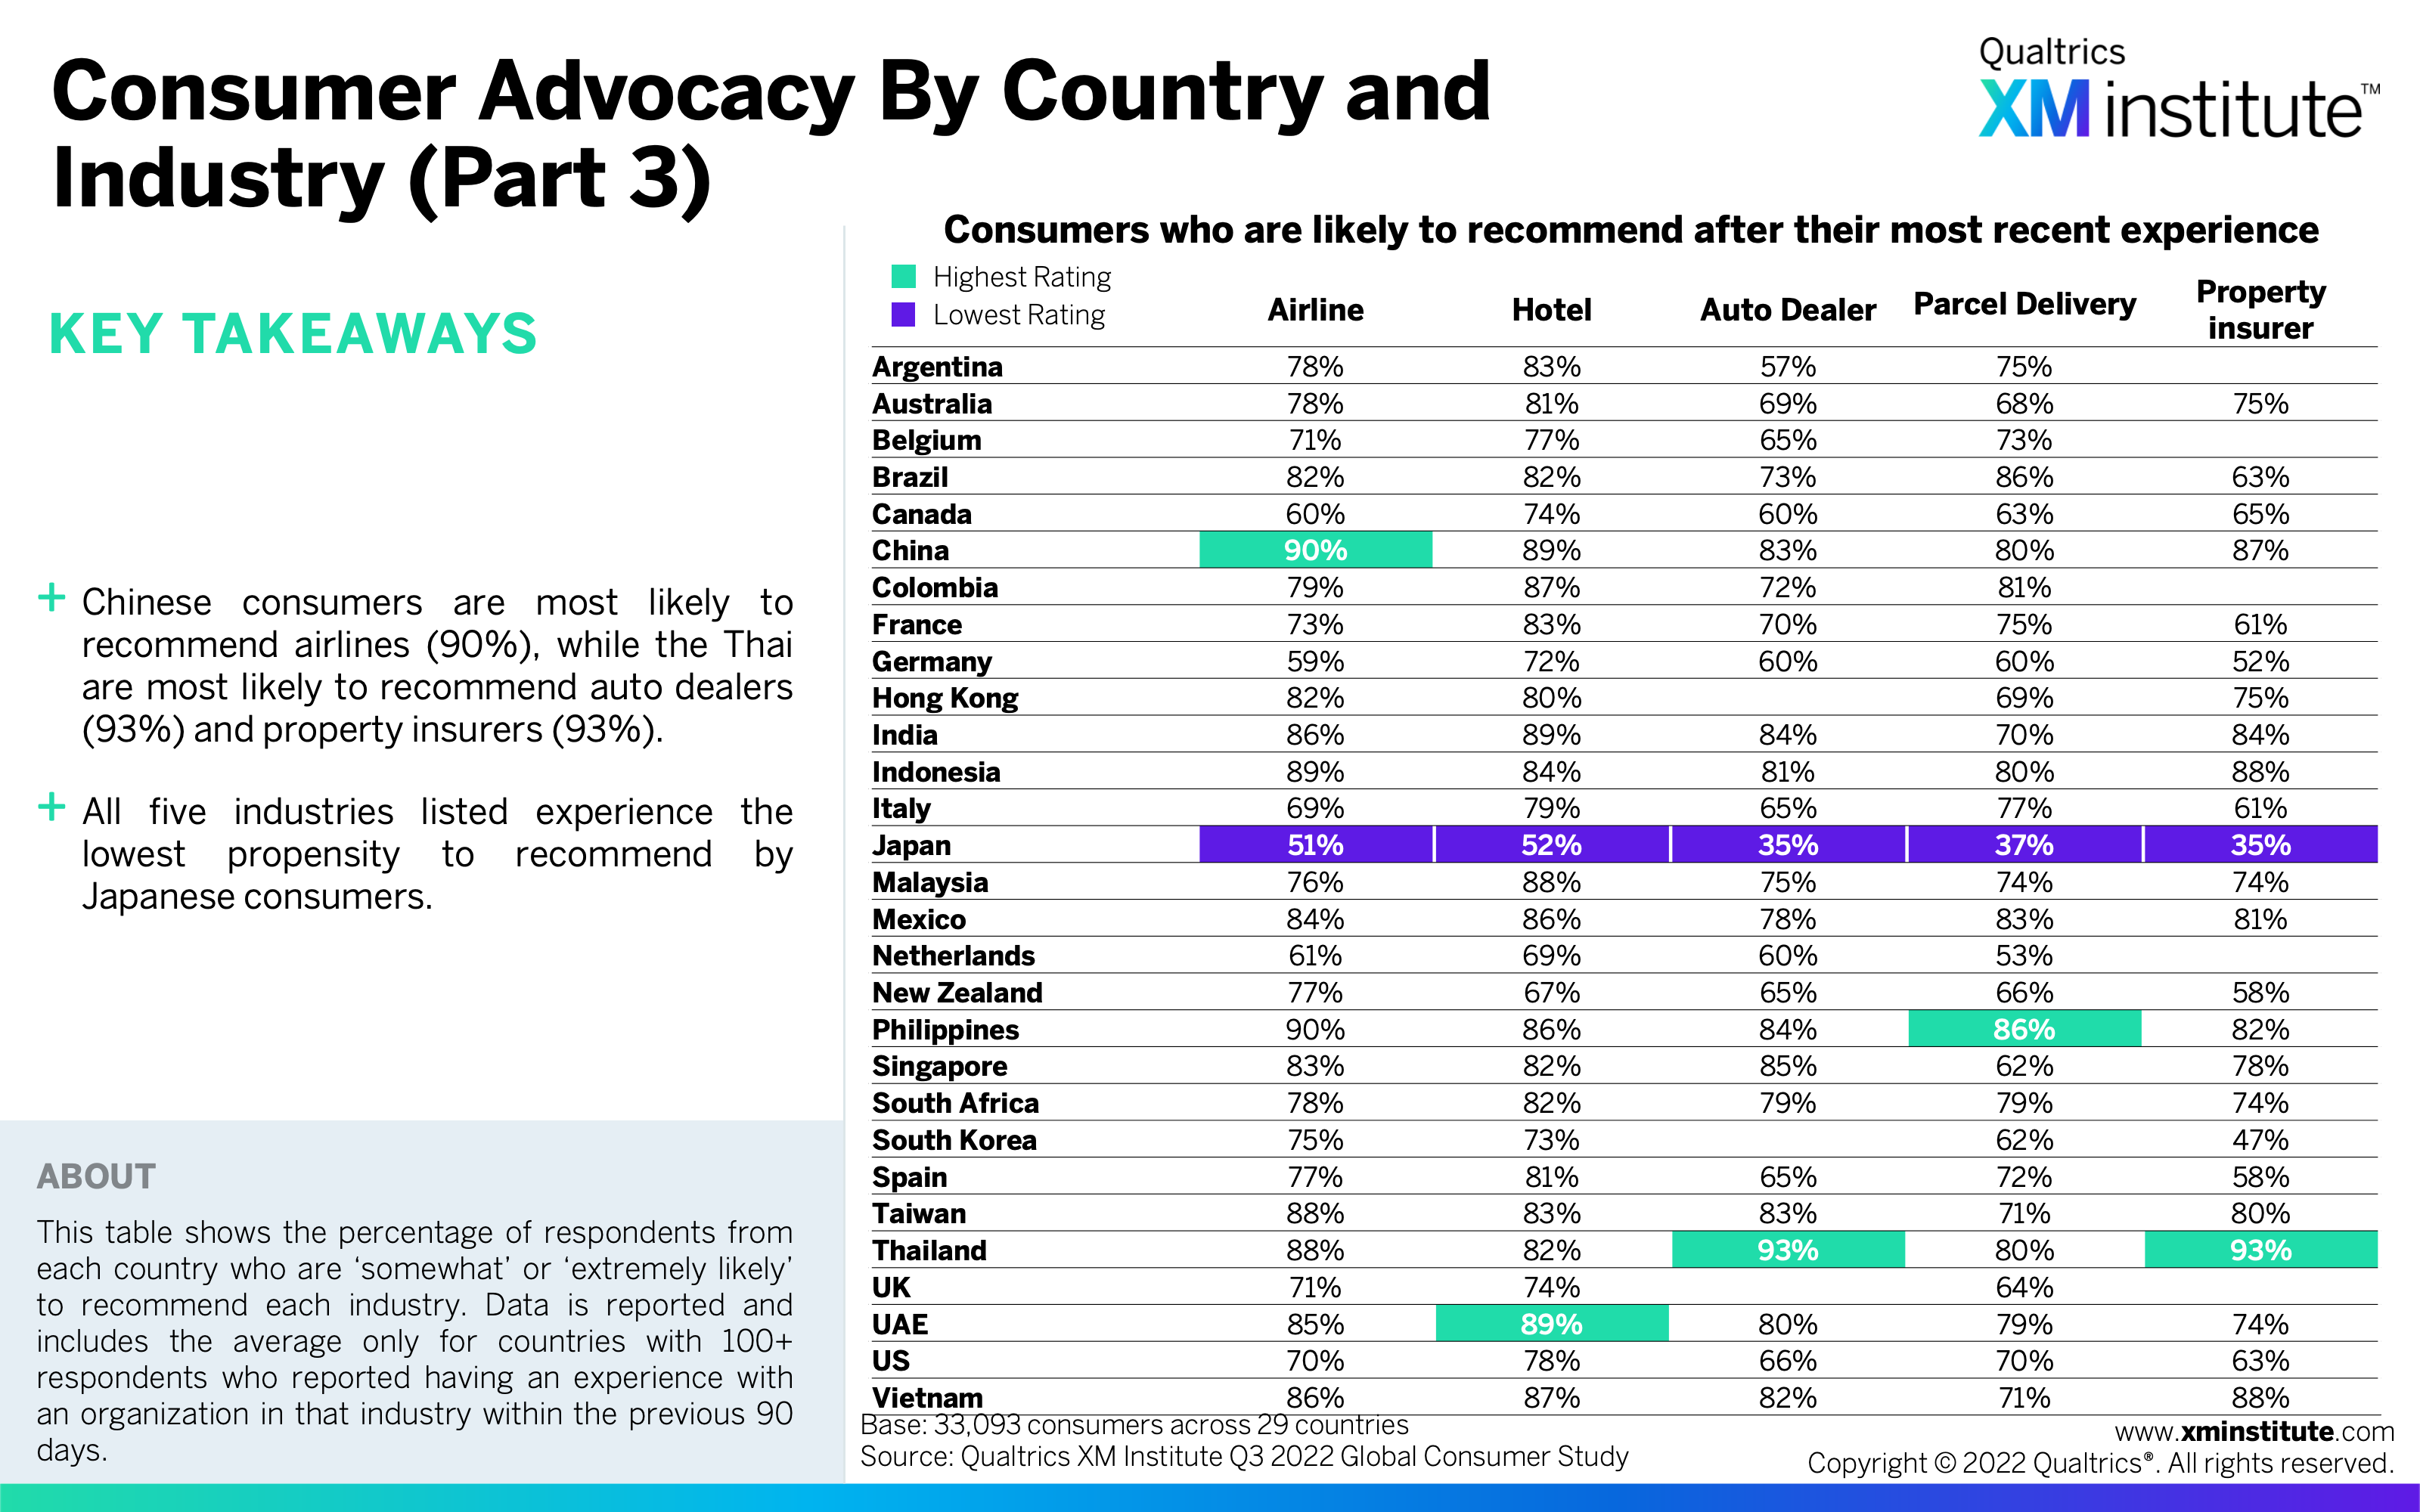
- Consumer Advocacy by Country and Industry (Part 3) (see Figure 15)
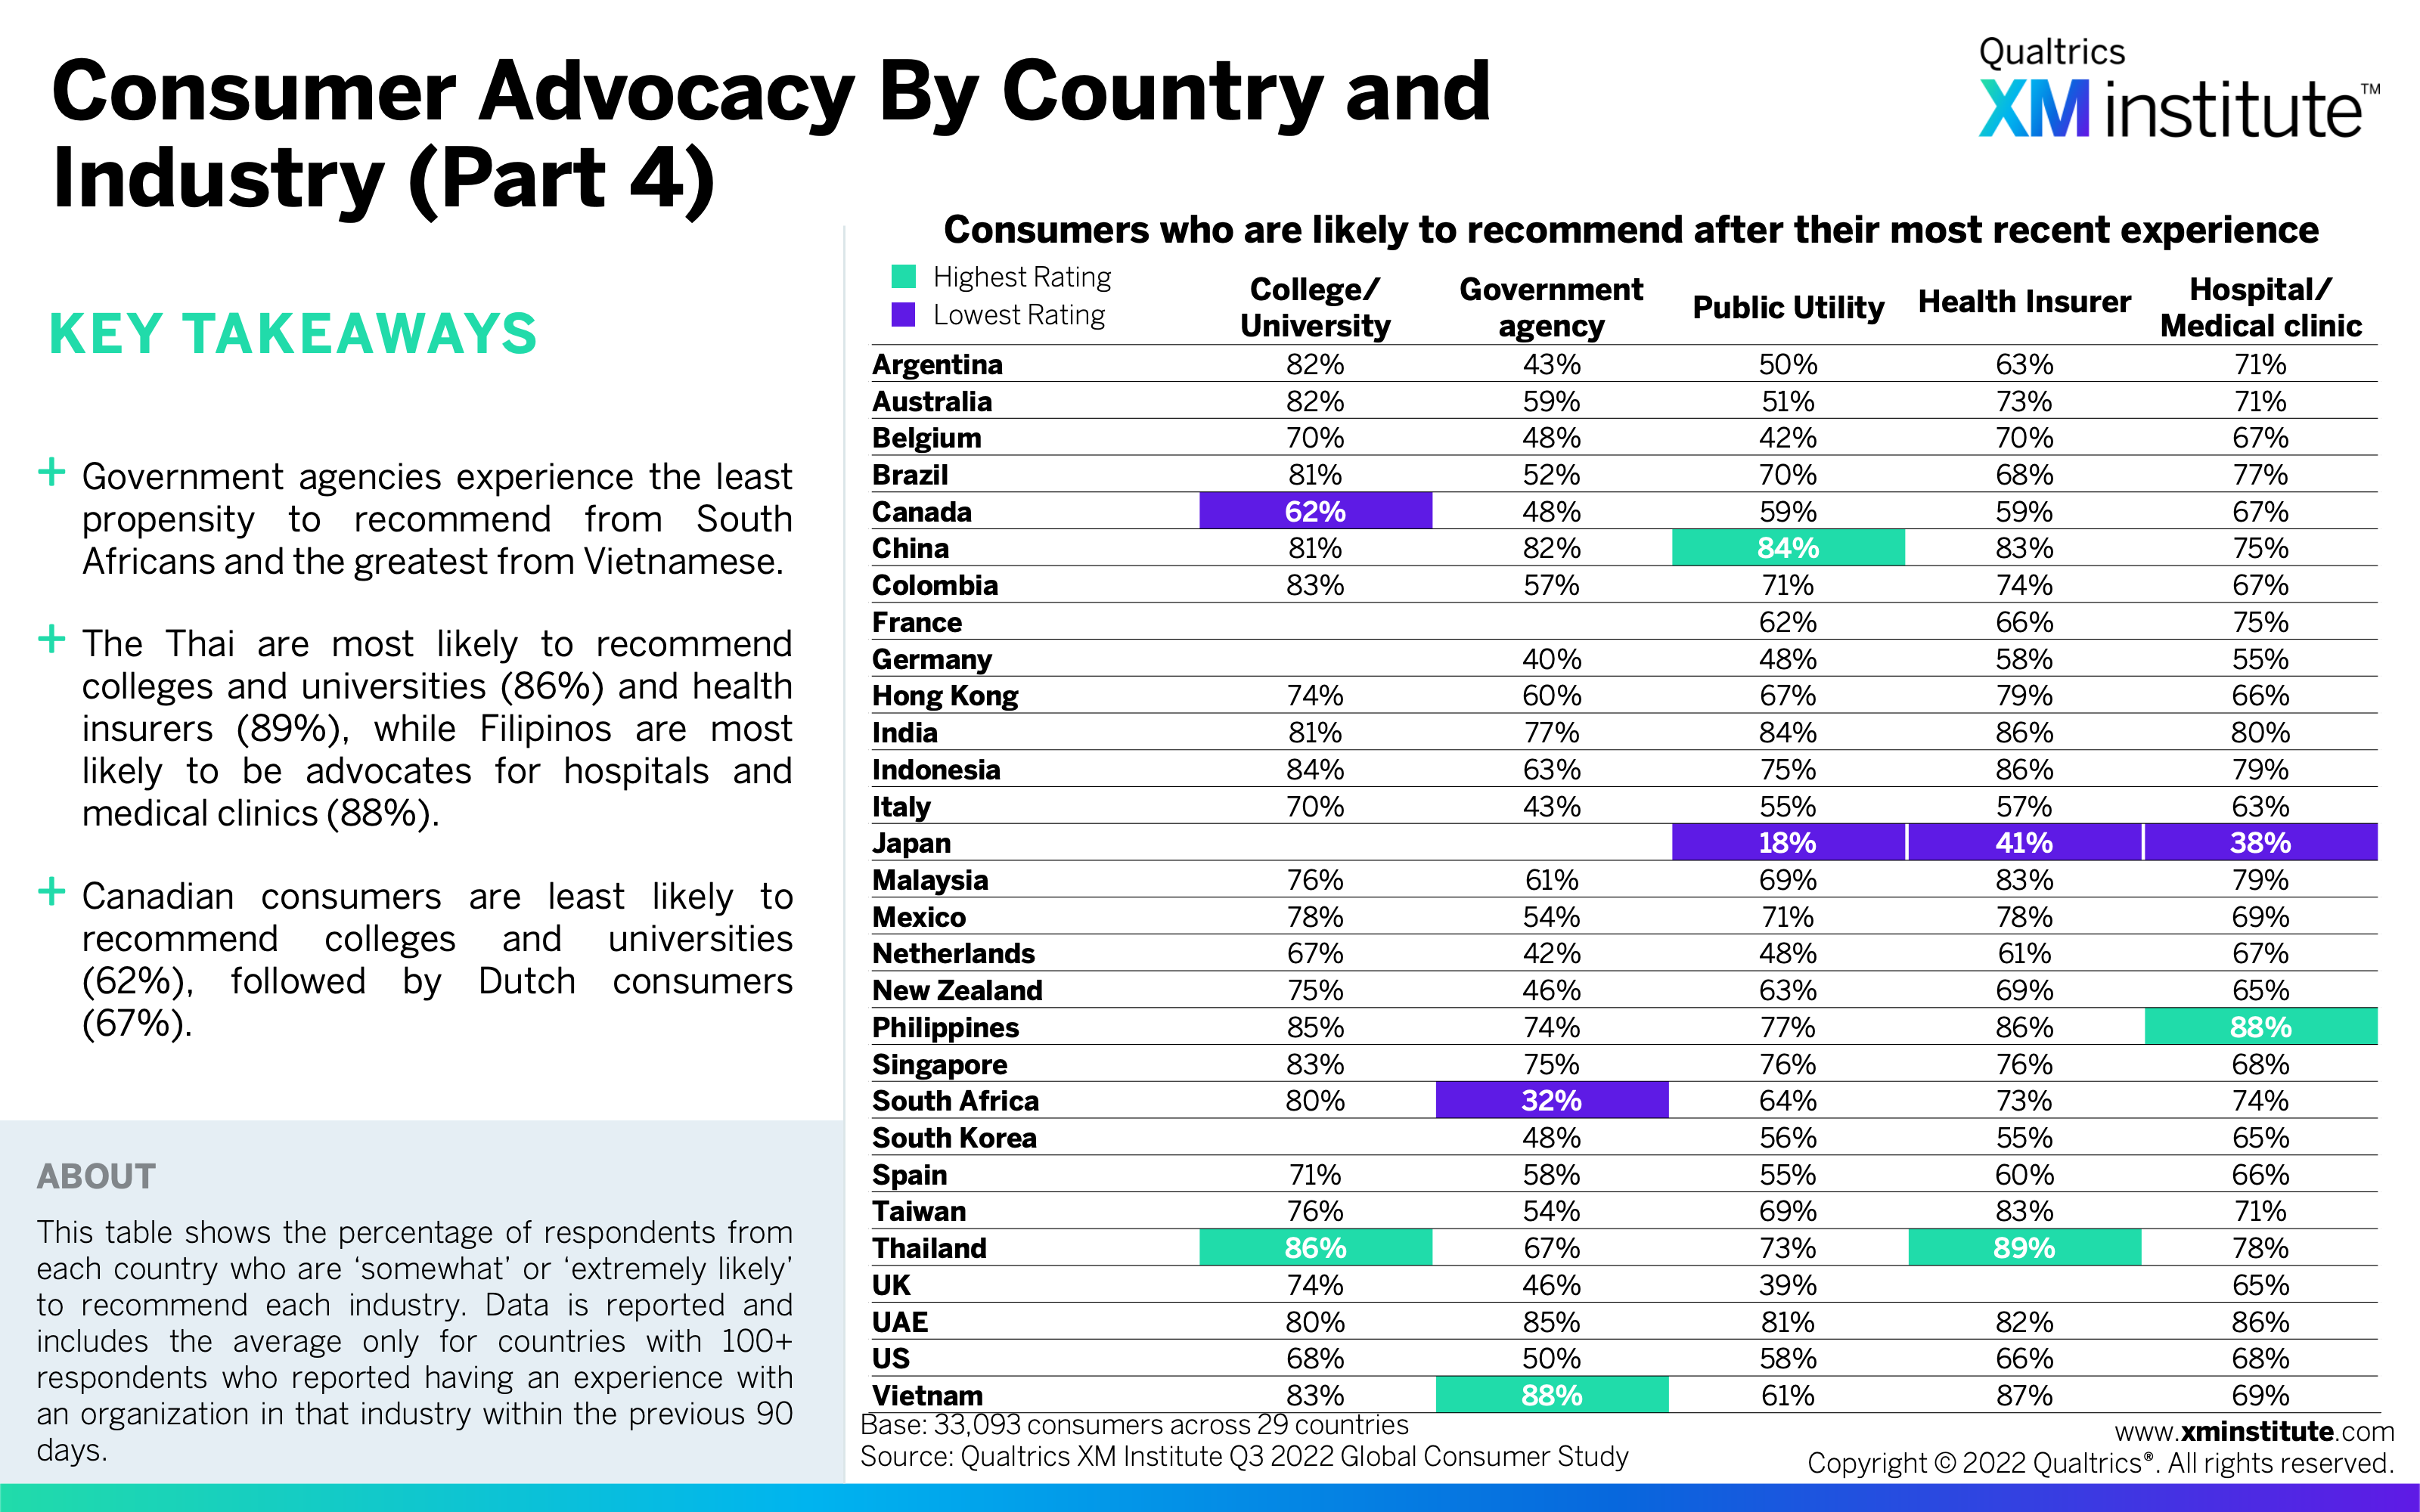
- Consumer Advocacy by Country and Industry (Part 4) (see Figure 16)
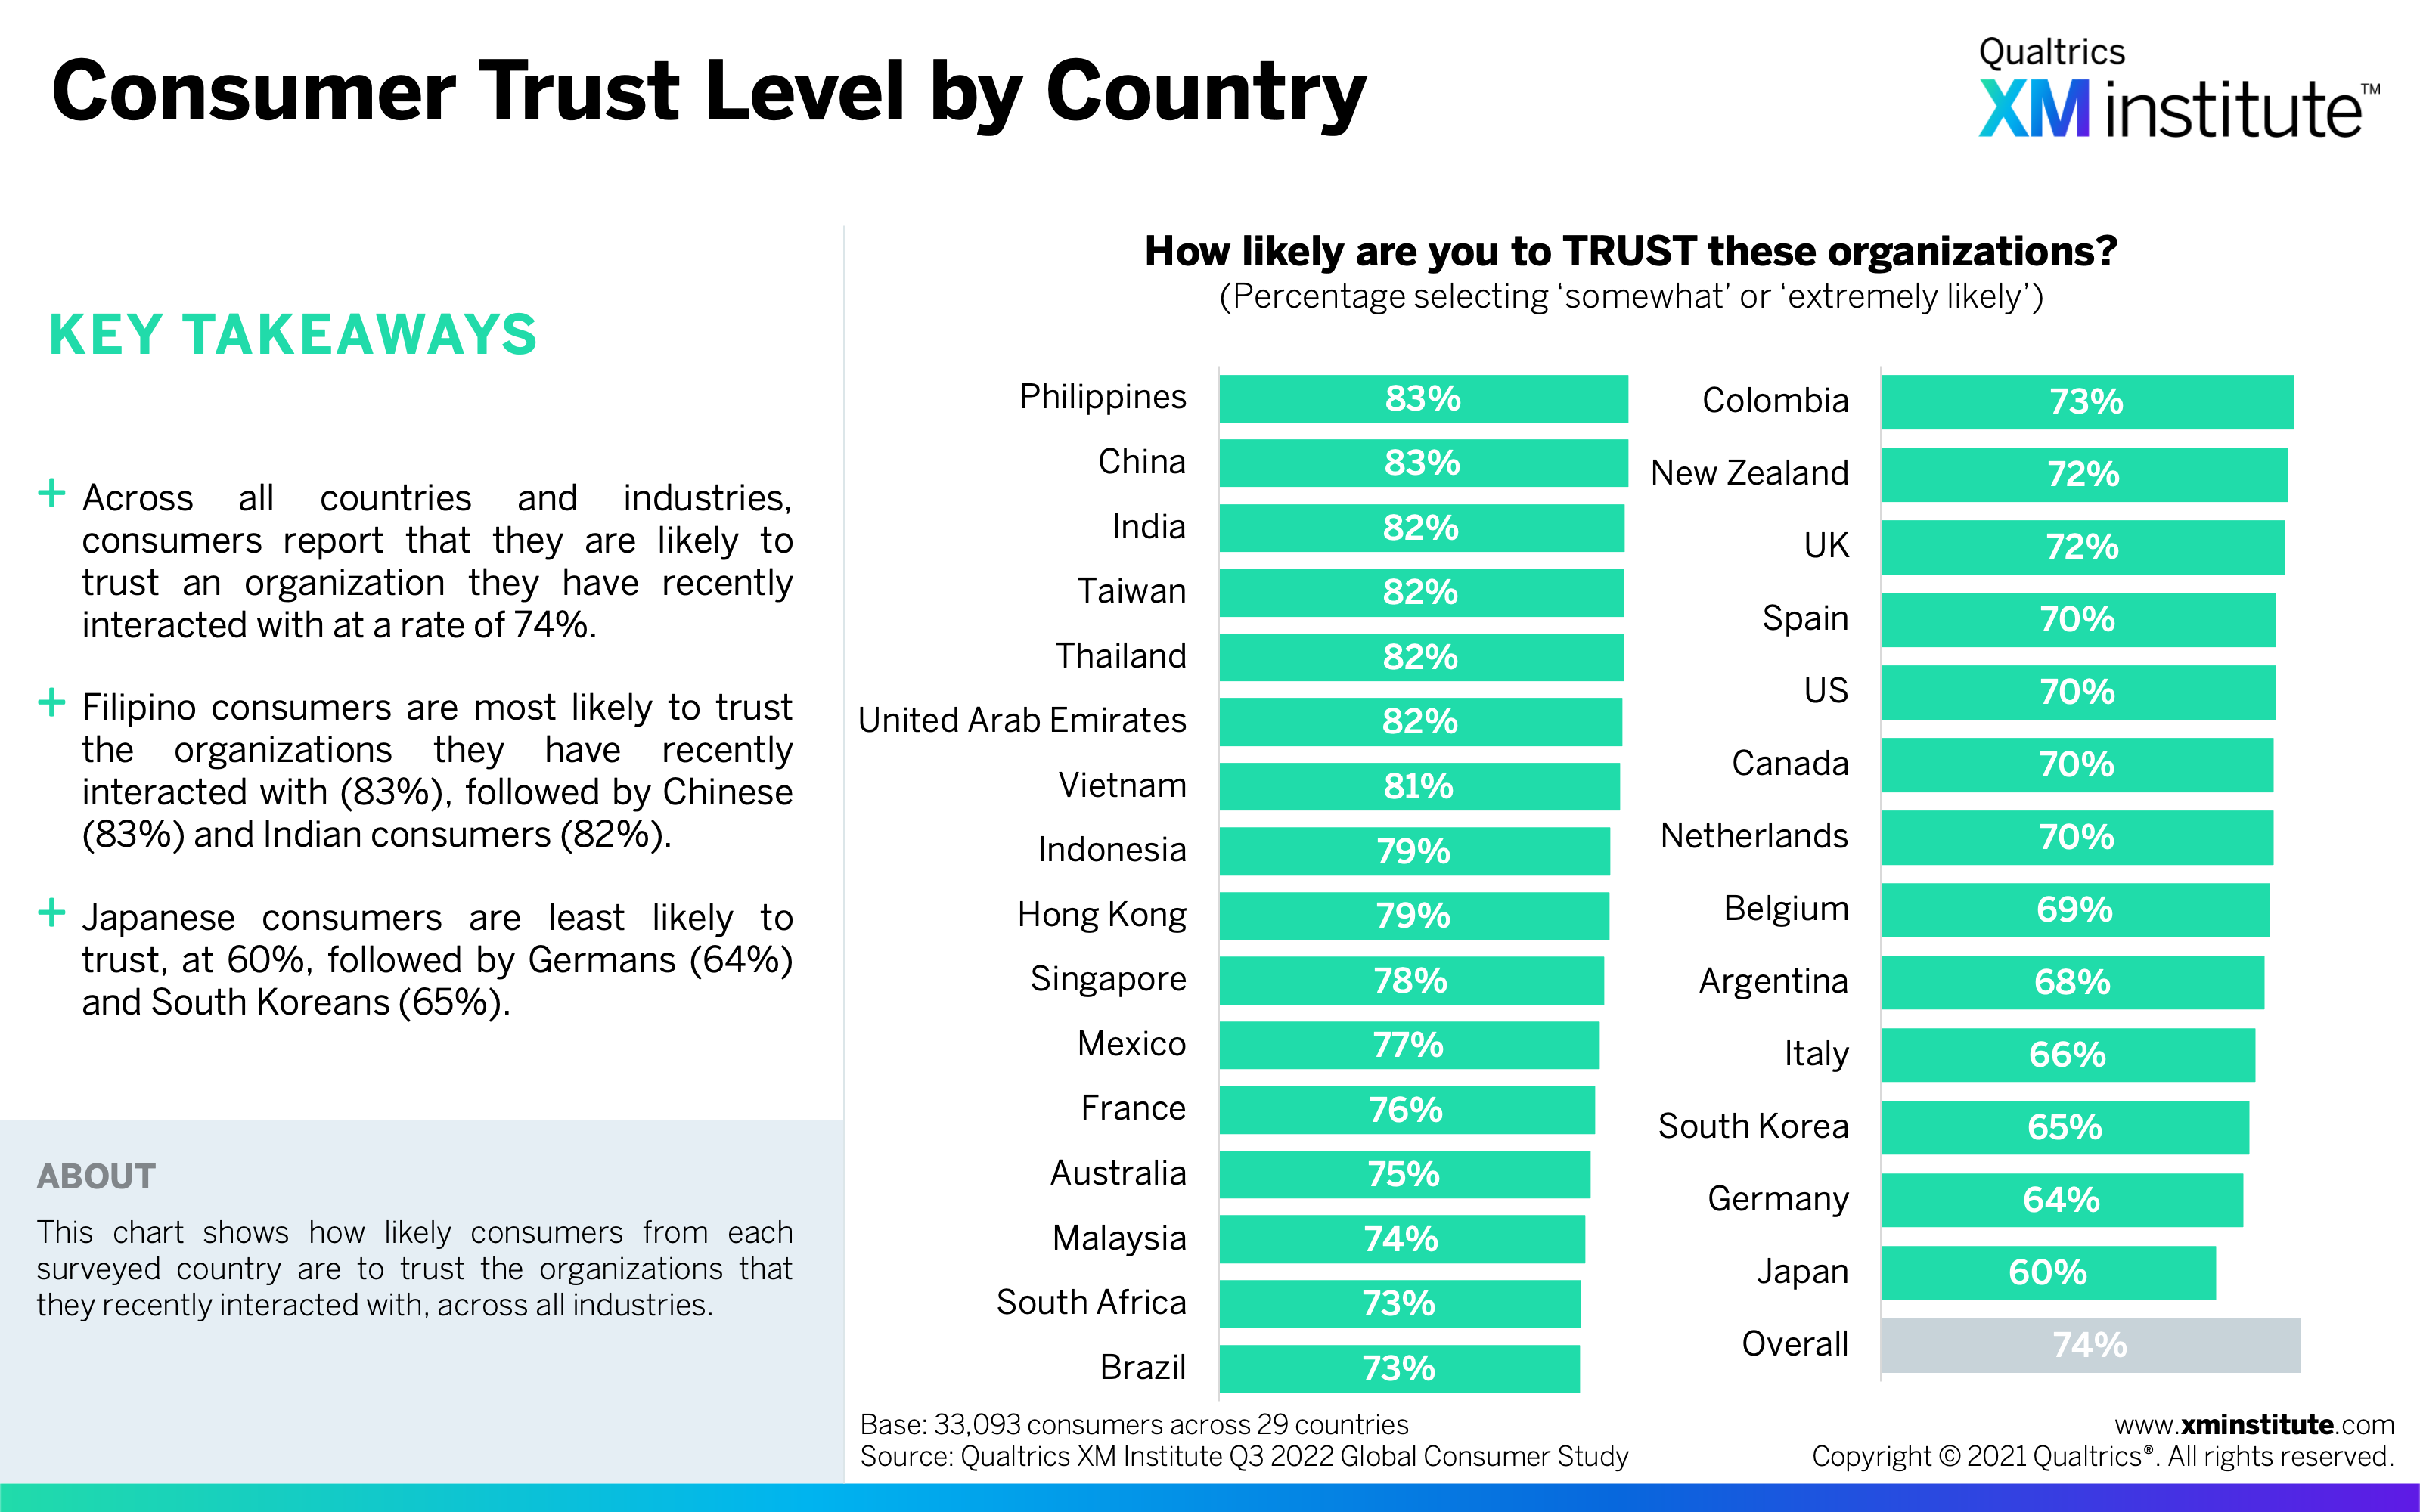
- Consumer Trust Level by Country (see Figure 17)
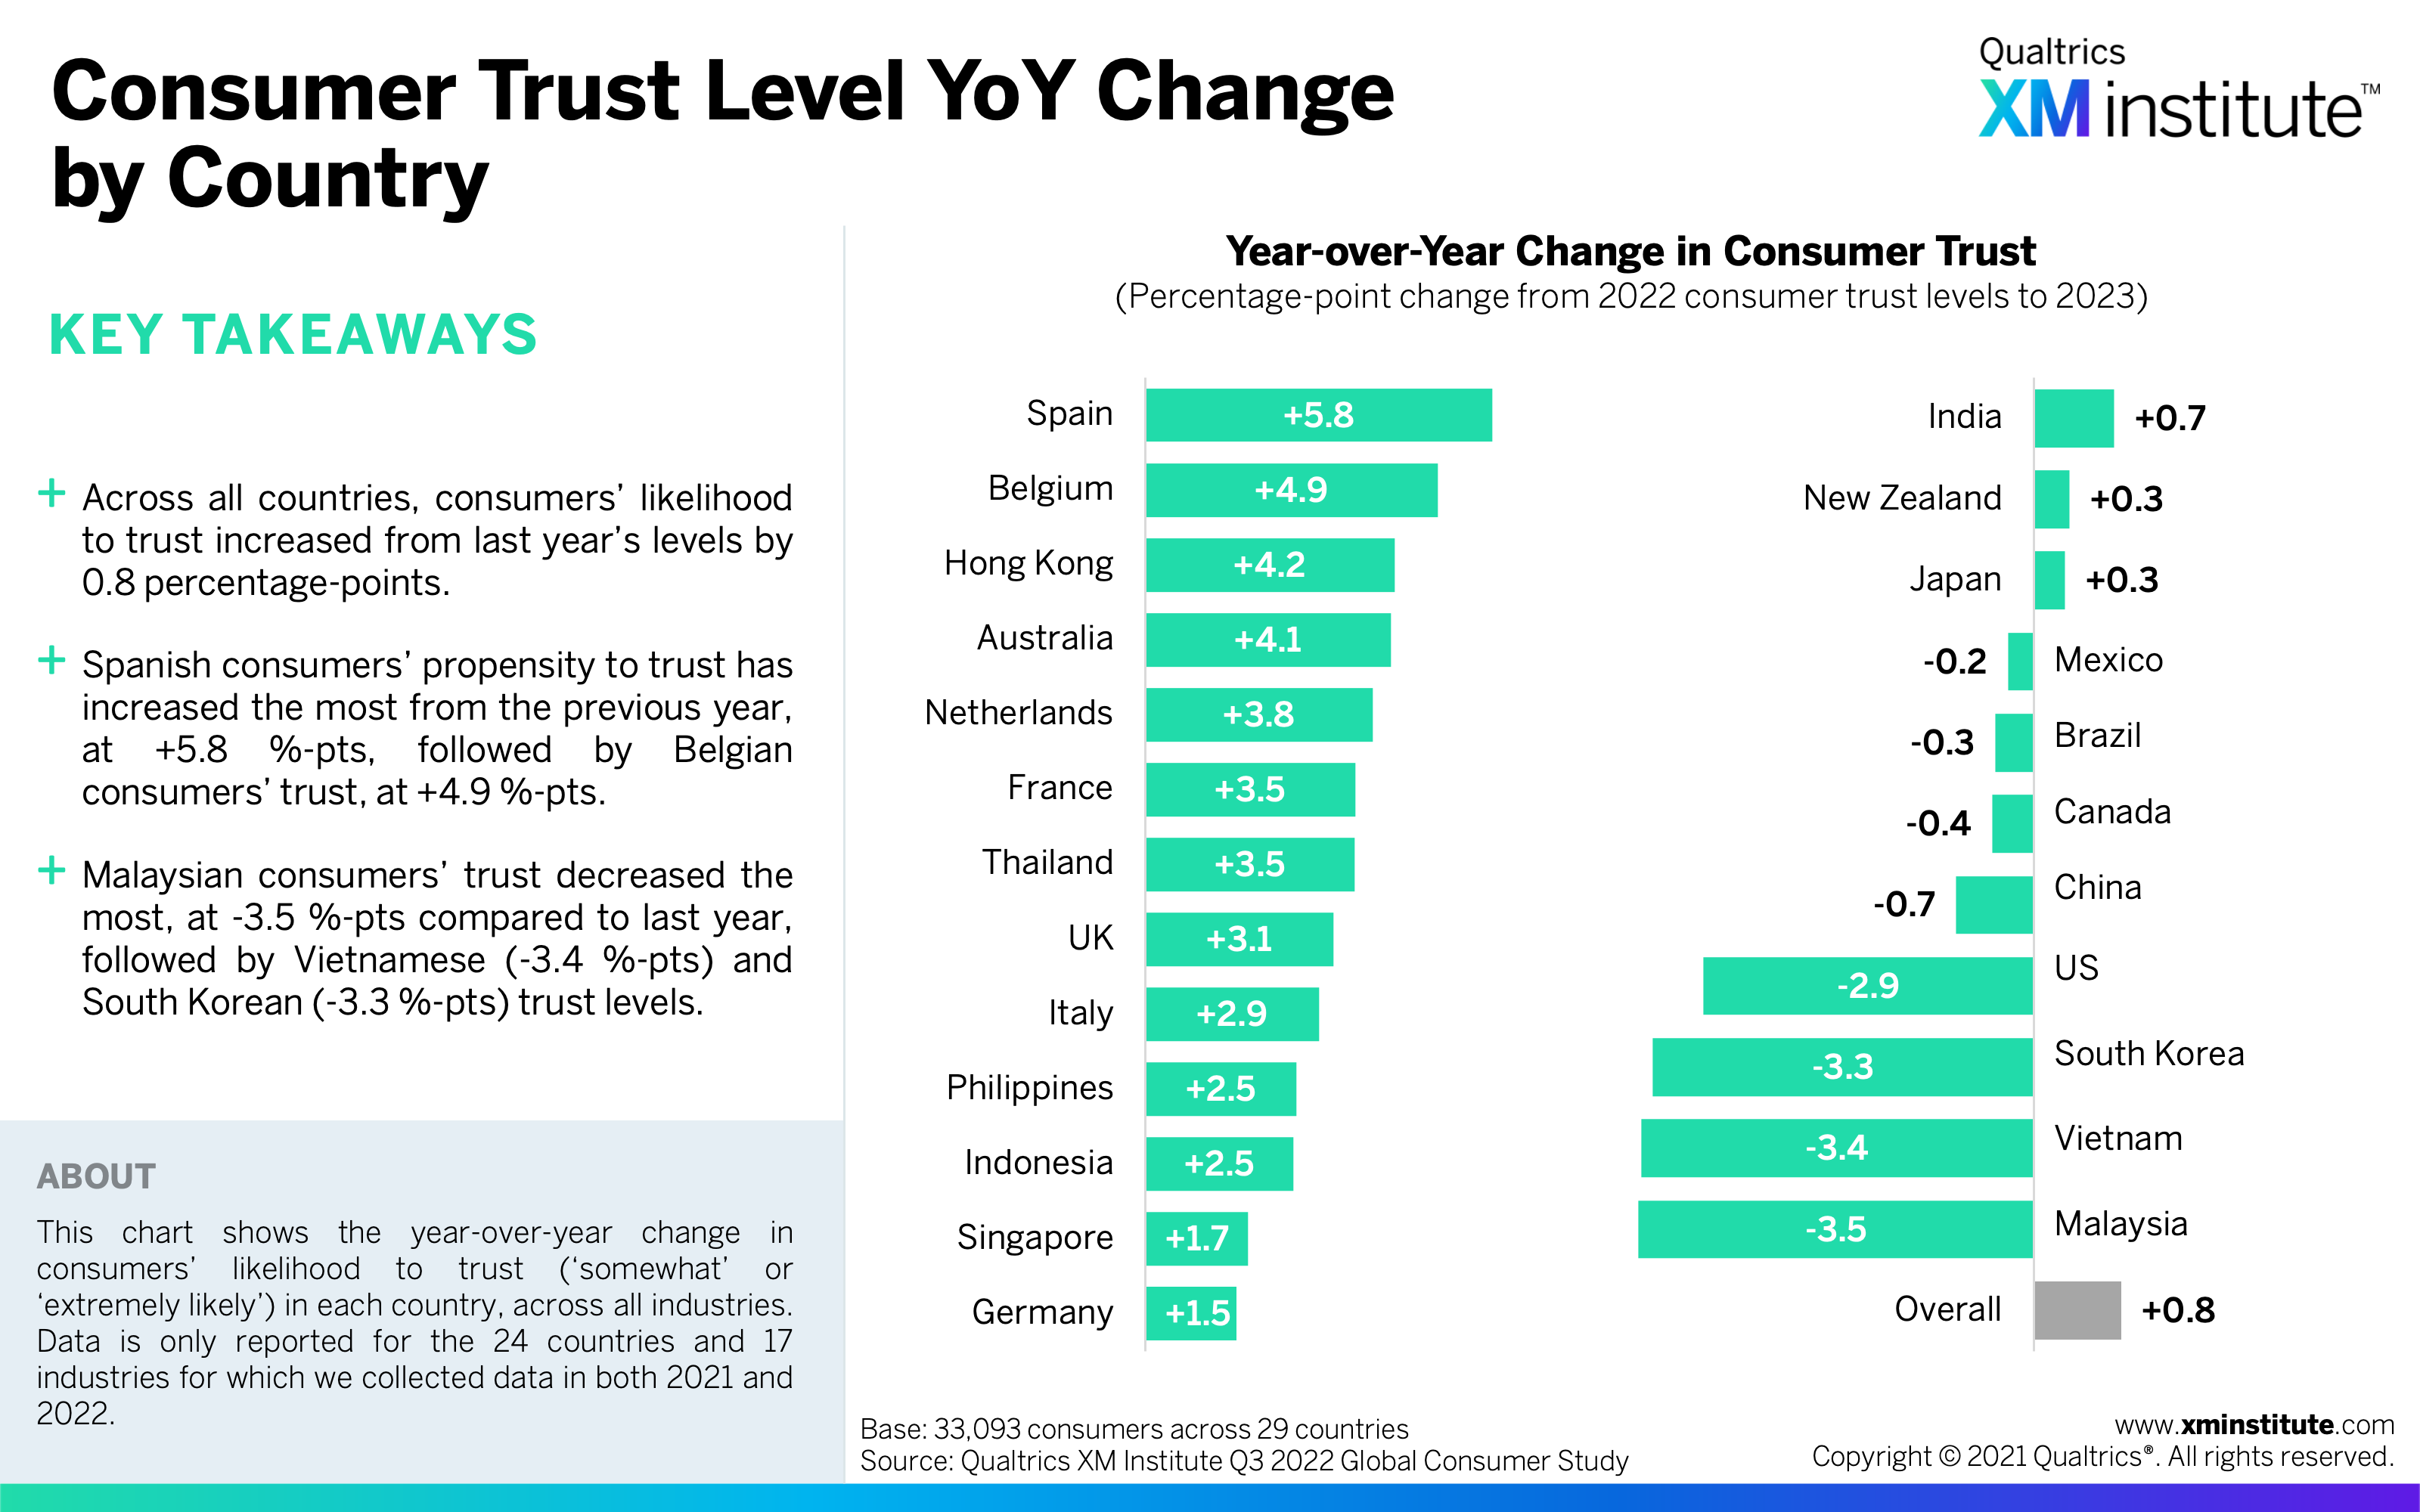
- Consumer Trust Level YoY Change by Country (see Figure 18)
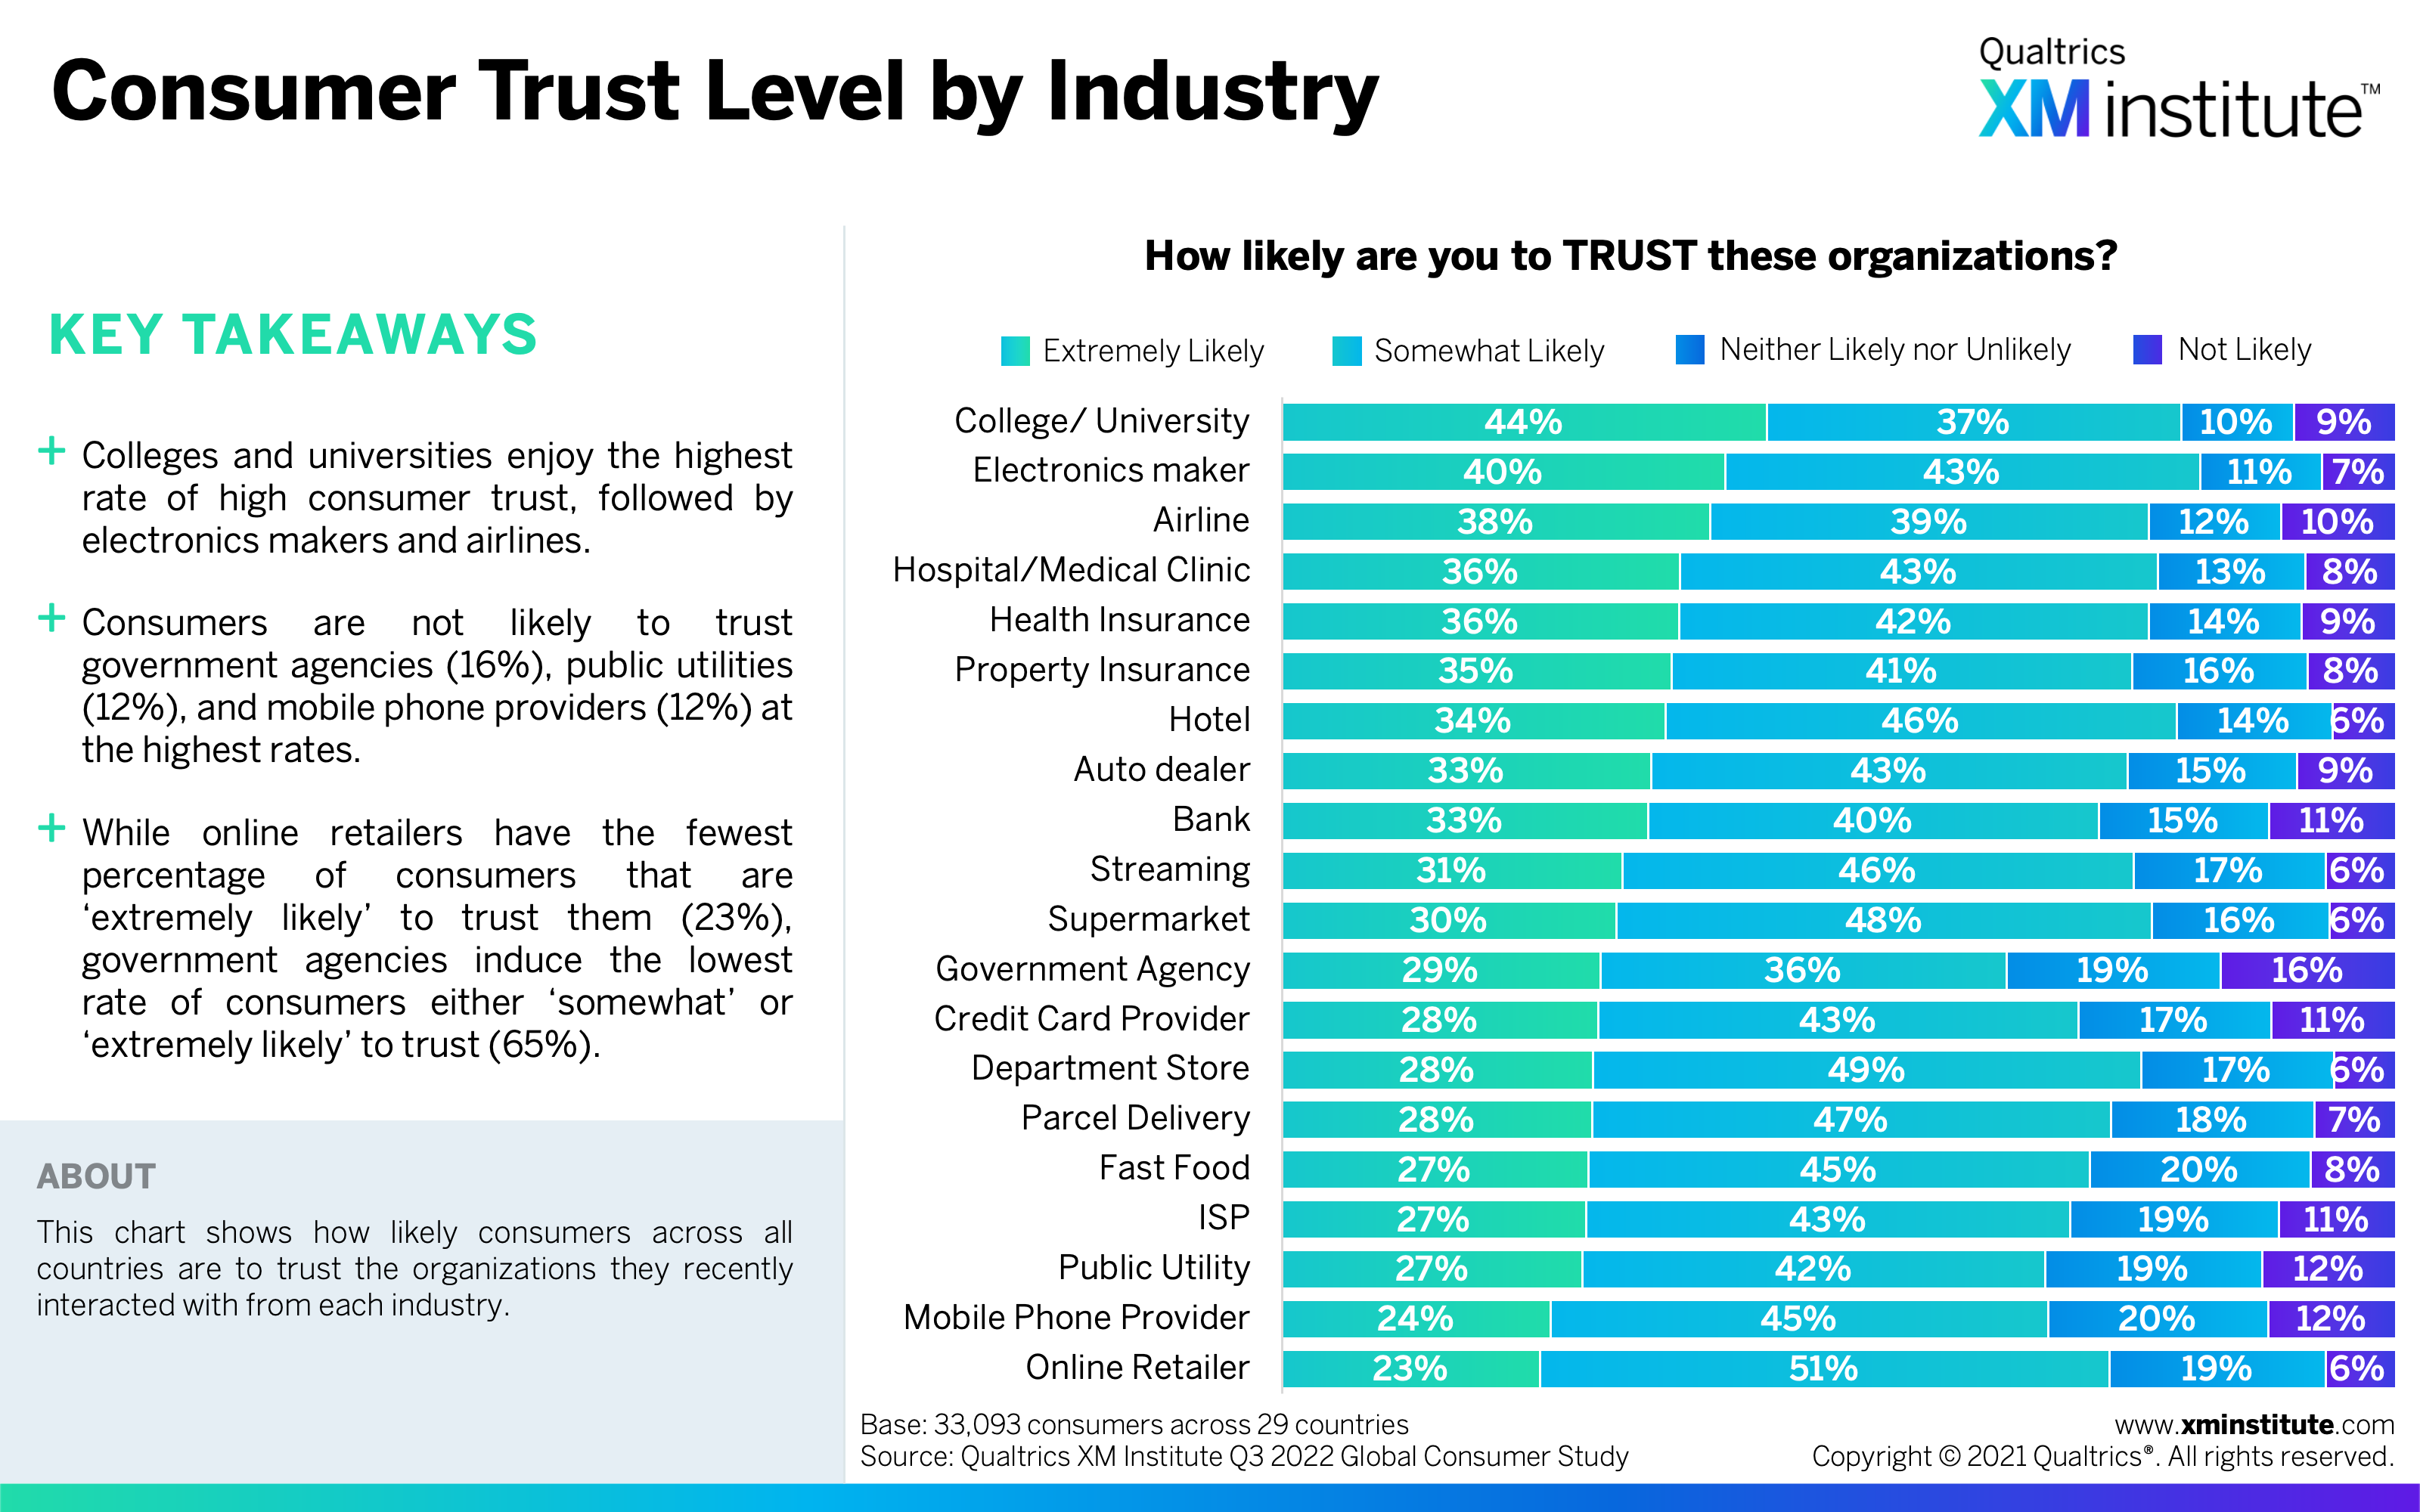
- Consumer Trust Level by Industry (see Figure 19)
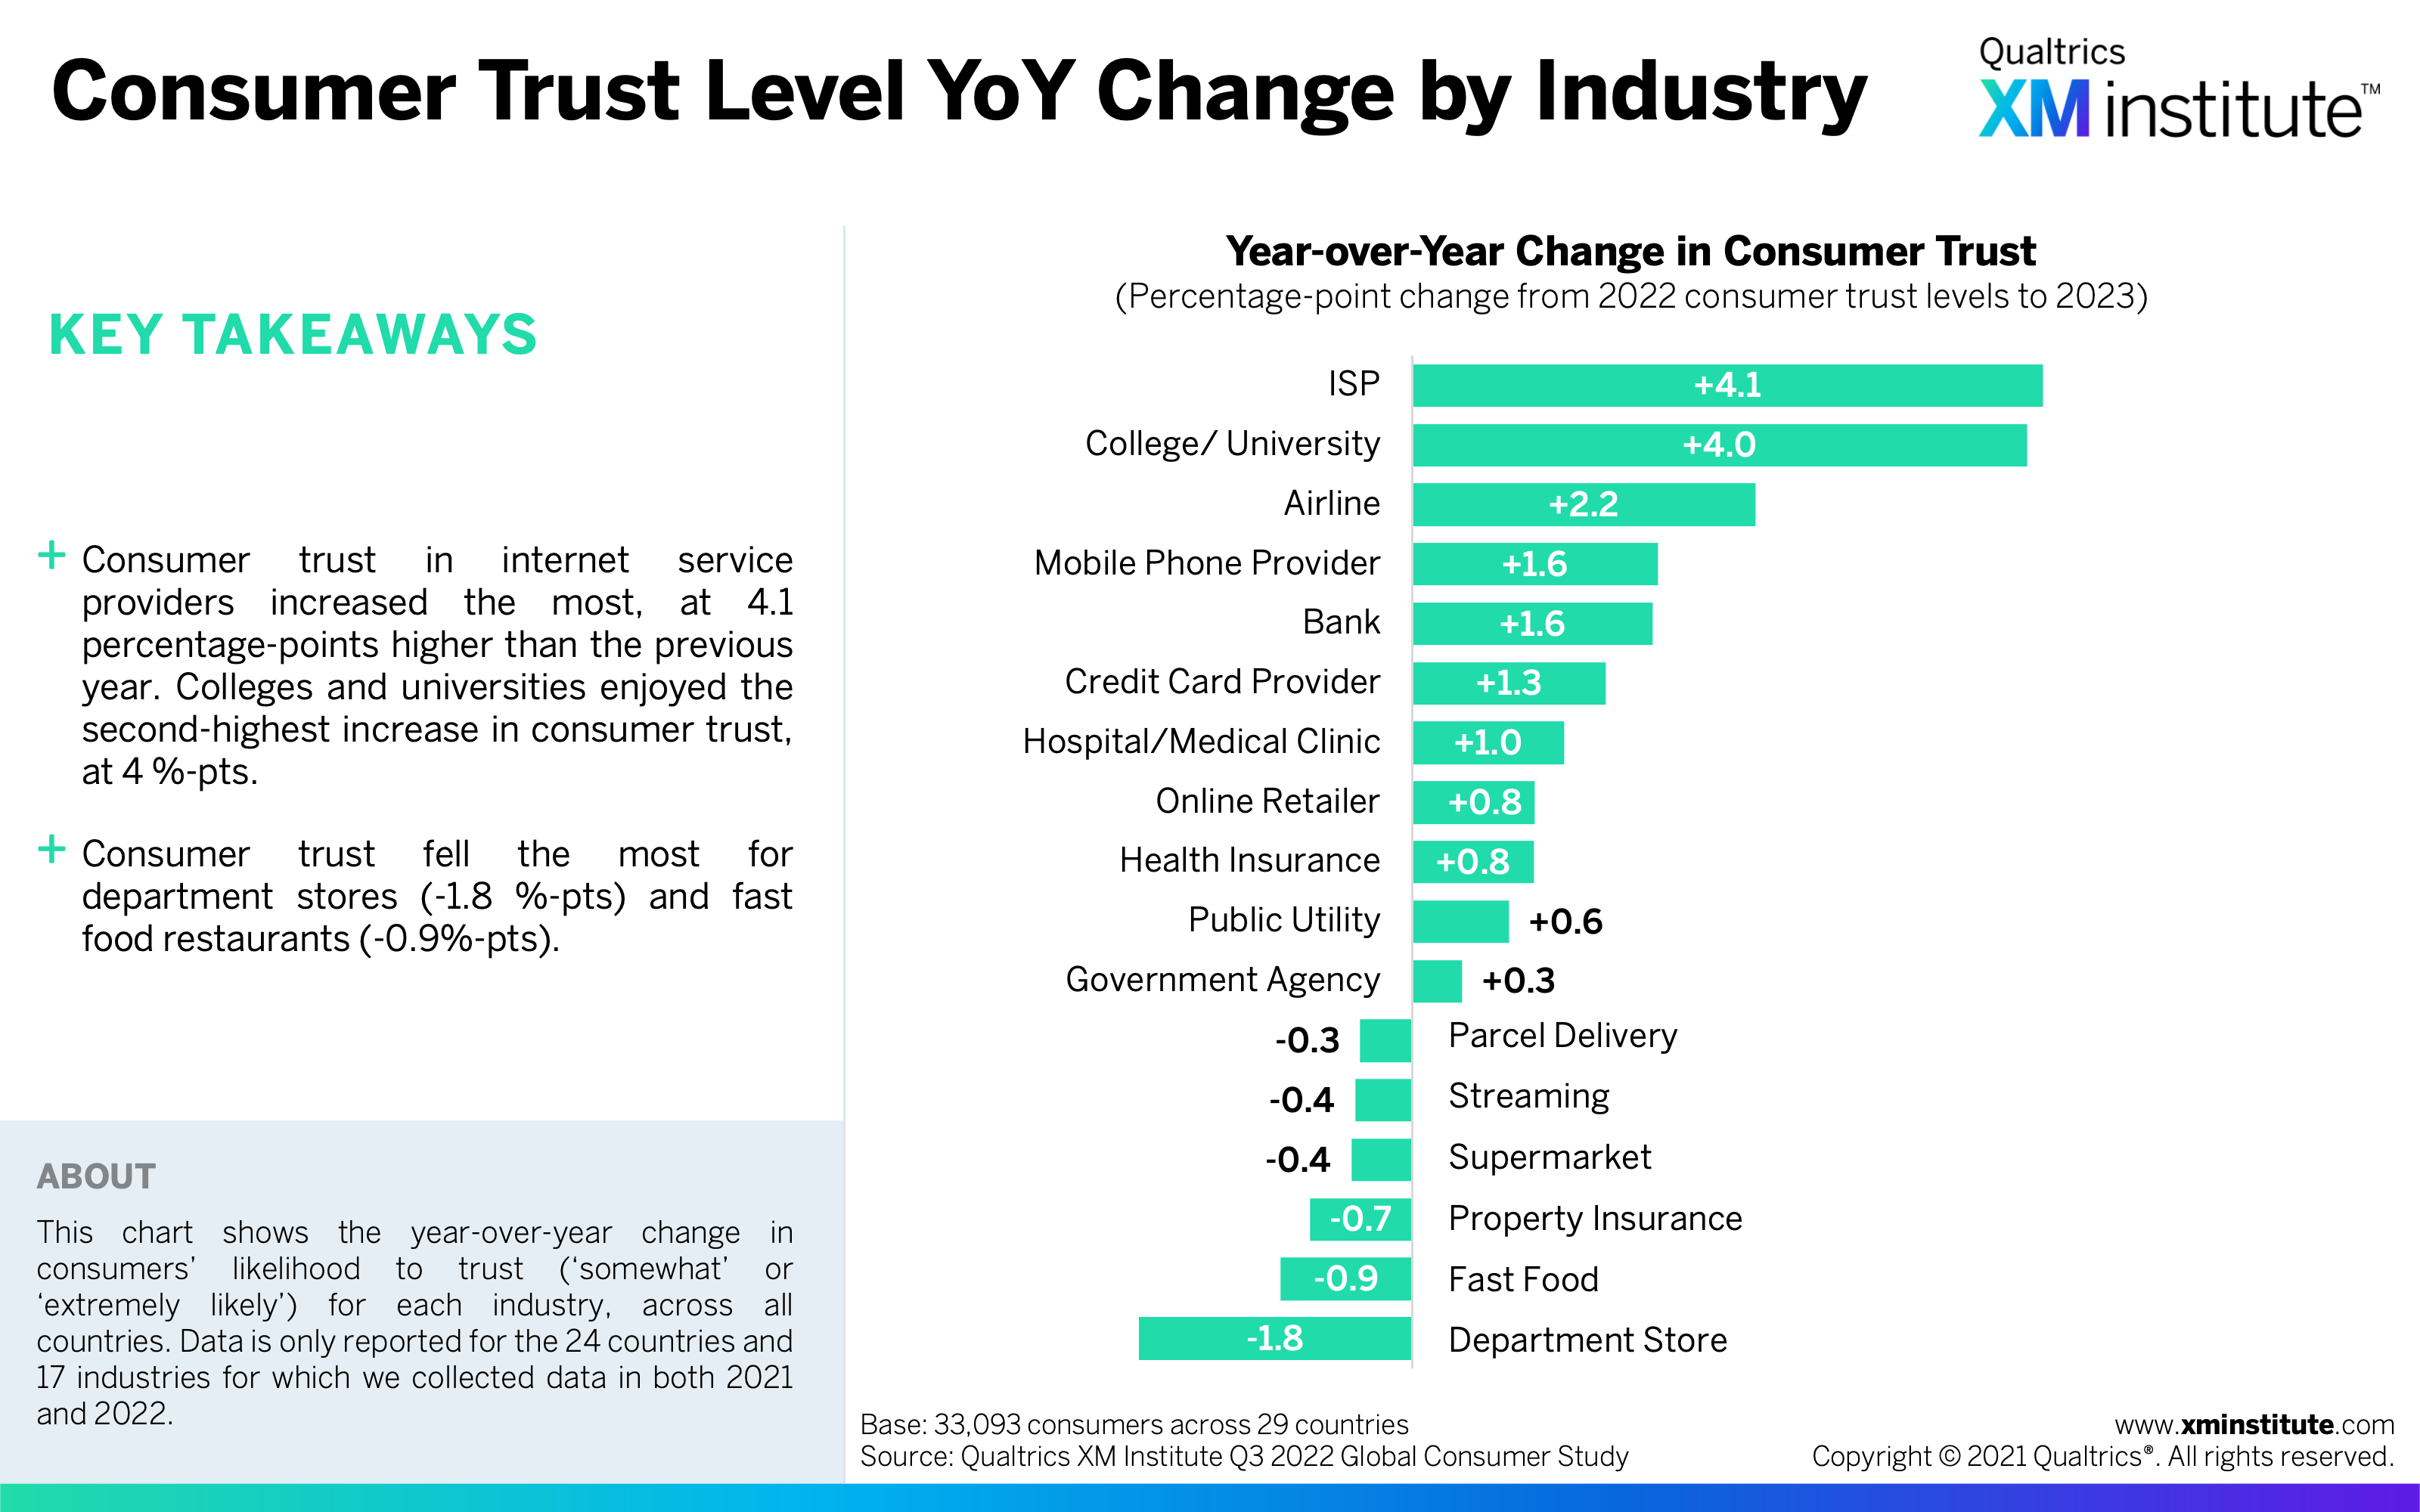
- Consumer Trust Level YoY Change by Industry (see Figure 20)
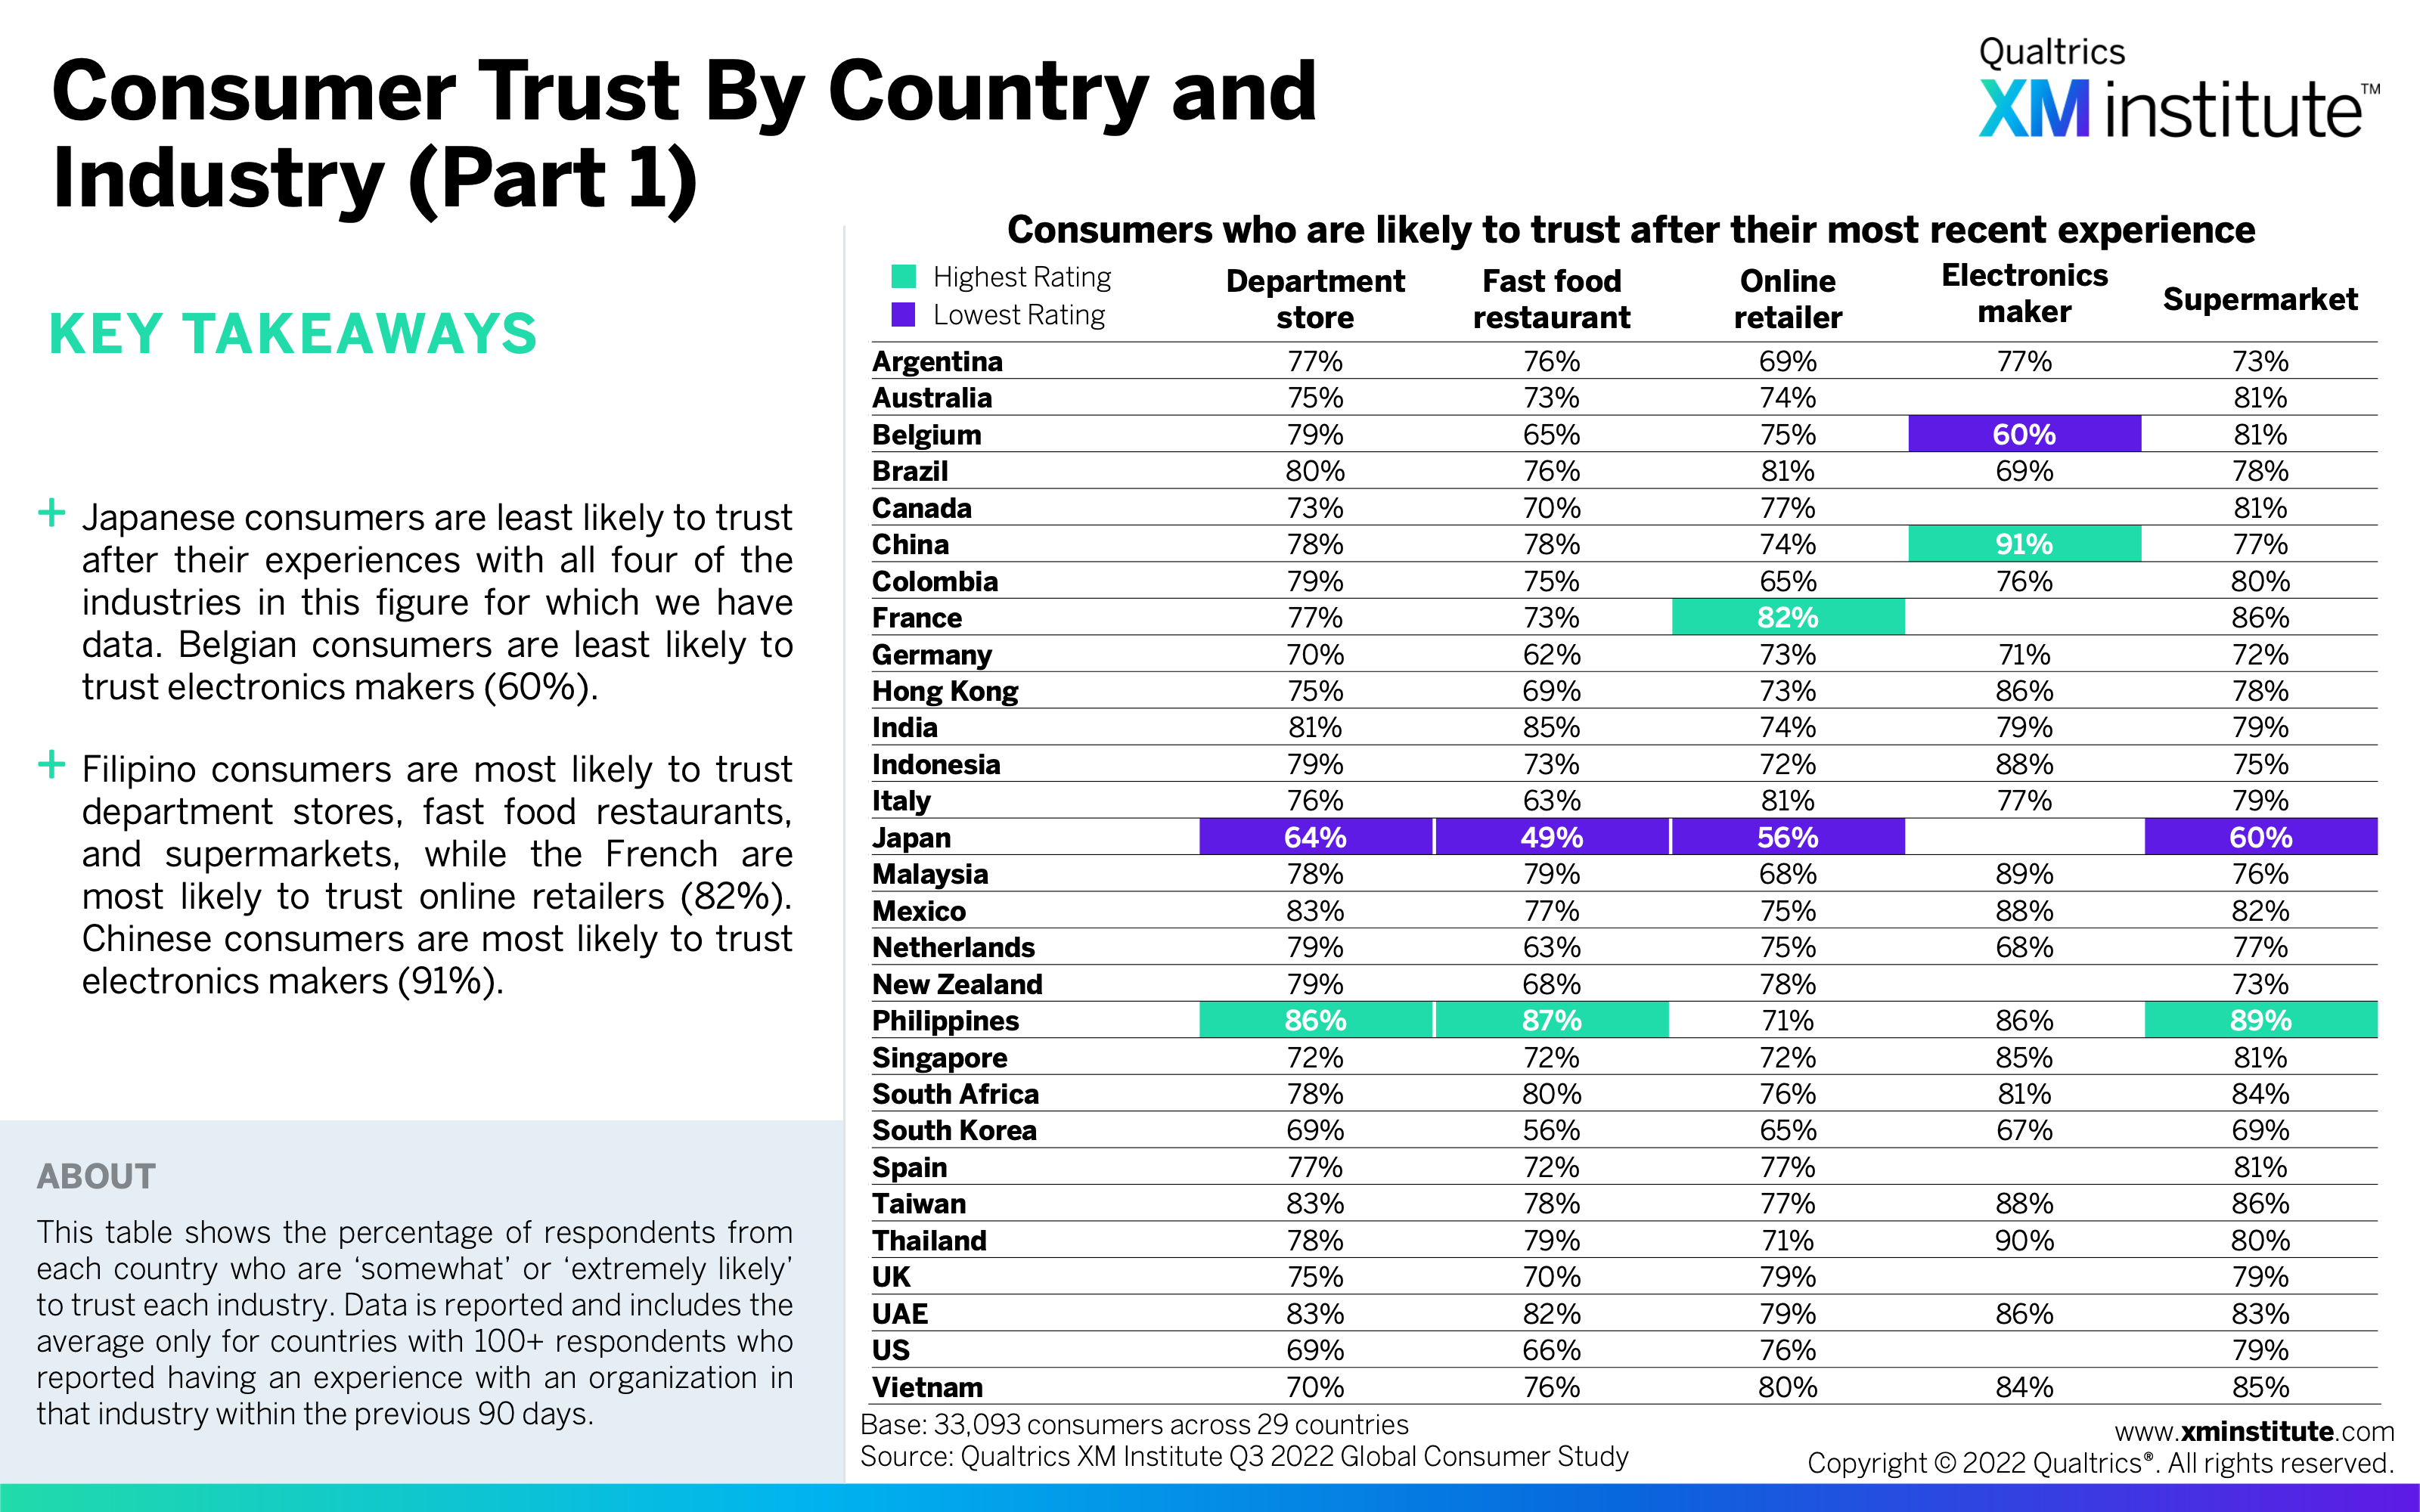
- Consumer Trust by Country and Industry (Part 1) (see Figure 21)
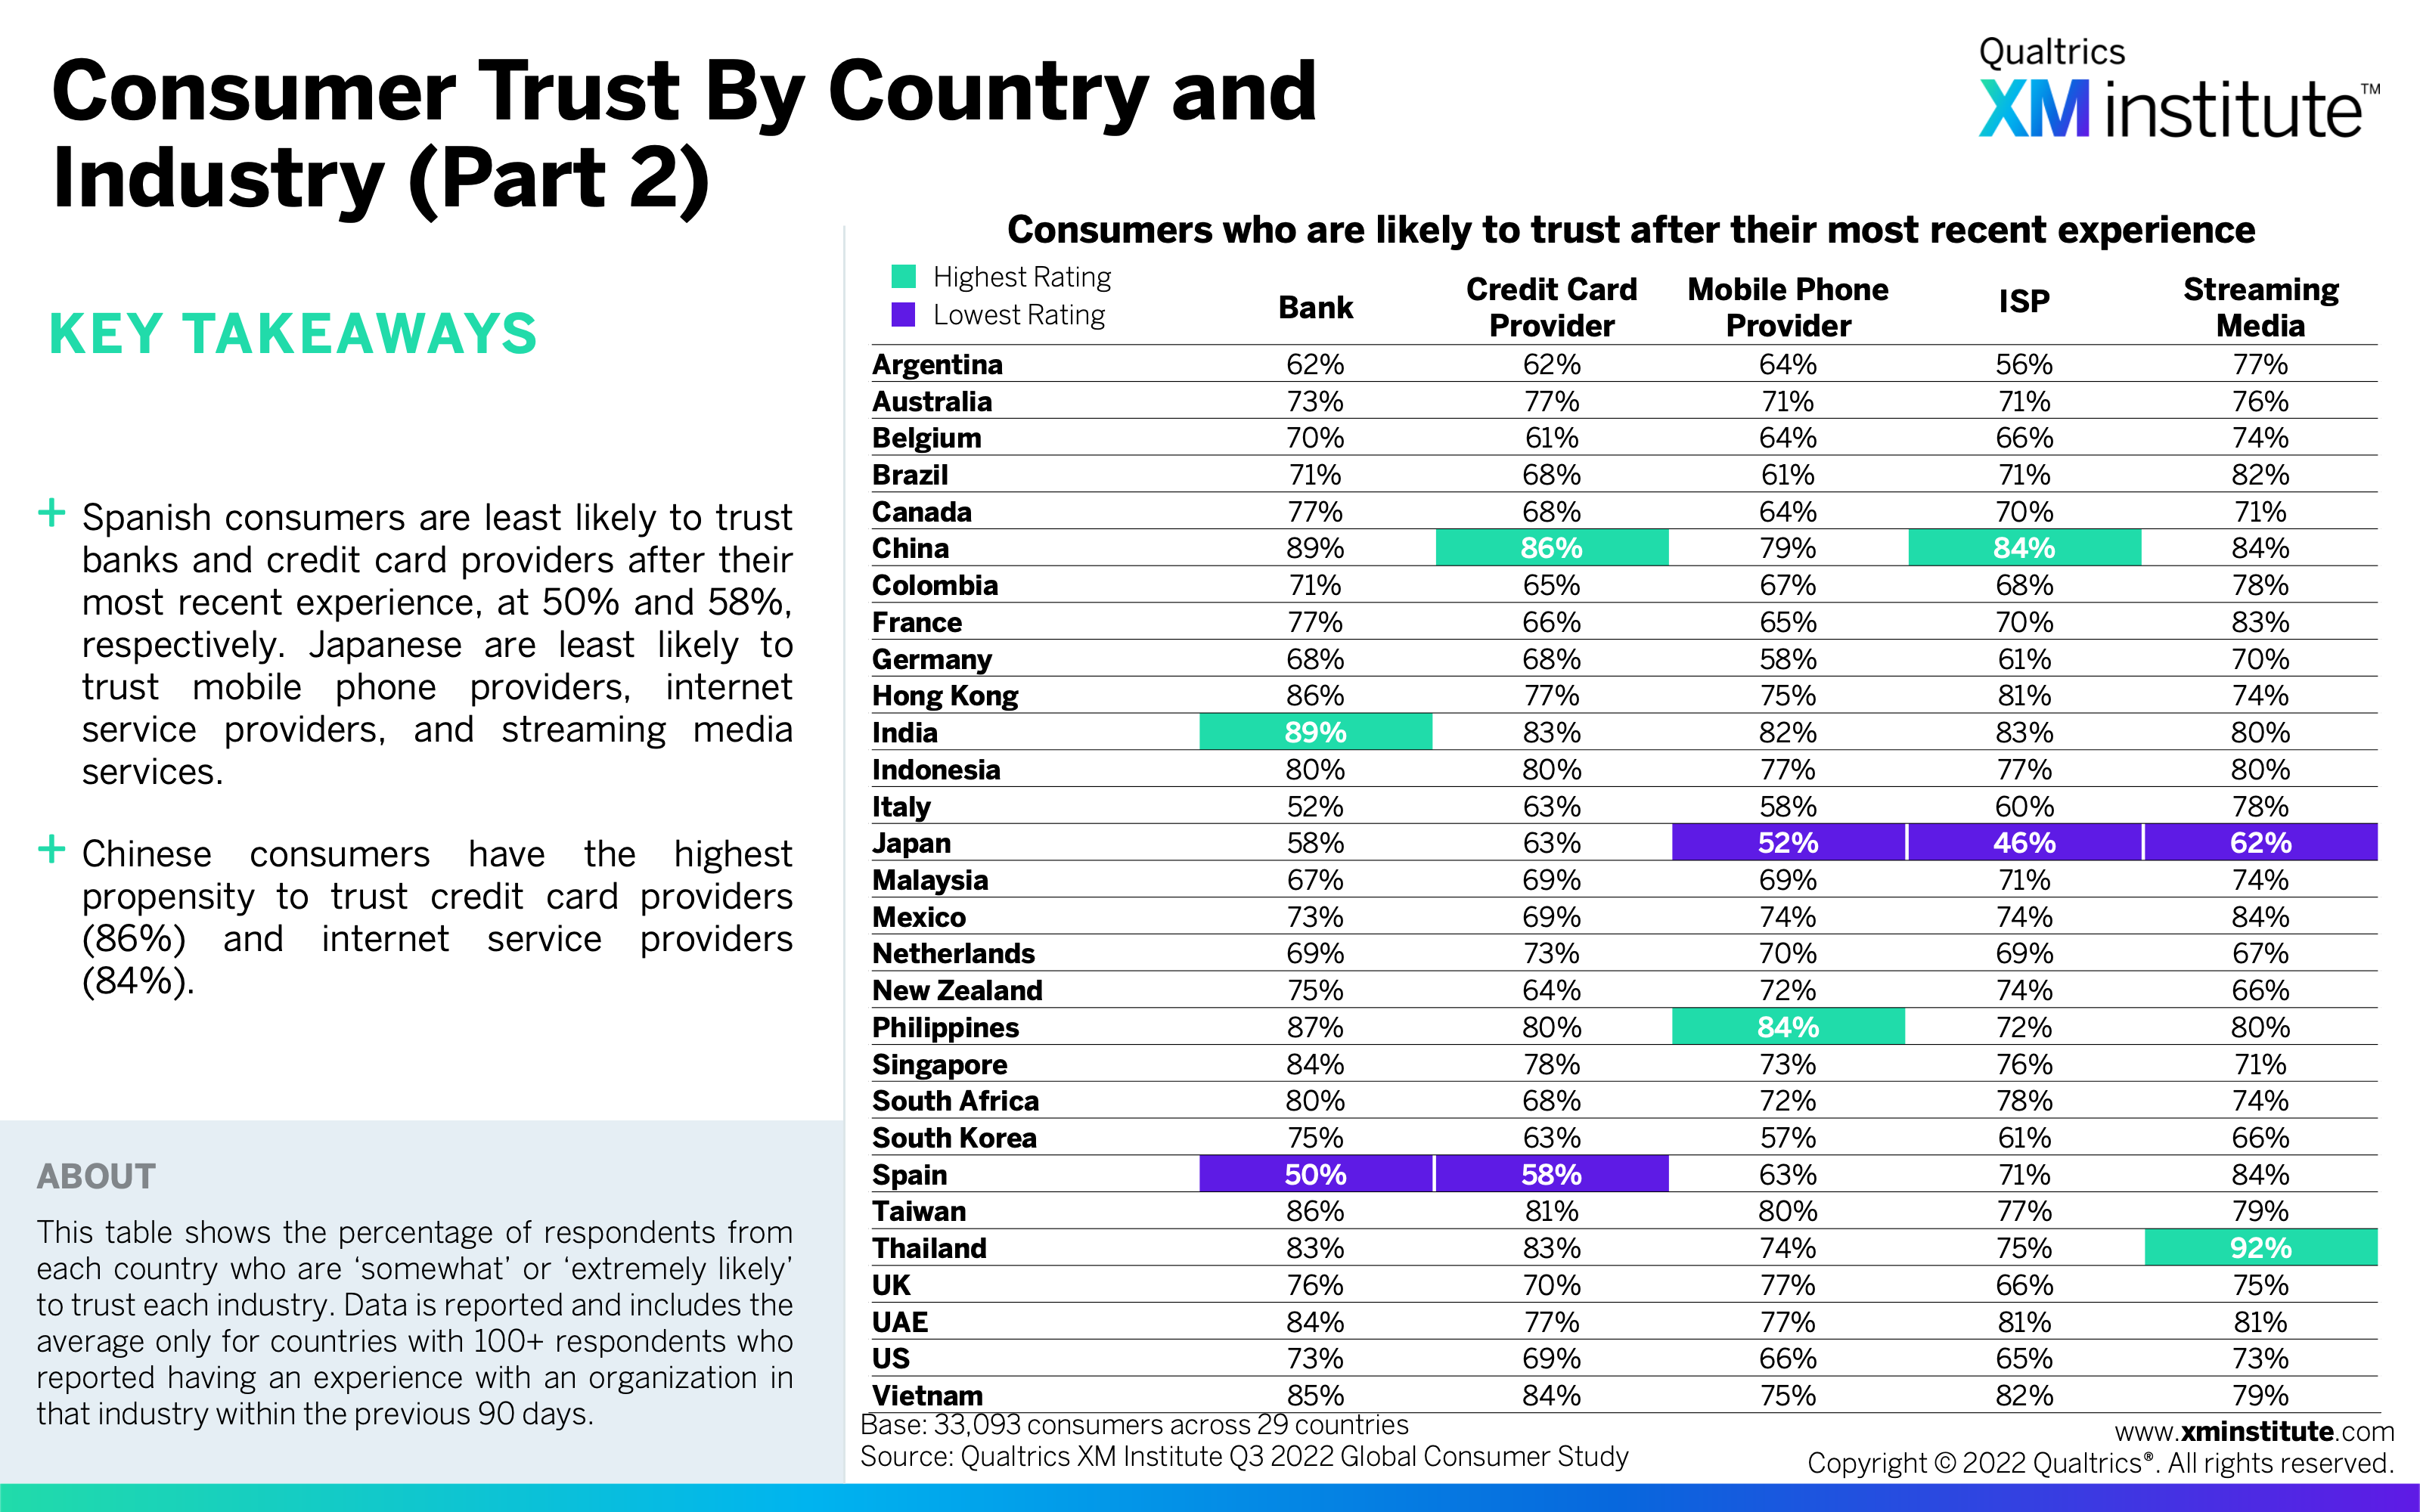
- Consumer Trust by Country and Industry (Part 2) (see Figure 22)
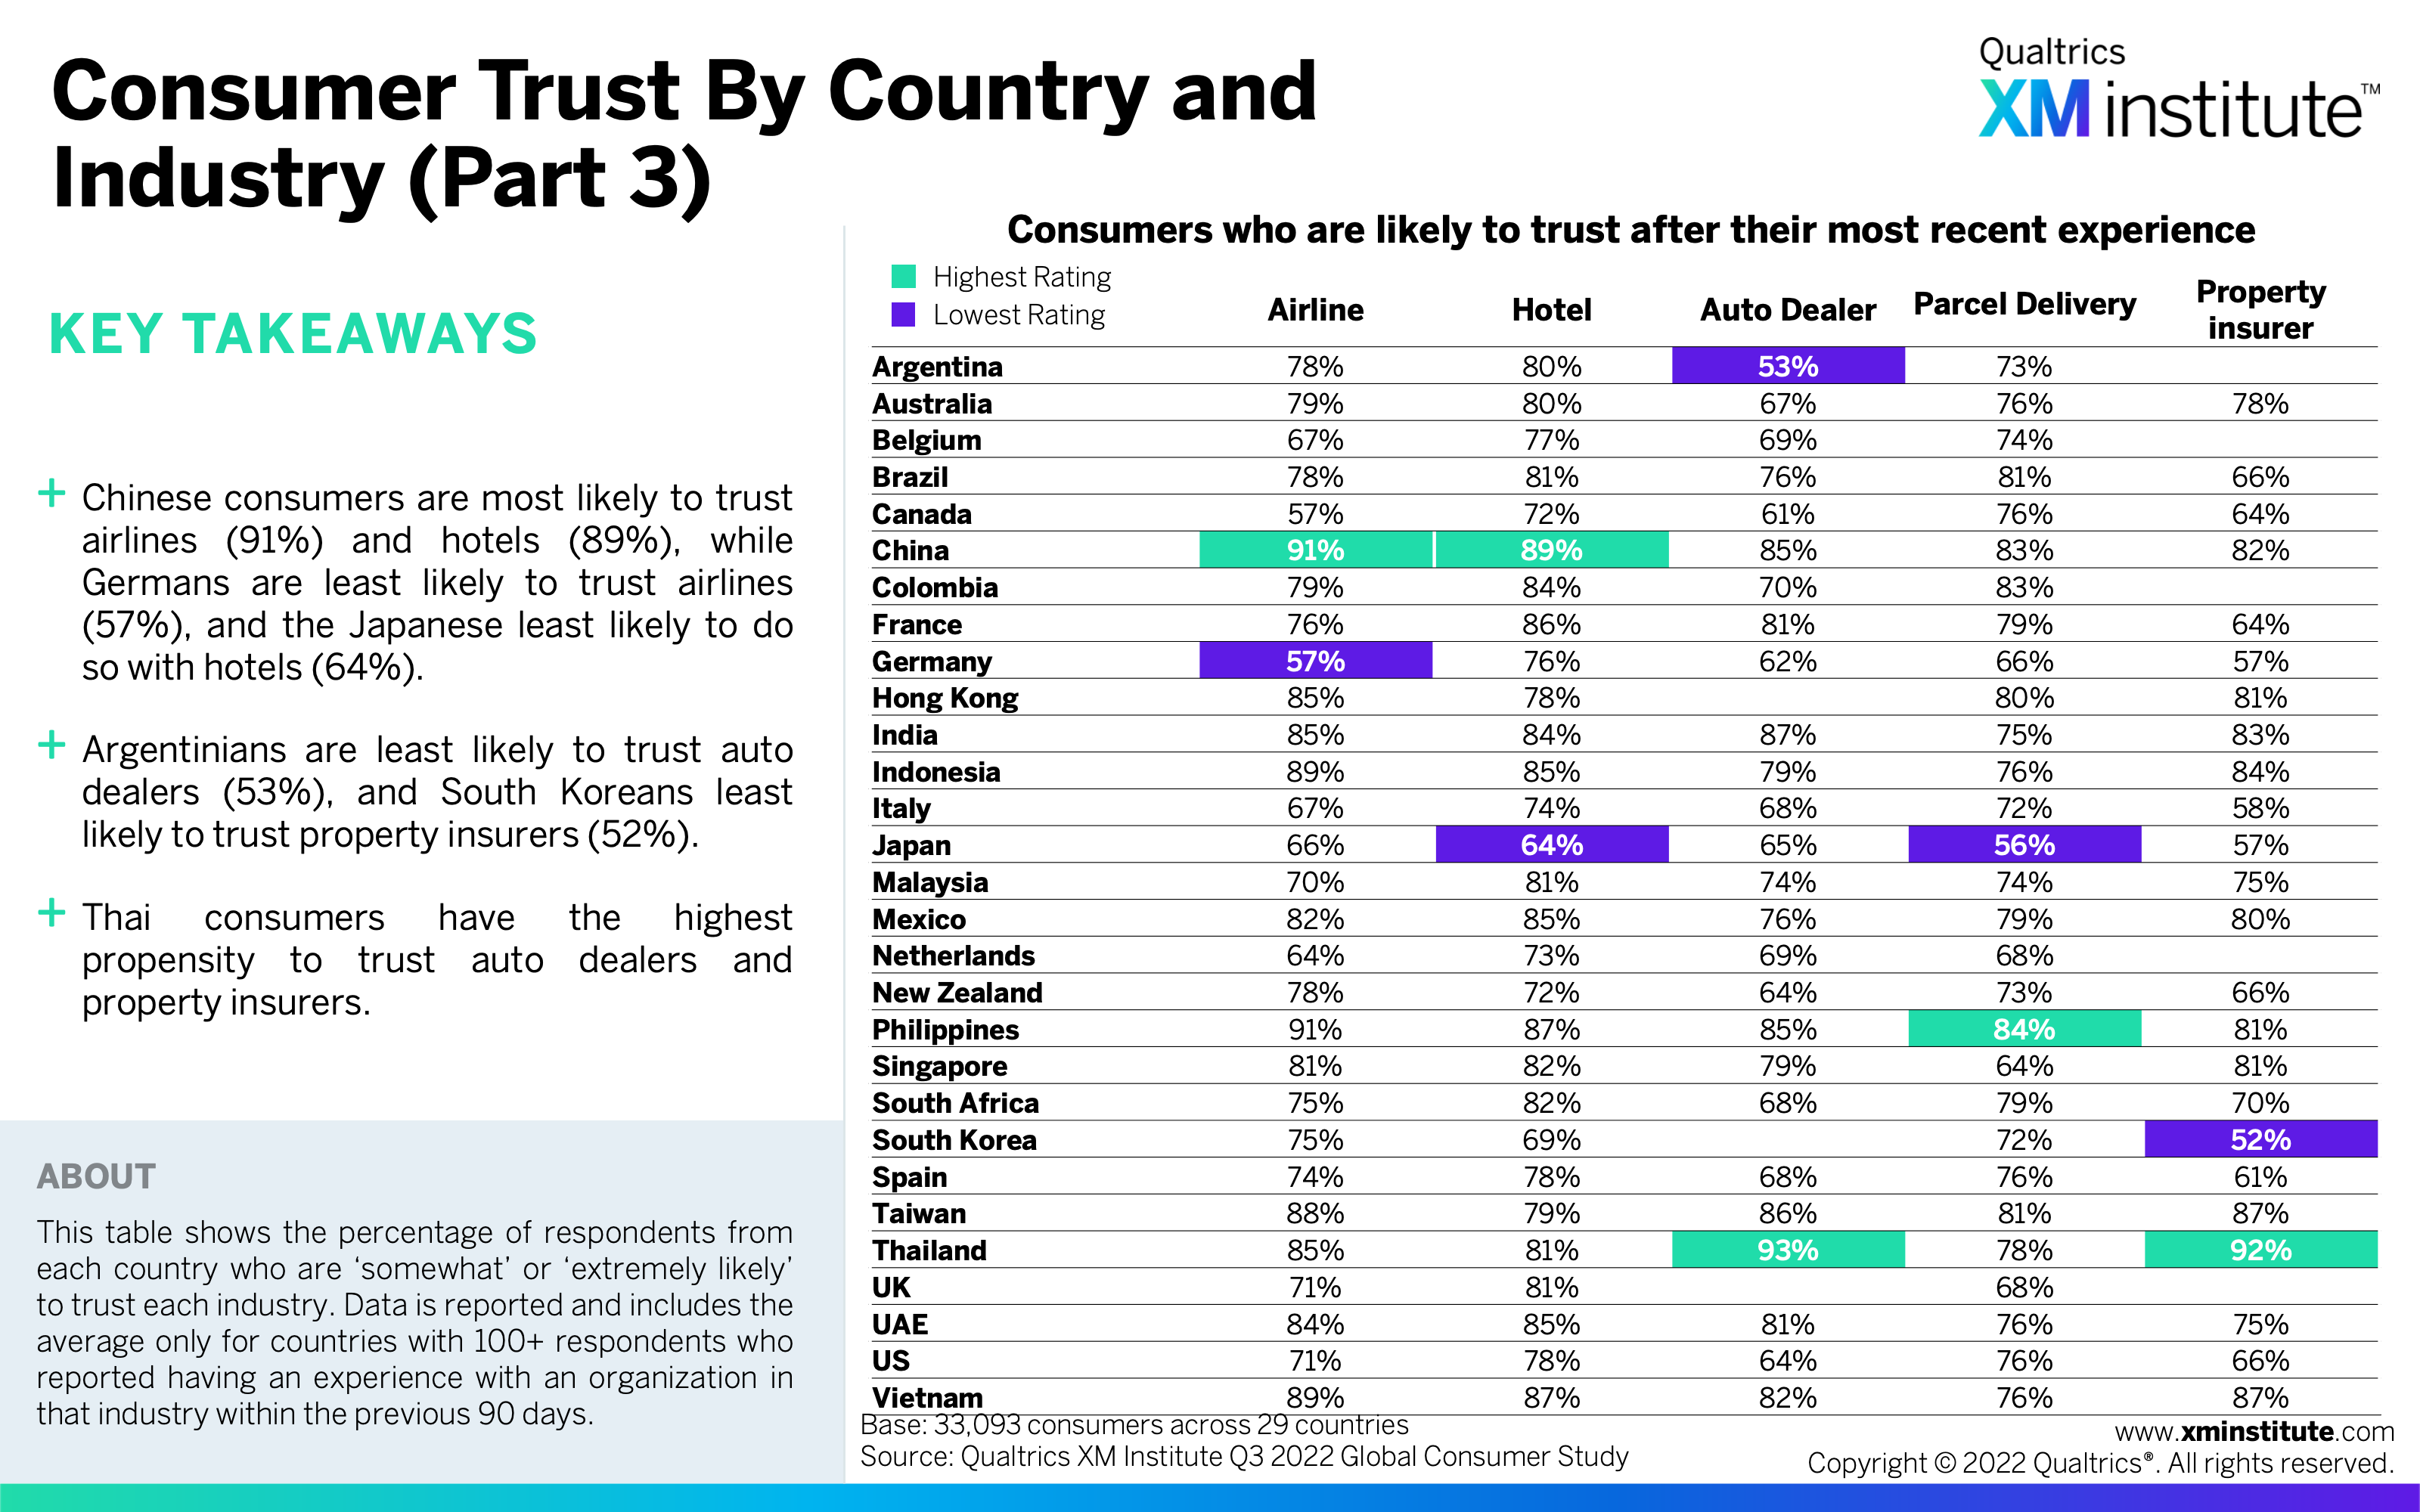
- Consumer Trust by Country and Industry (Part 3) (see Figure 23)
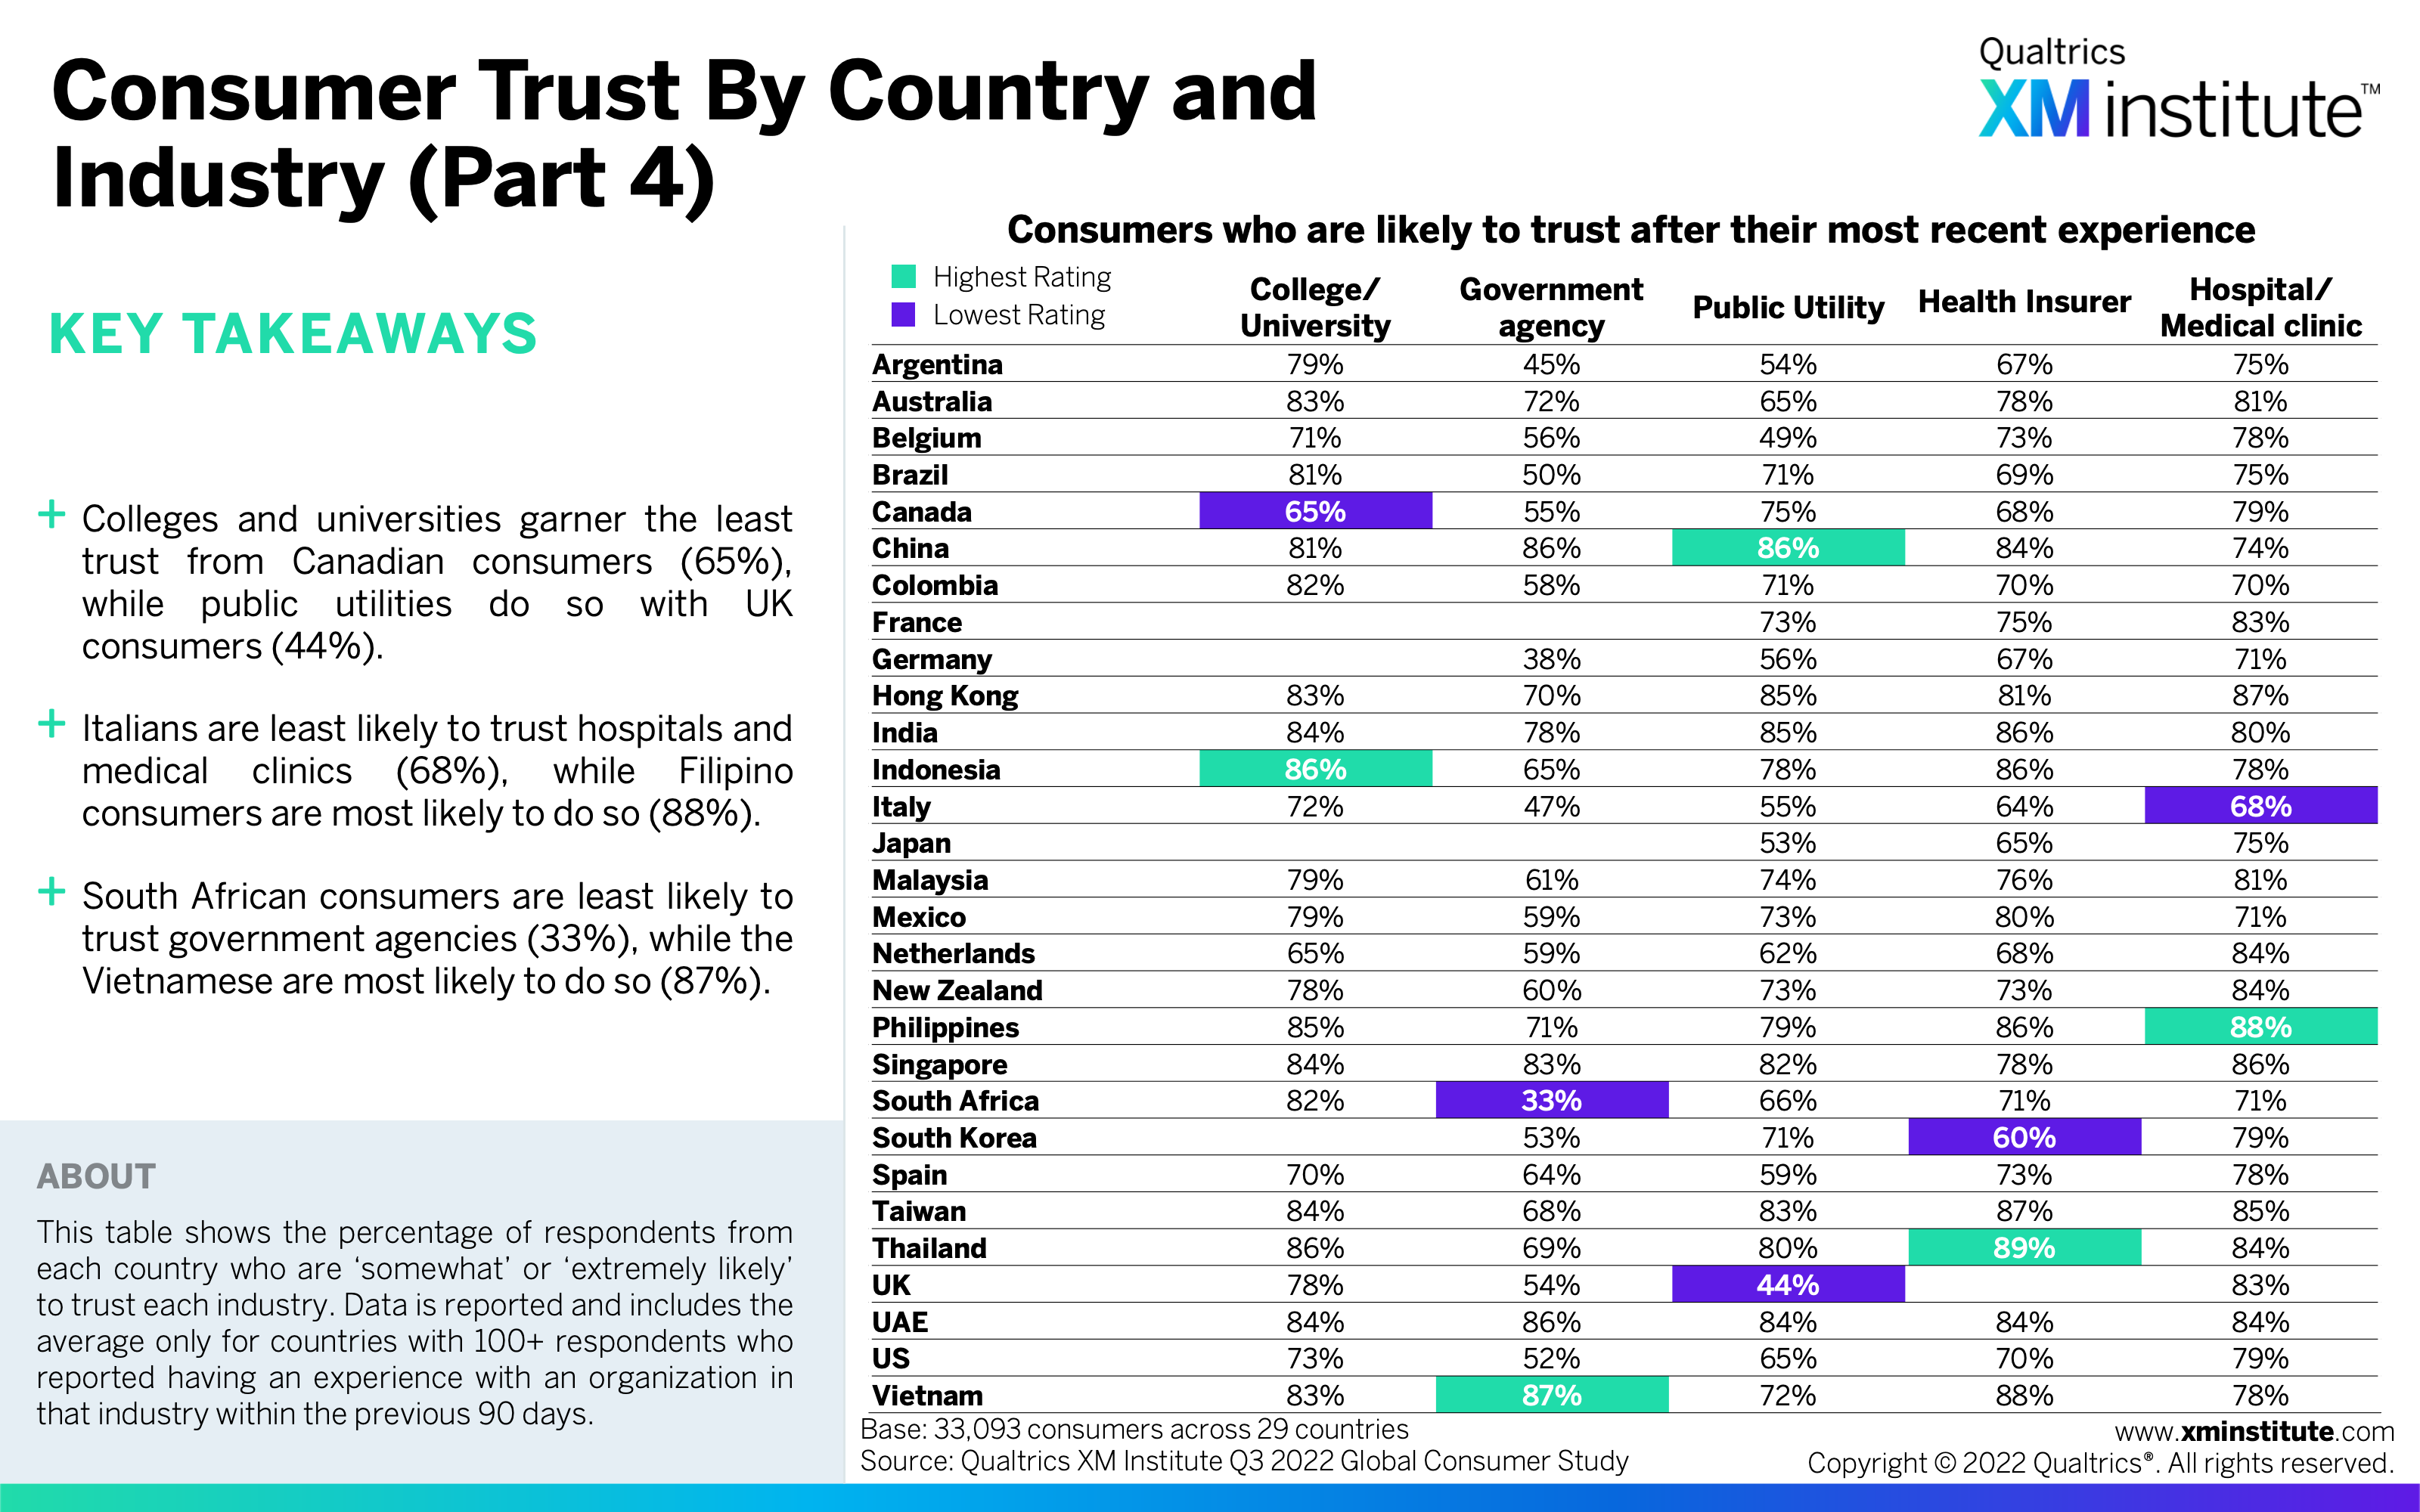
- Consumer Trust by Country and Industry (Part 4) (see Figure 24)
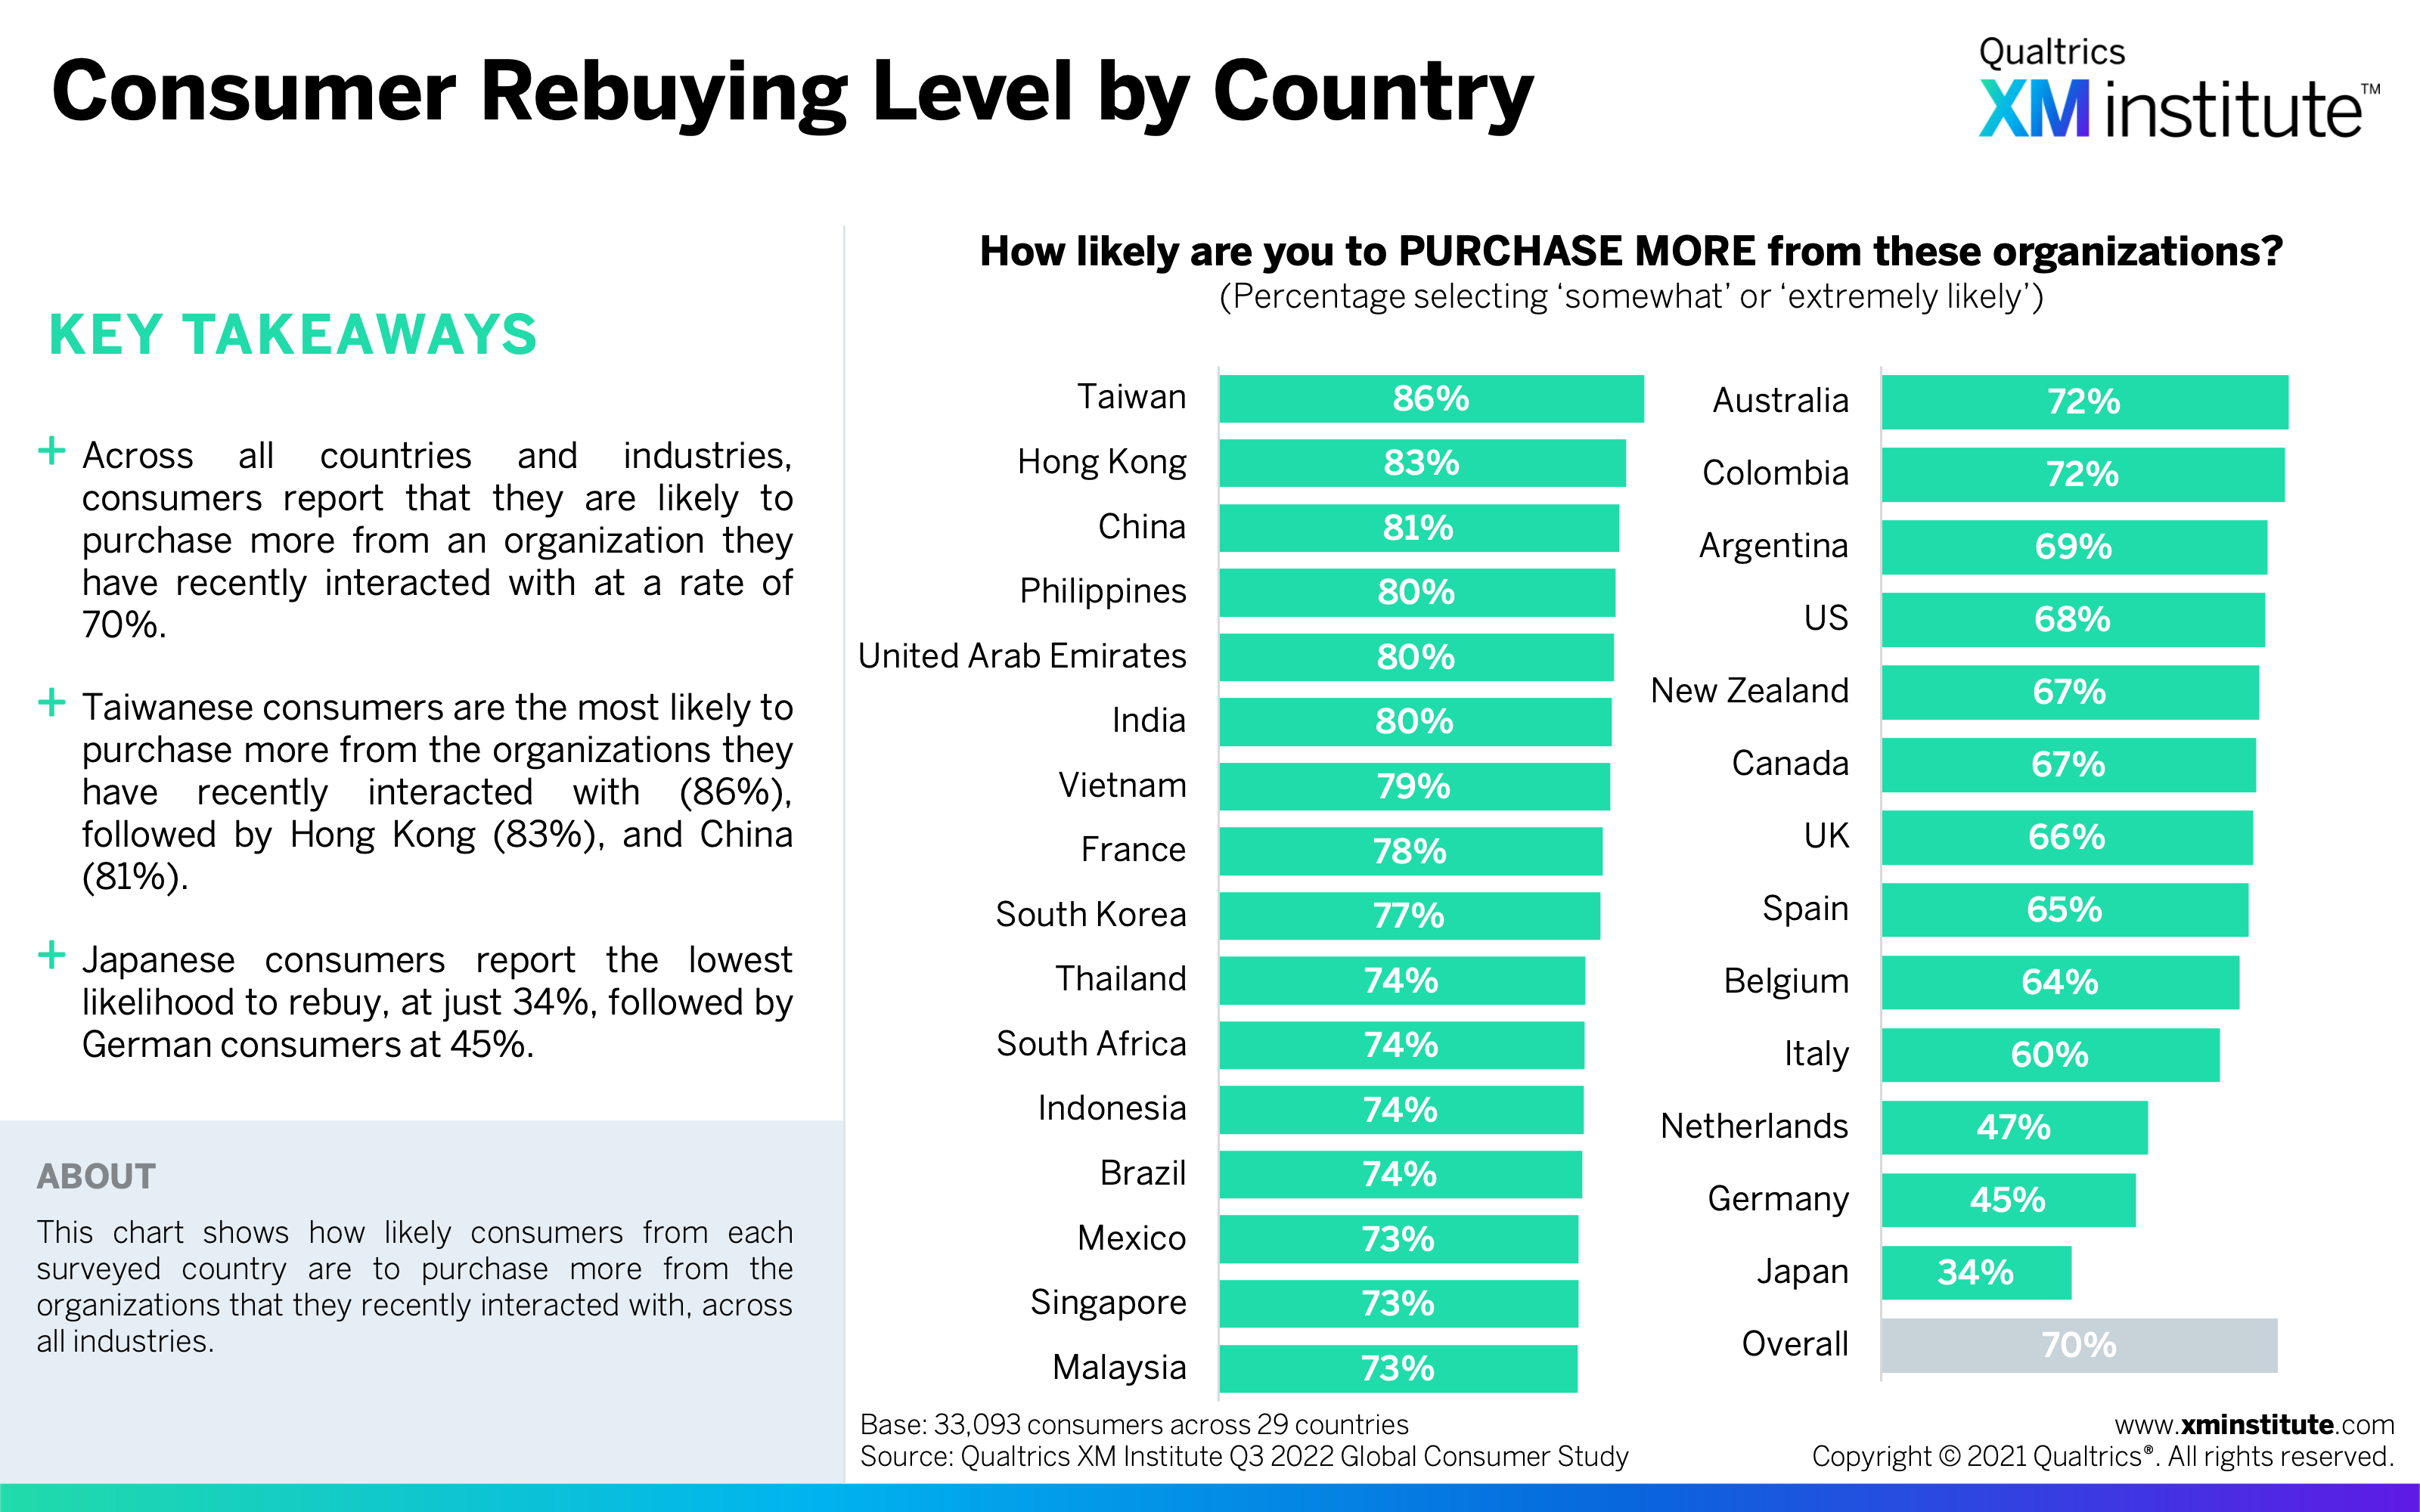
- Consumer Rebuying Level by Country (see Figure 25)
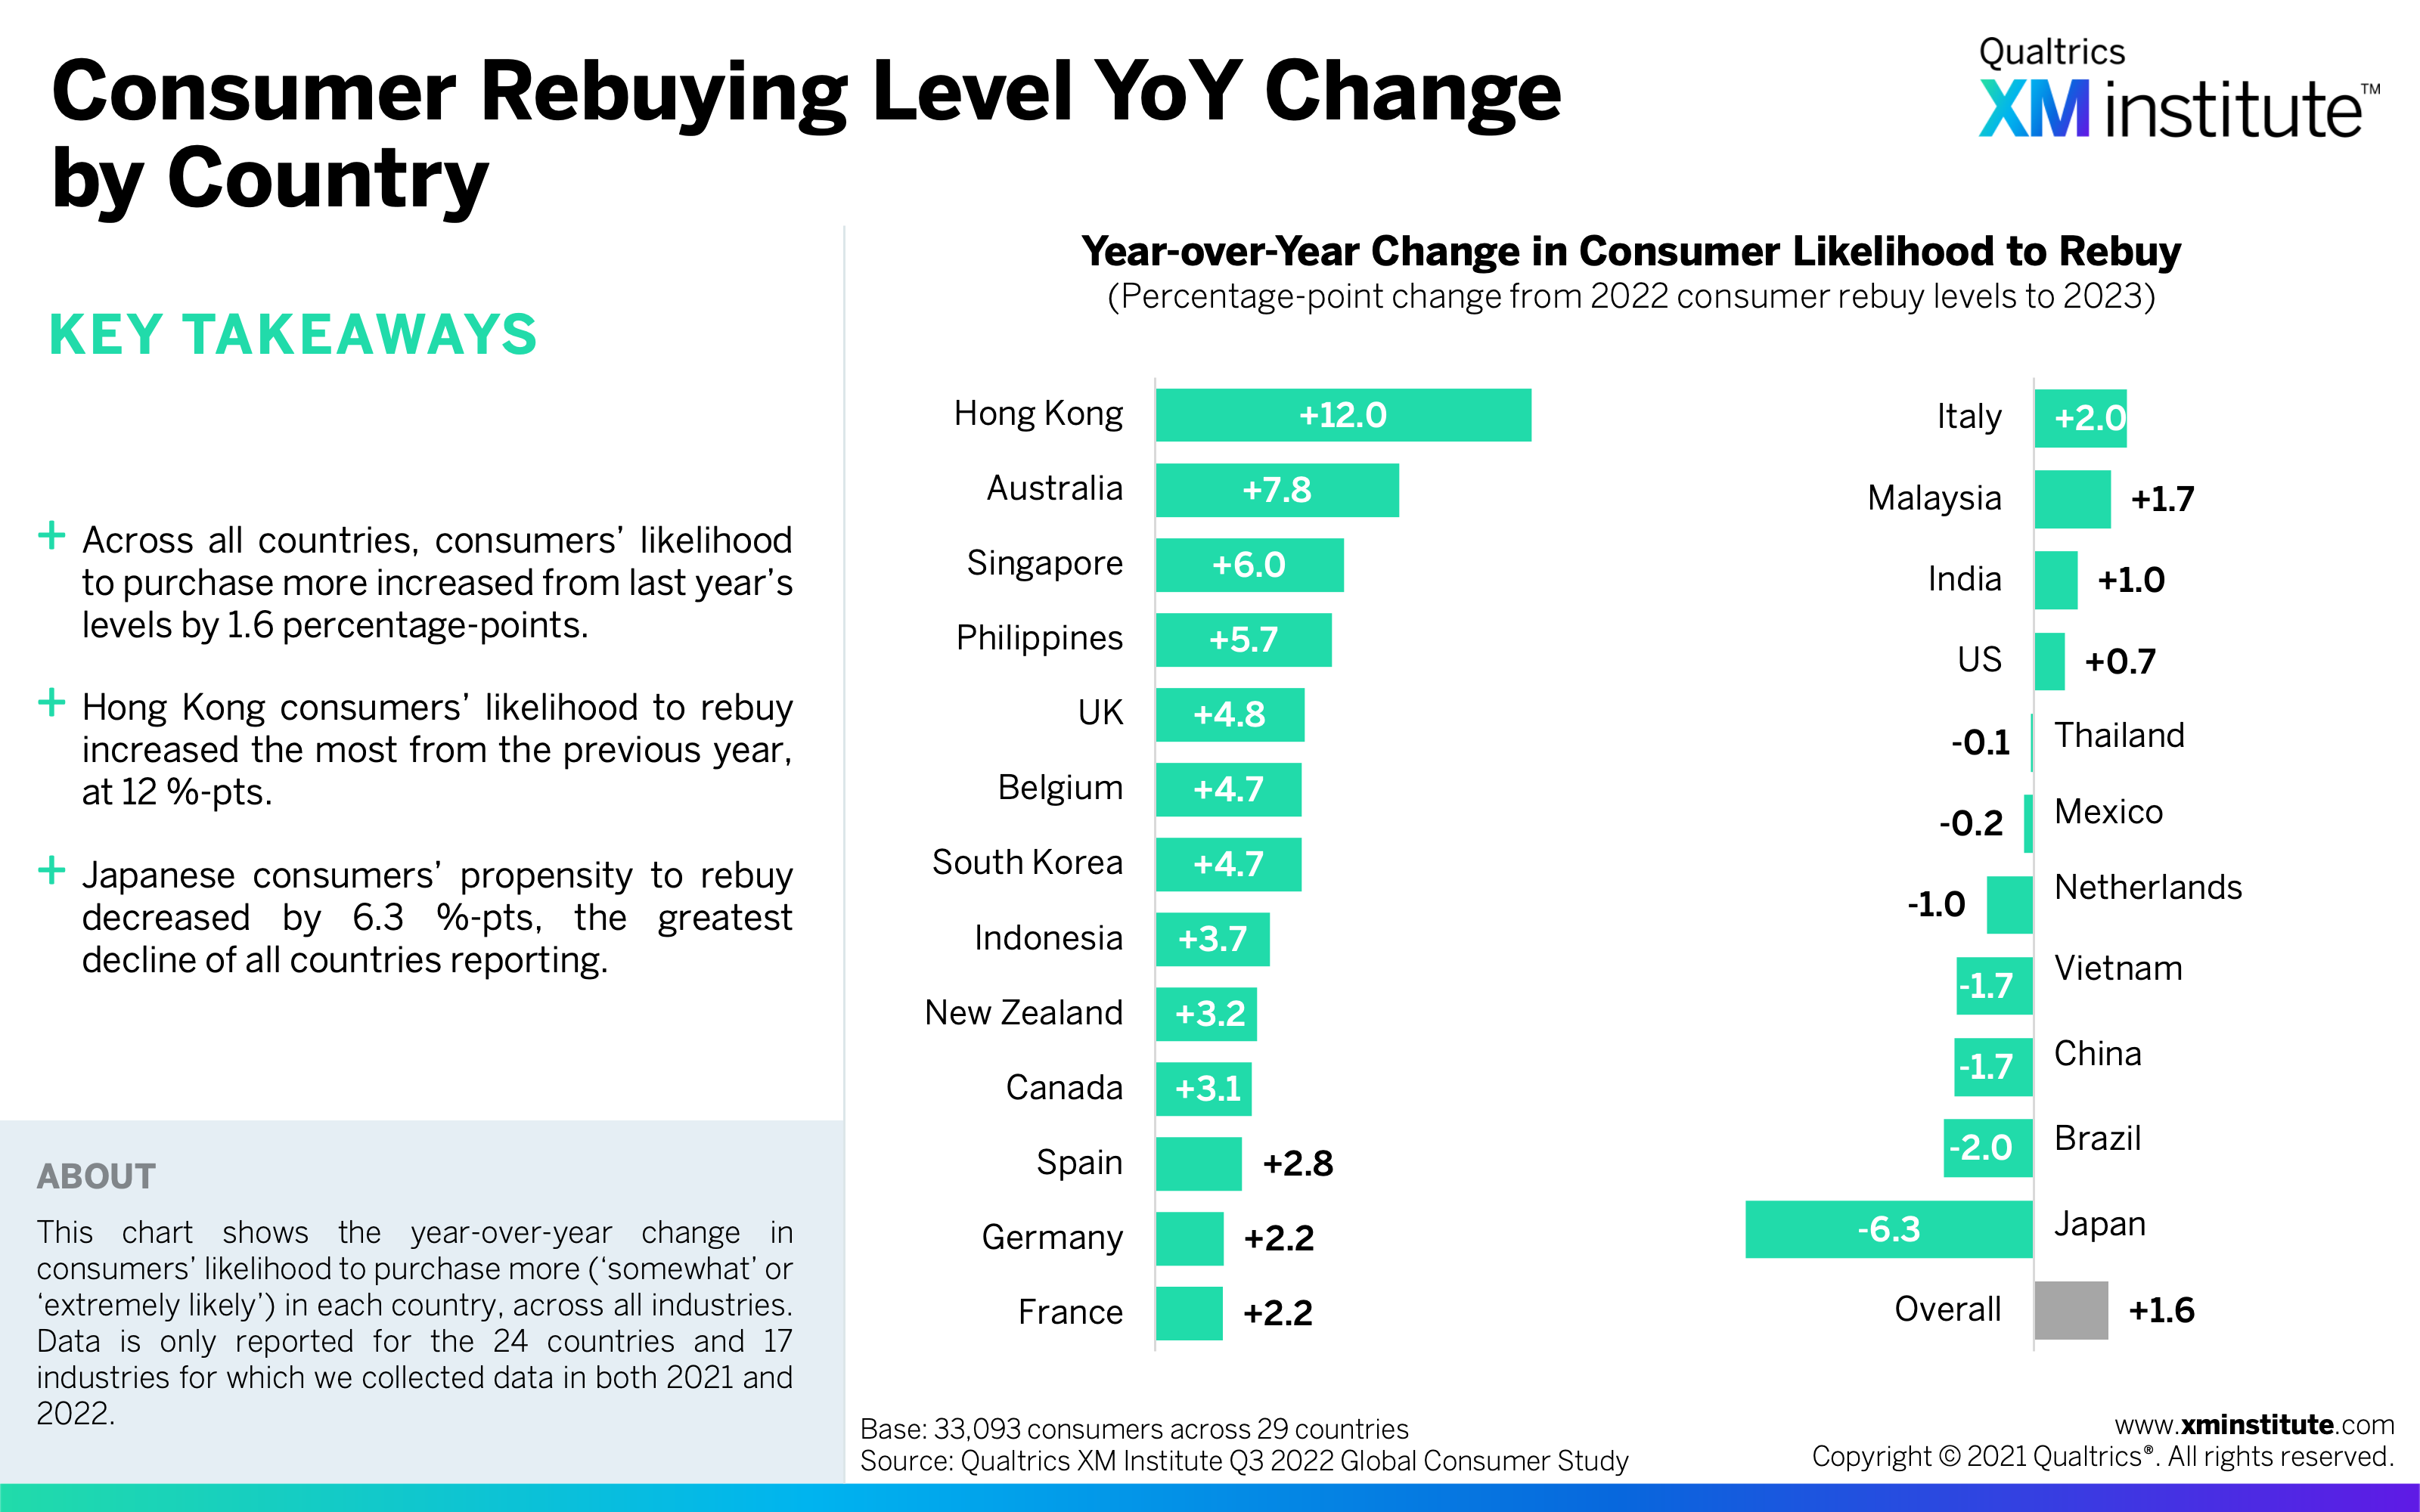
- Consumer Rebuying Level YoY Change by Country (see Figure 26)
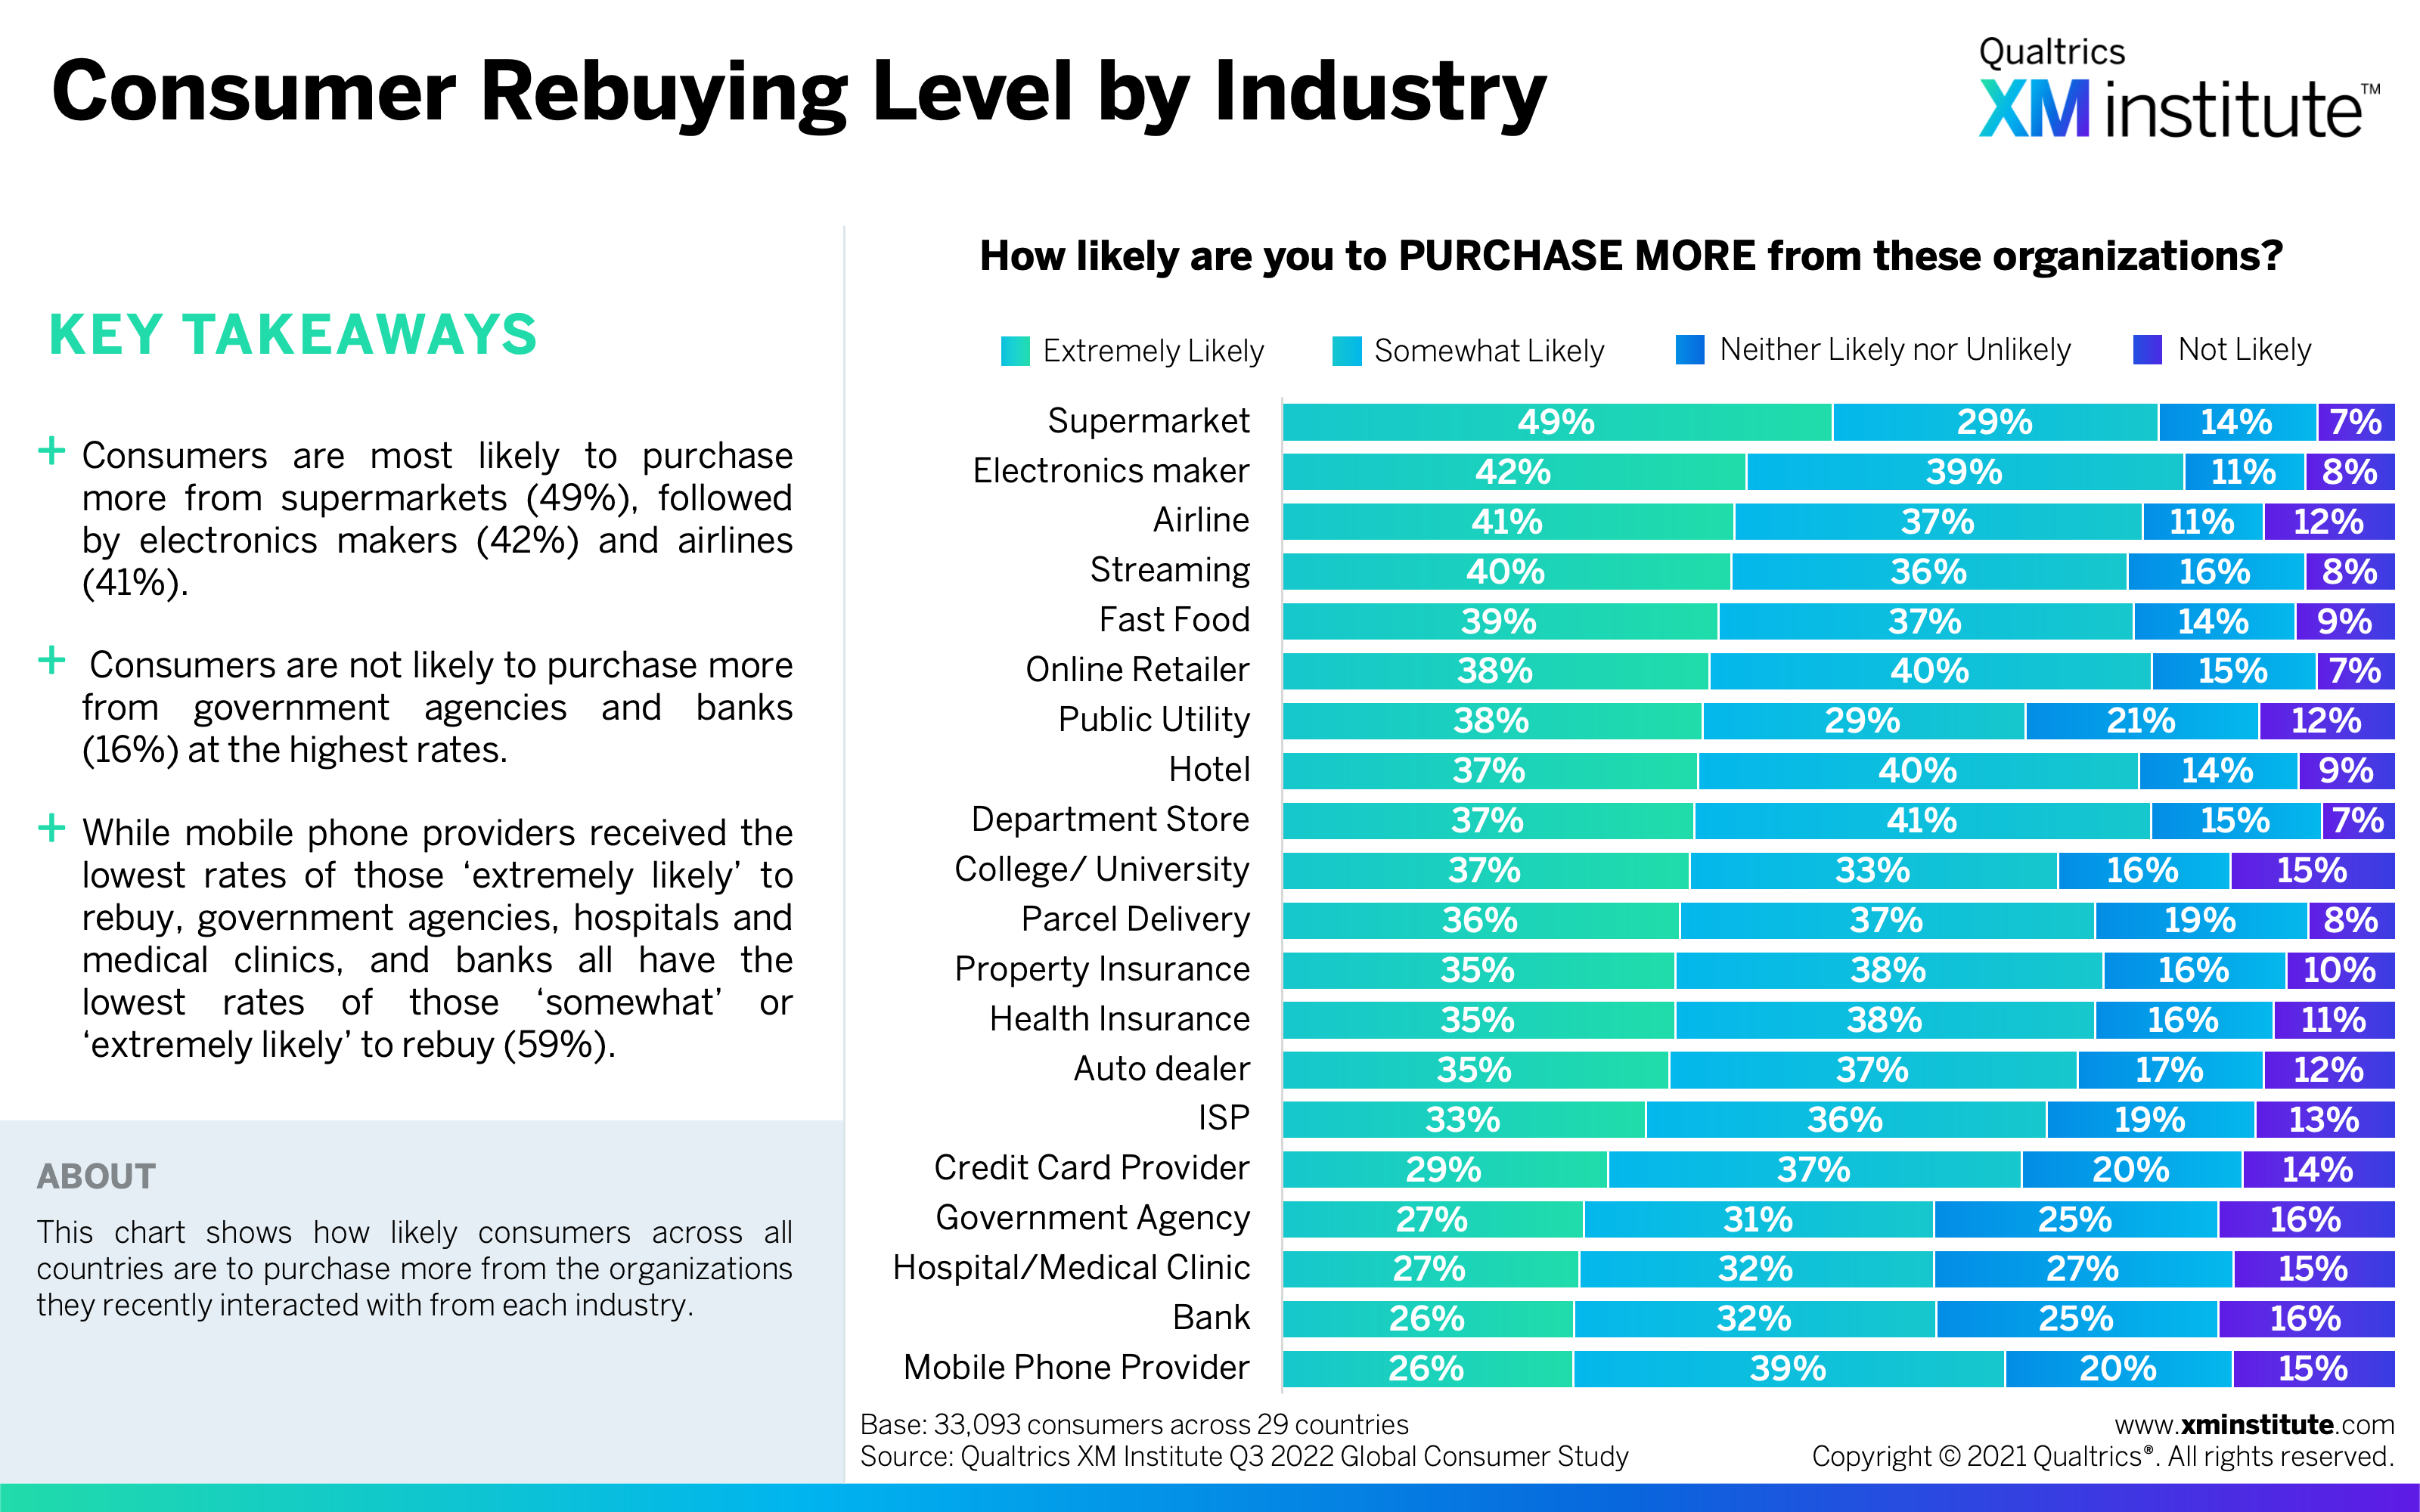
- Consumer Rebuying Level by Industry (see Figure 27)
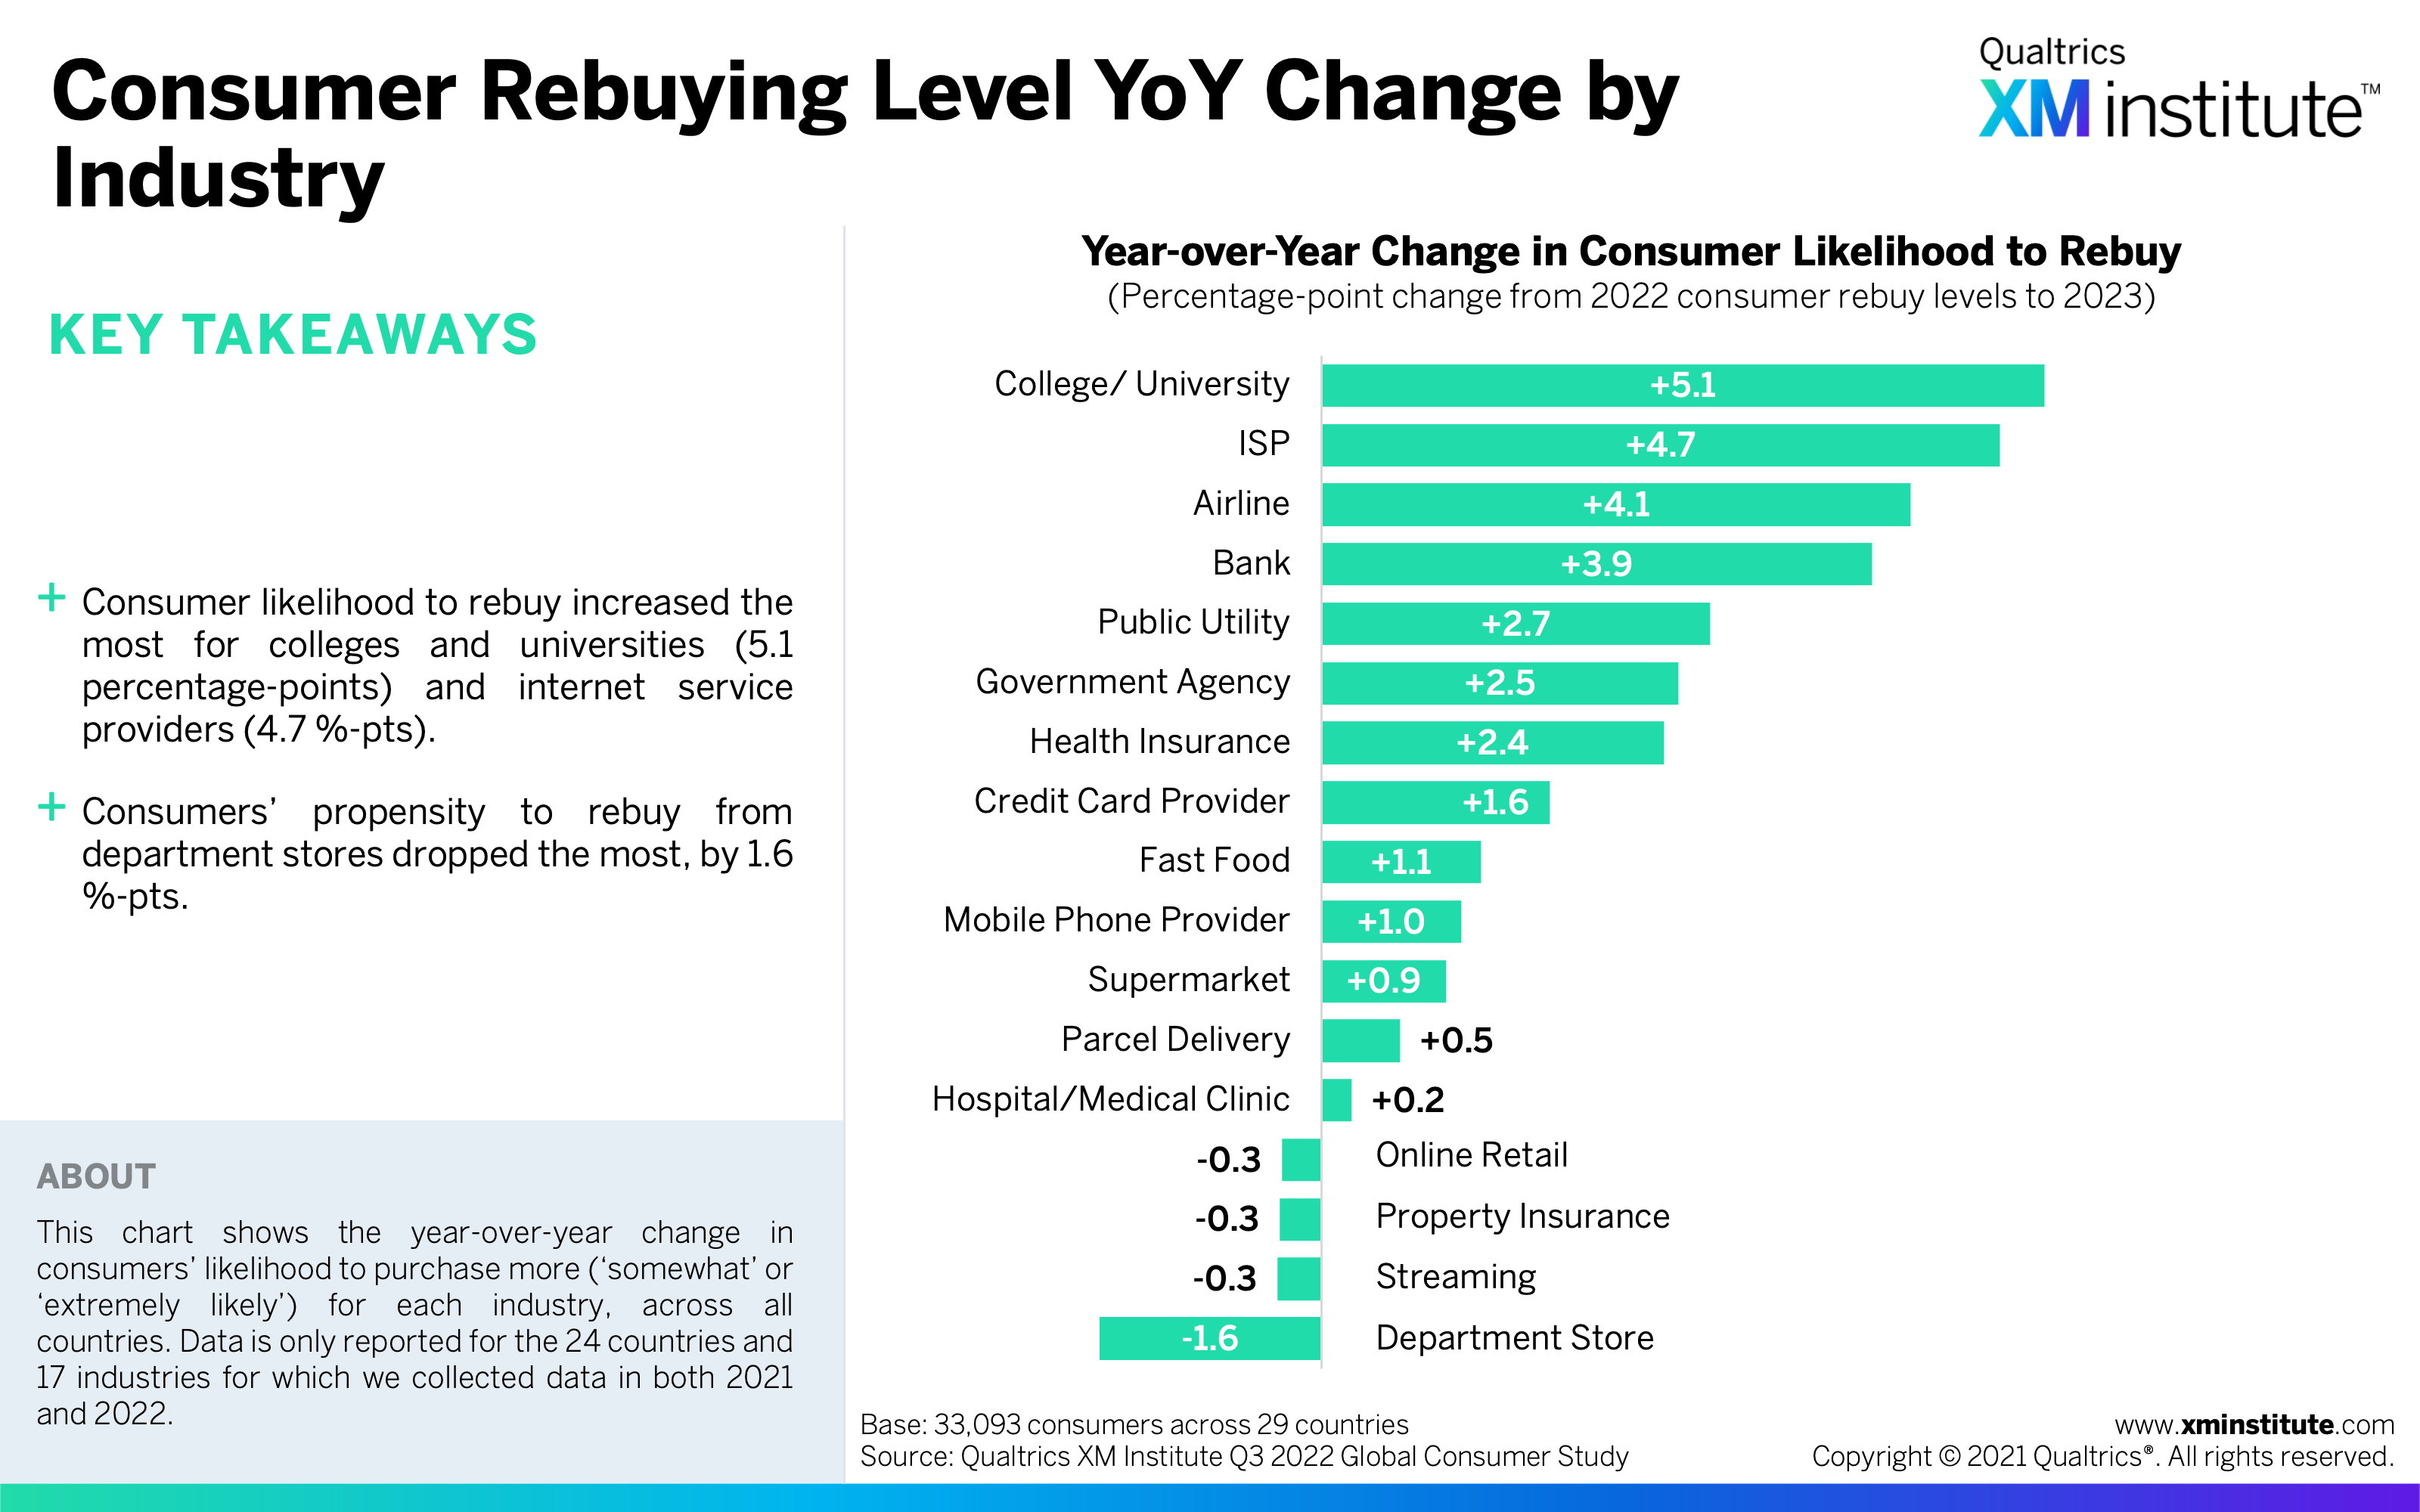
- Consumer Rebuying Level YoY Change by Industry (see Figure 28)
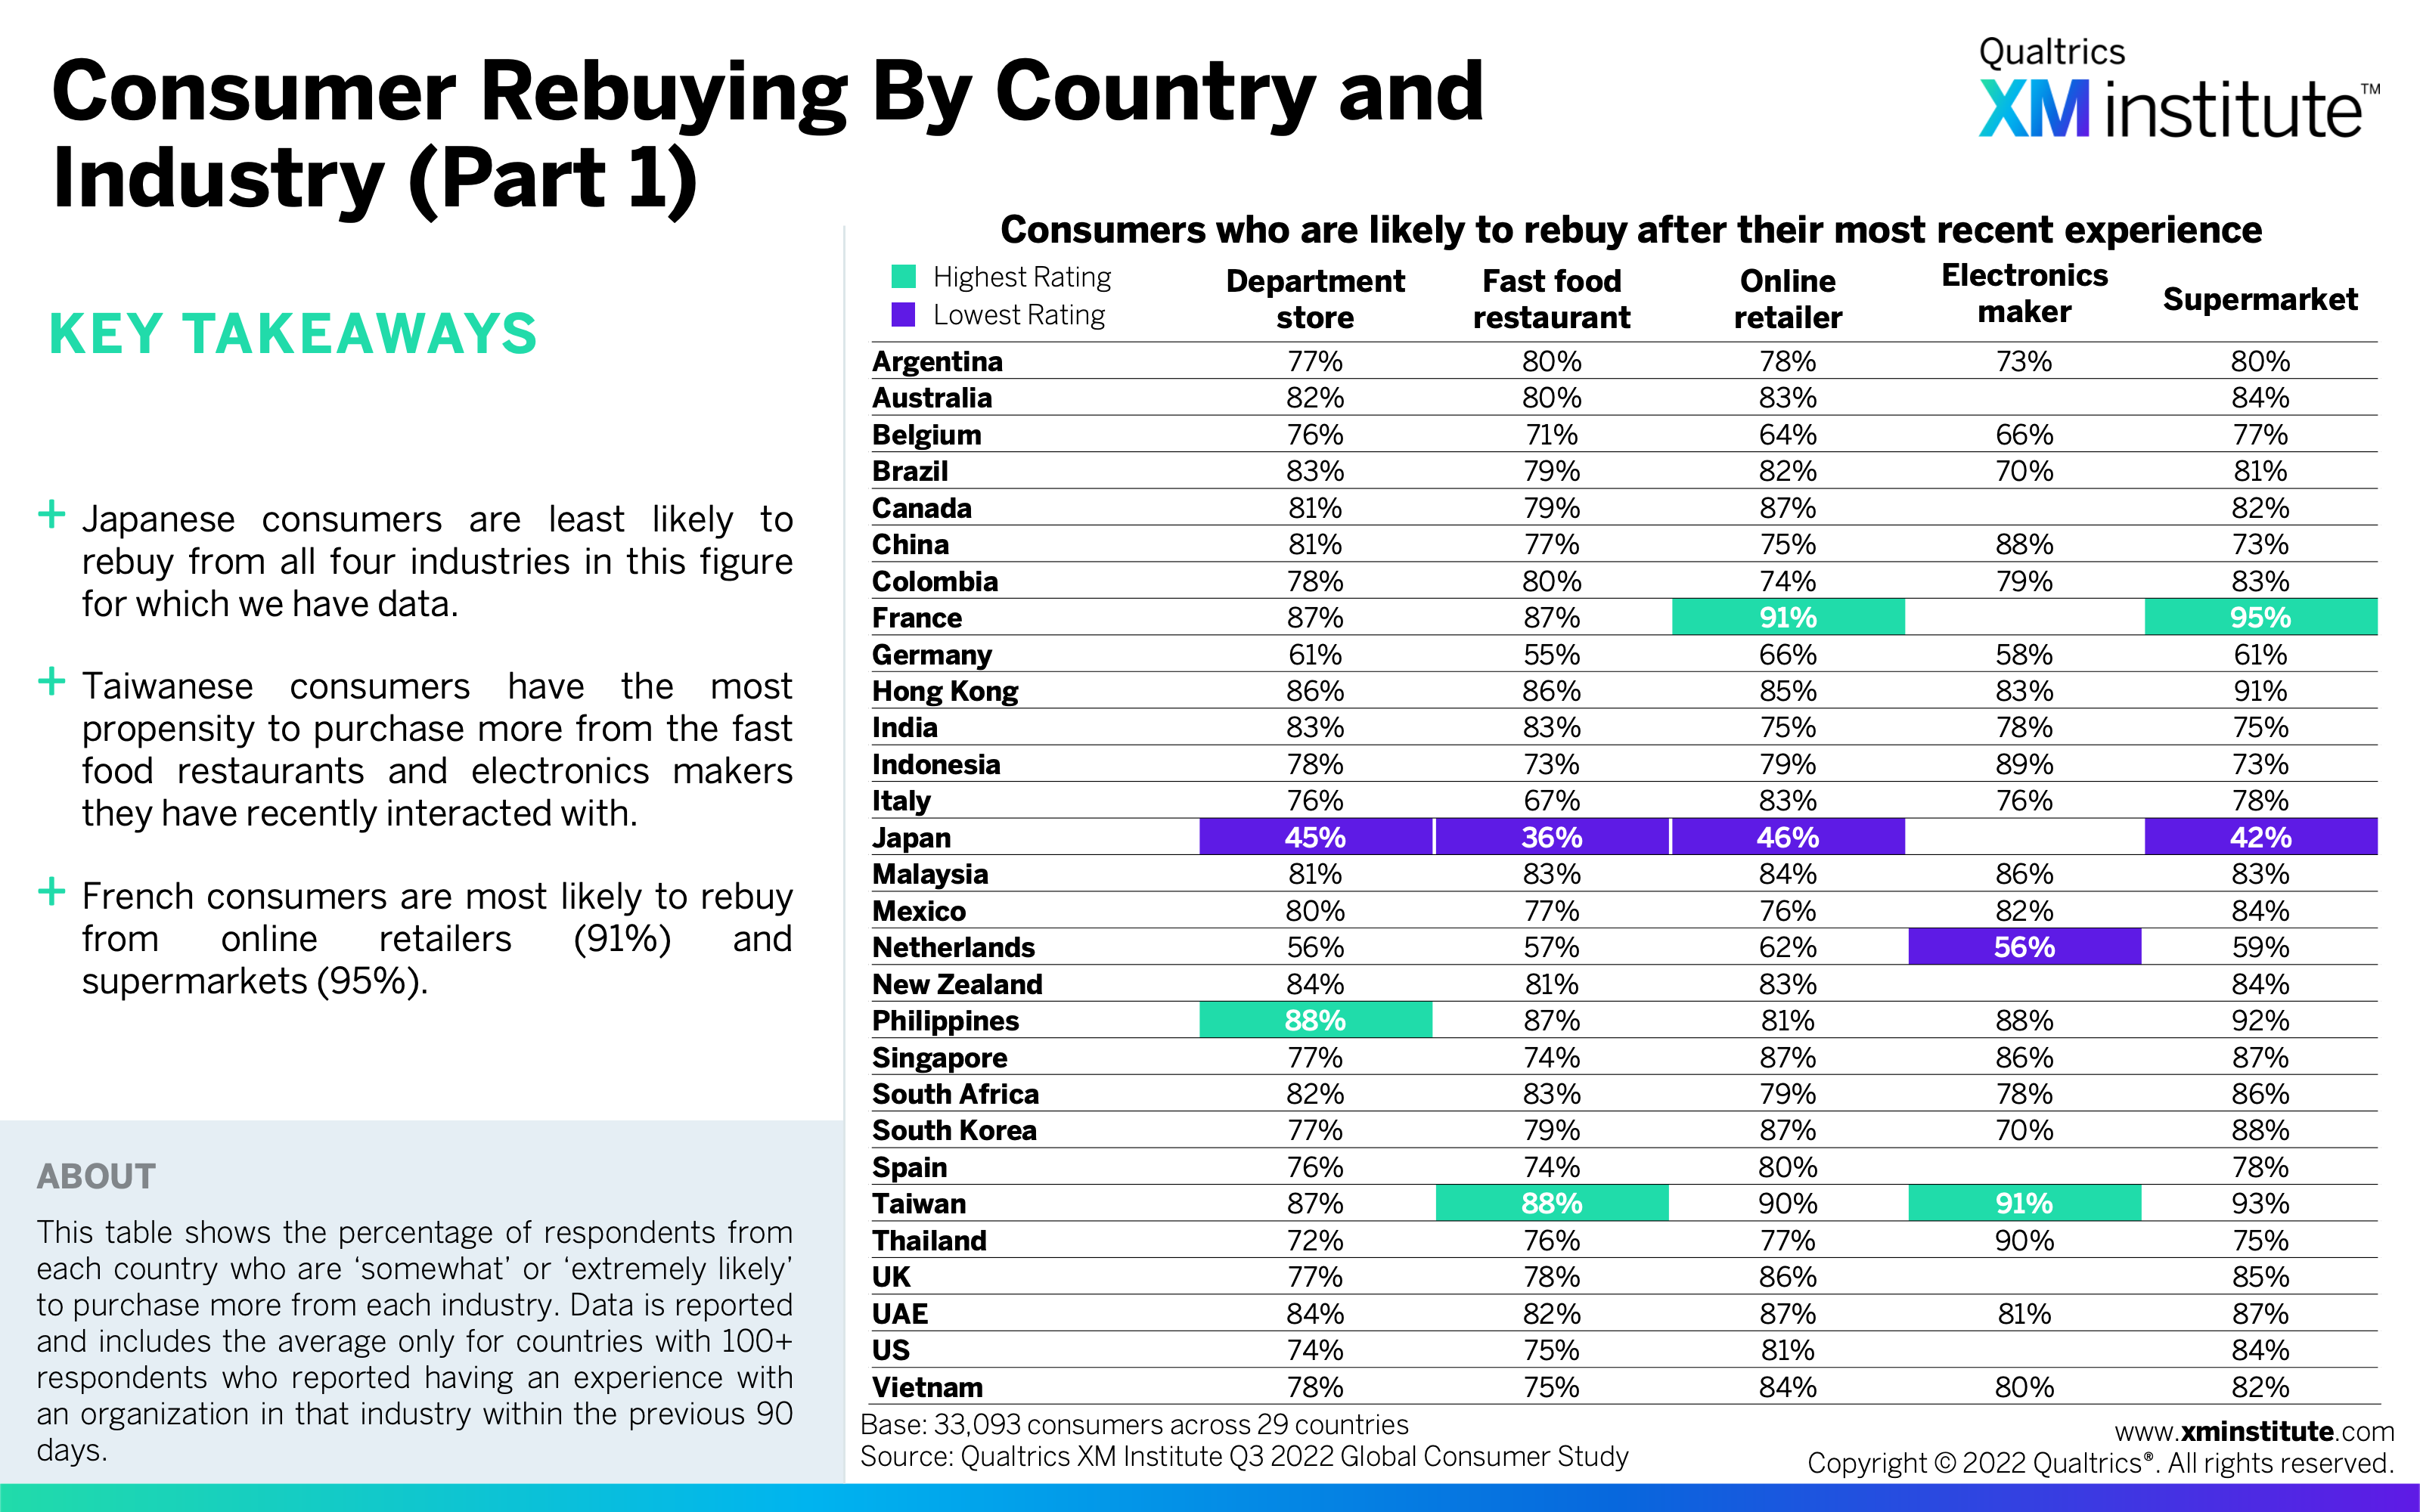
- Consumer Rebuying by Country and Industry (Part 1) (see Figure 29)
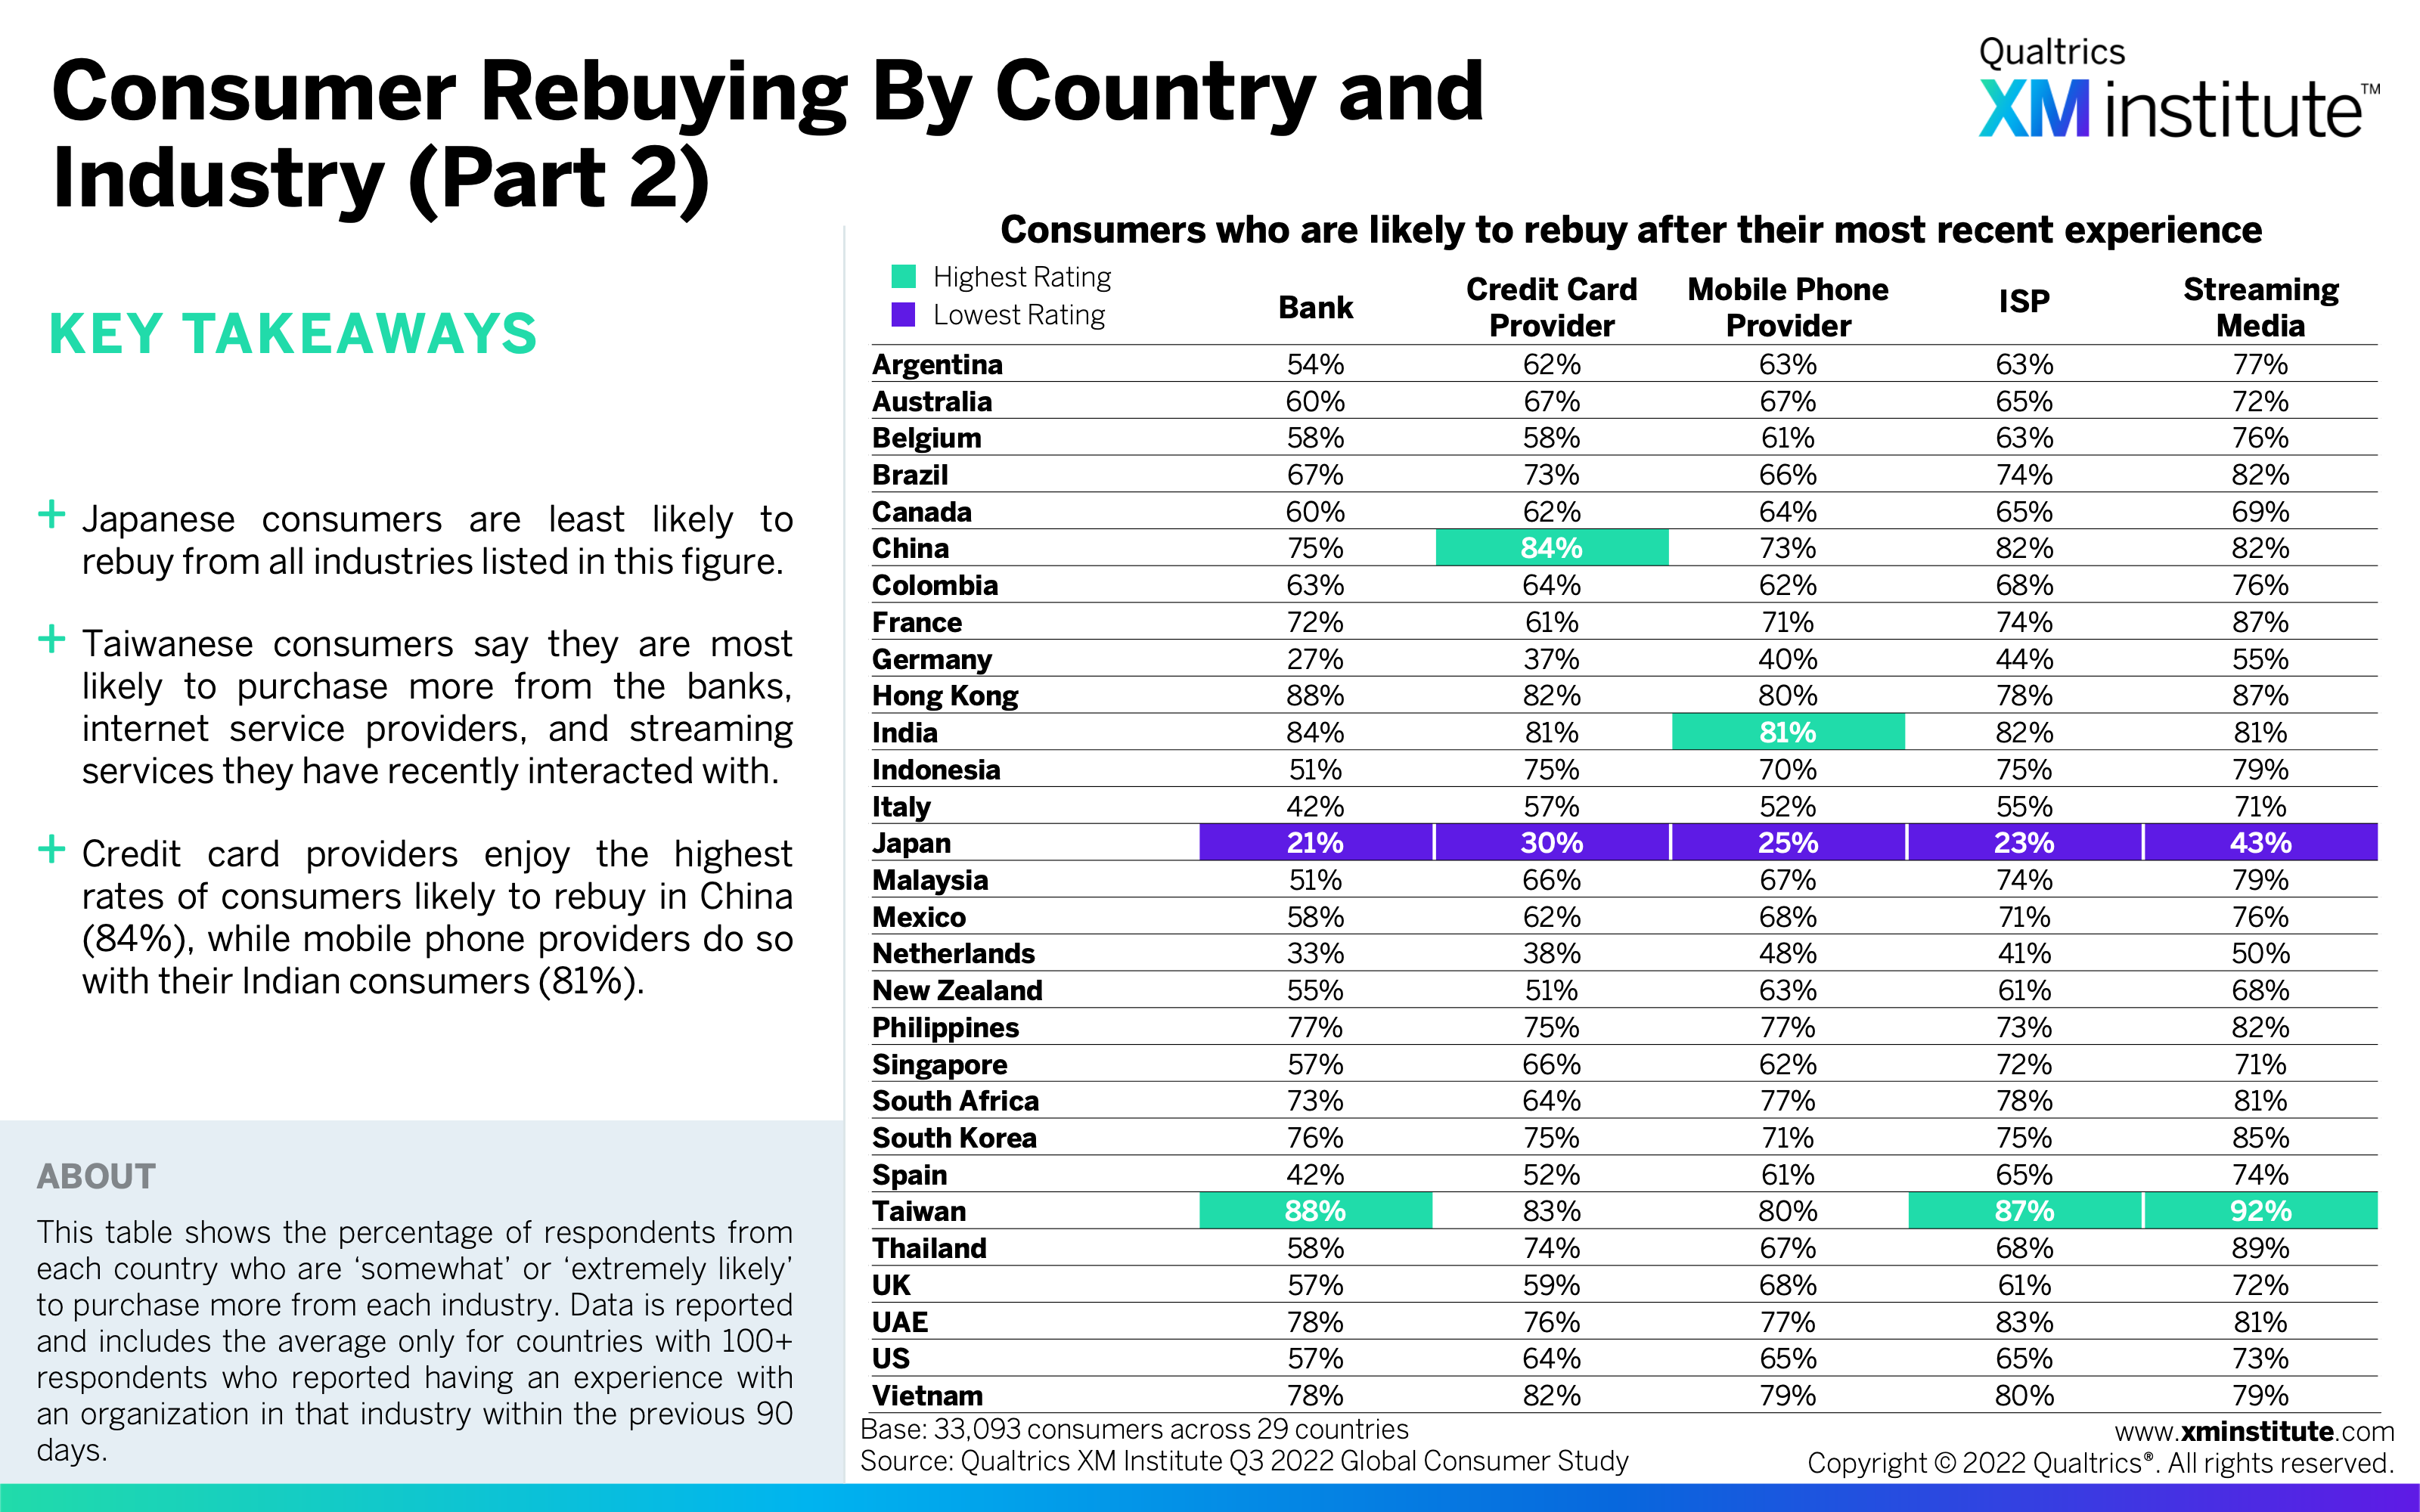
- Consumer Rebuying by Country and Industry (Part 2) (see Figure 30)
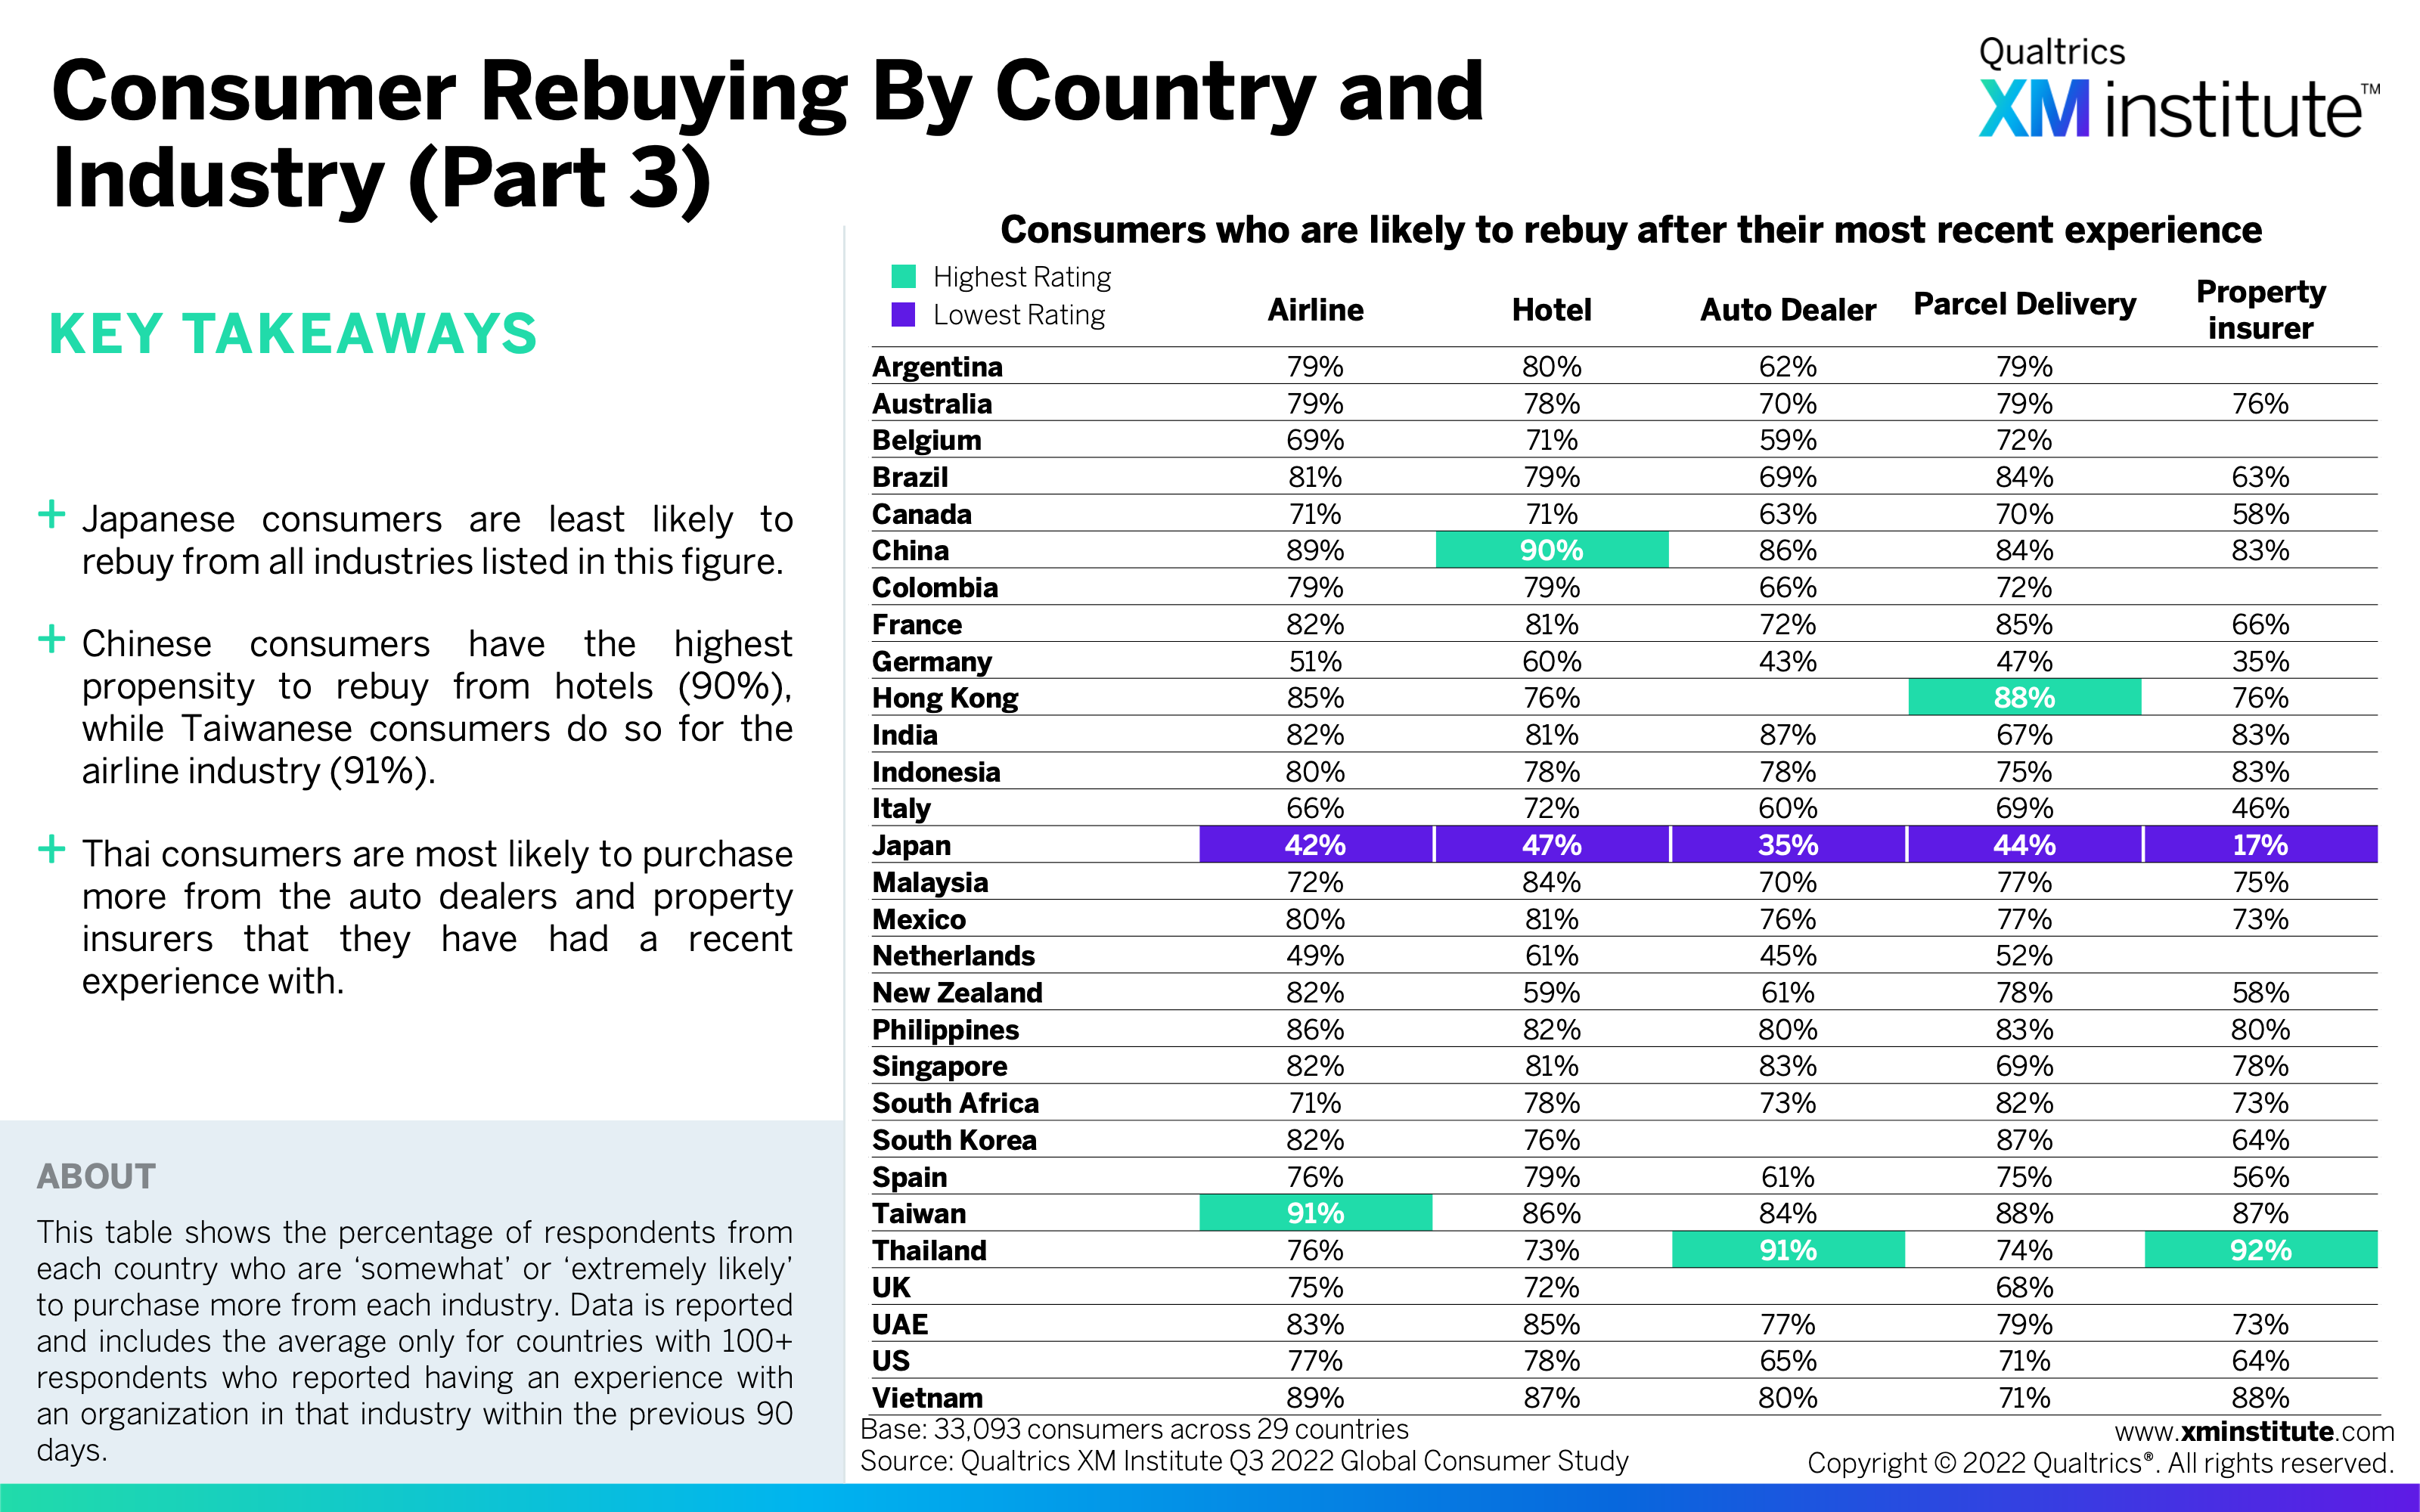
- Consumer Rebuying by Country and Industry (Part 3) (see Figure 31)
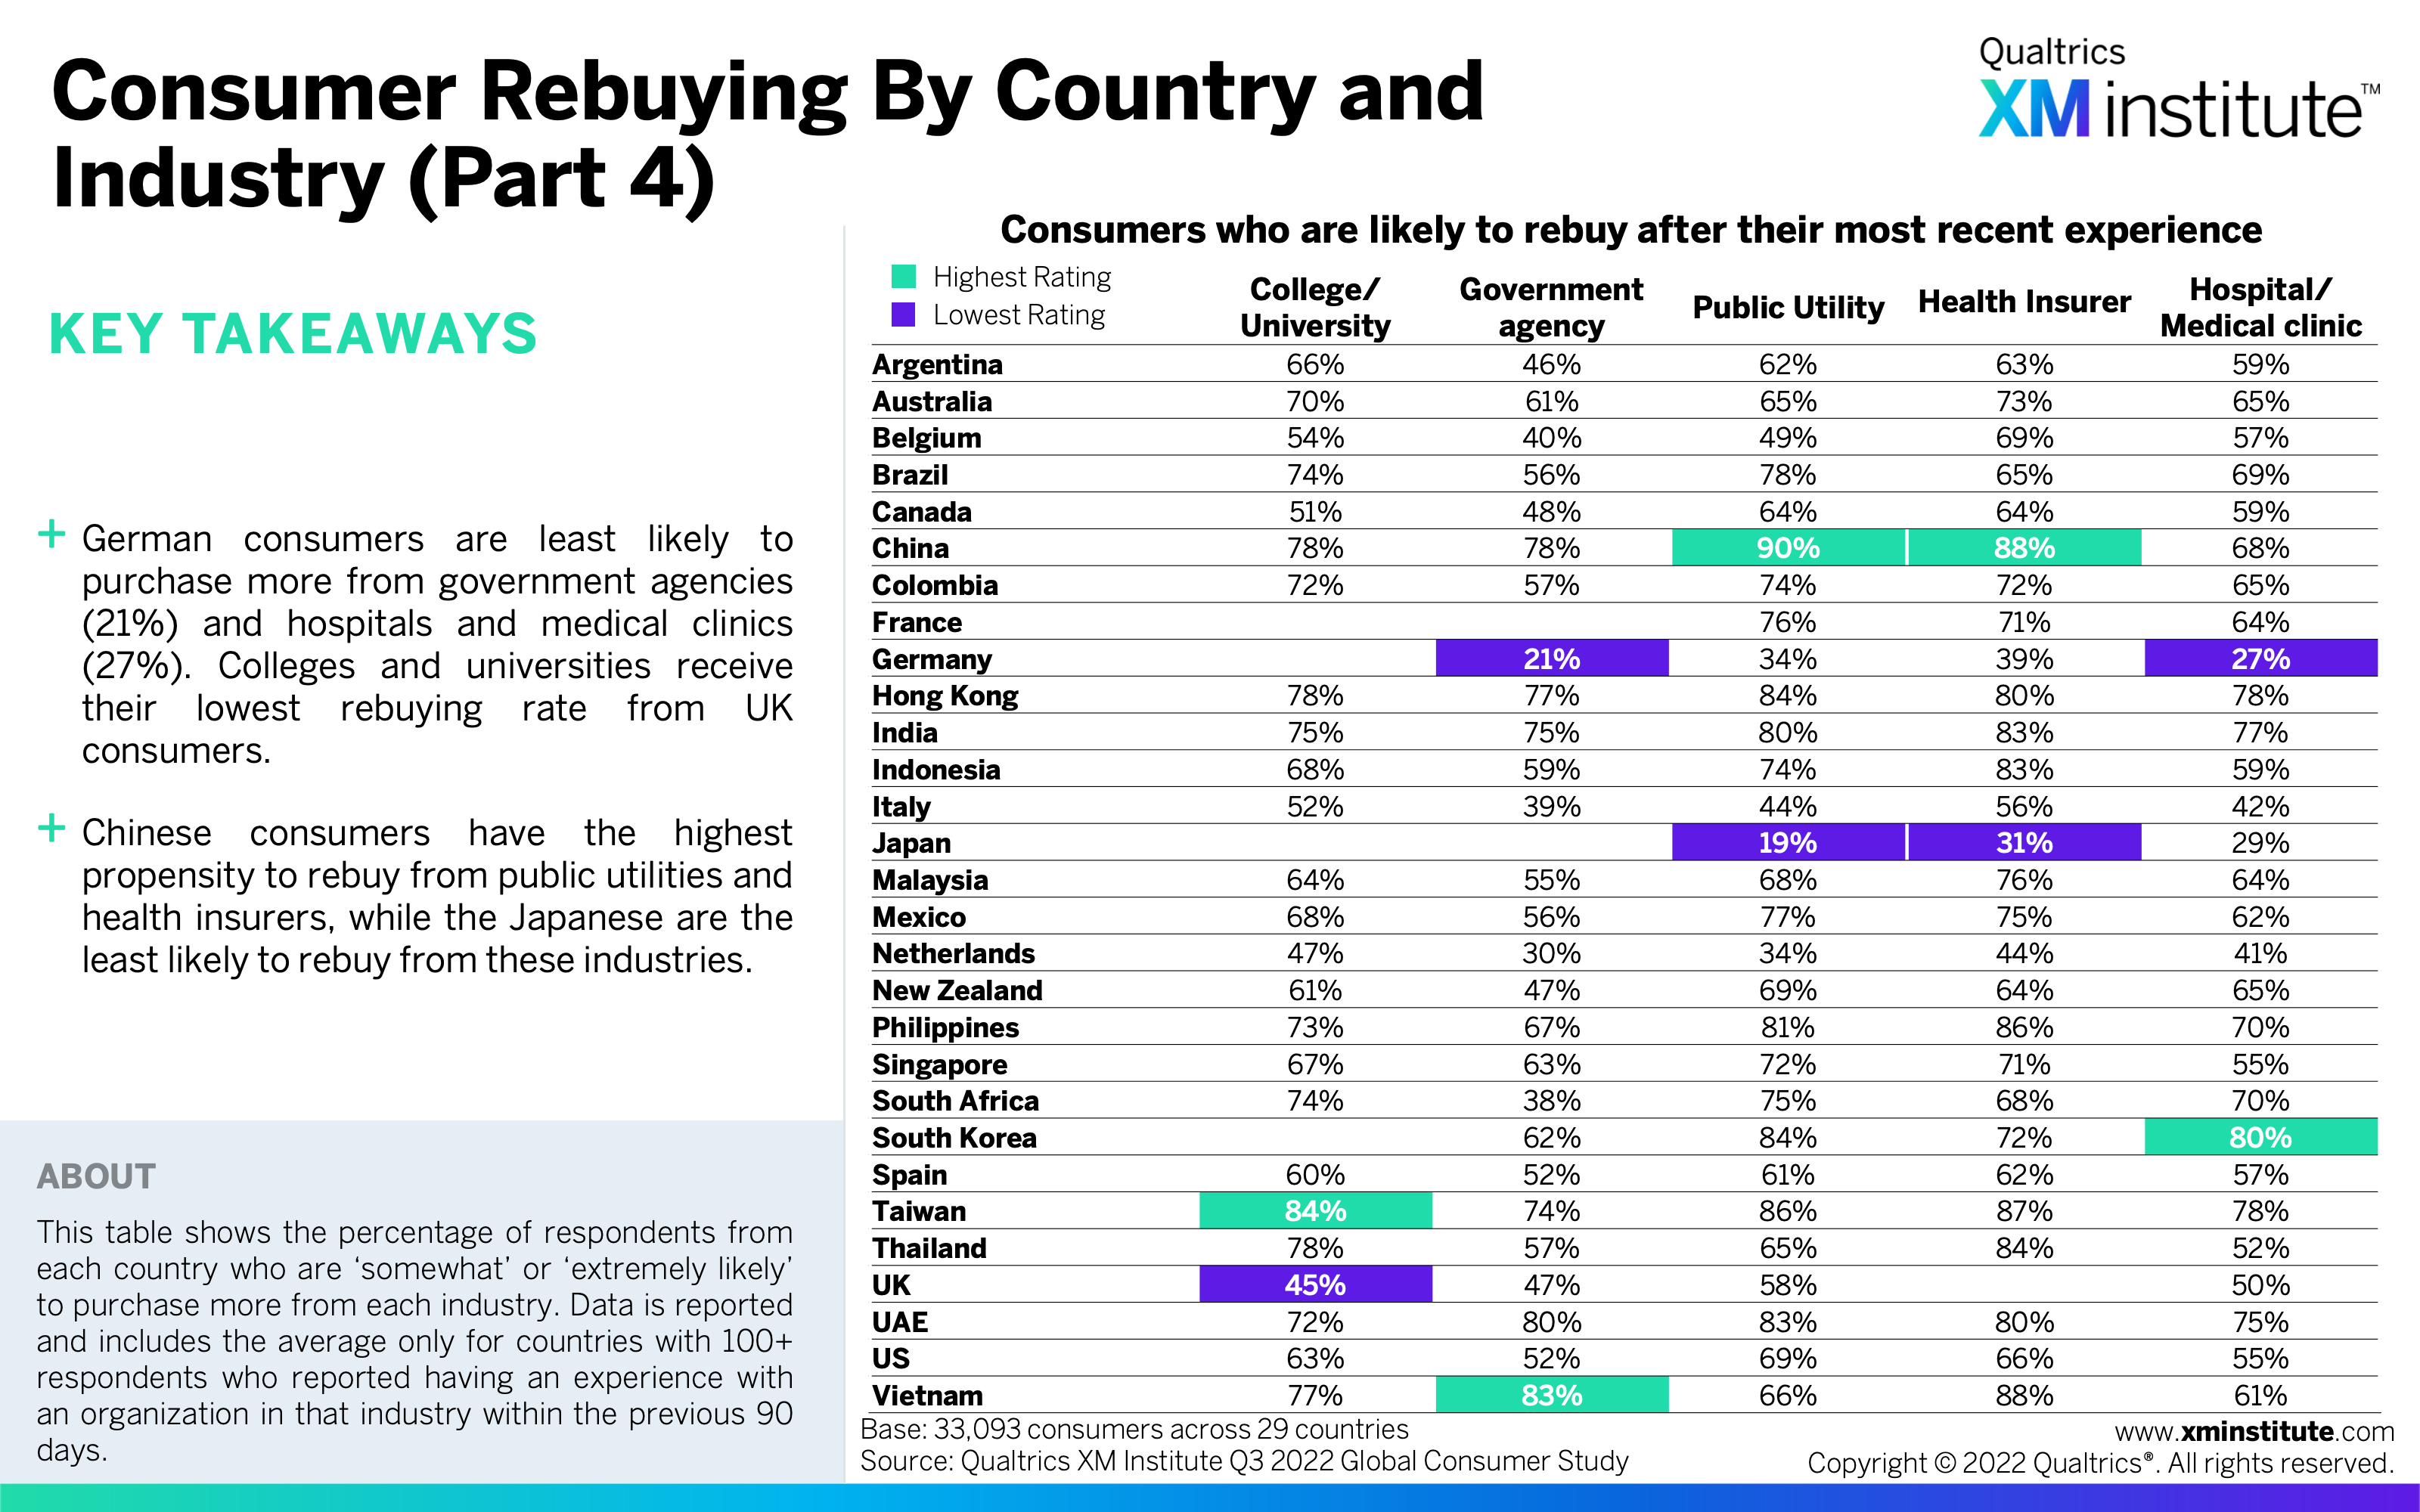
- Consumer Rebuying by Country and Industry (Part 4) (see Figure 32)
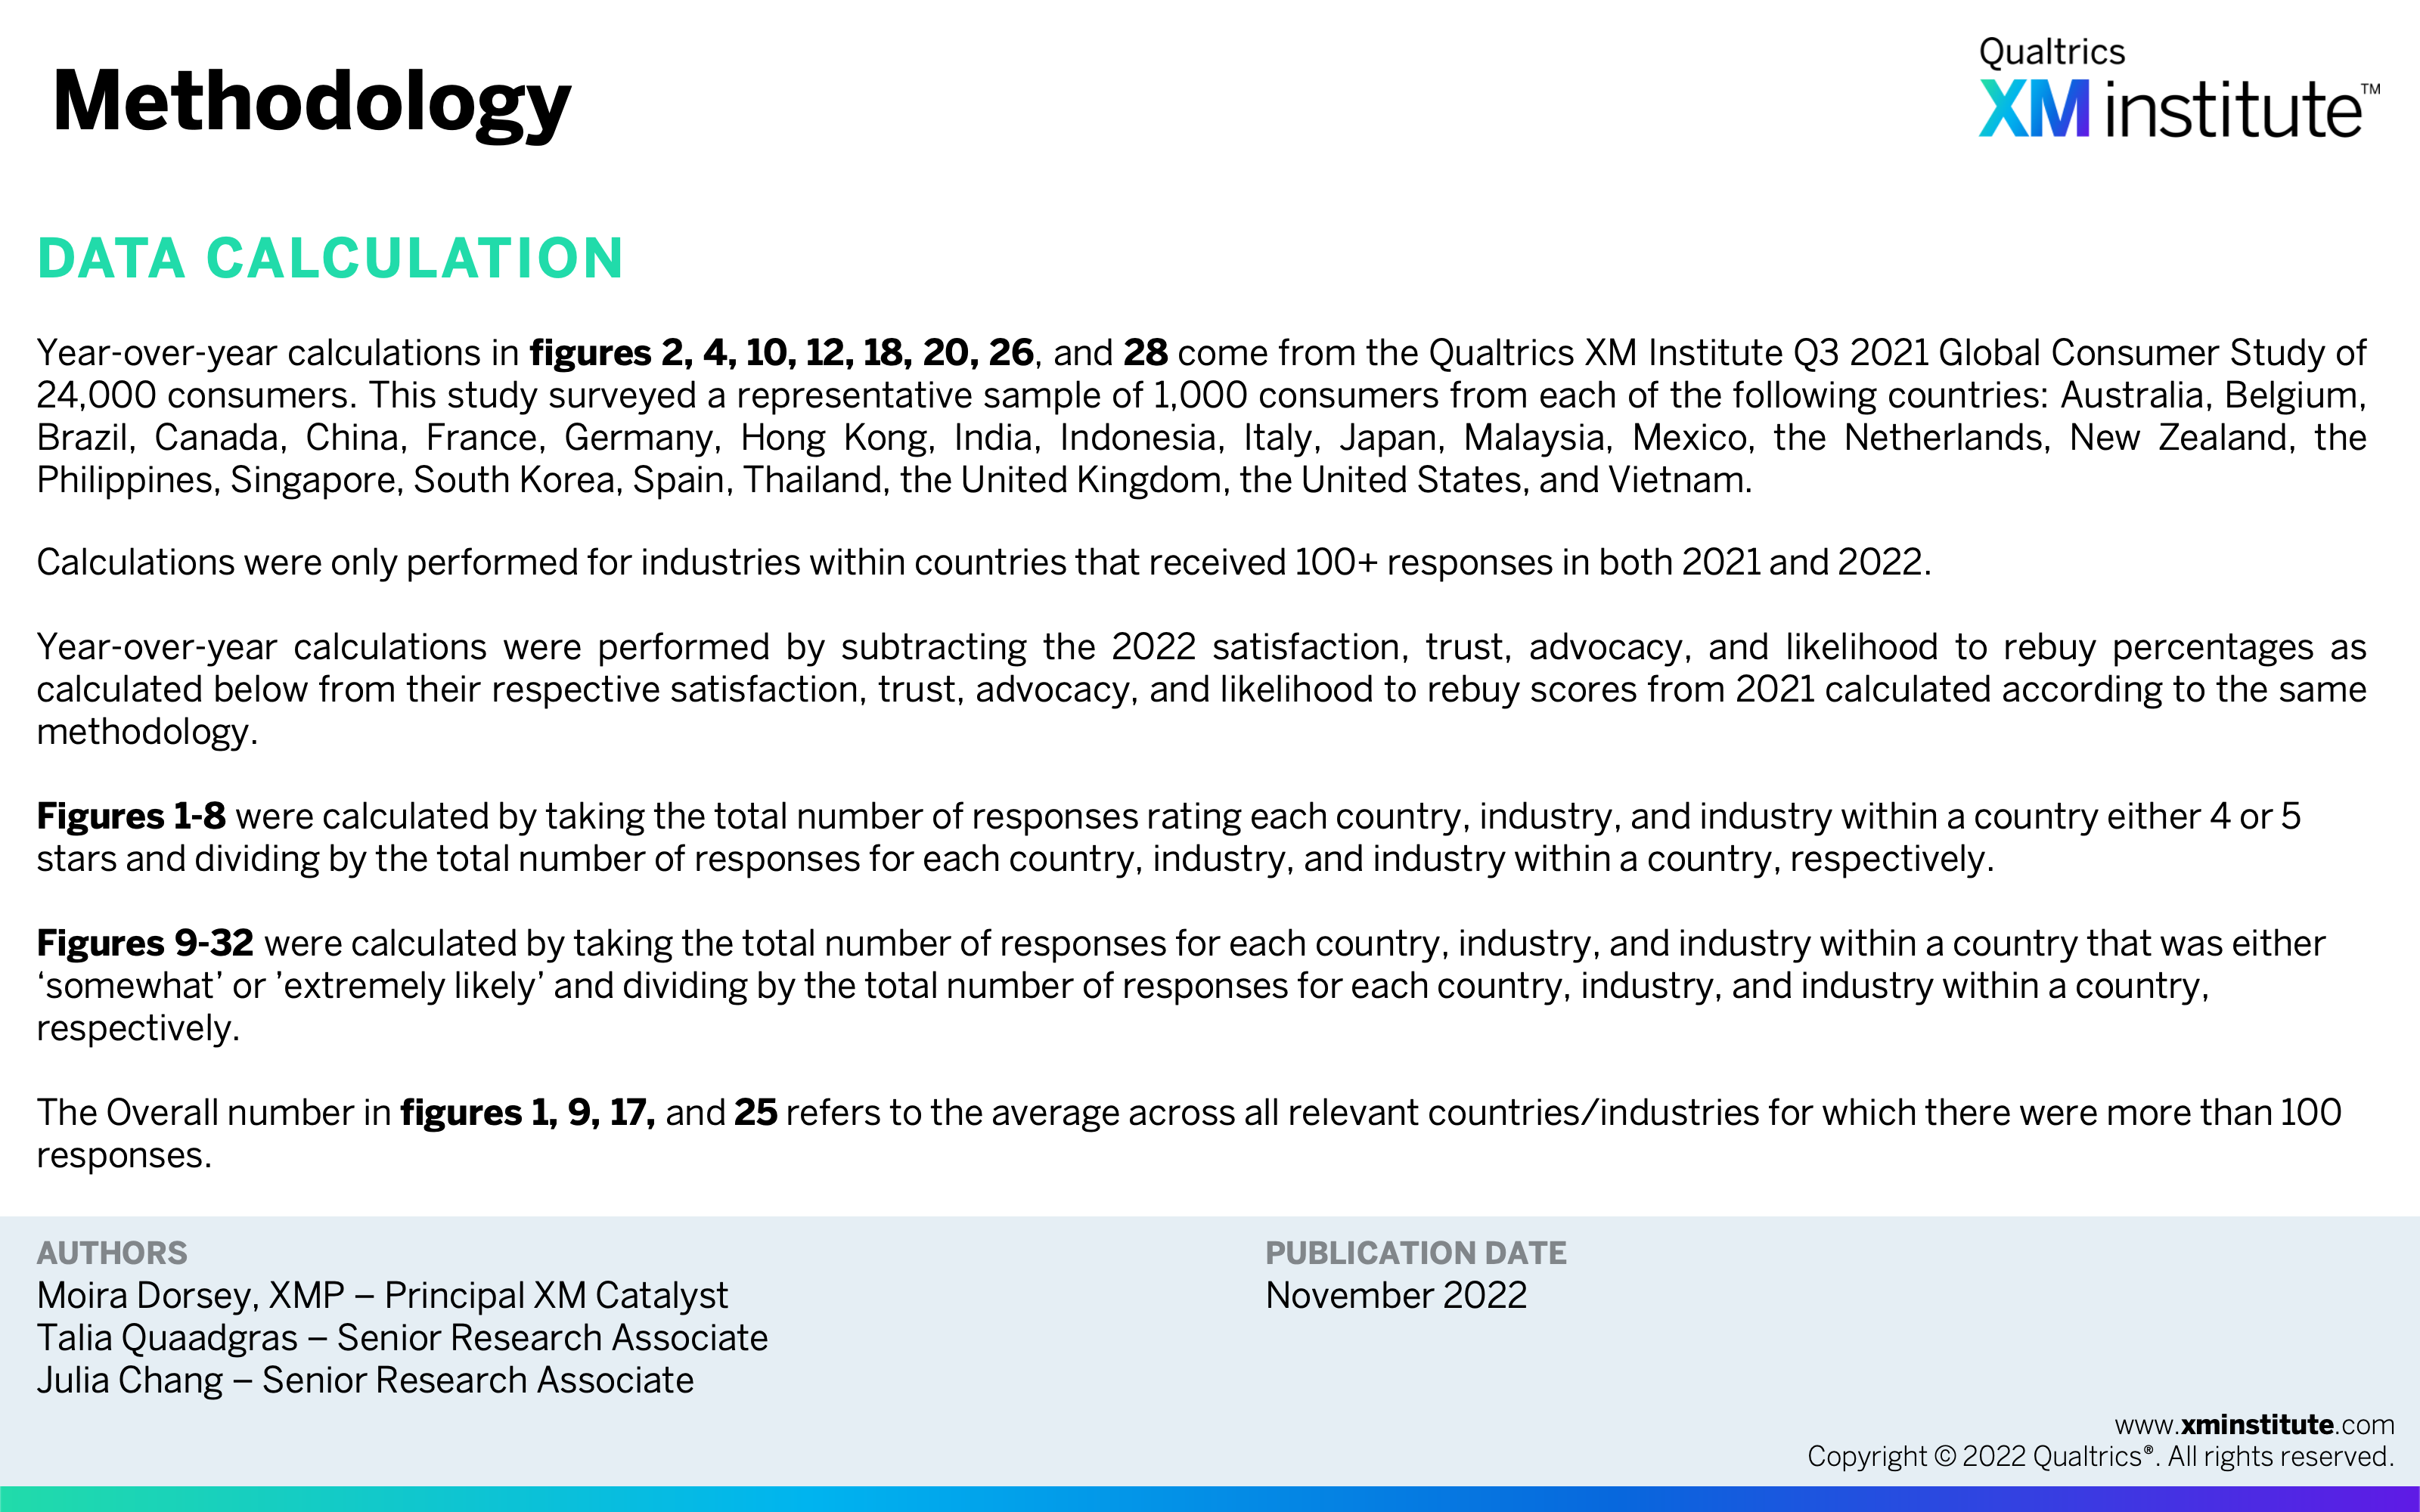
- Methodology (see Figure 33)