Key Takeaways
As part of our annual US Consumer Benchmark study, we asked a demographically representative online panel of US consumers that recently interacted with companies across 22 industries to identify up to two experiences that need to be improved. Respondents also answered the standard Net Promoter Score® (NPS®) question: How likely are you to recommend <company> to friends and colleagues? Consumers selected a response from 0 (not at all likely) to 10 (extremely likely). We then determined the NPS given by consumers that had and had not encountered experiences that need to be improved. From their answers, we learned that:
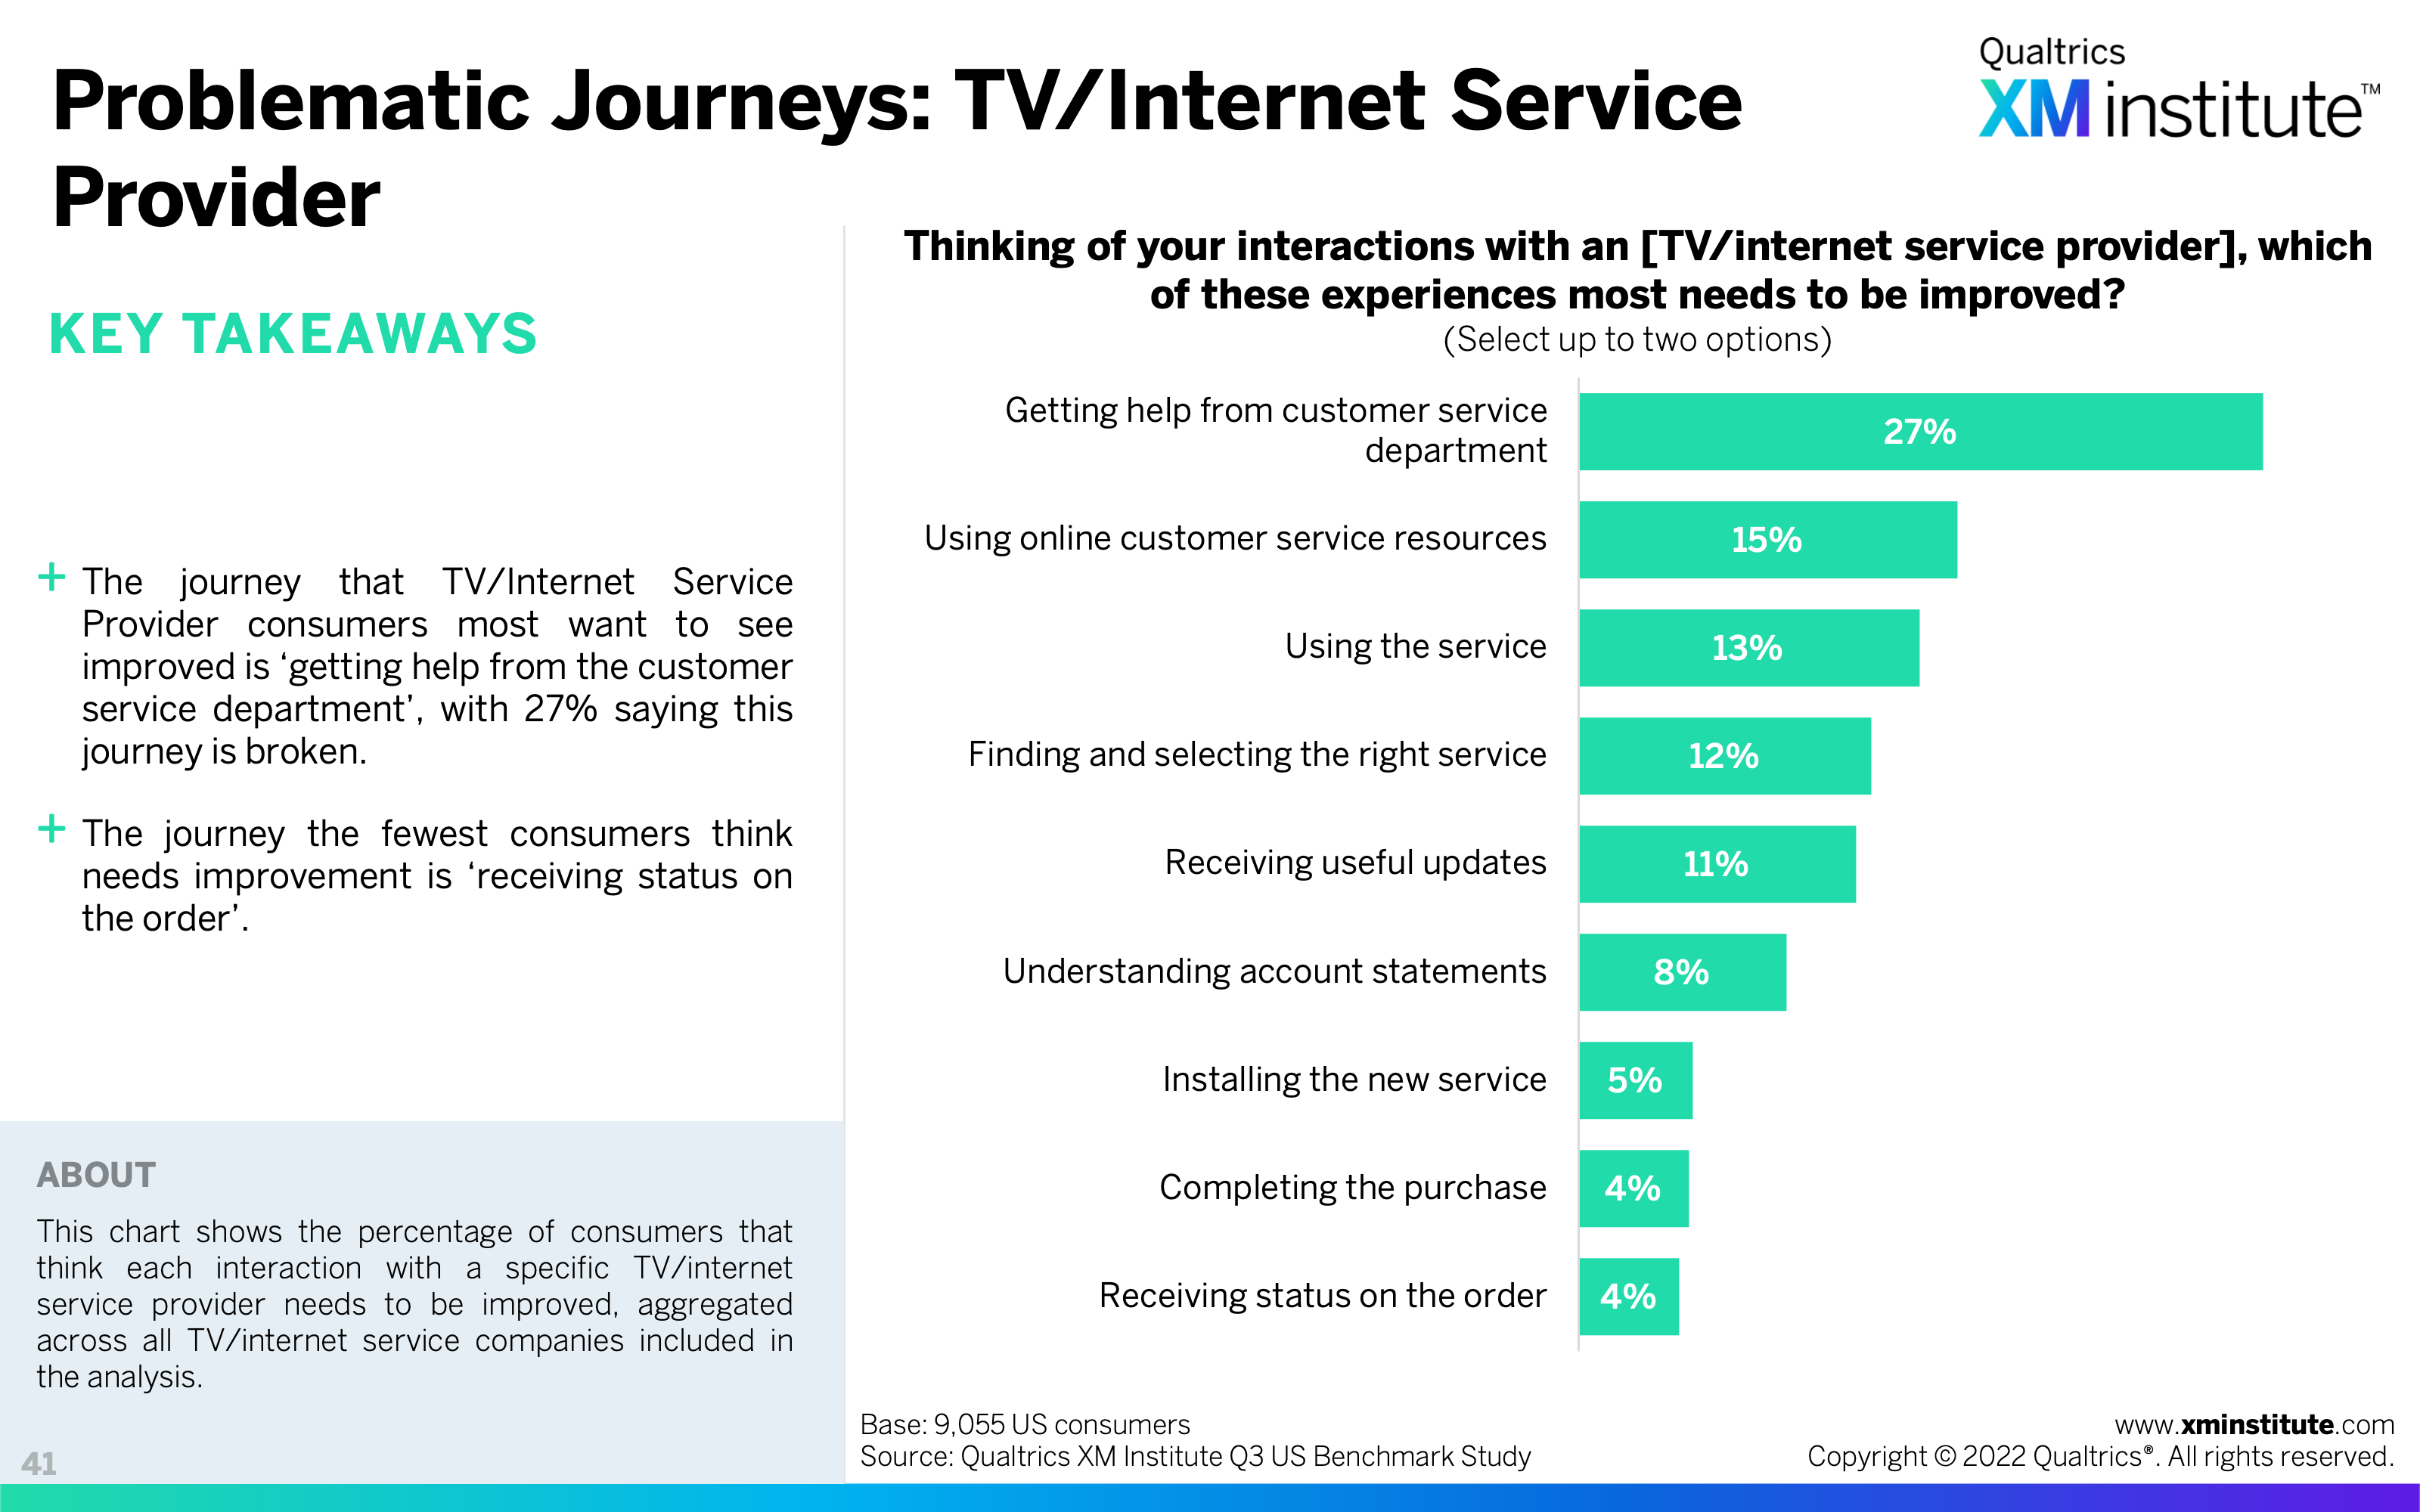
- Consumers frequently encounter broken journeys. On average across all industries, over half of the responses identified at least one journey that needs improvement. The most broken journey occurs for TV/internet service provider customers; 27% say that ‘getting help from the customer service department’ needs improvement.
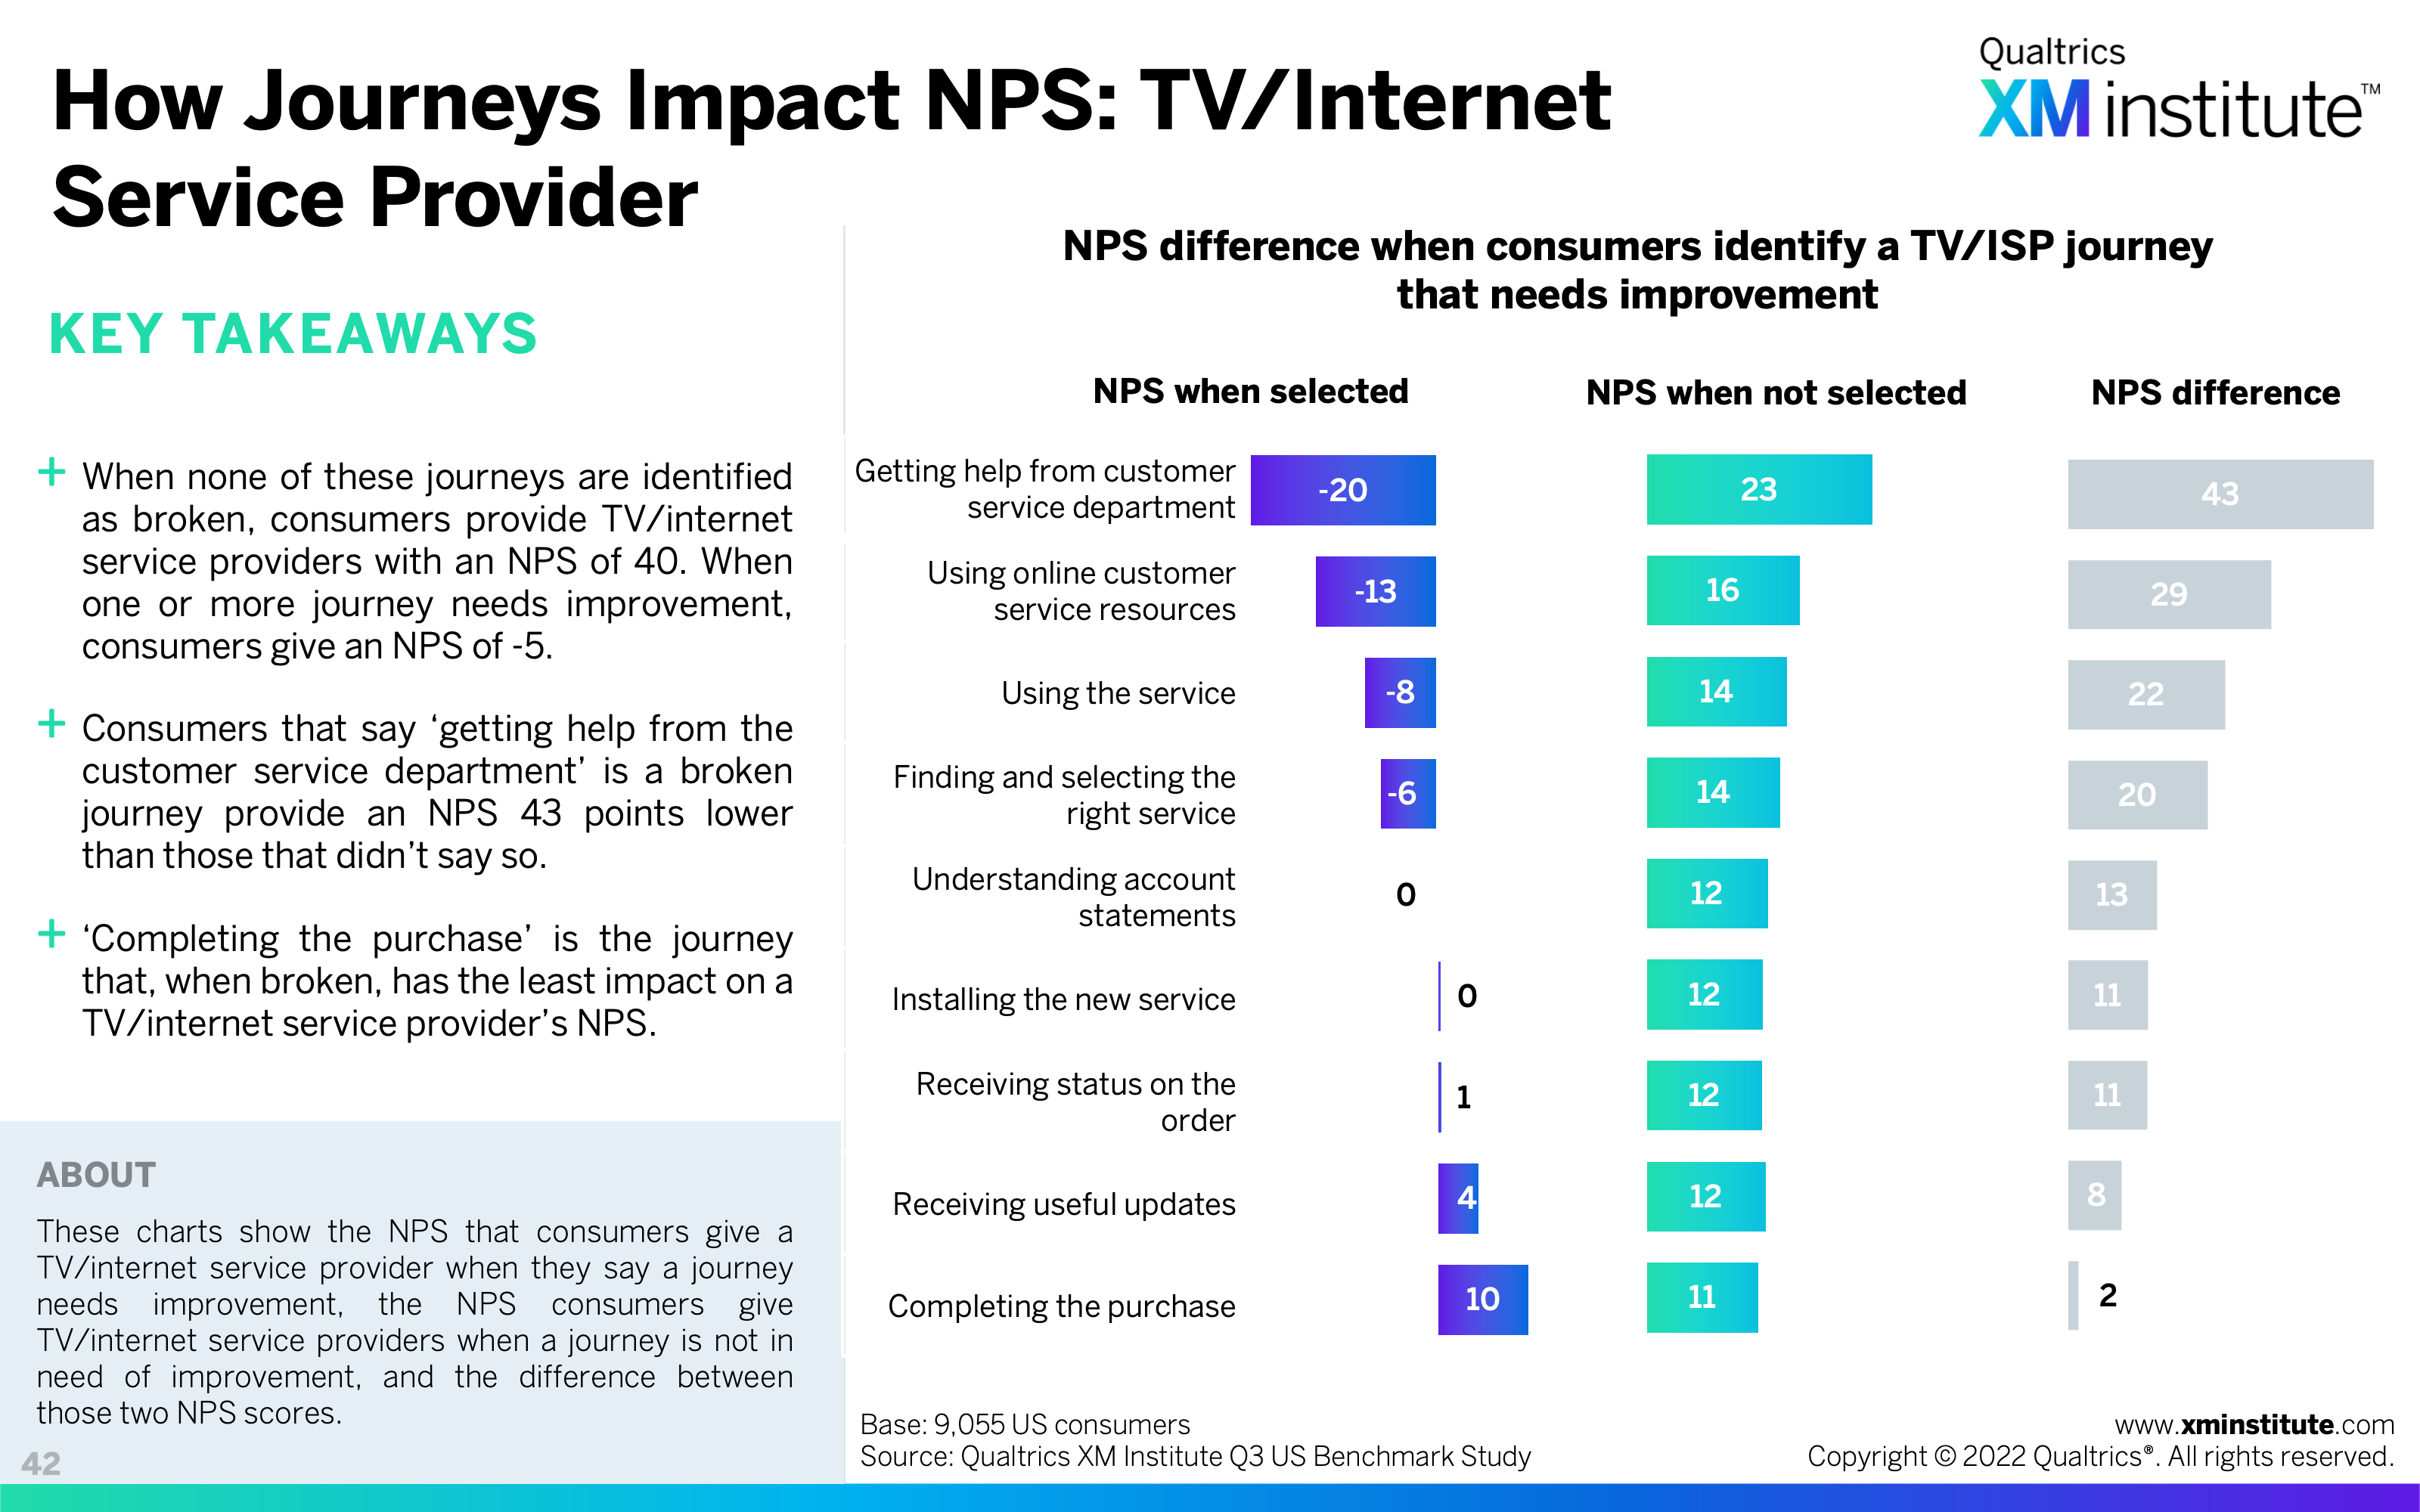
- Broken journeys have a significant impact on NPS. Consumers who identified a journey that needed improvement provided an NPS, on average across all industries, 20 points lower than those that did not identify that broken journey.
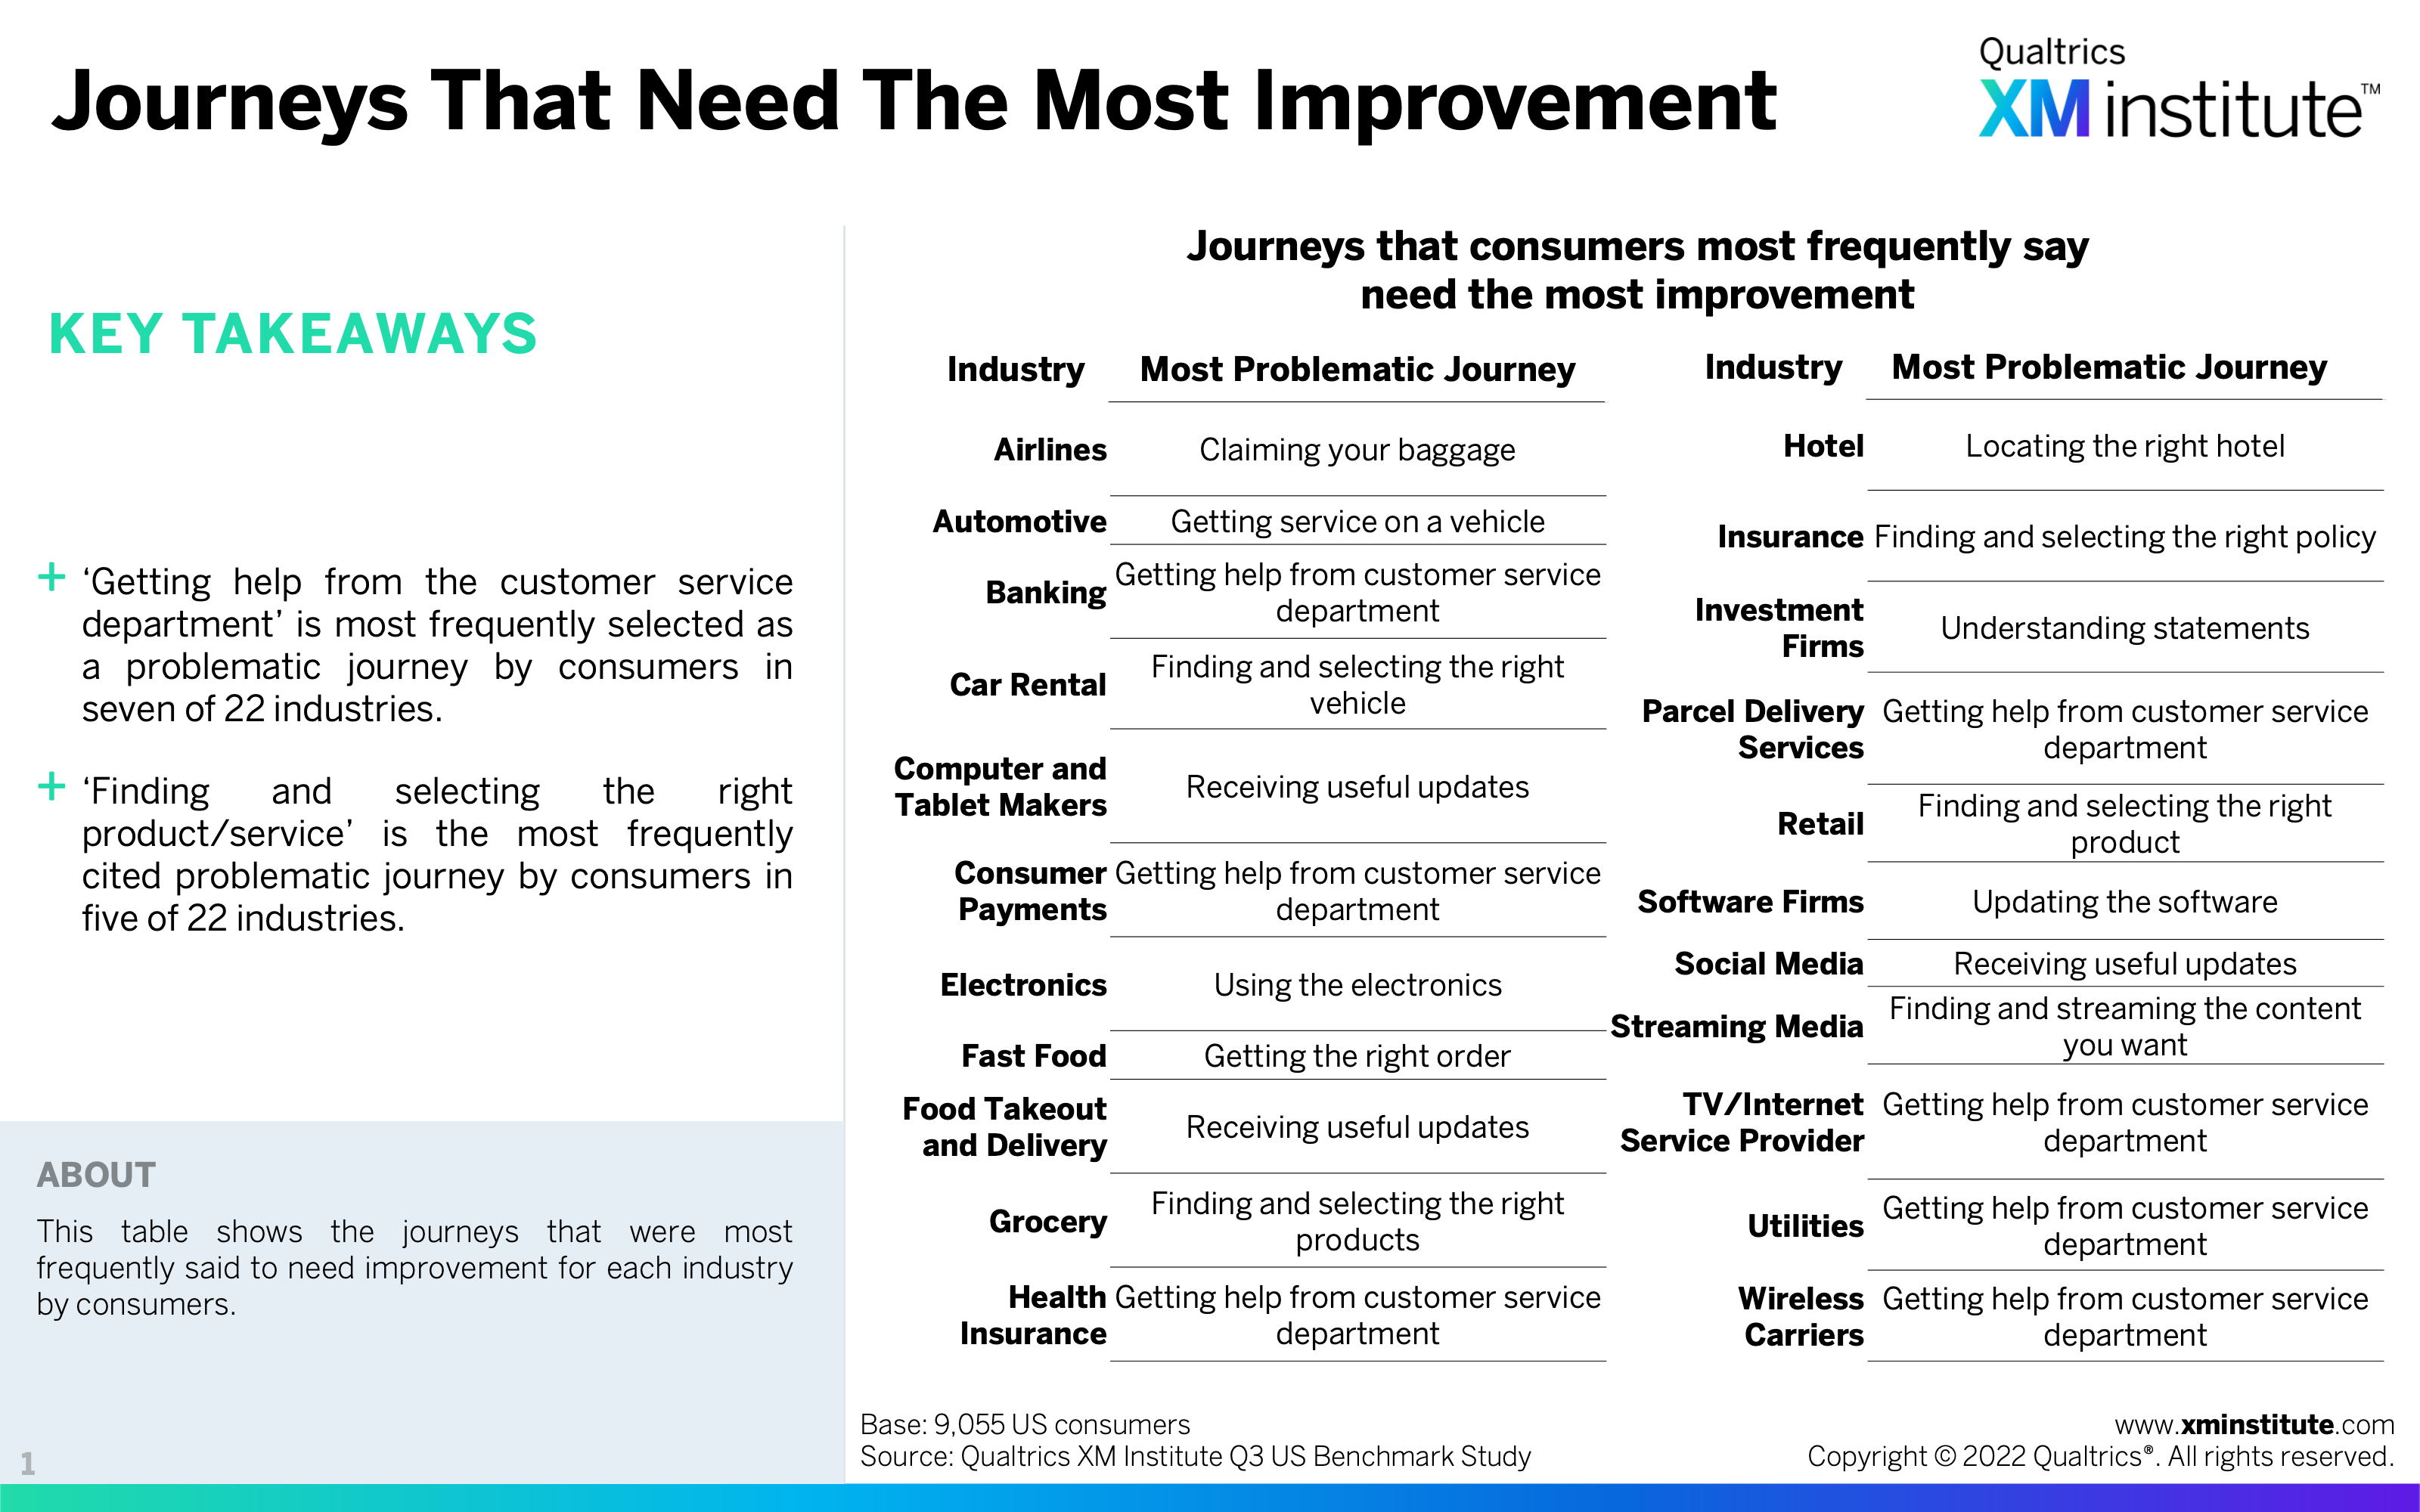
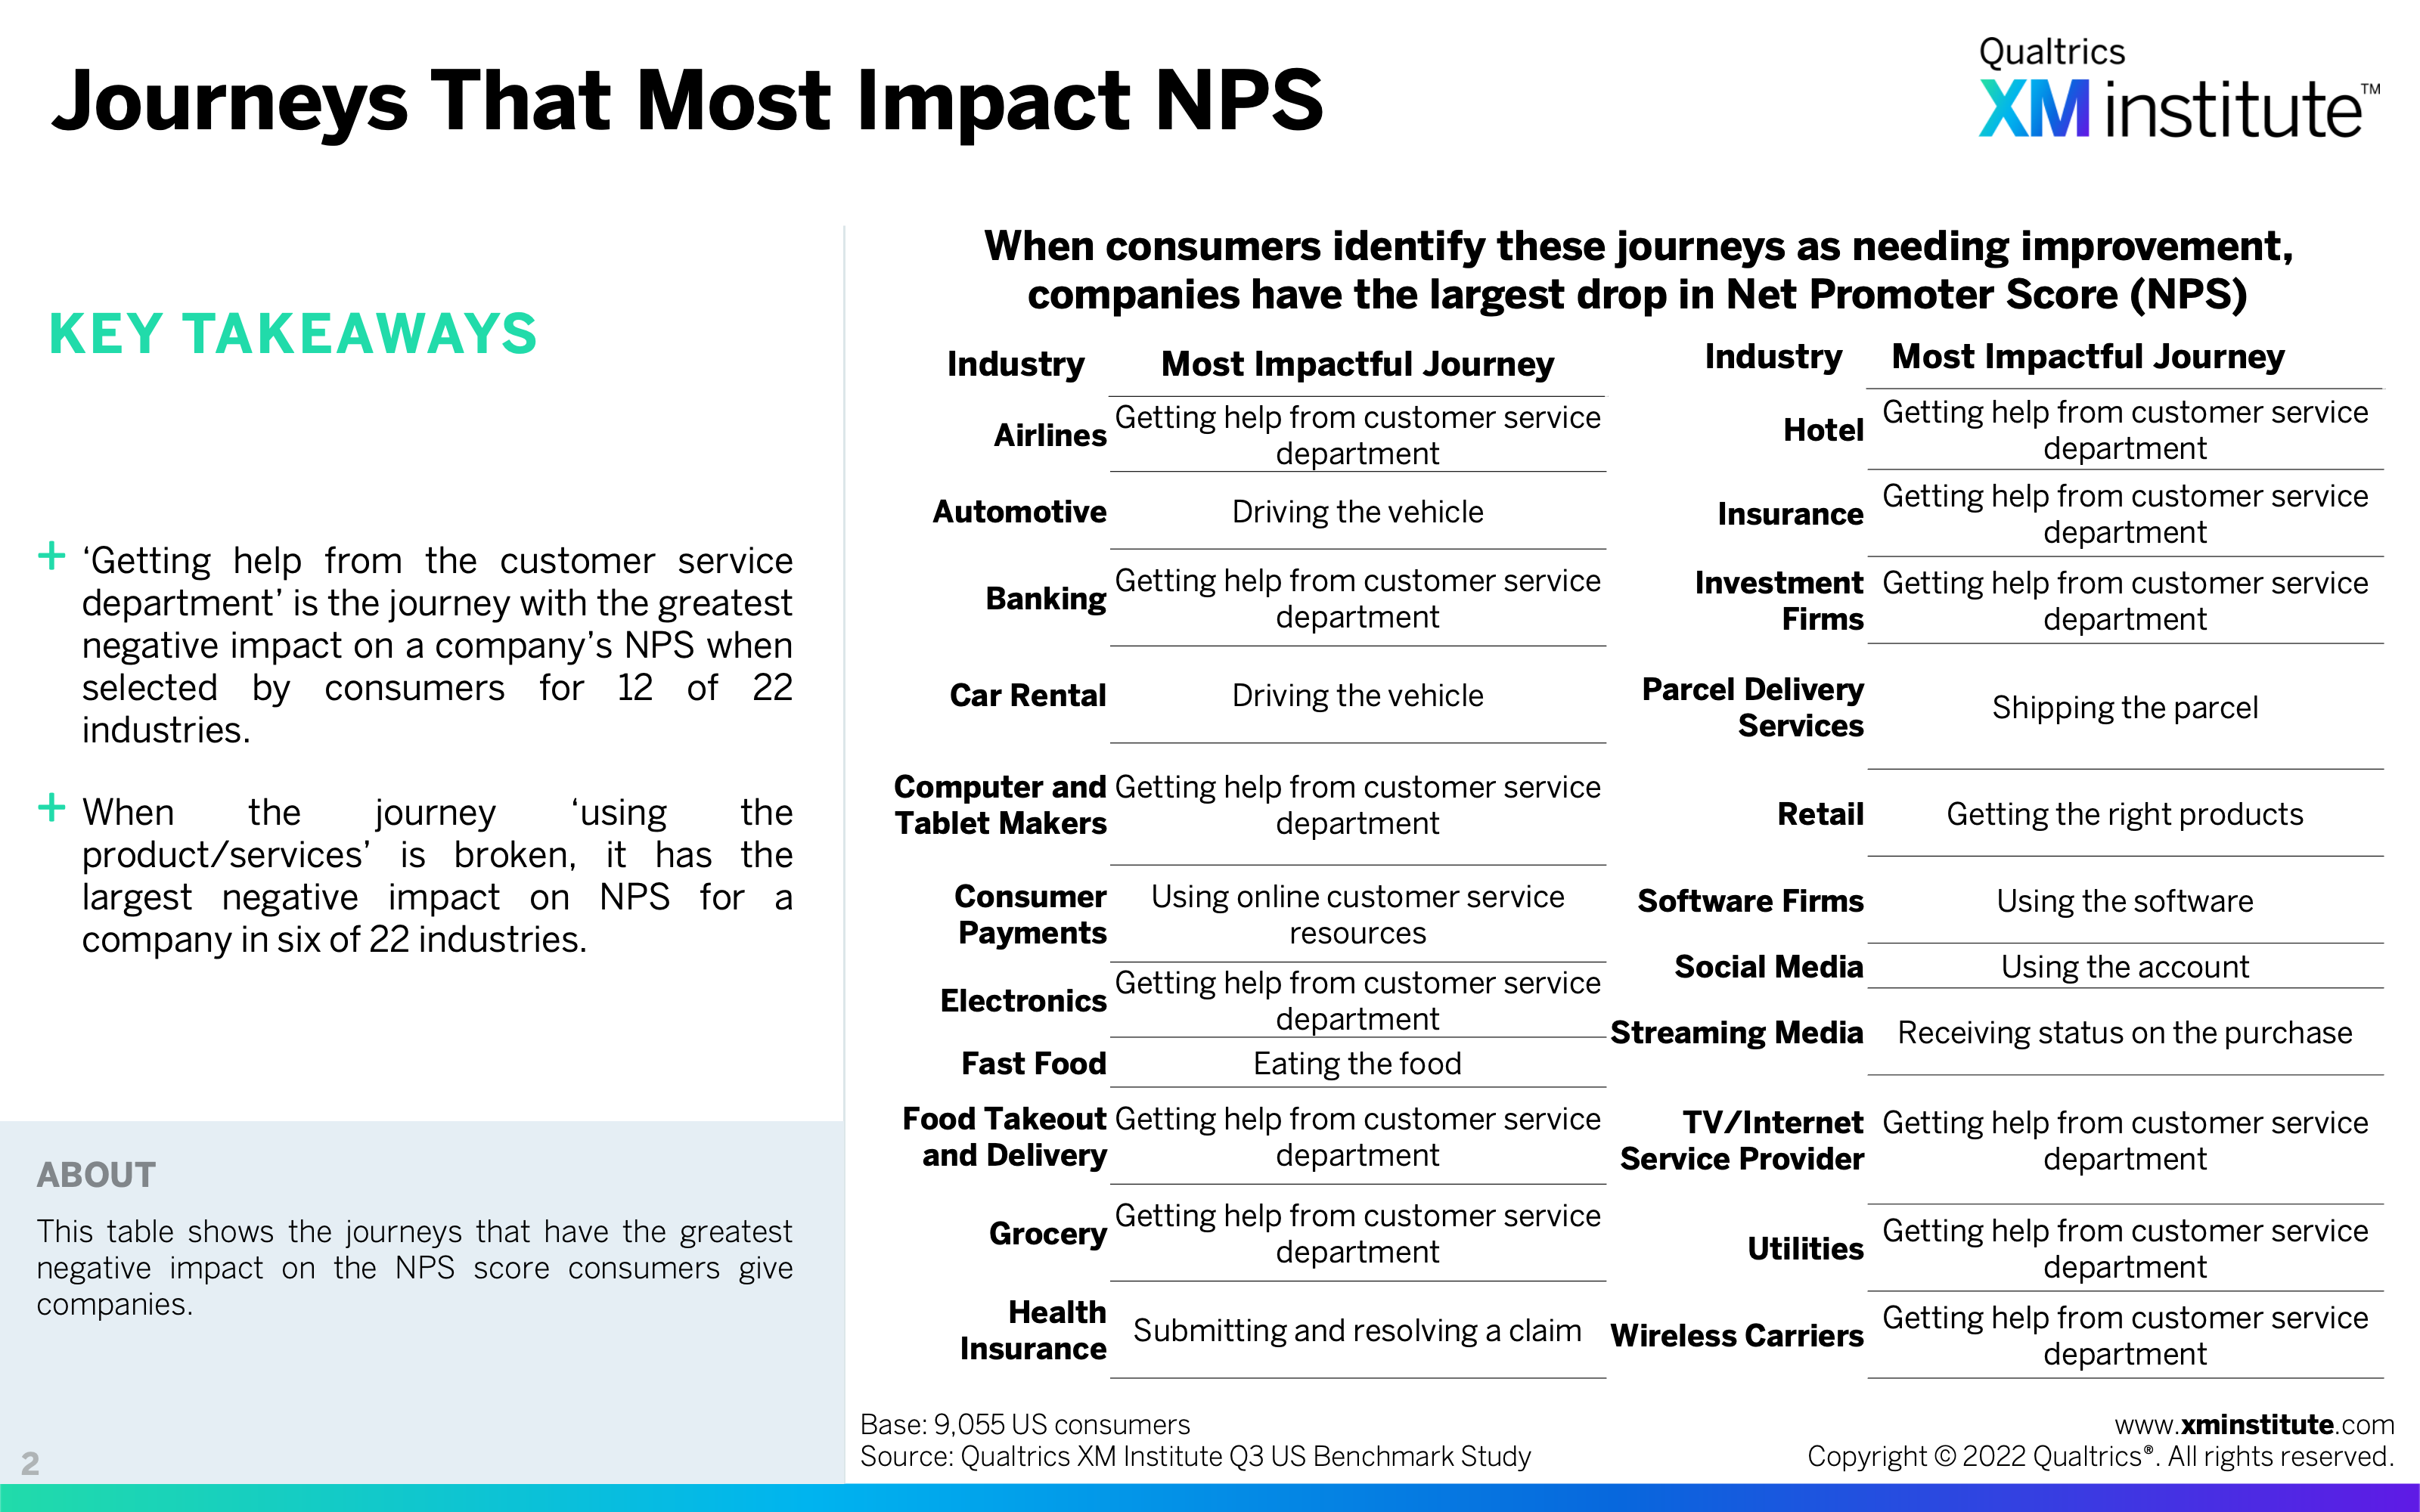
- Consumers find it difficult to get help from customer service. In seven of 22 industries, consumers most frequently identified ‘getting help from the customer service department’ as a journey that could use improvement. When identified as a broken journey, it had the most negative impact on NPS of all journeys in 12 of 22 industries.
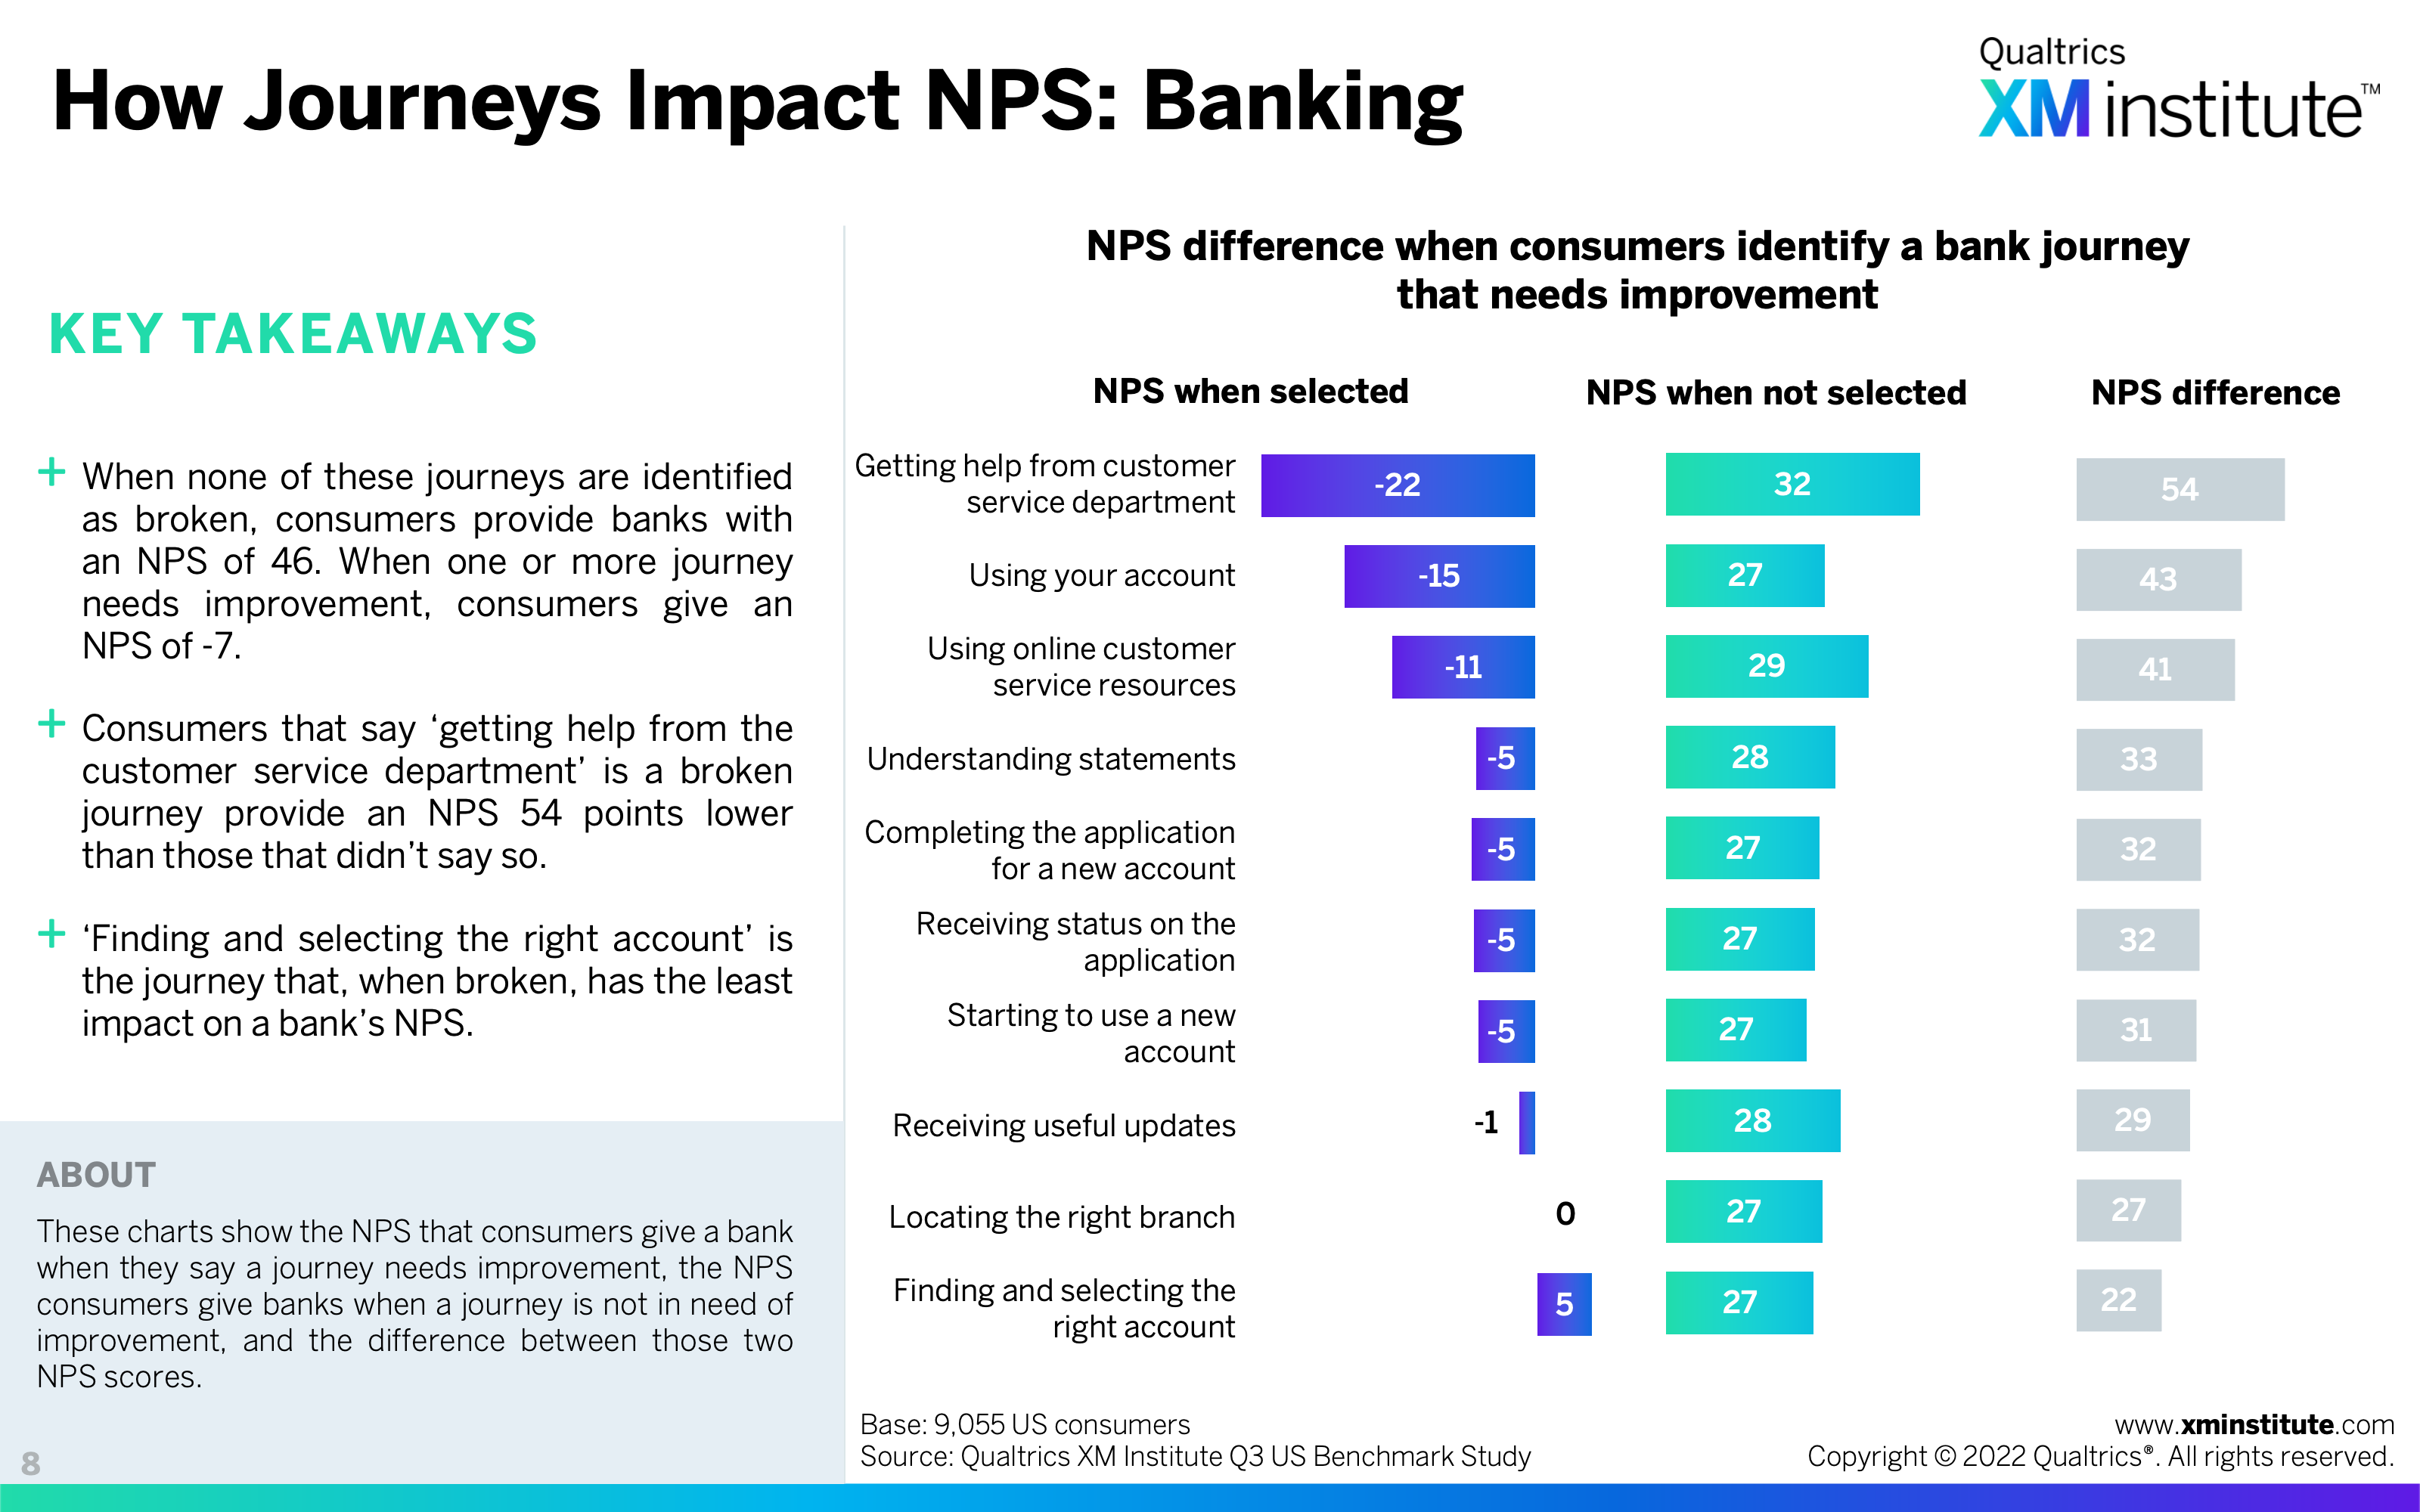
- Negative experiences with banks have the greatest impact on NPS. When a banking experience is identified as broken by a consumer, it has an average impact of -34 points to a company’s NPS, the highest of all industries. Customers that struggle to get help from a bank’s customer service department give an NPS 54 points lower than those that did not.
Figures
Here are the figures in this Data Snapshot:
- Journeys that Need the Most Improvement (see Figure 1)
- Journeys that Most Impact NPS (see Figure 2)
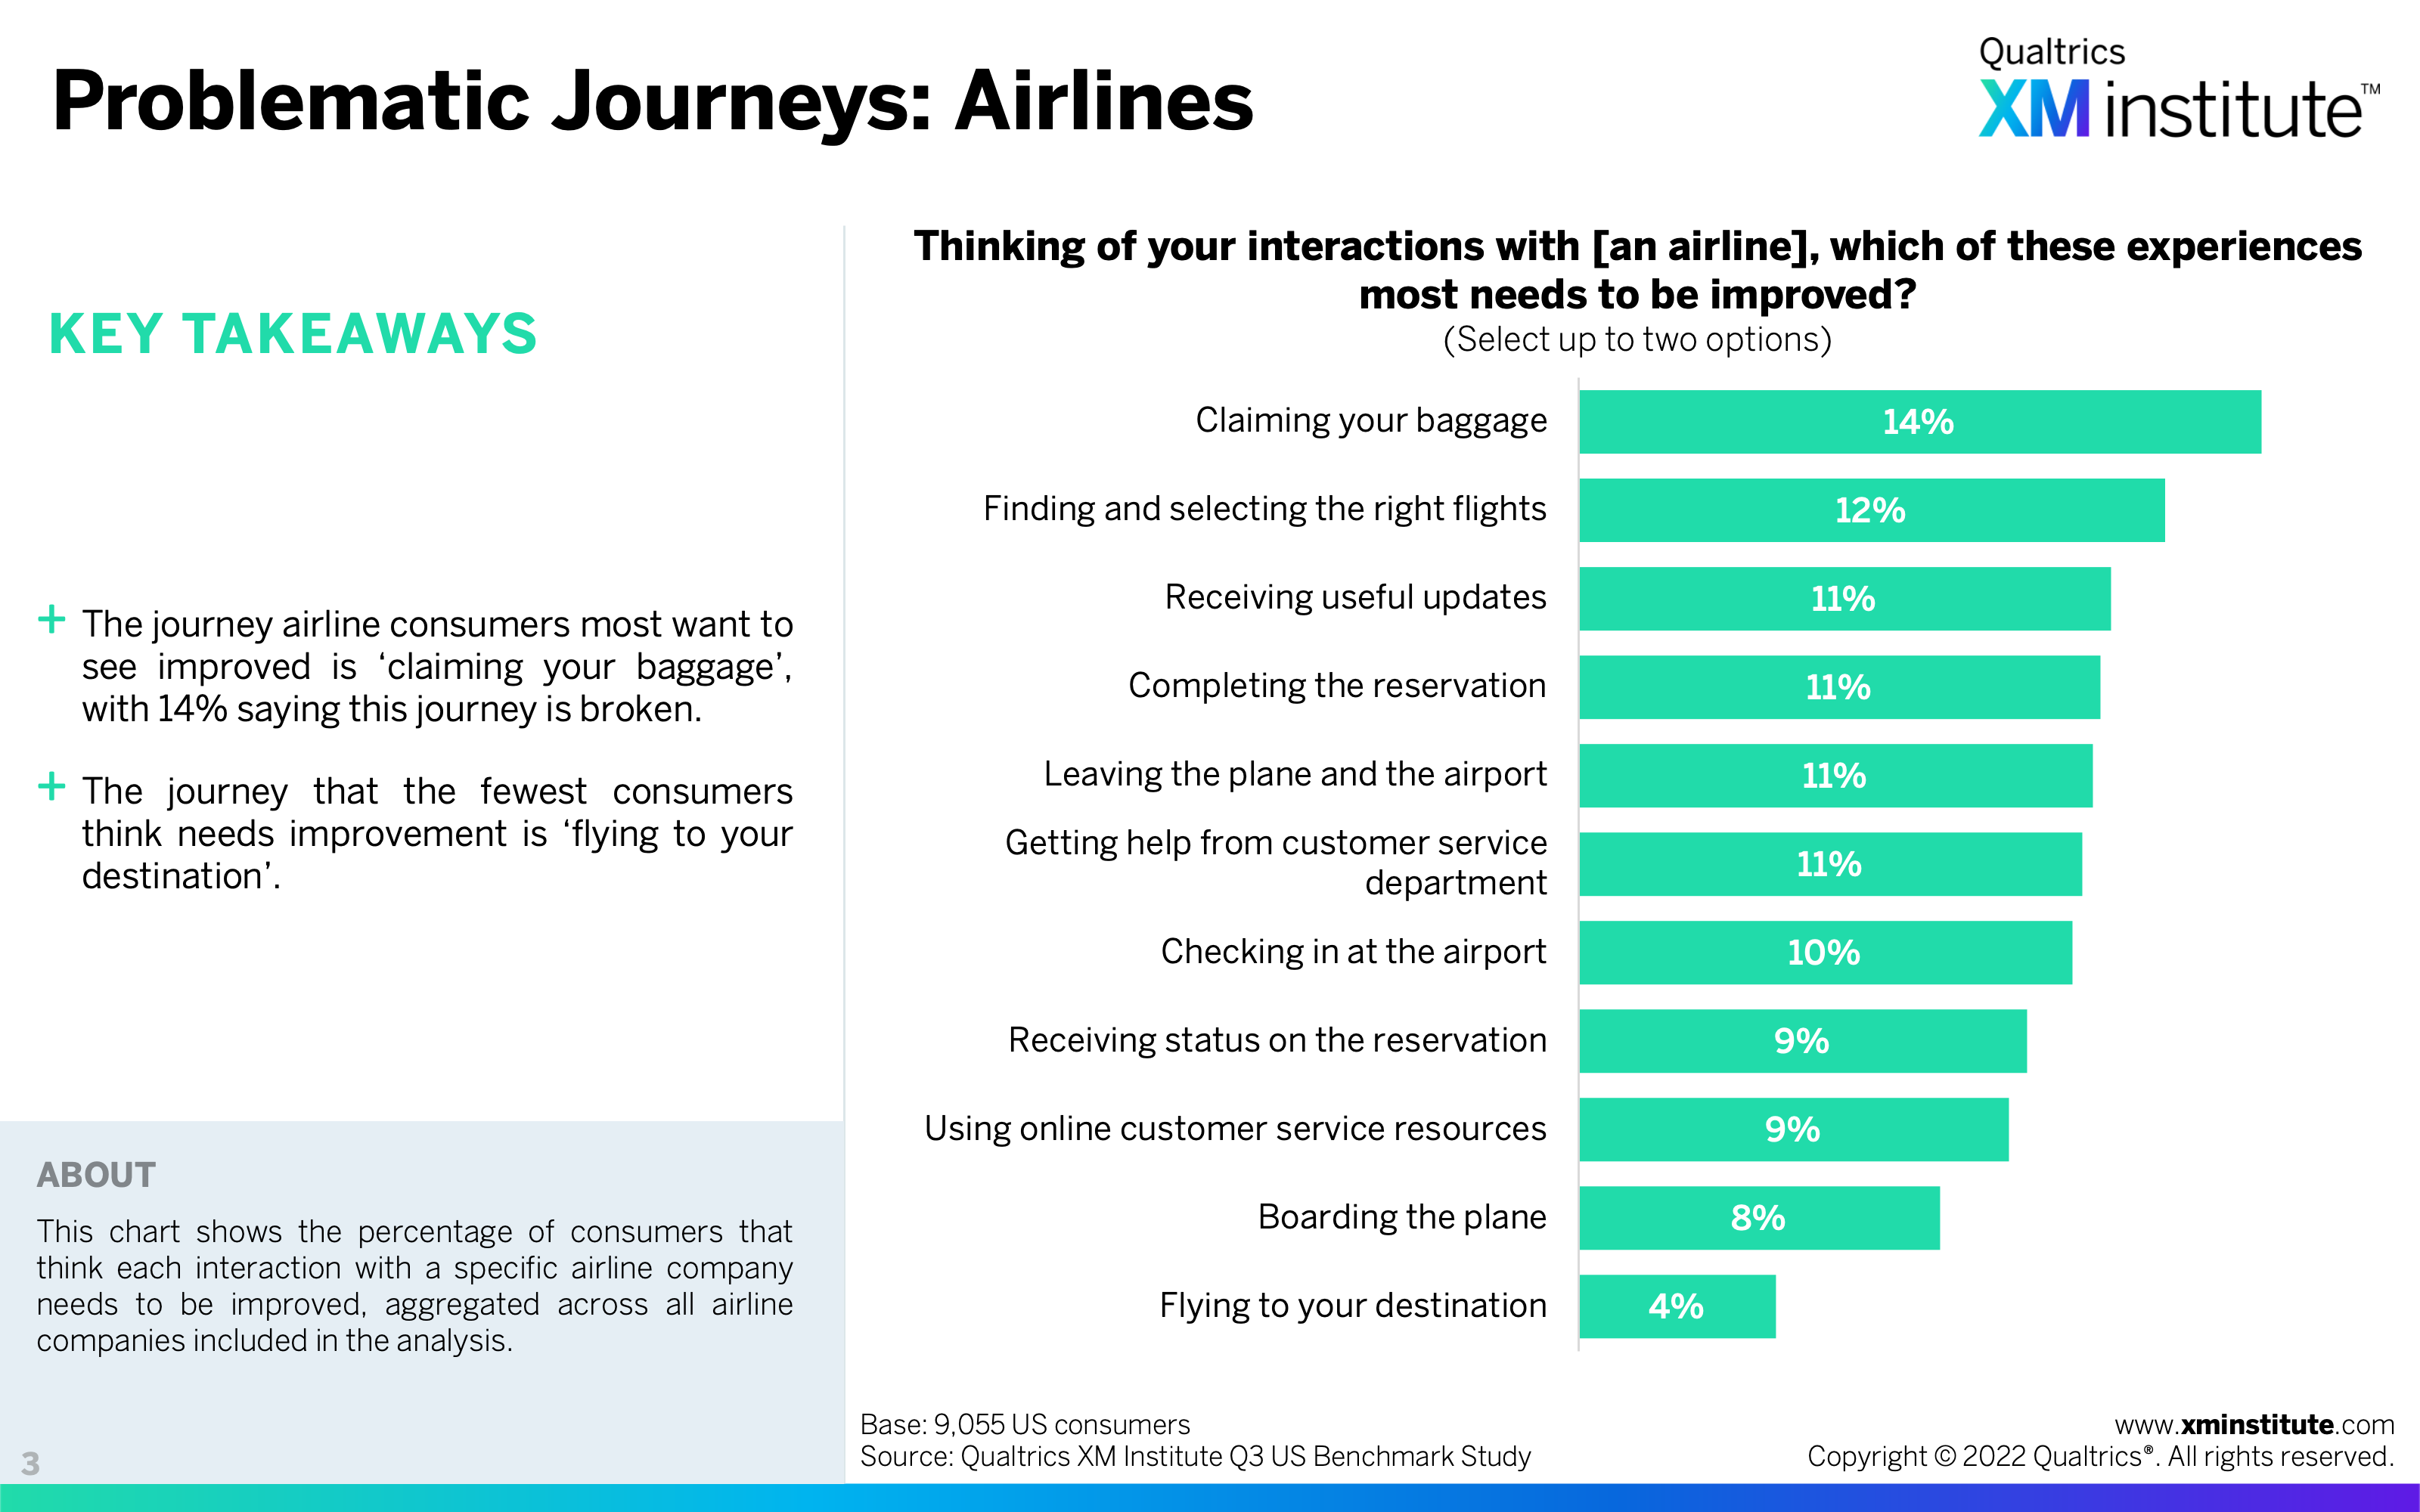
- Problematic Journeys: Airlines (see Figure 3)
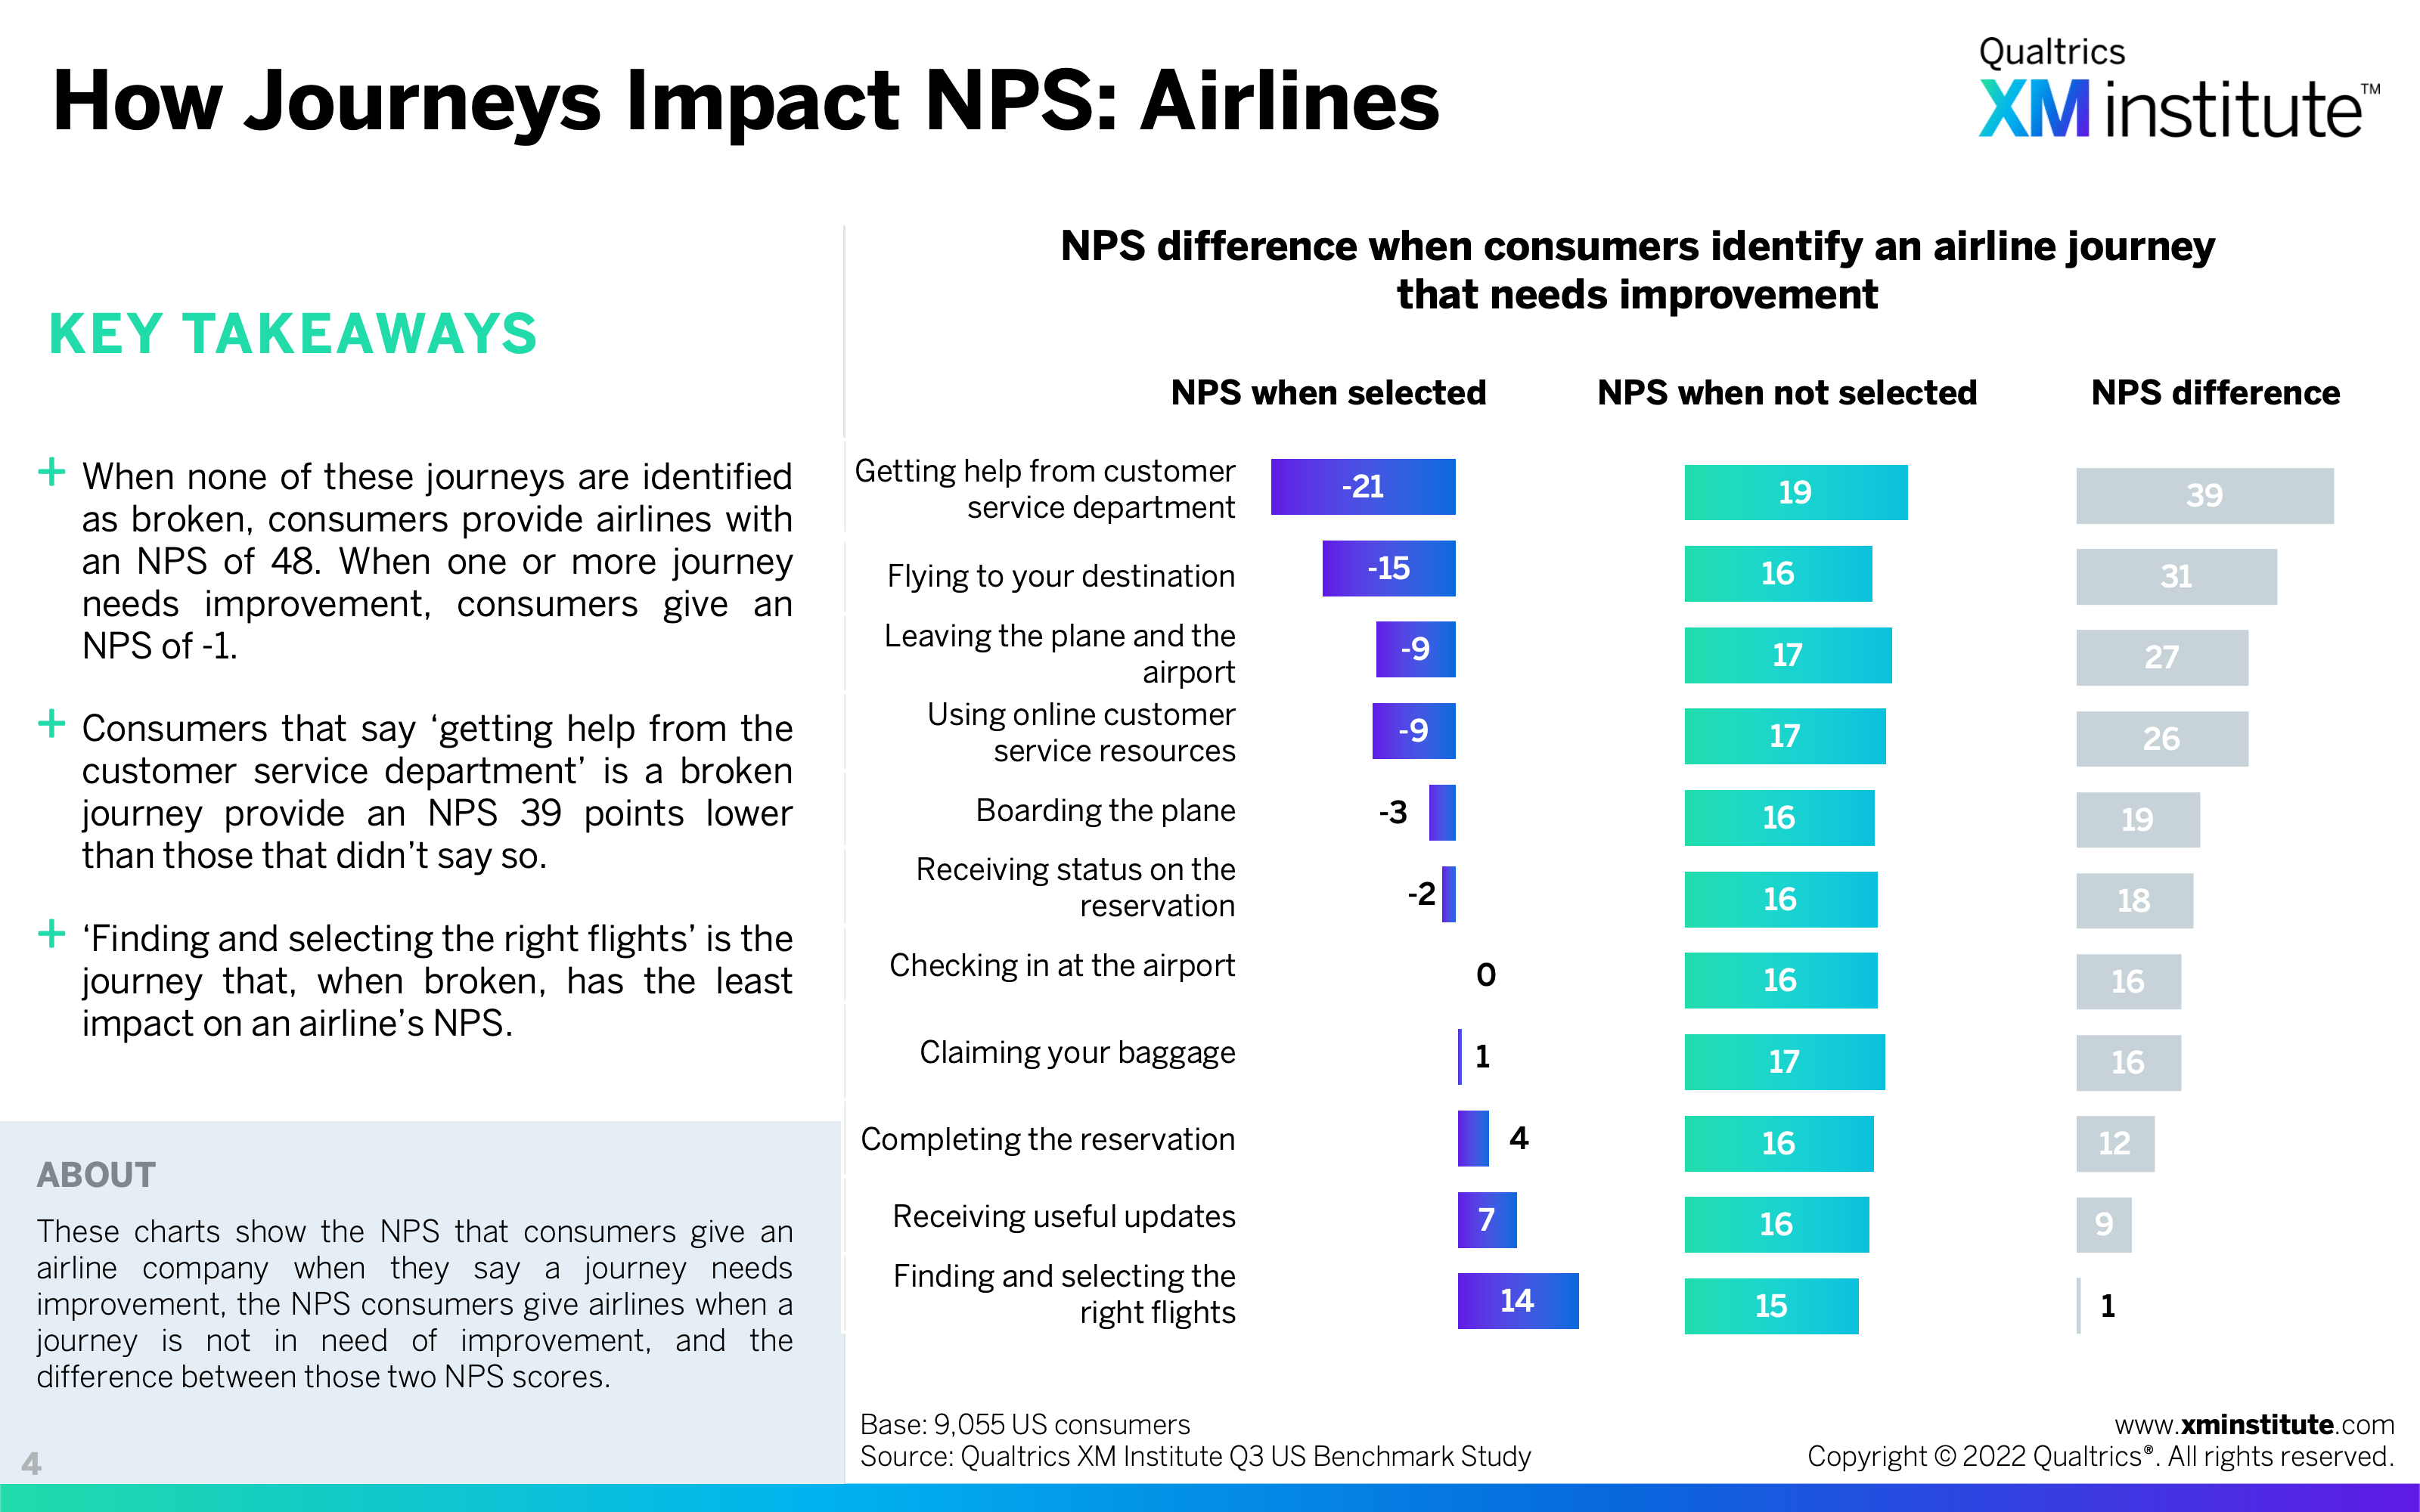
- How Journeys Impact NPS: Airlines (see Figure 4)
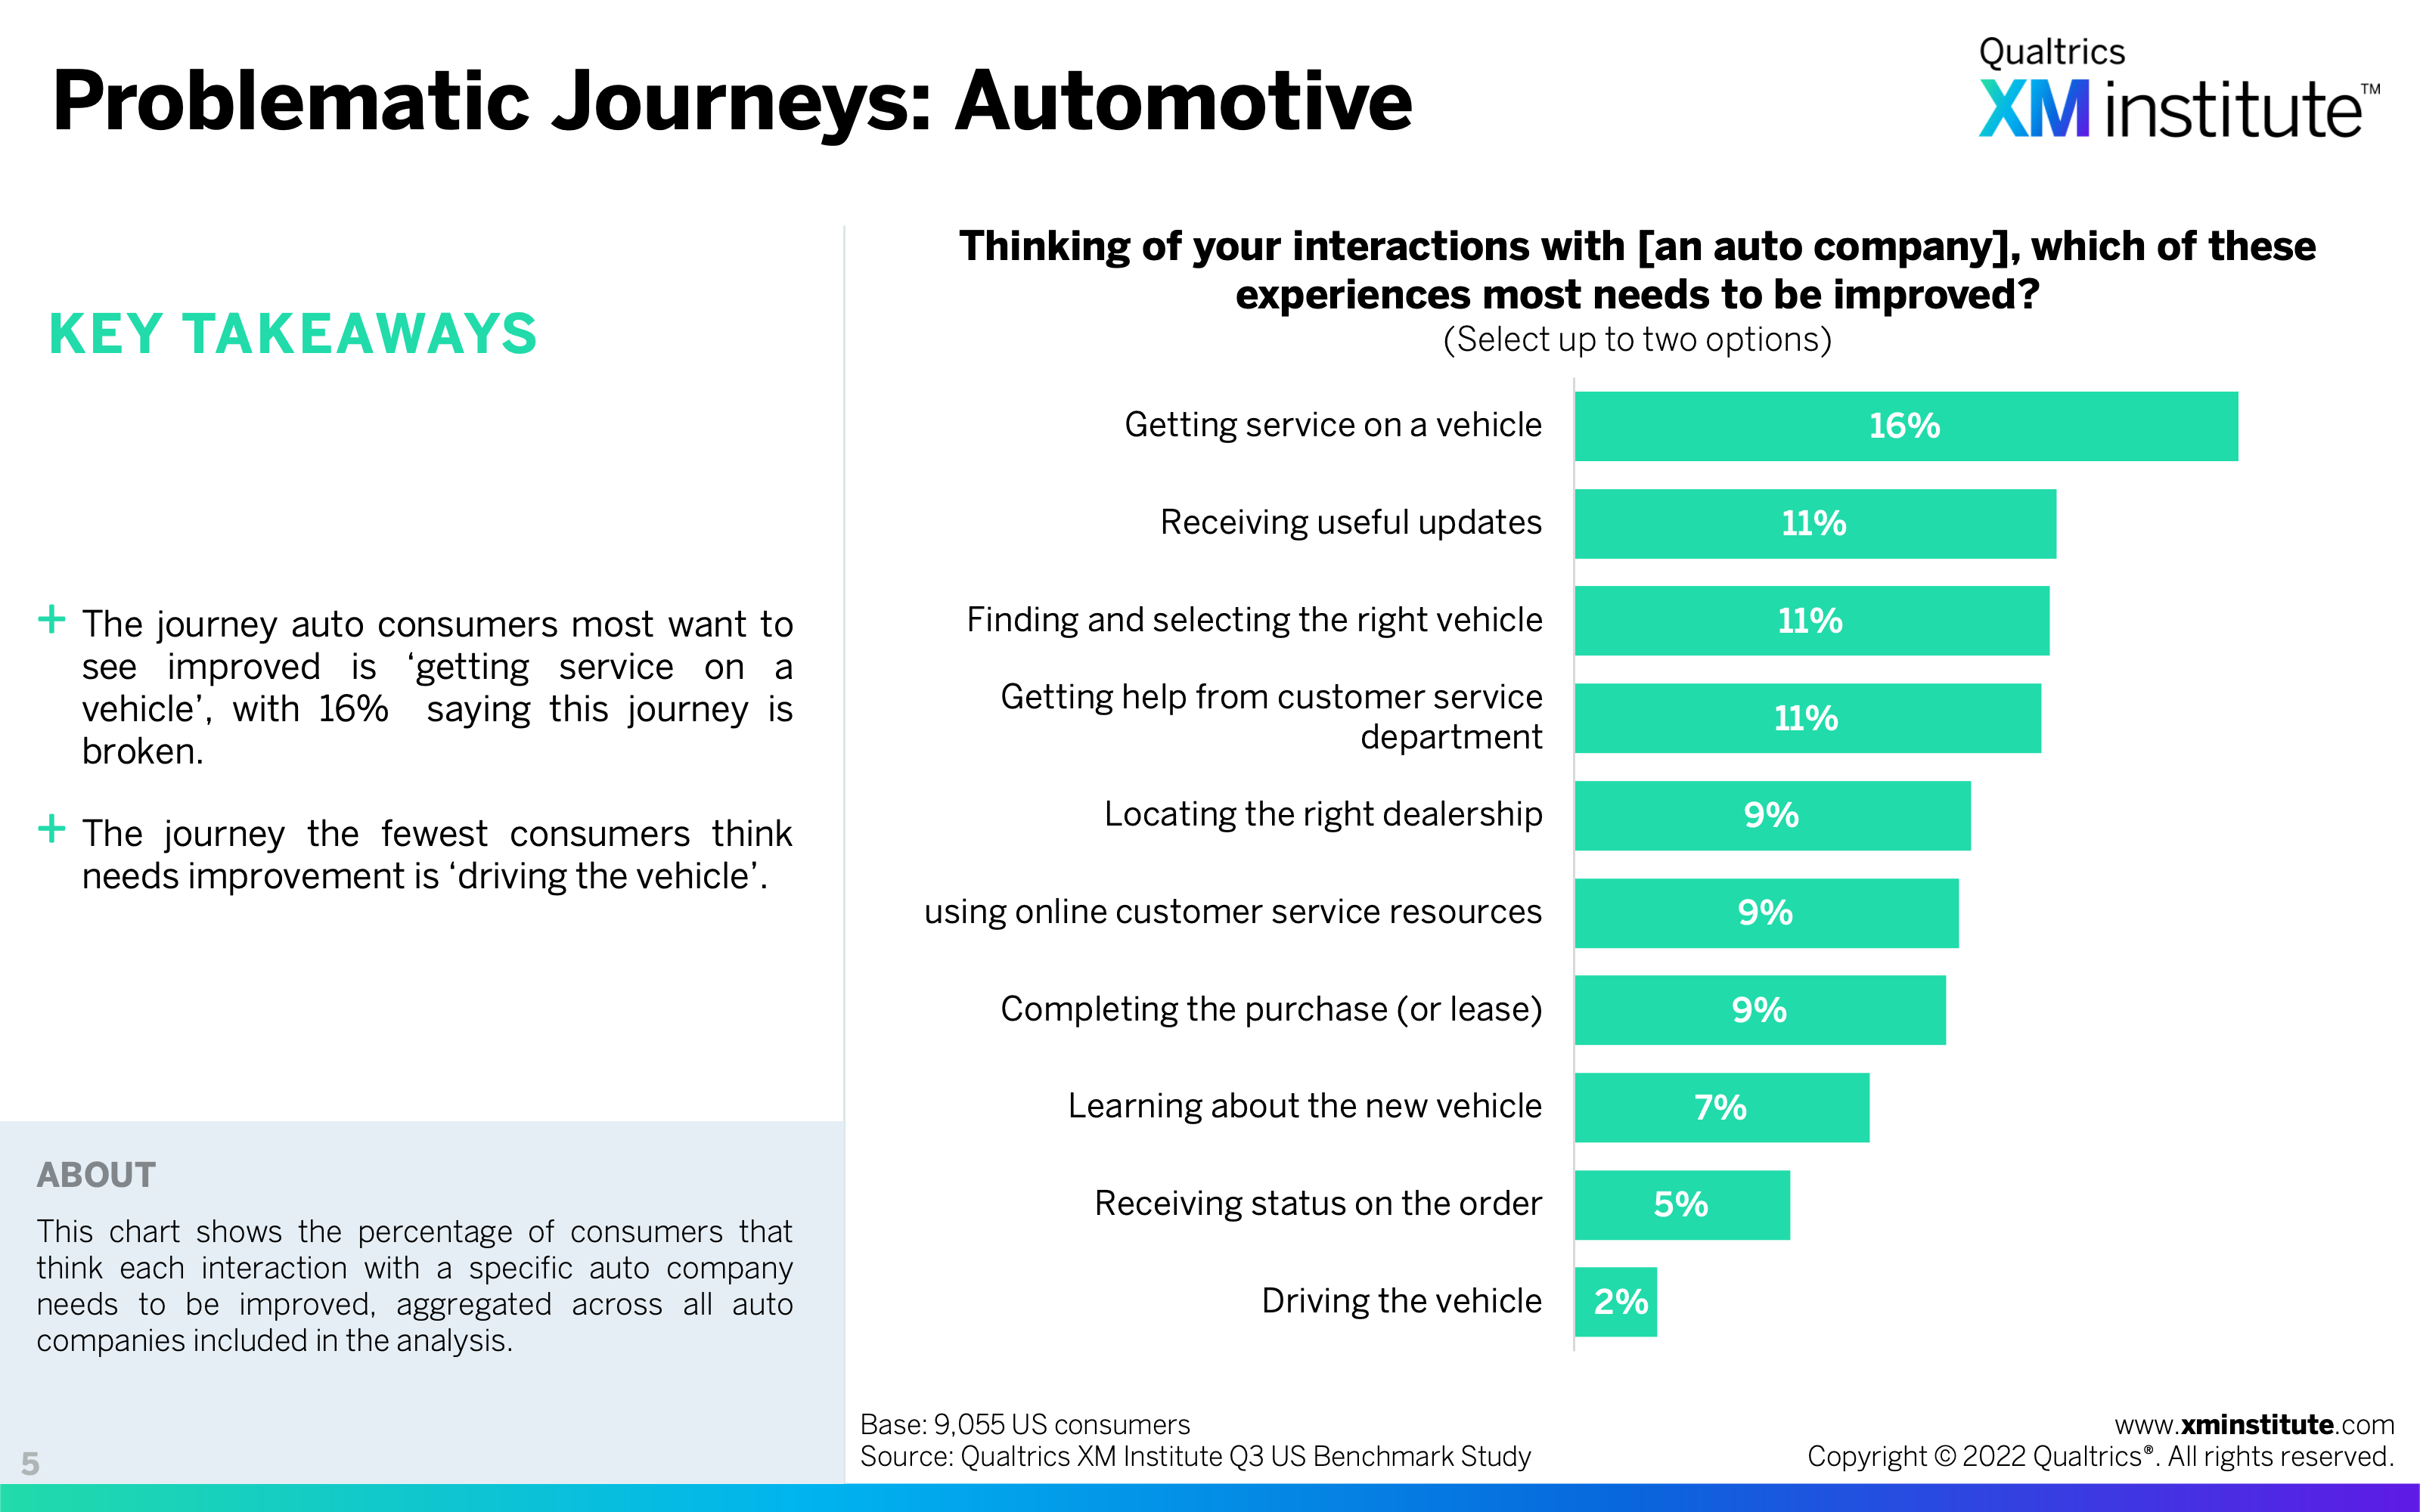
- Problematic Journeys: Automotive (see Figure 5)
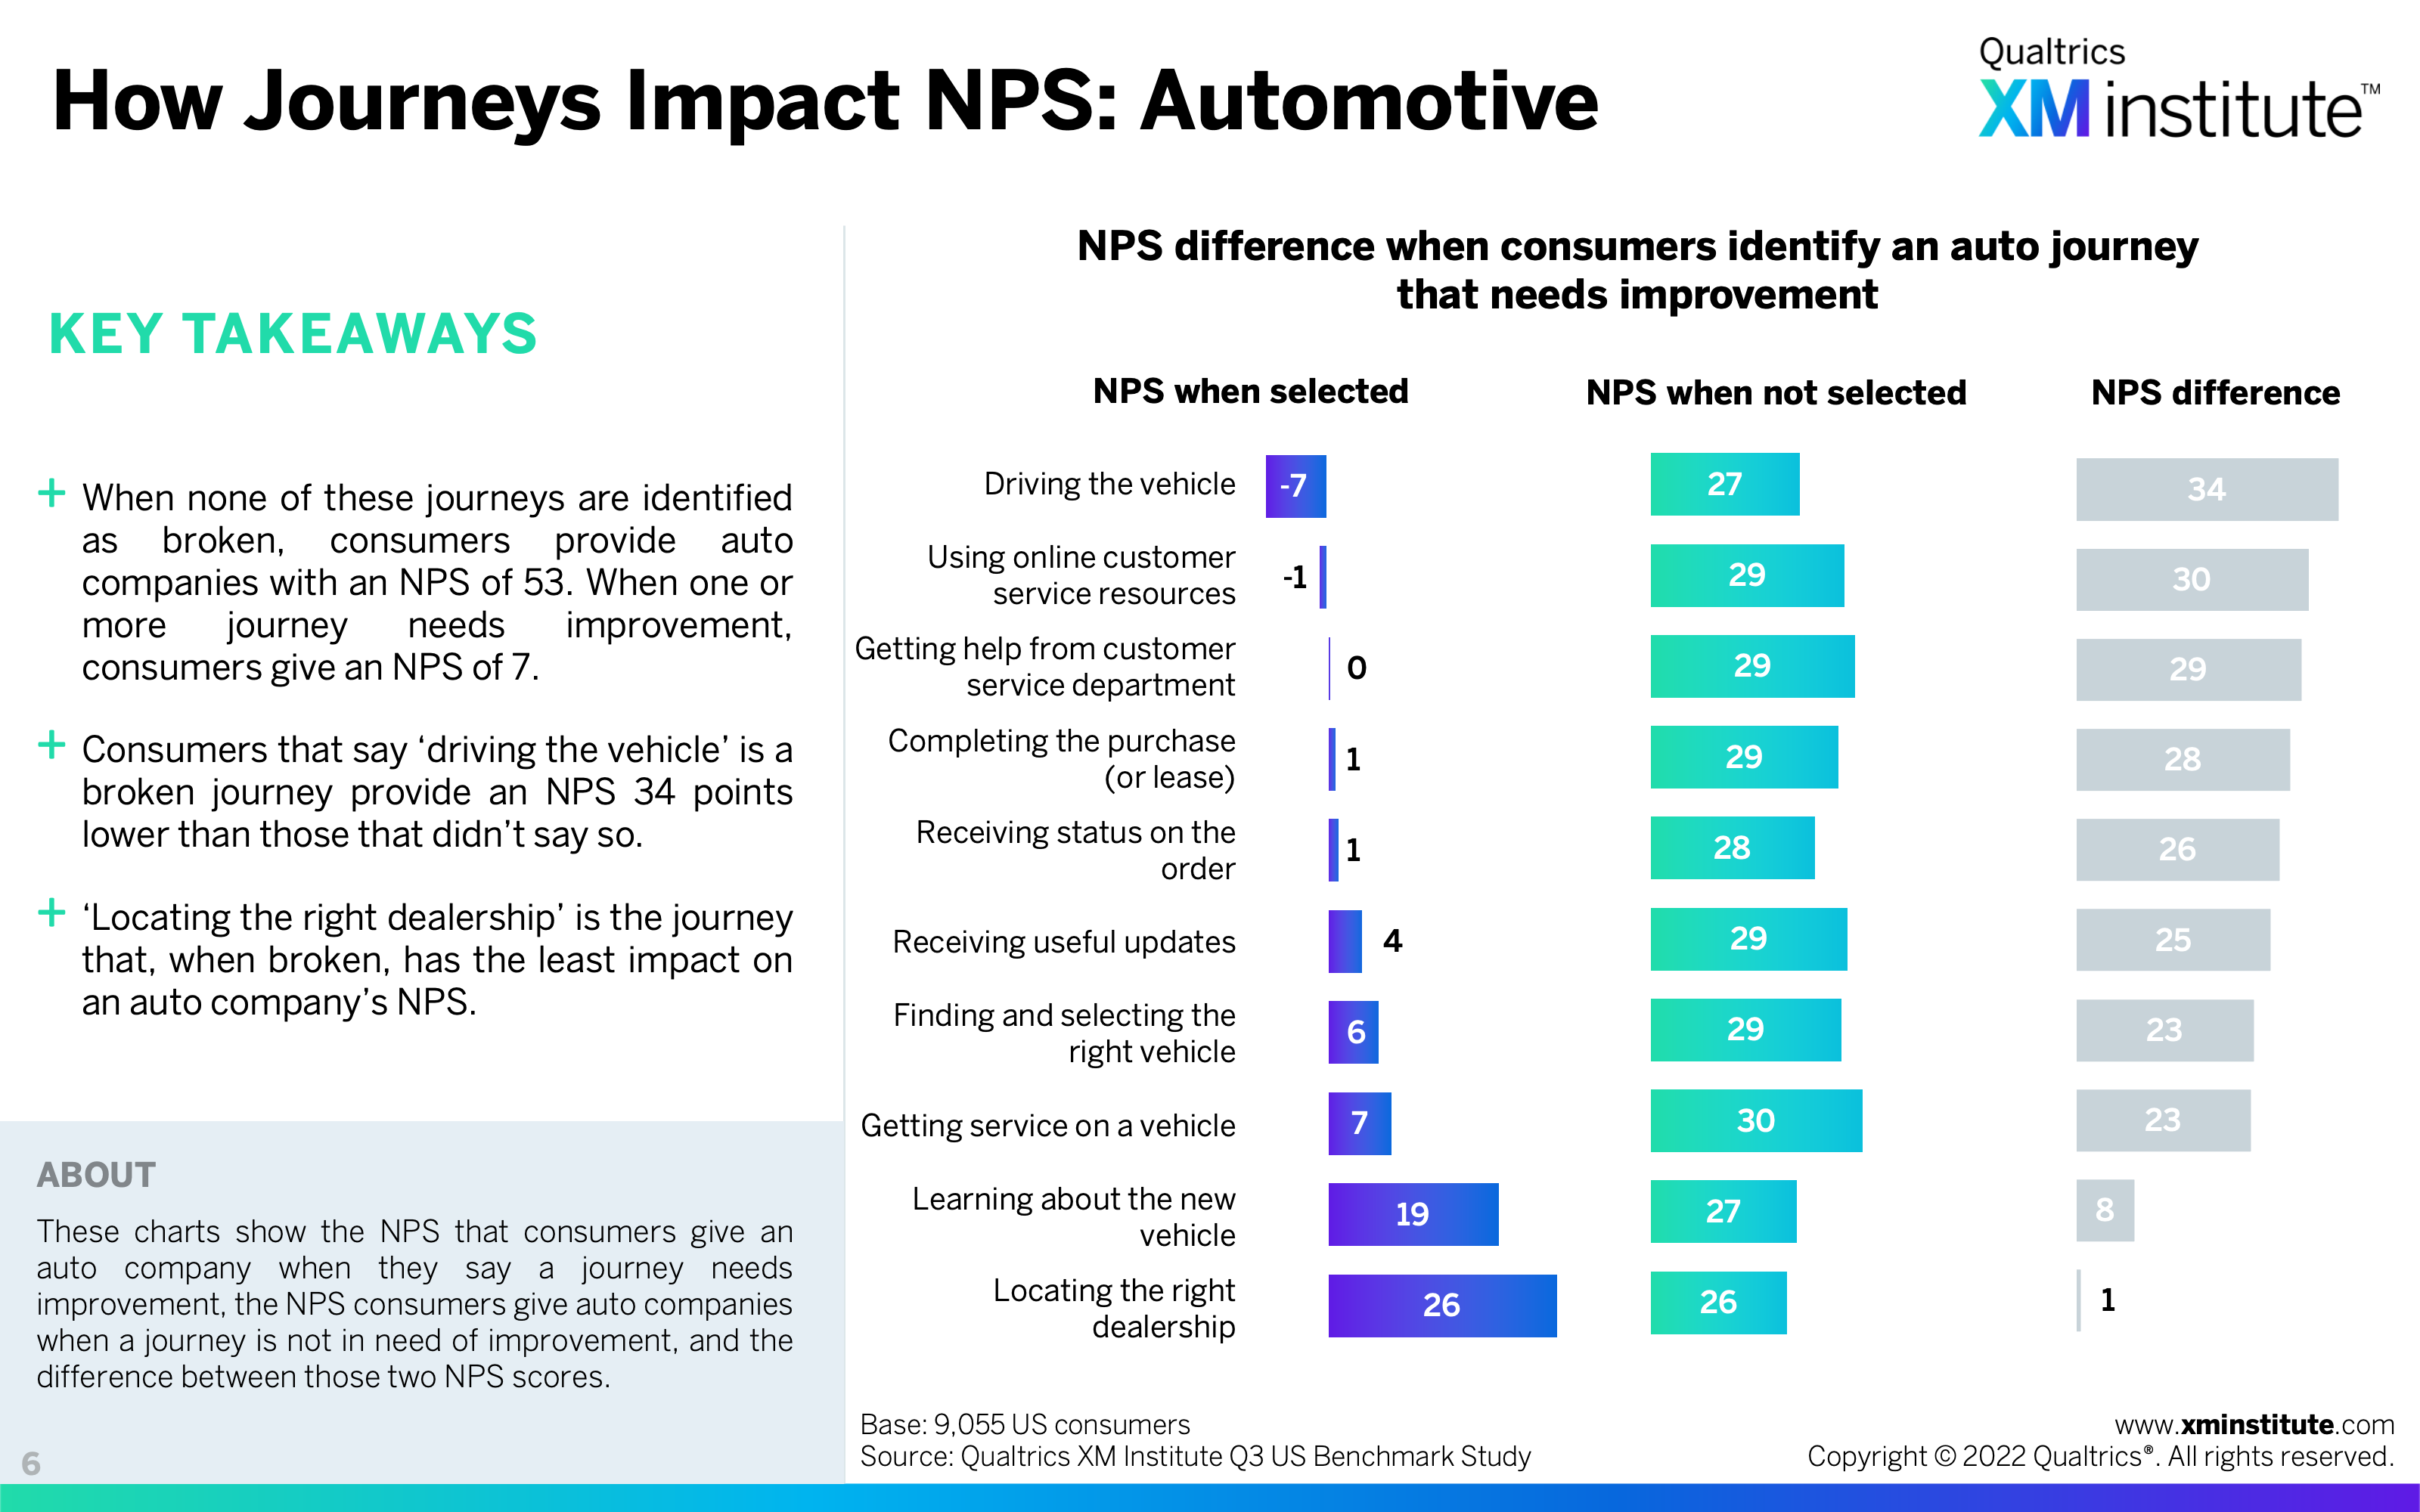
- How Journeys Impact NPS: Automotive (see Figure 6)
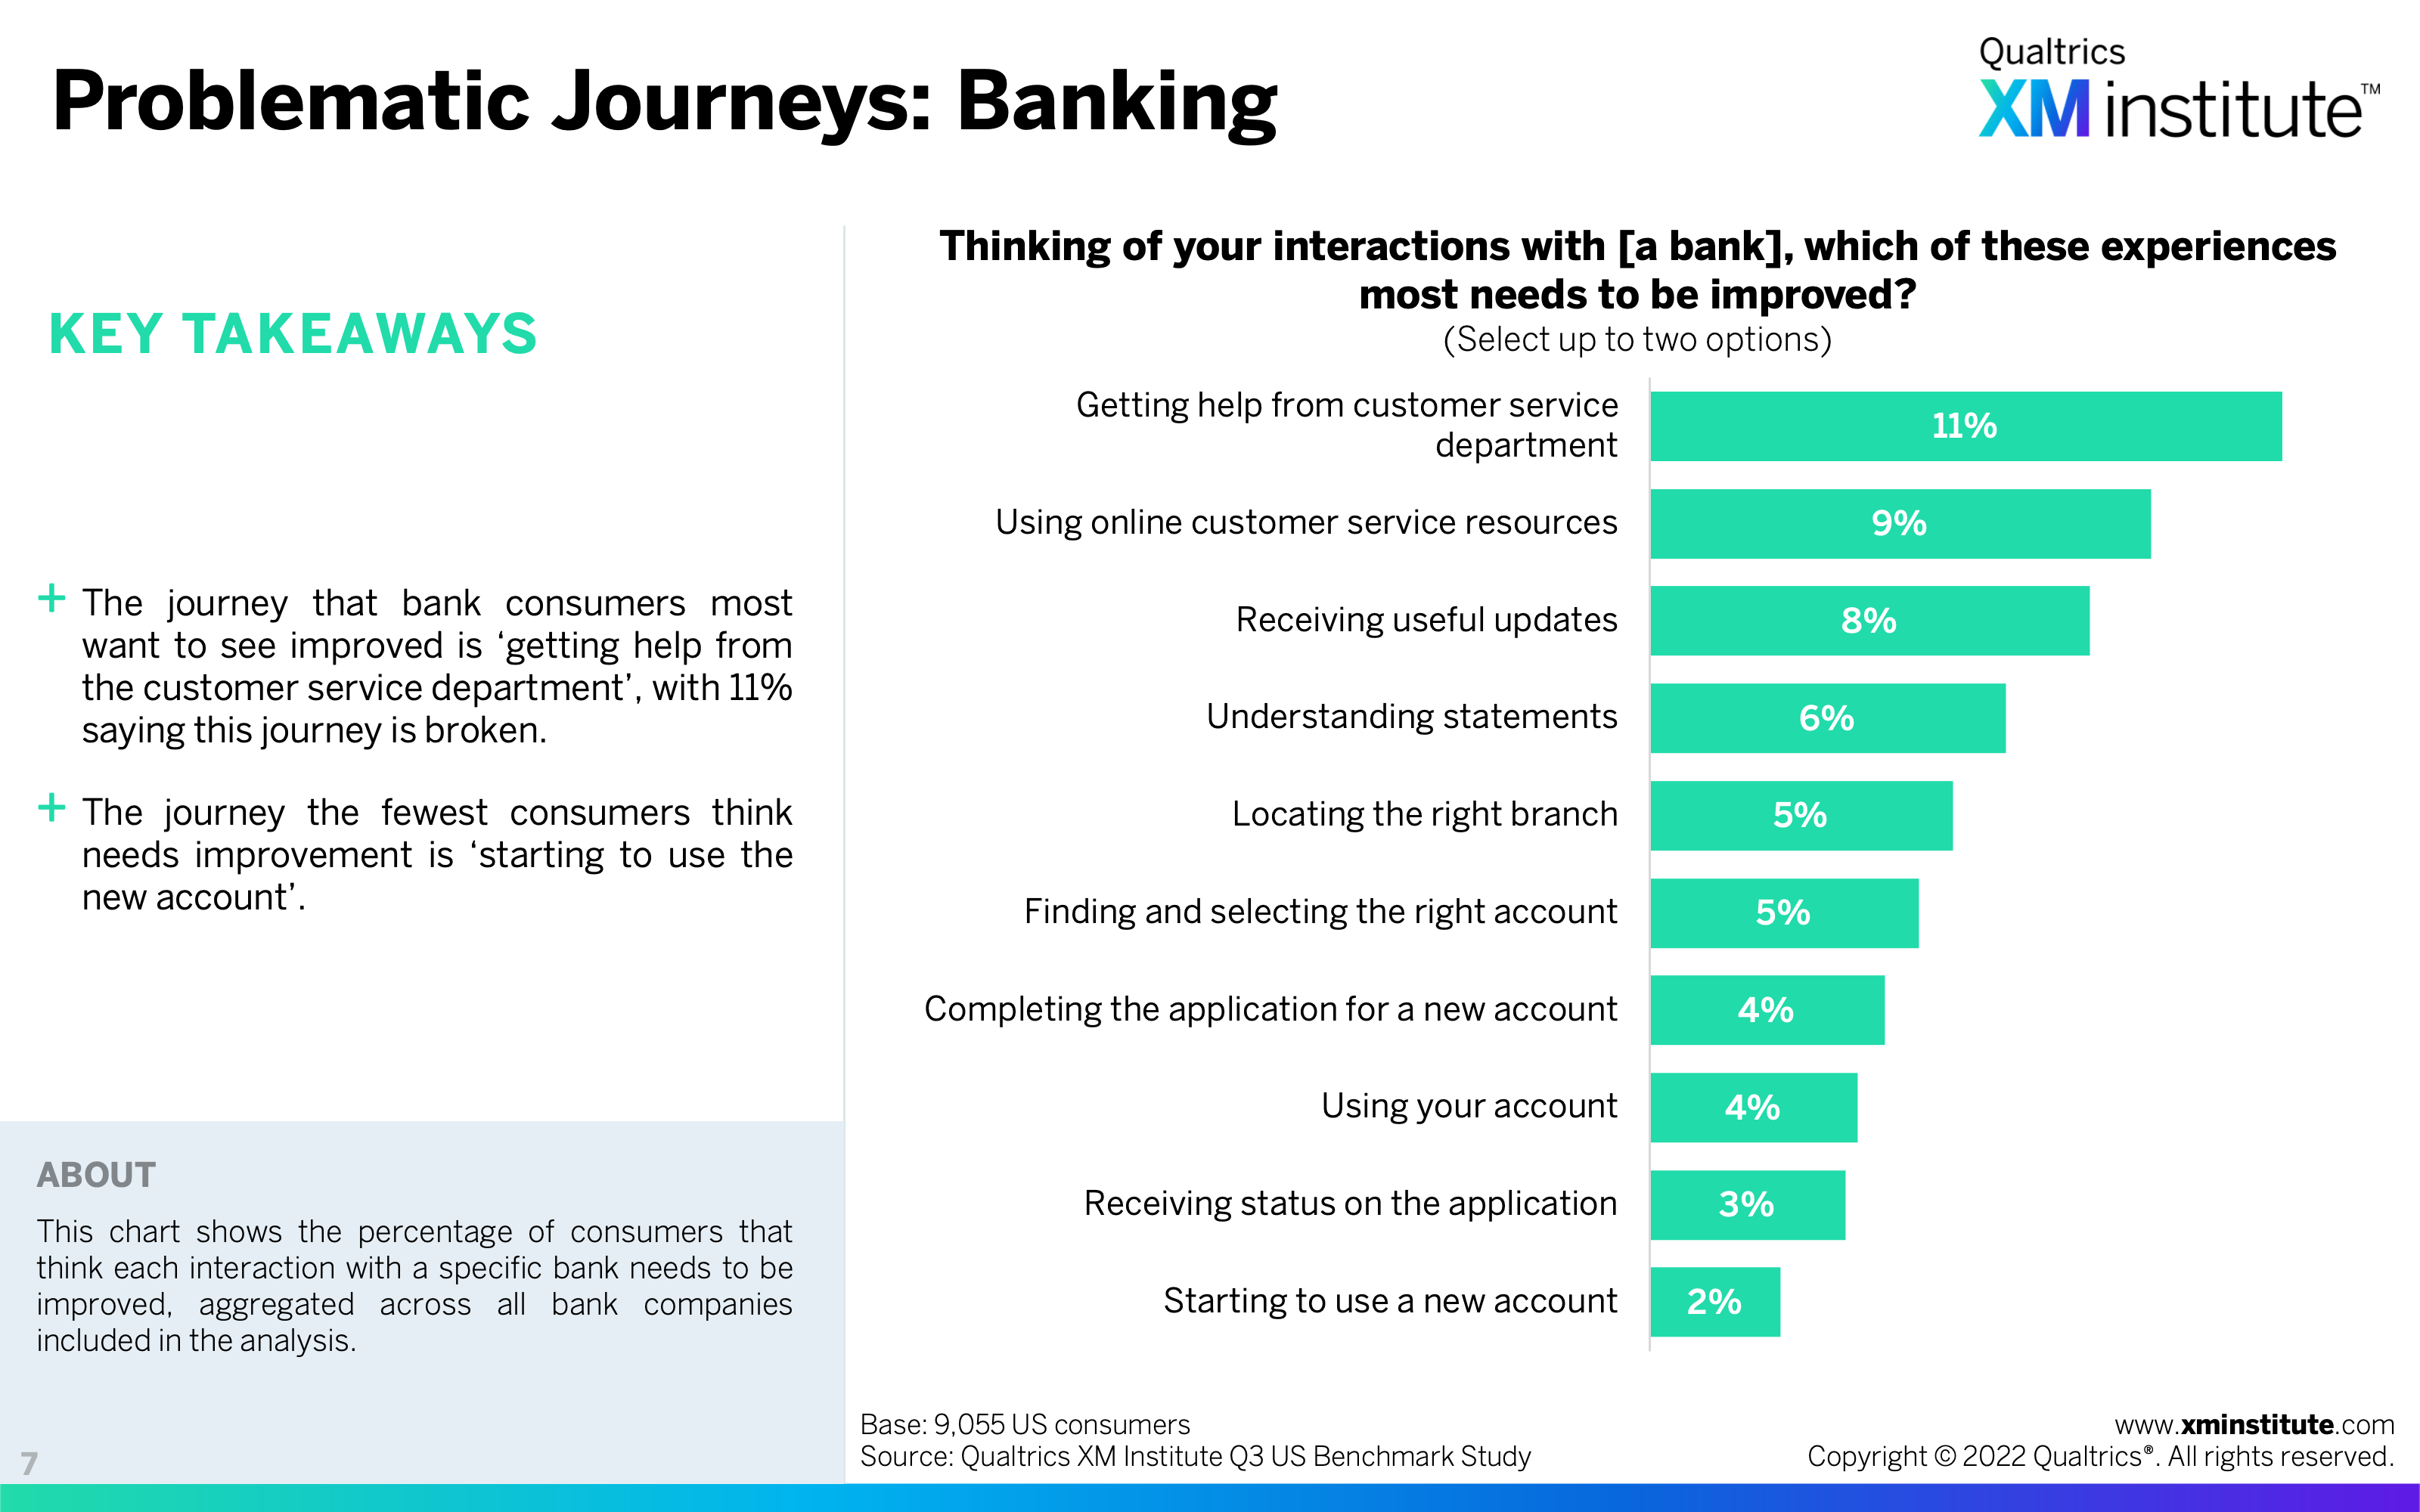
- Problematic Journeys: Banking (see Figure 7)
- How Journeys Impact NPS: Banking (see Figure 8)
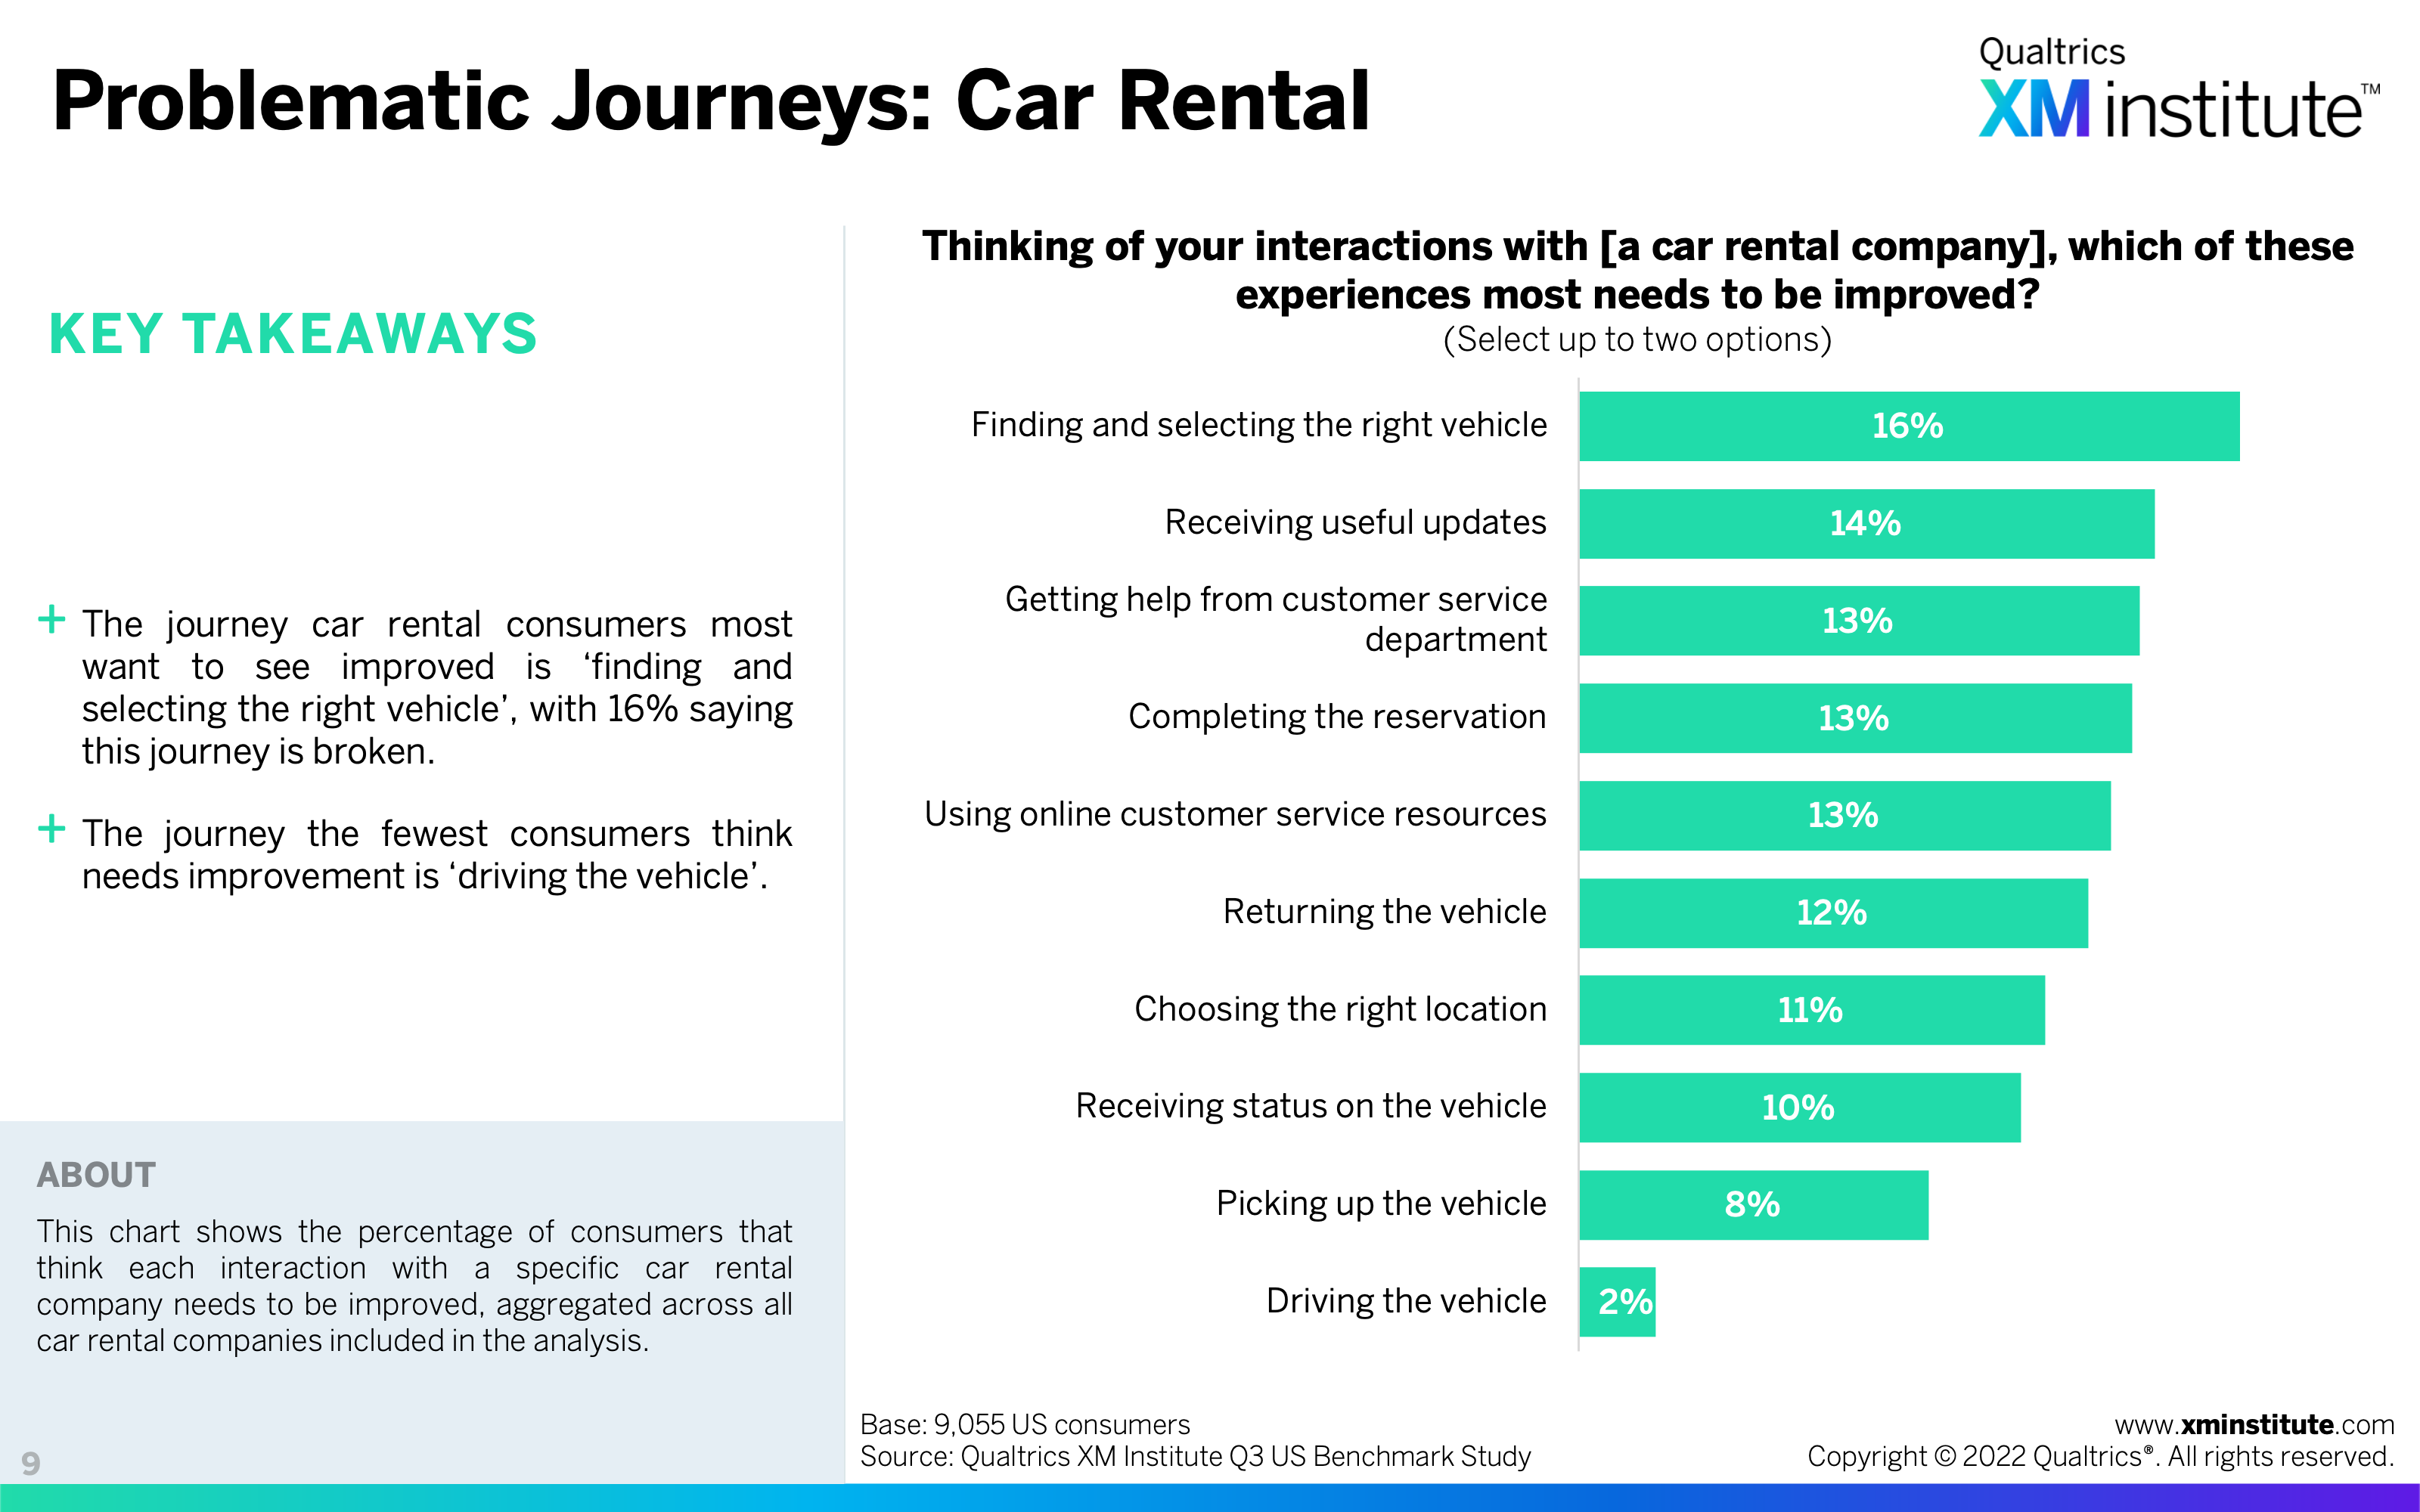
- Problematic Journeys: Car Rental (see Figure 9)
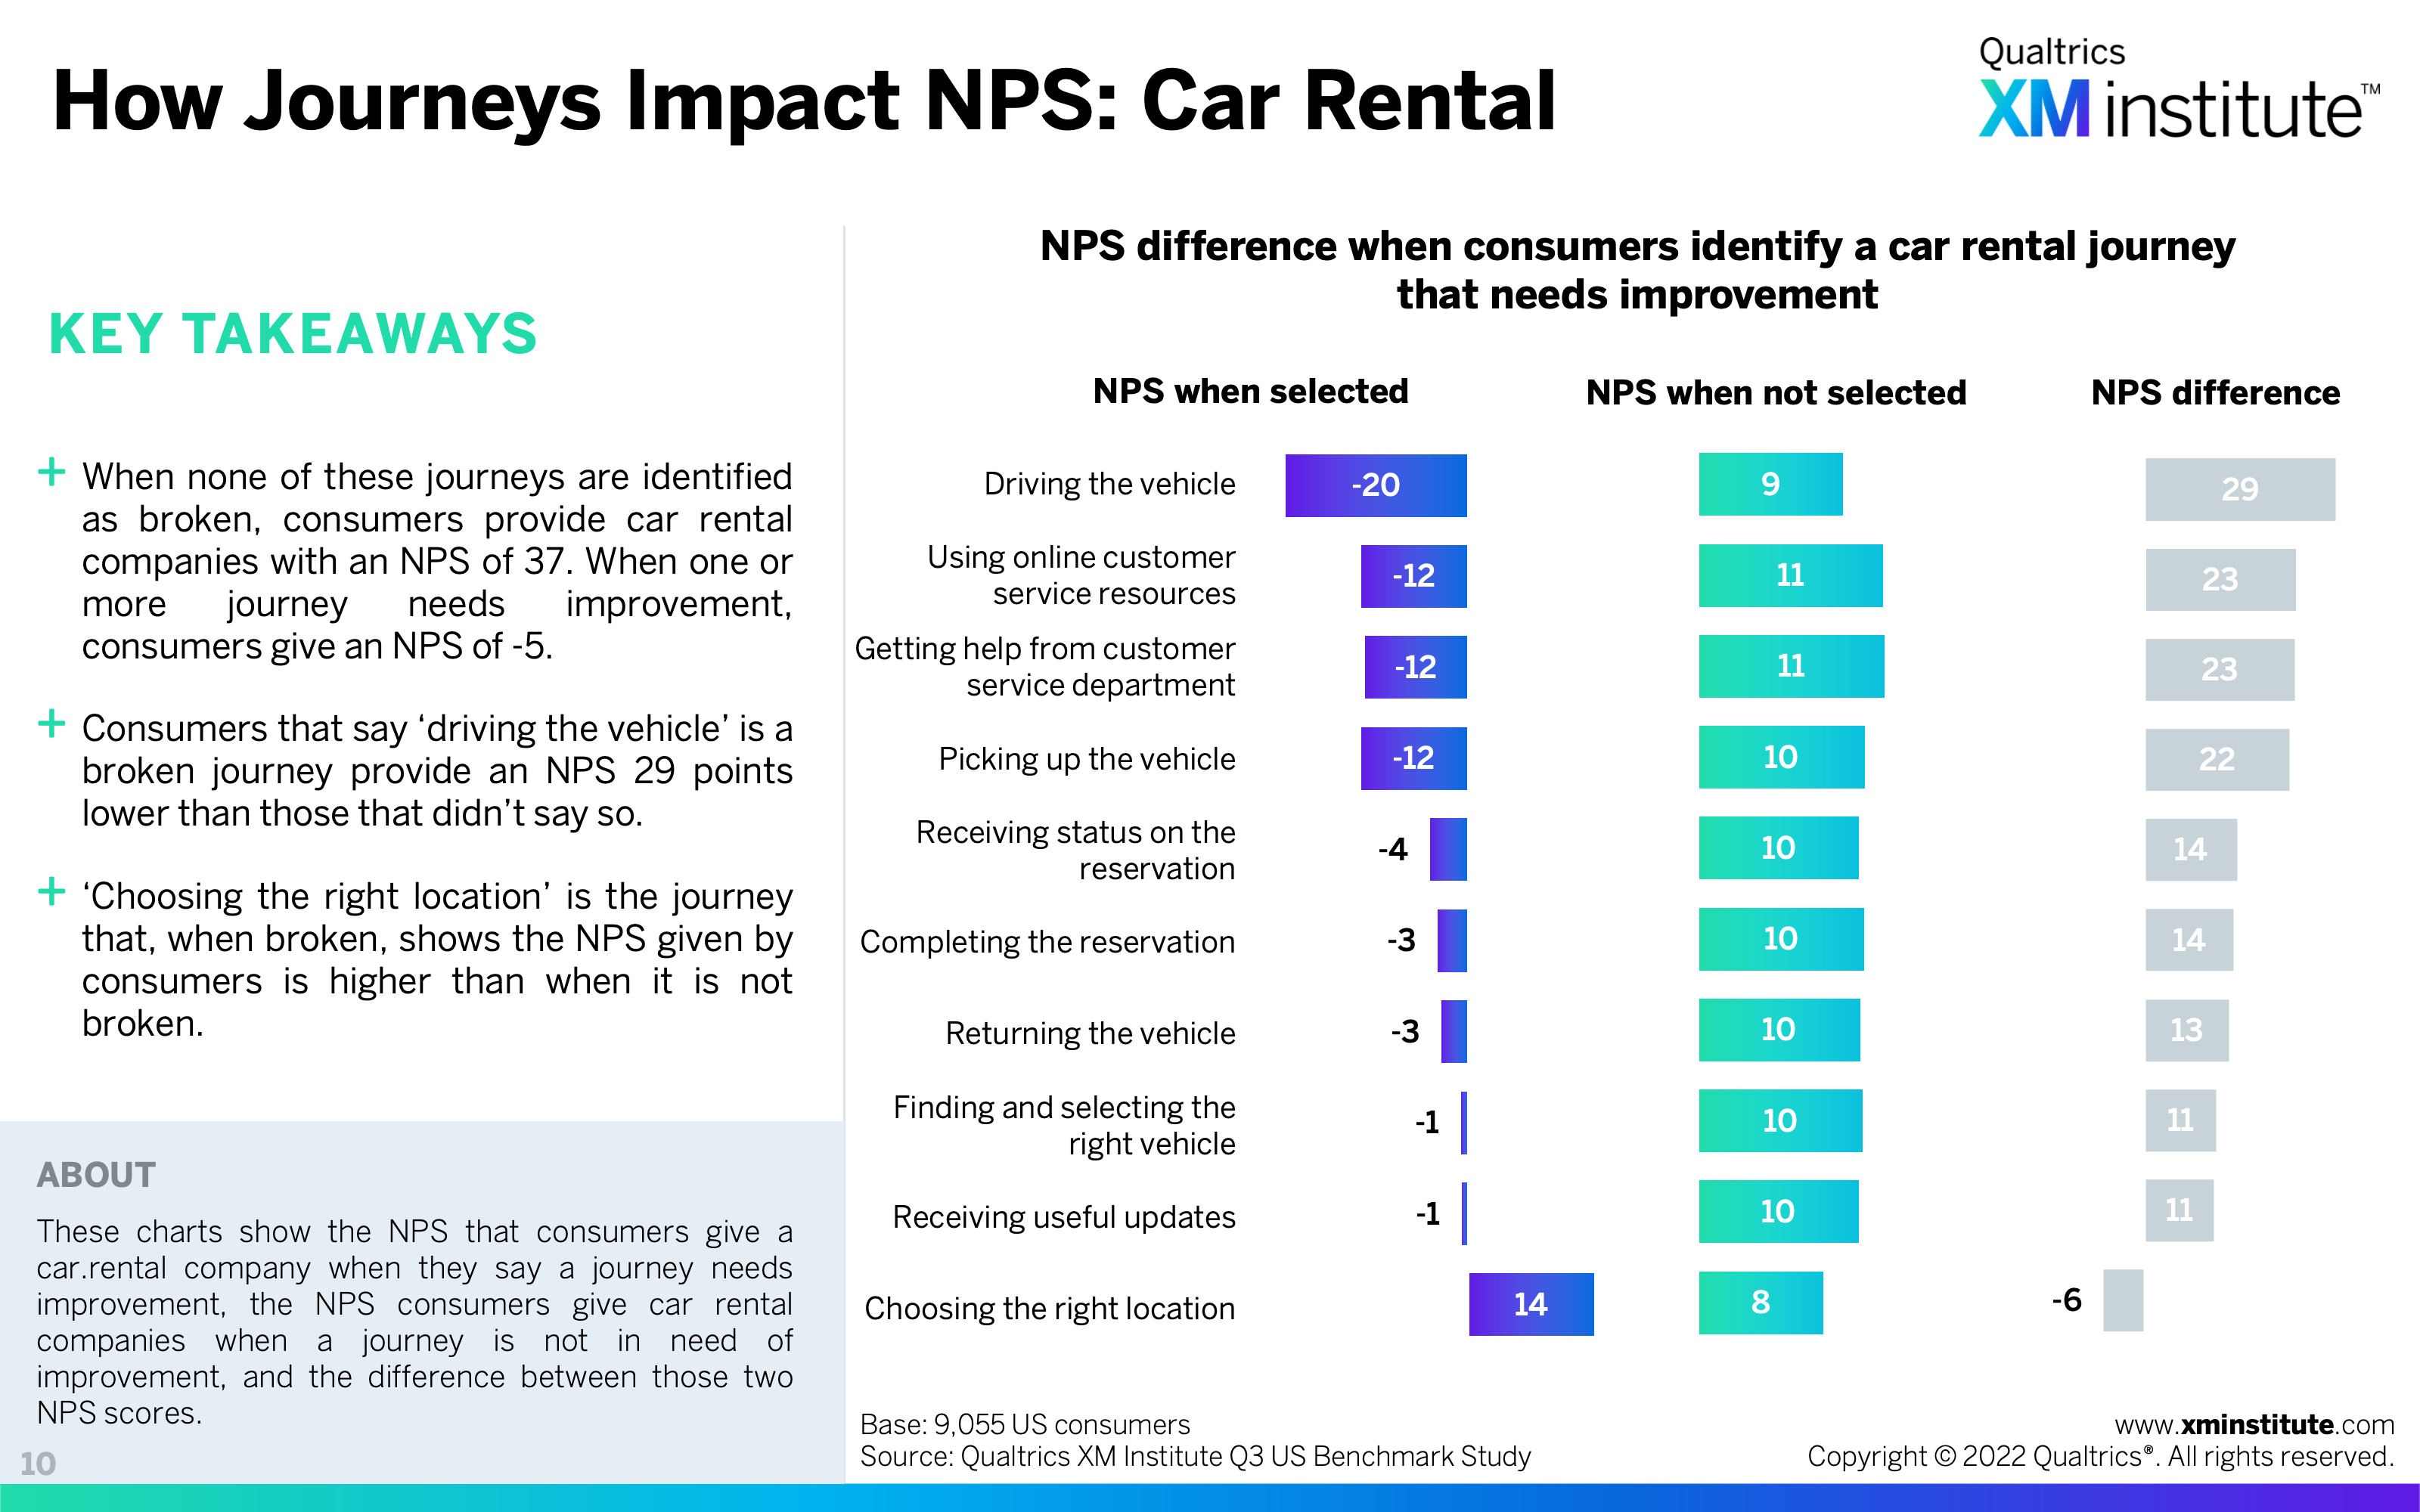
- How Journeys Impact NPS: Car Rental (see Figure 10)
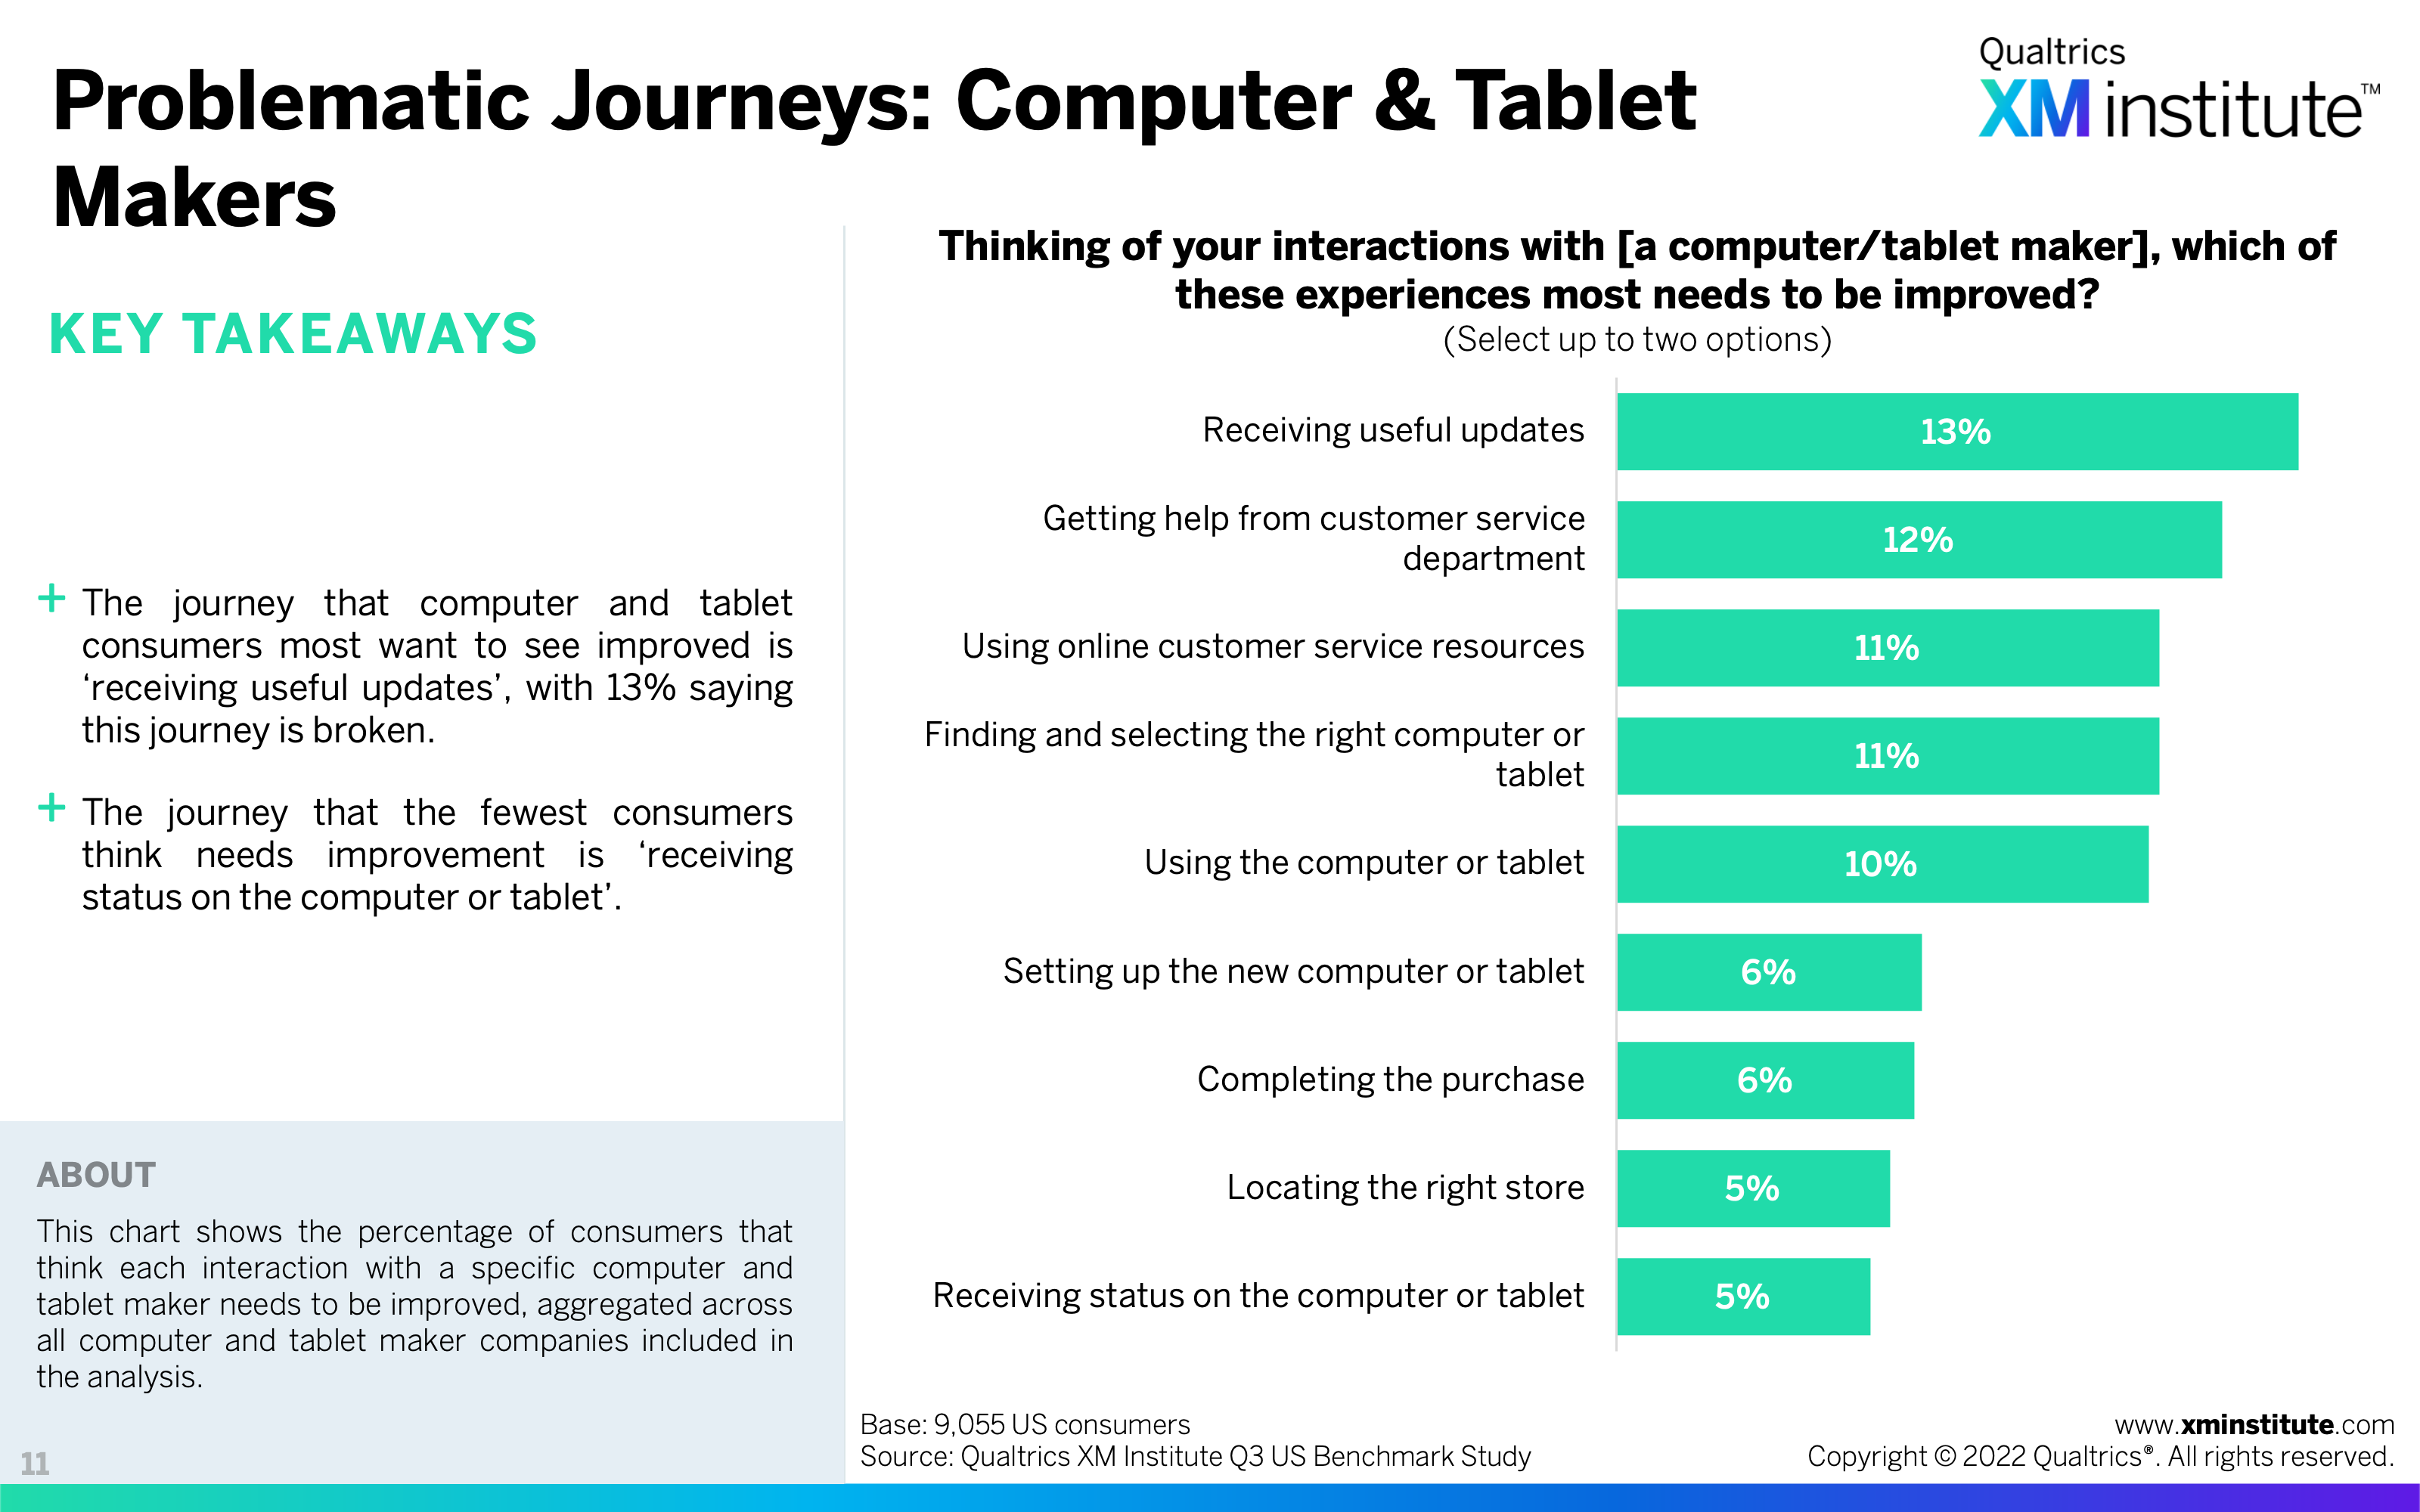
- Problematic Journeys: Computer & Tablet Makers (see Figure 11)
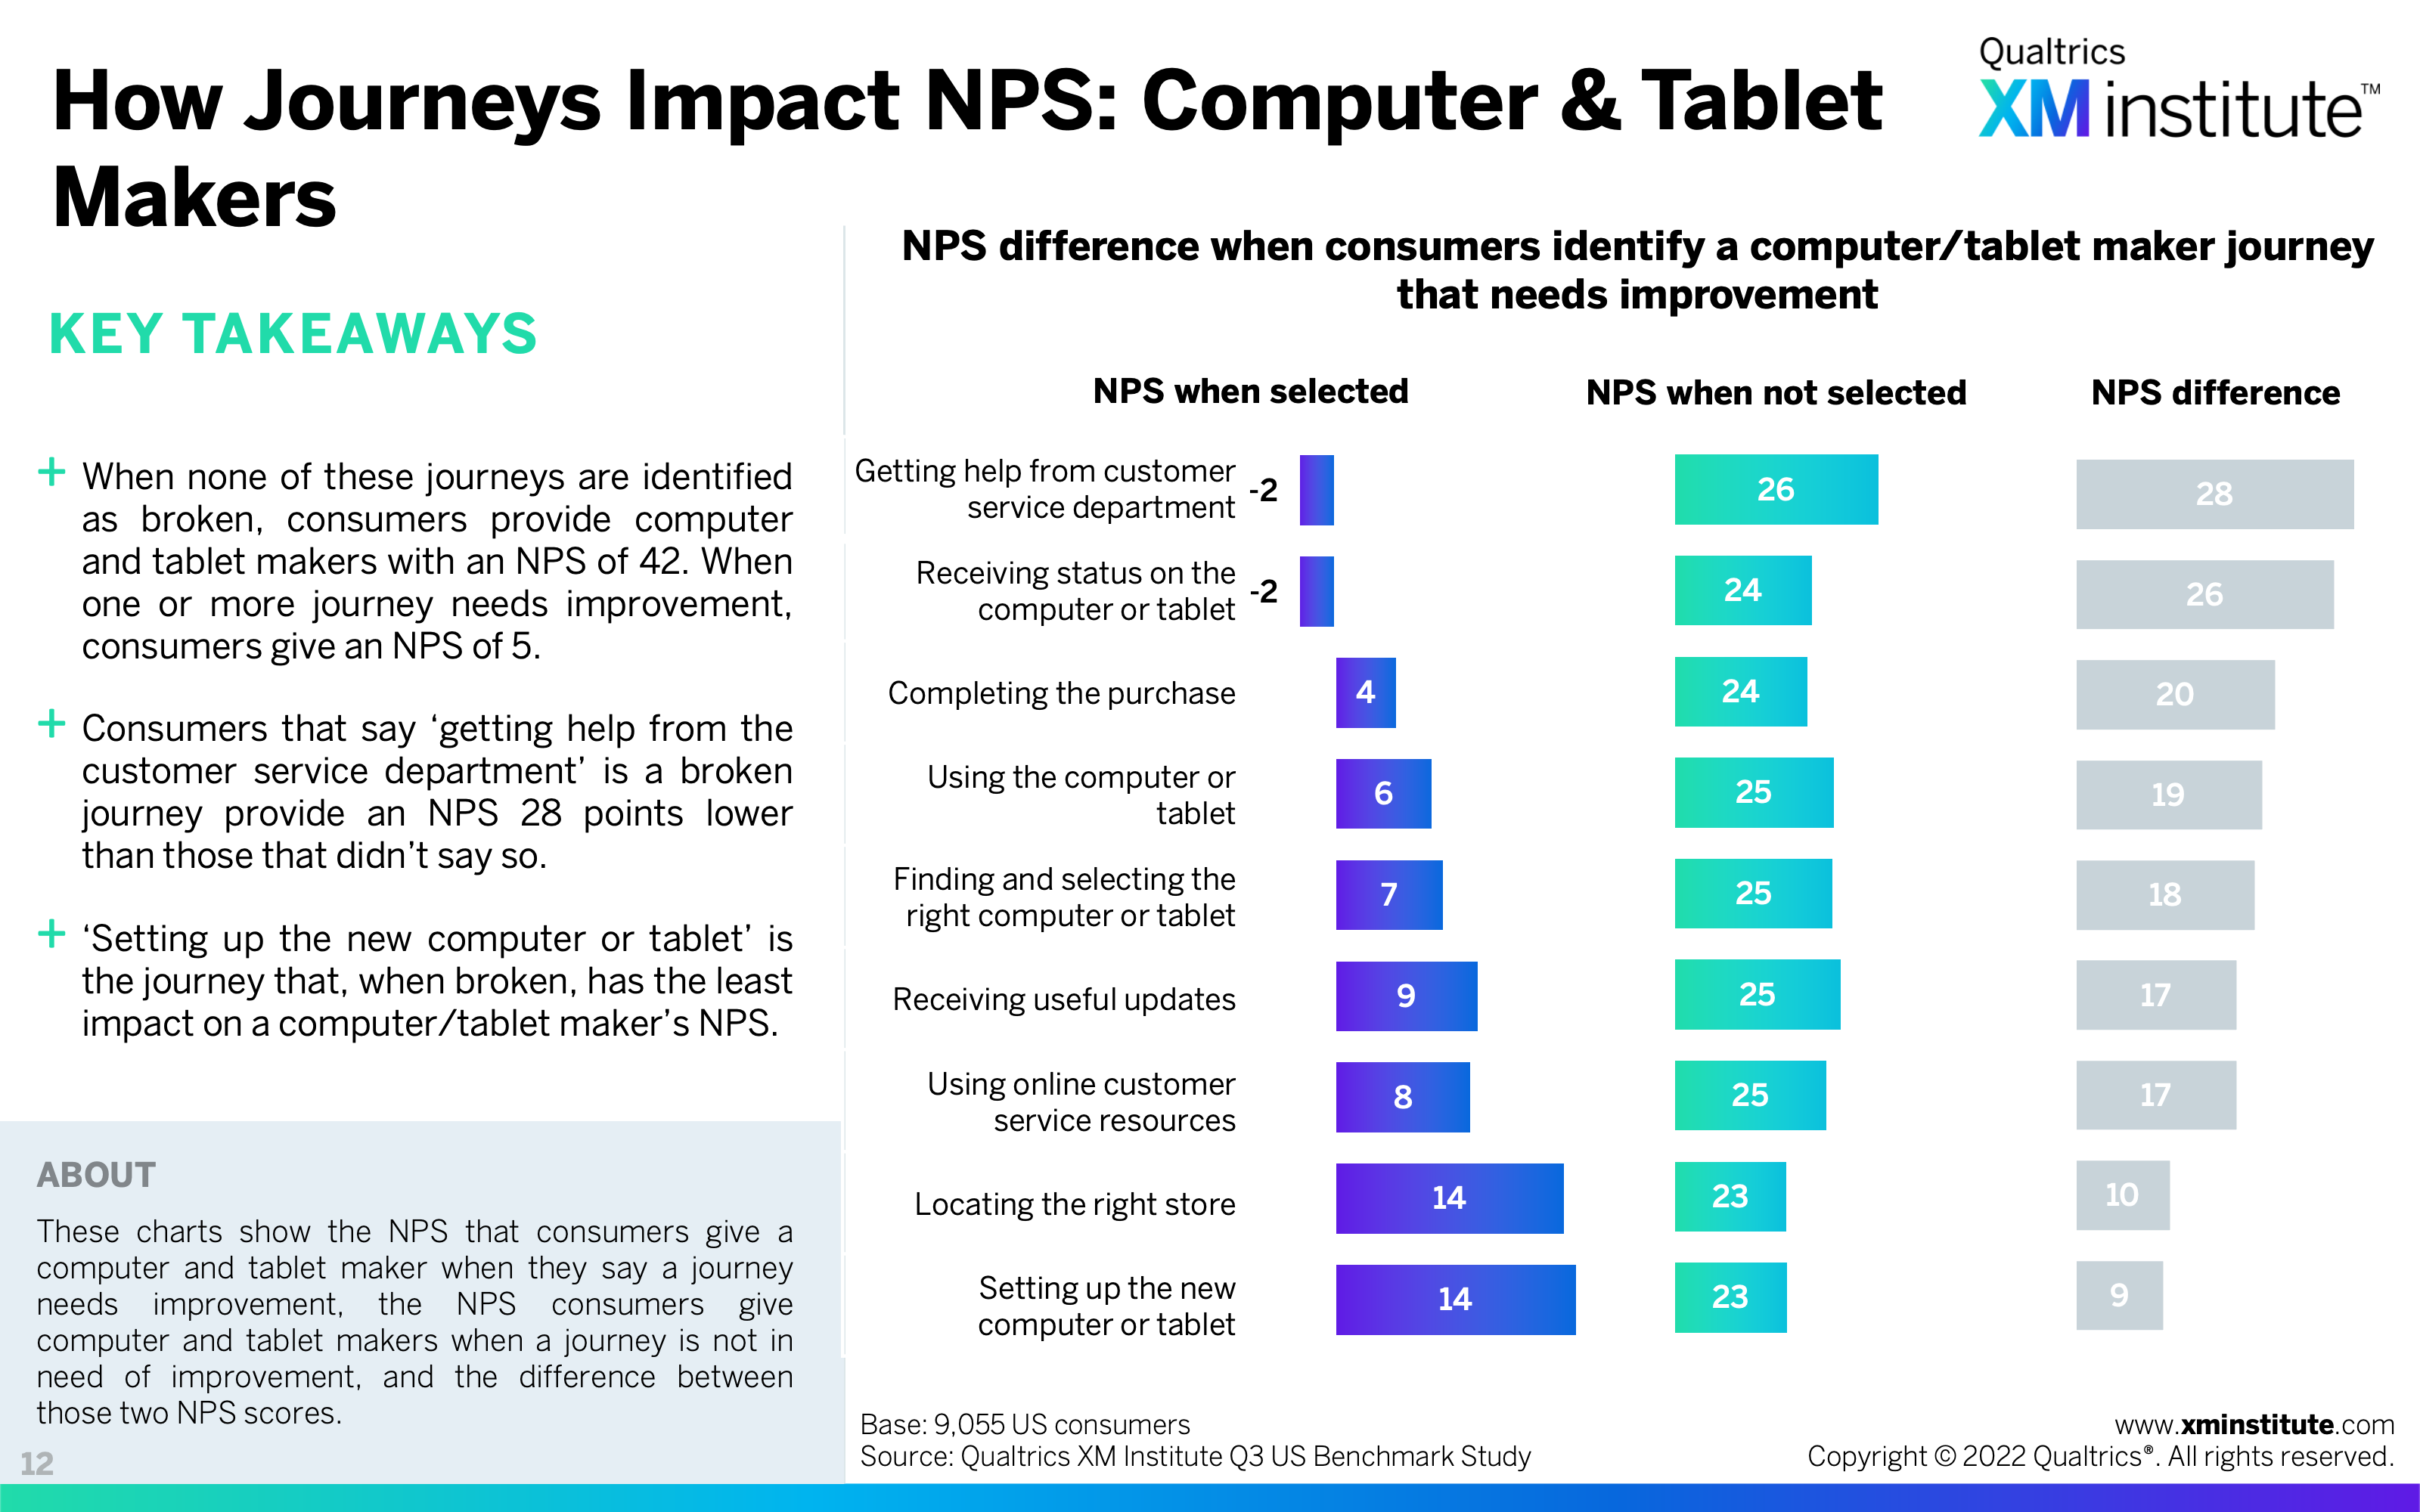
- How Journeys Impact NPS: Computer & Tablet Makers (see Figure 12)
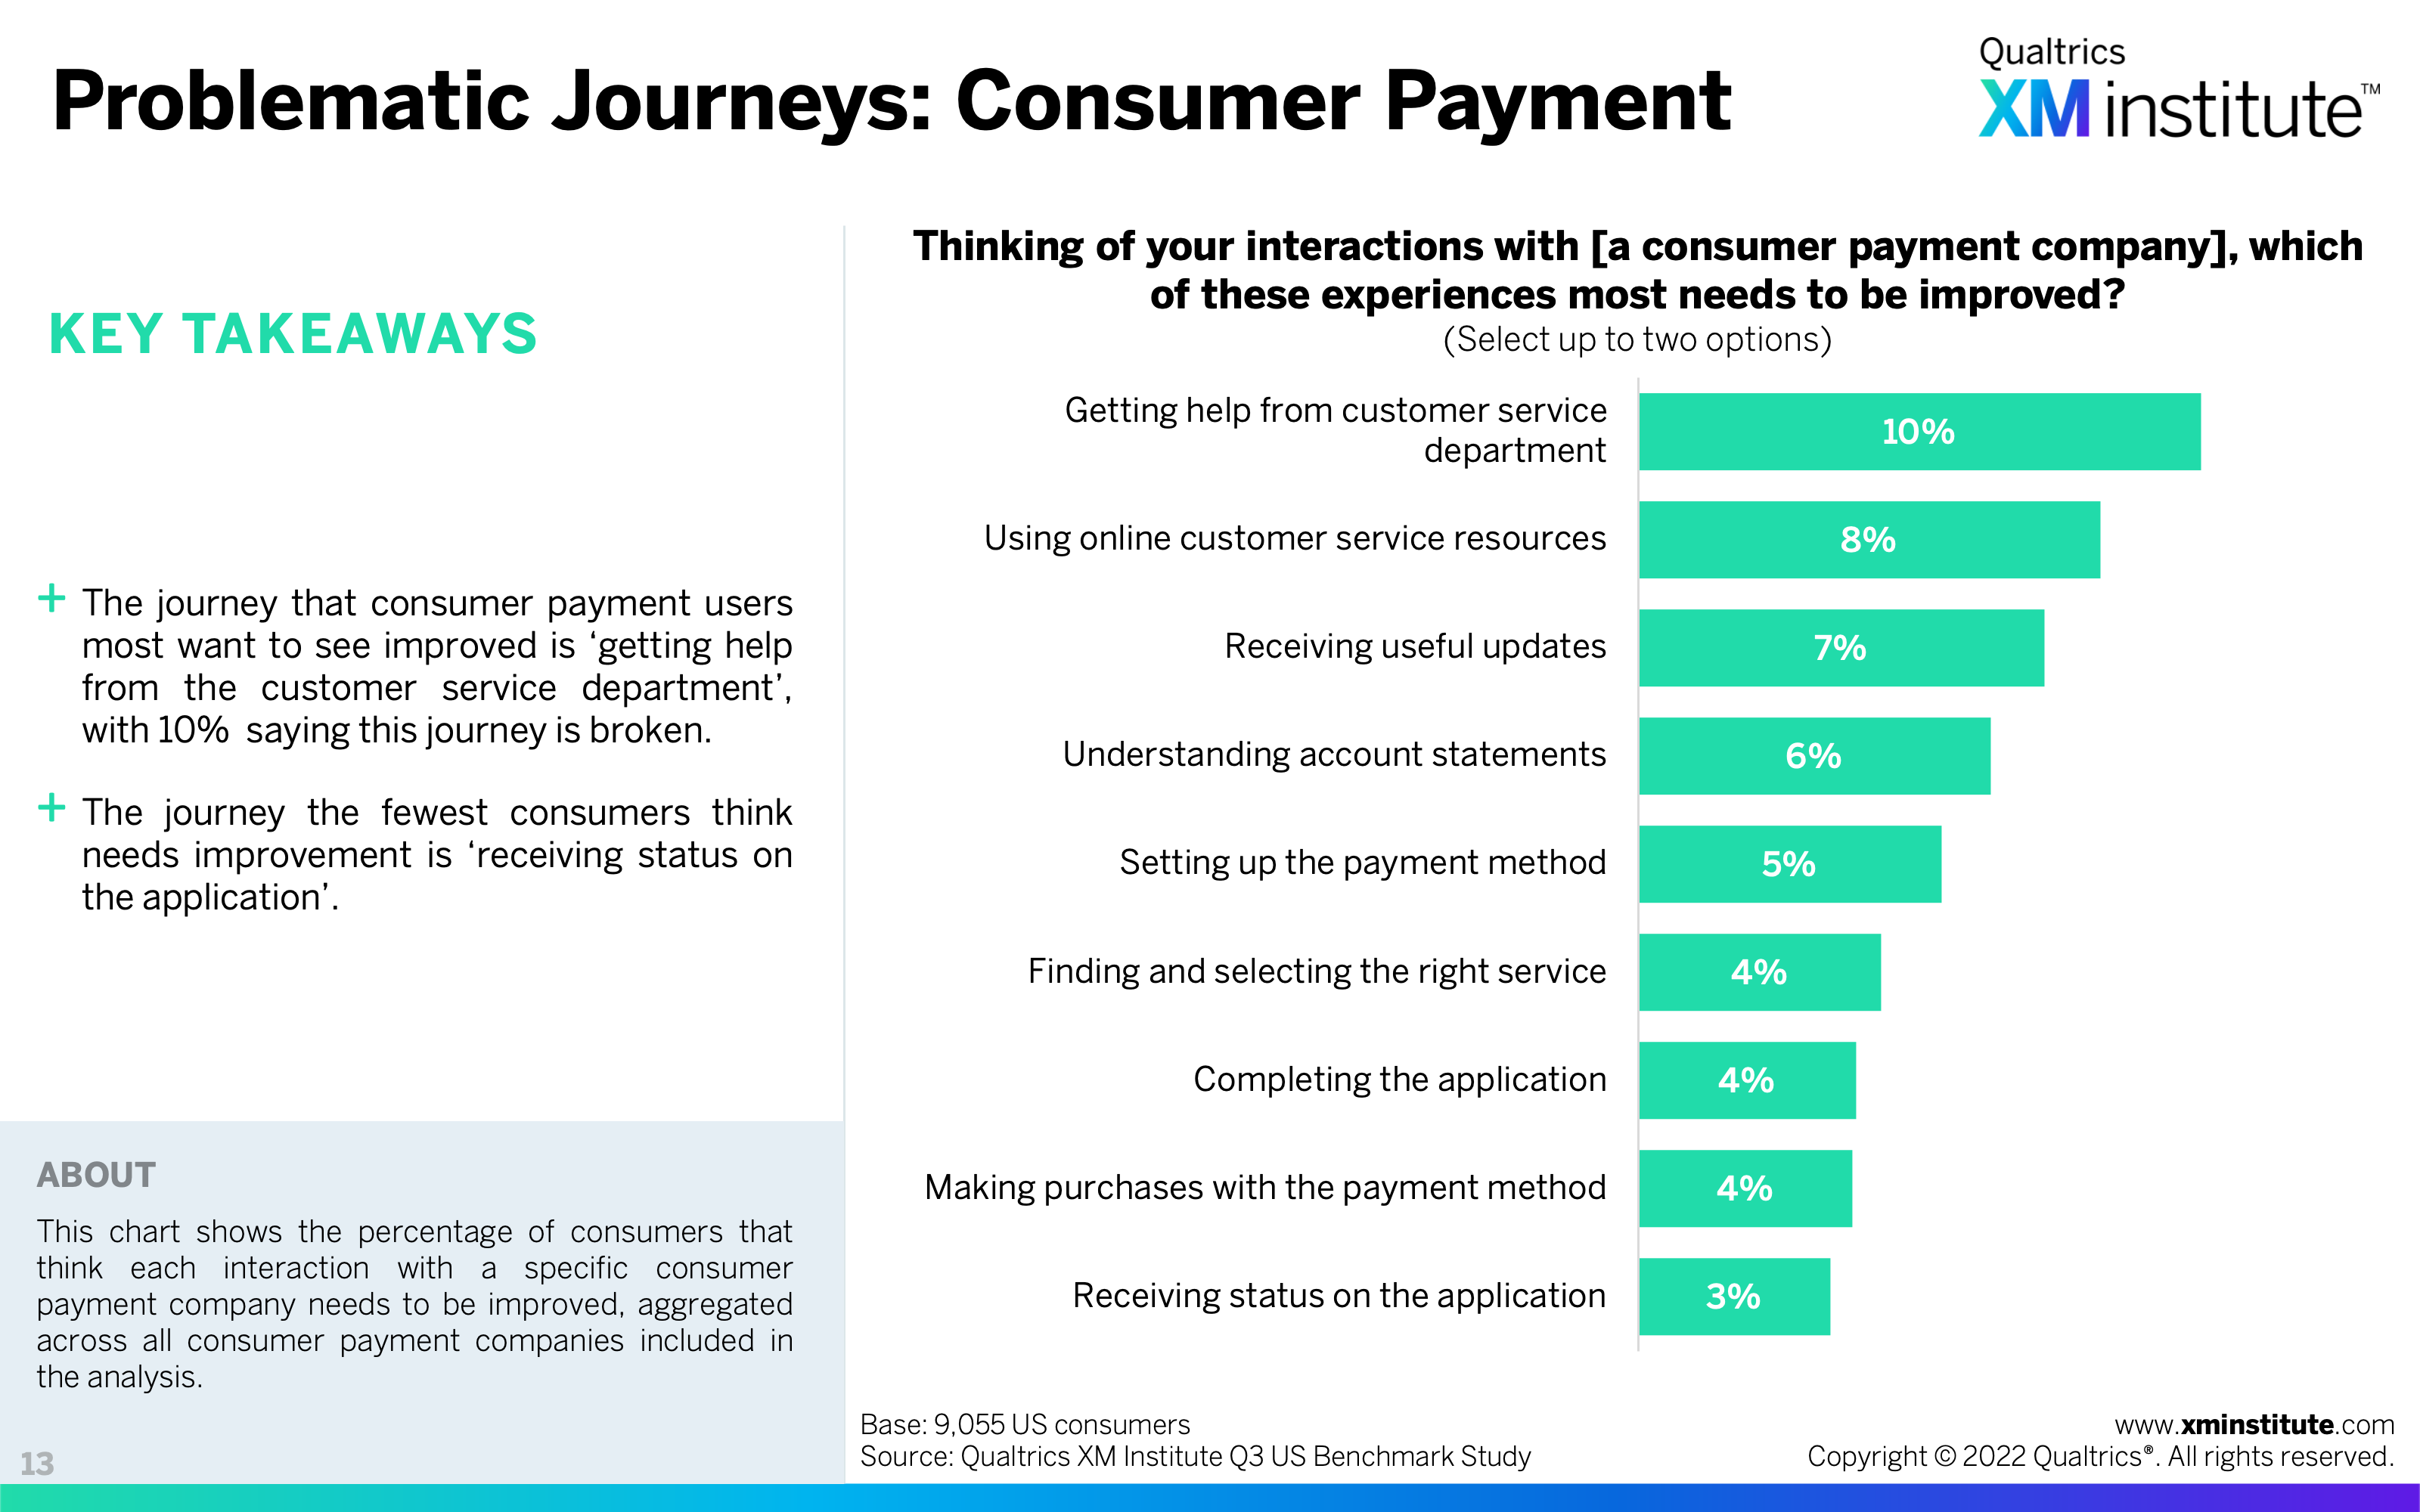
- Problematic Journeys: Consumer Payment (see Figure 13)
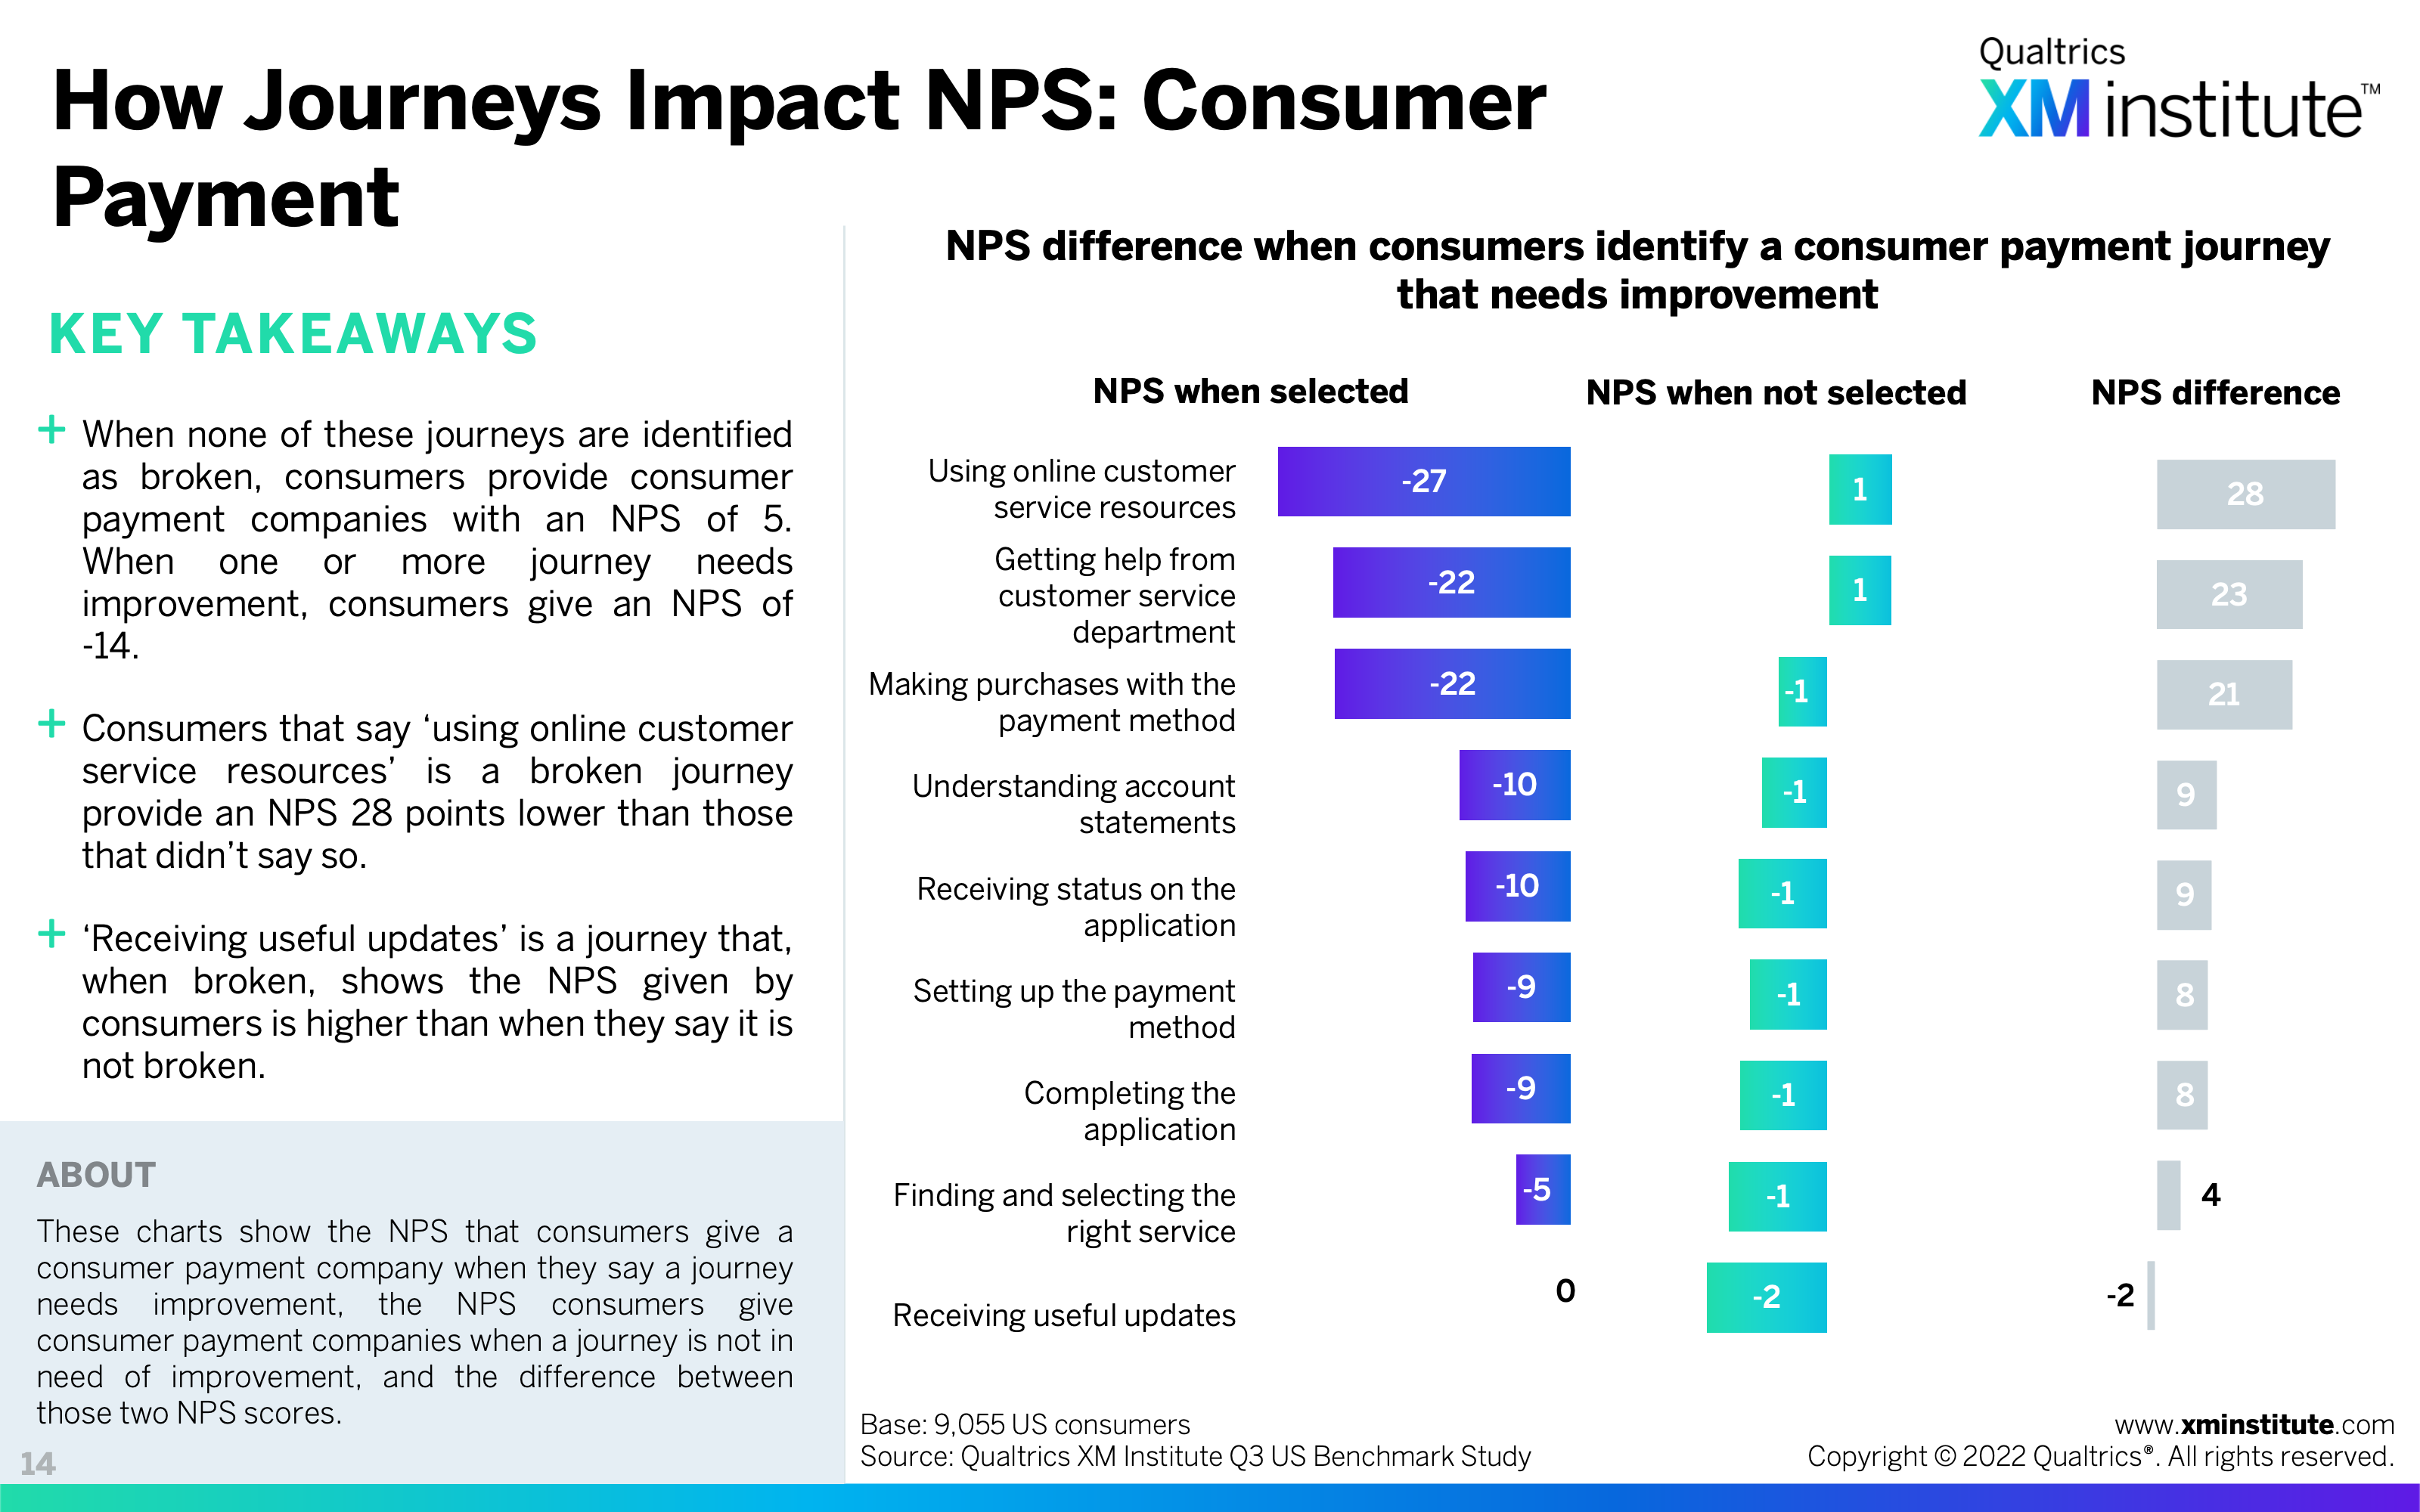
- How Journeys Impact NPS: Consumer Payment (see Figure 14)
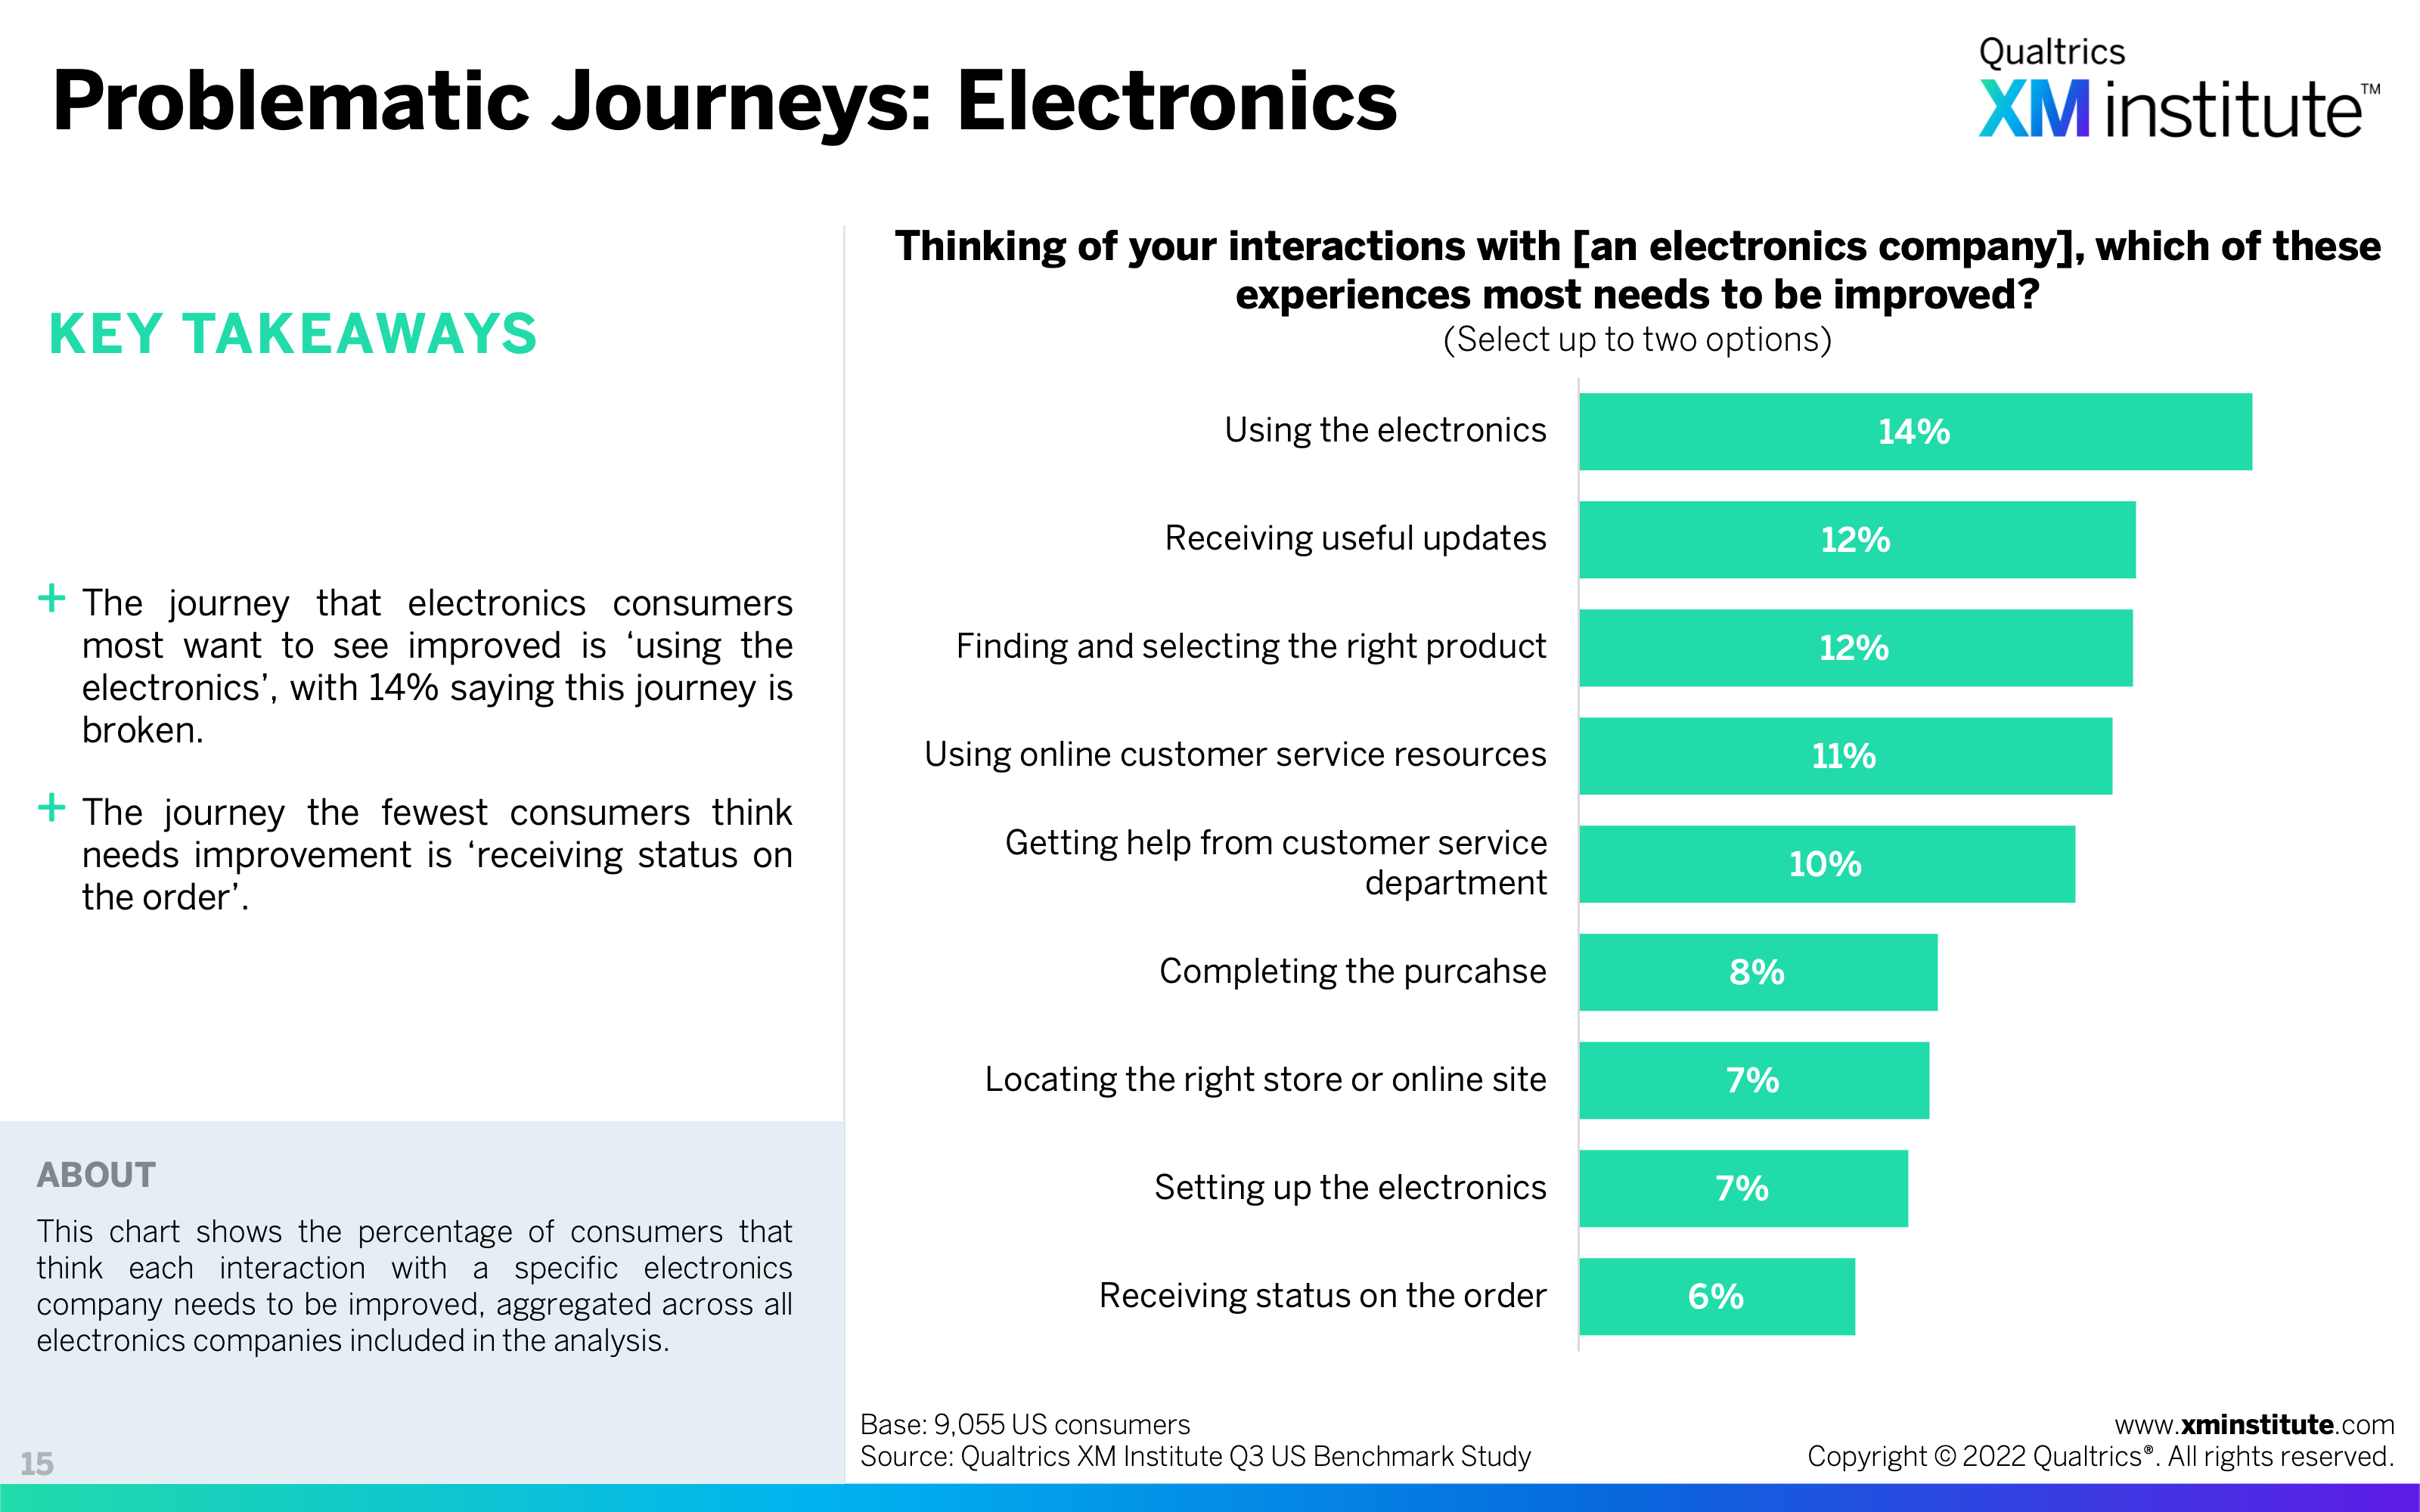
- Problematic Journeys: Electronics (see Figure 15)
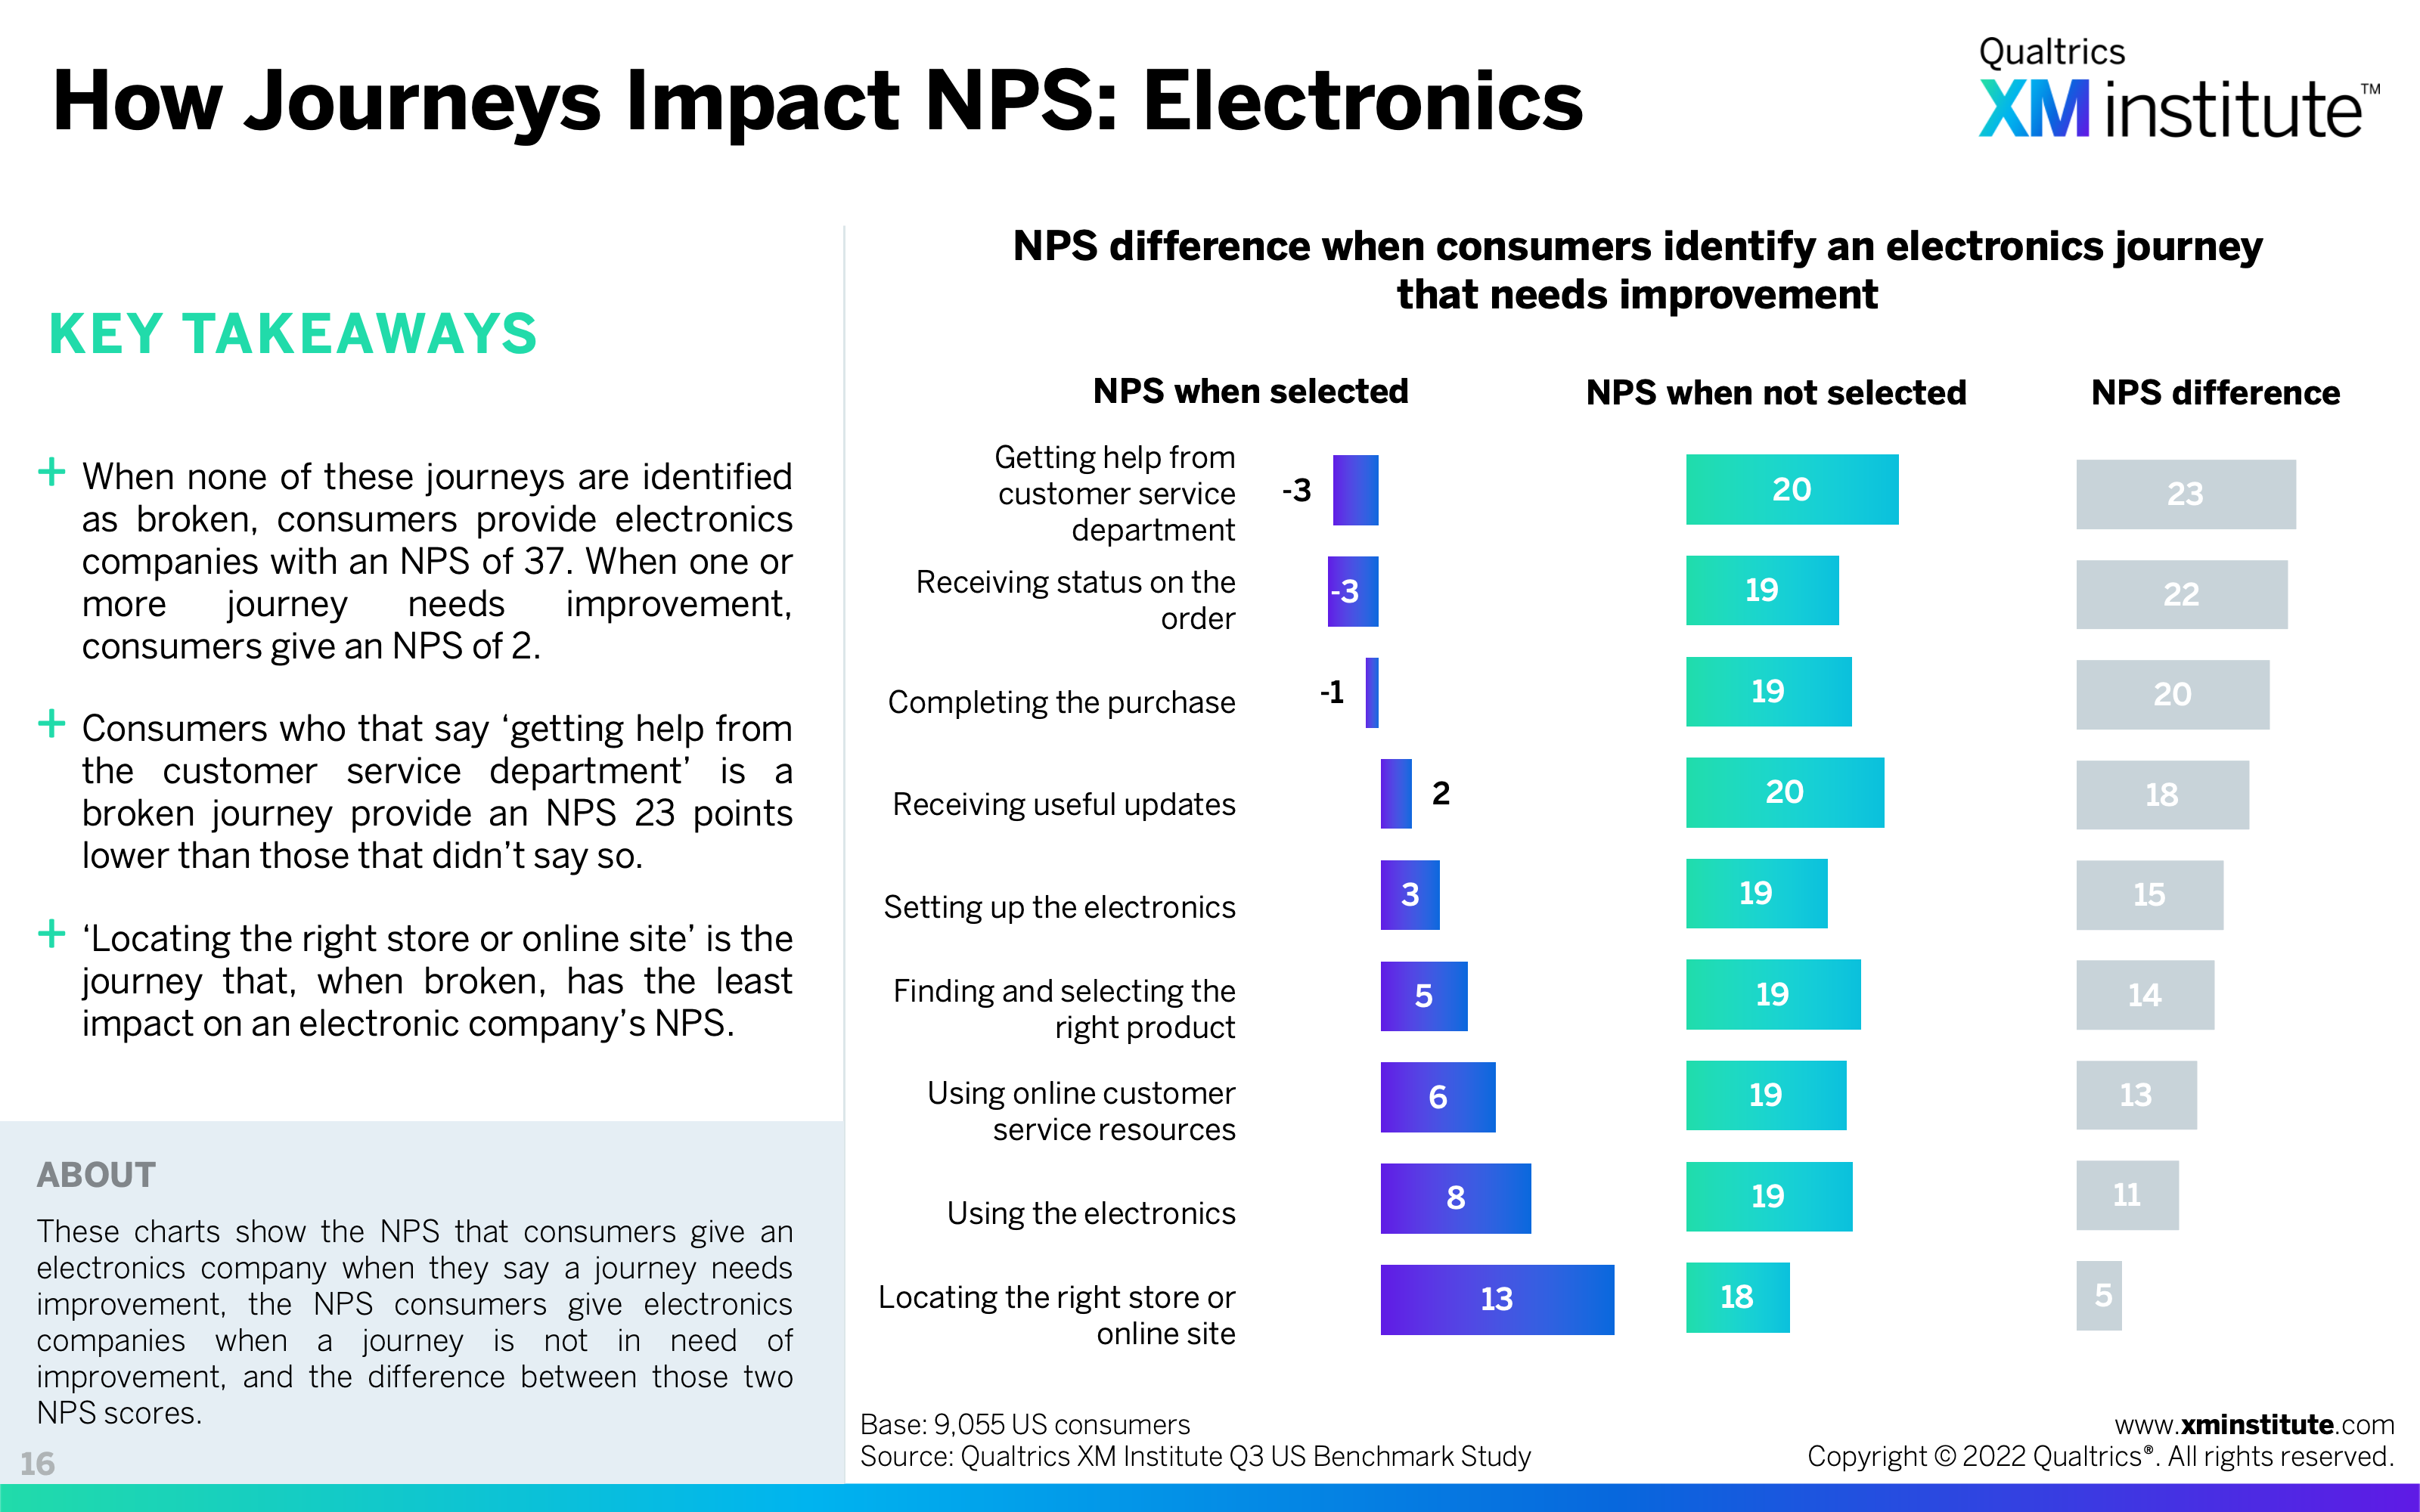
- How Journeys Impact NPS: Electronics (see Figure 16)
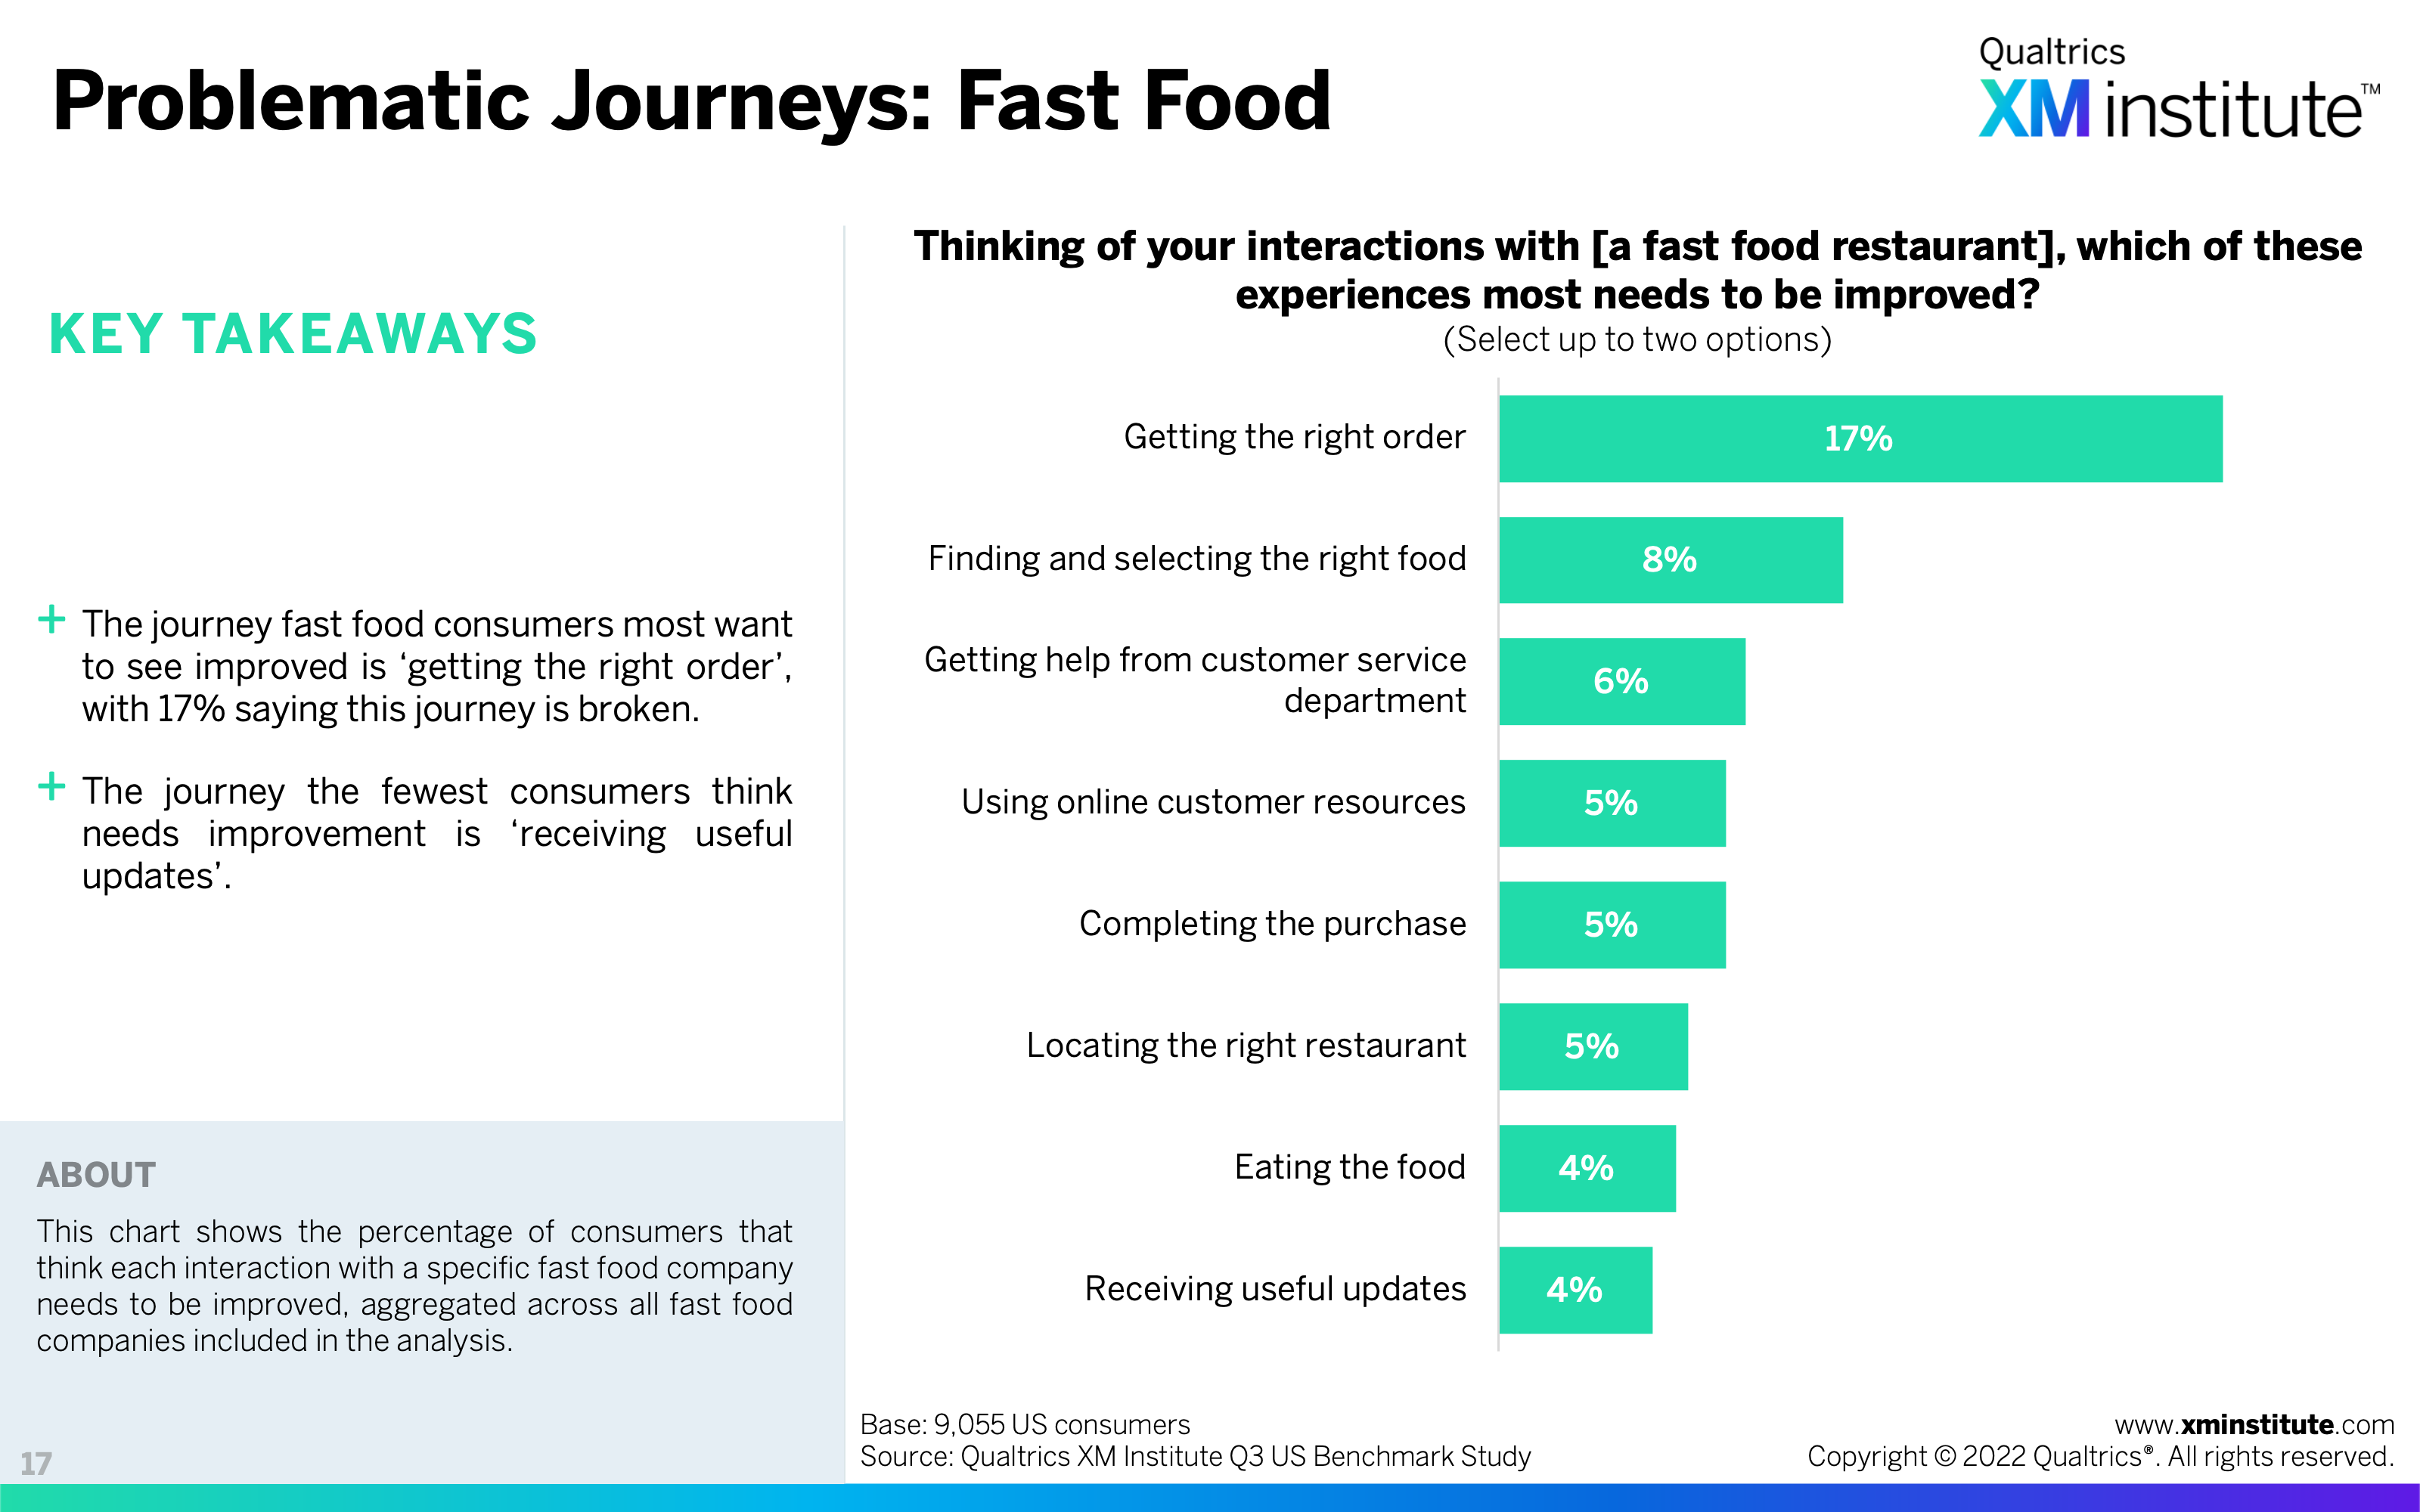
- Problematic Journeys: Fast Food (see Figure 17)
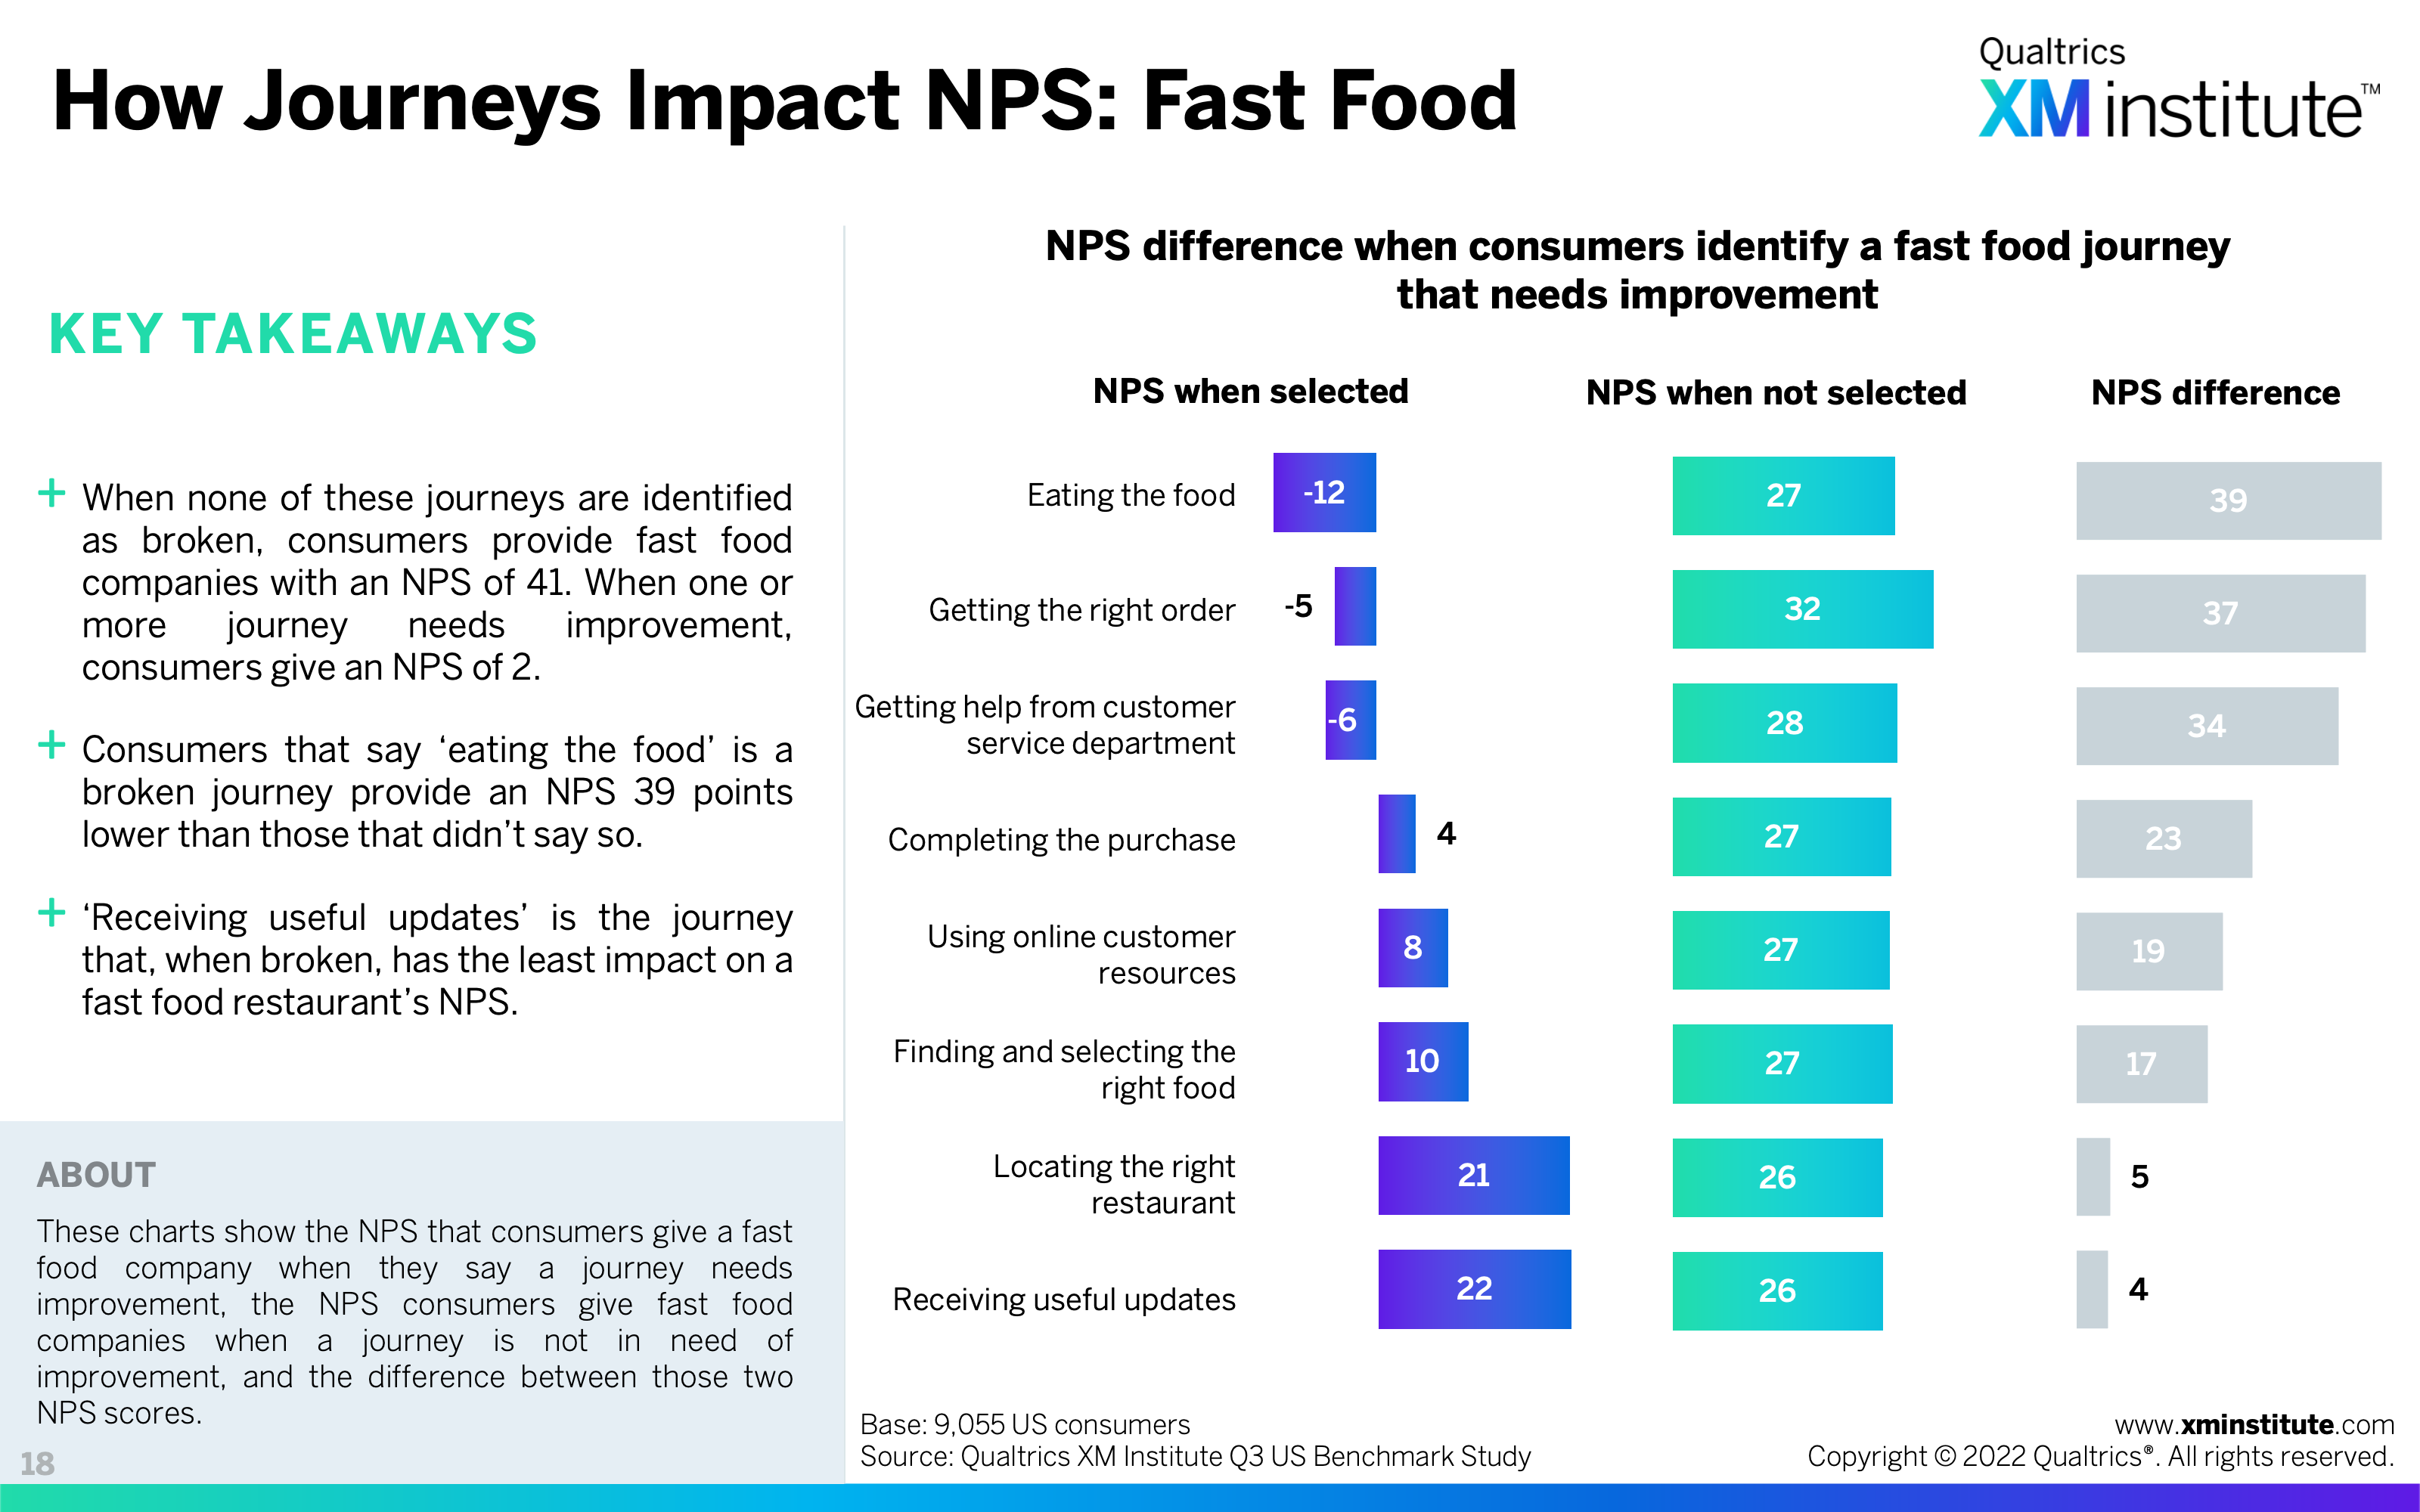
- How Journeys Impact NPS: Fast Food (see Figure 18)
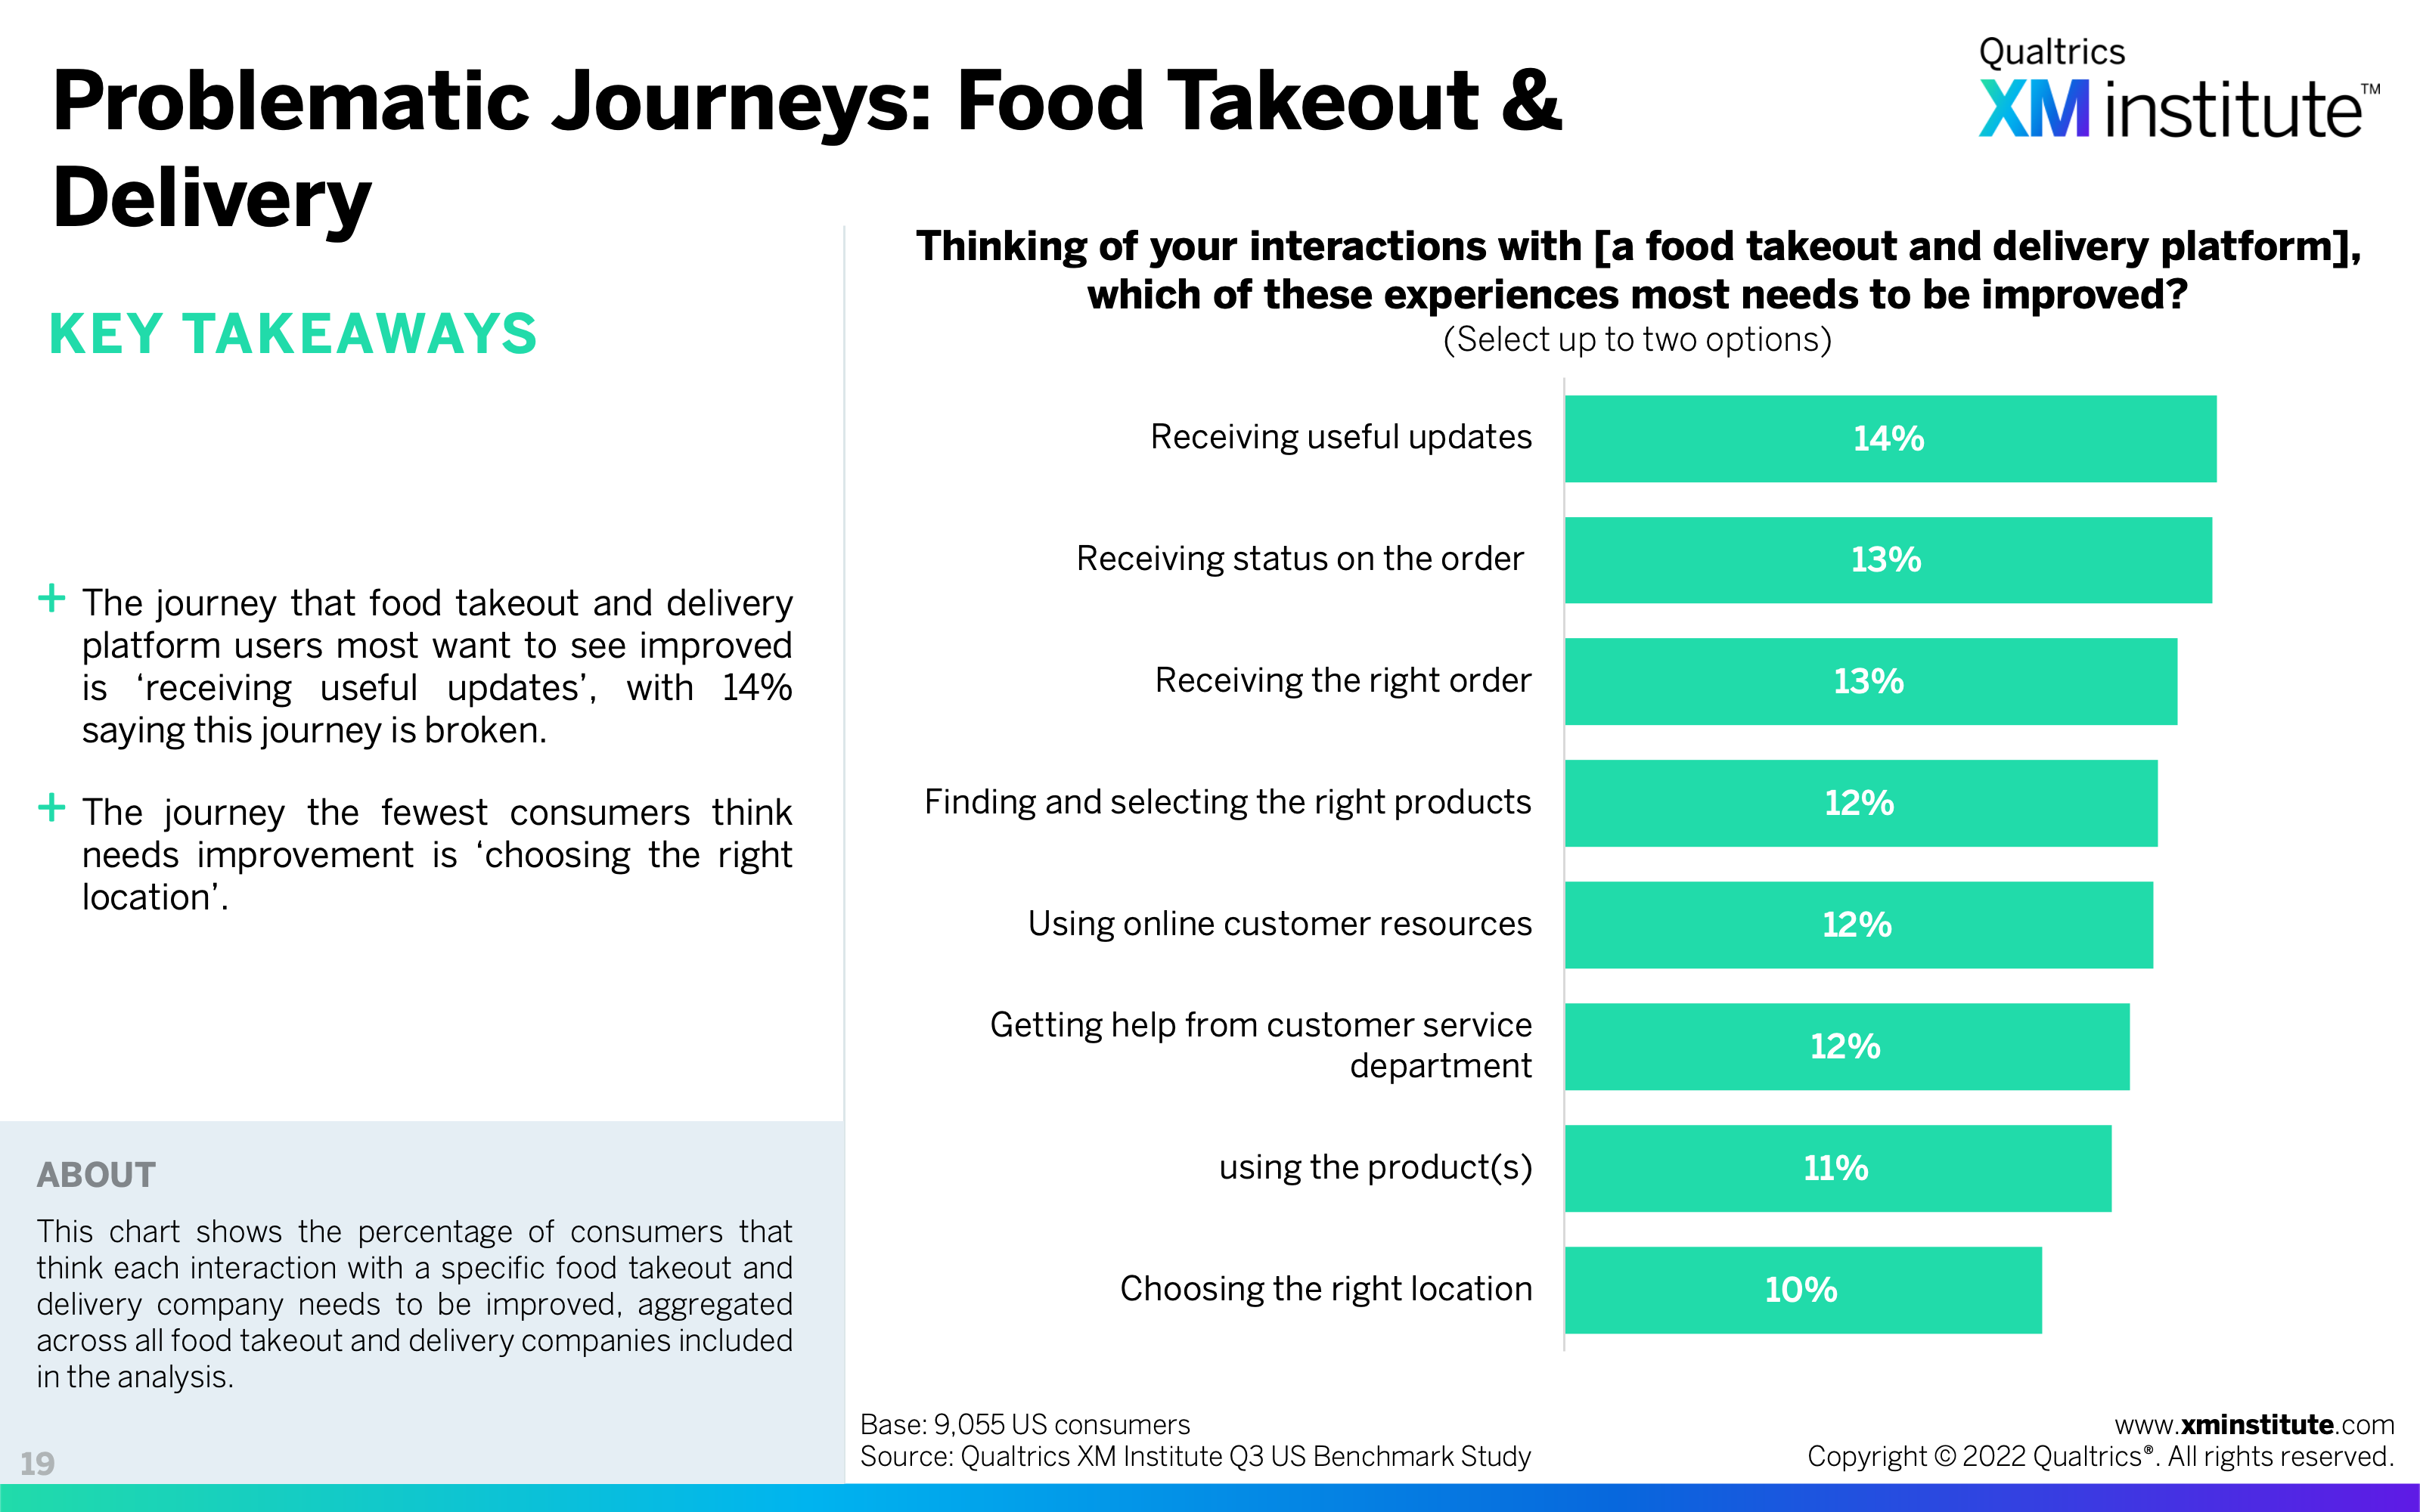
- Problematic Journeys: Food Takeout & Delivery (see Figure 19)
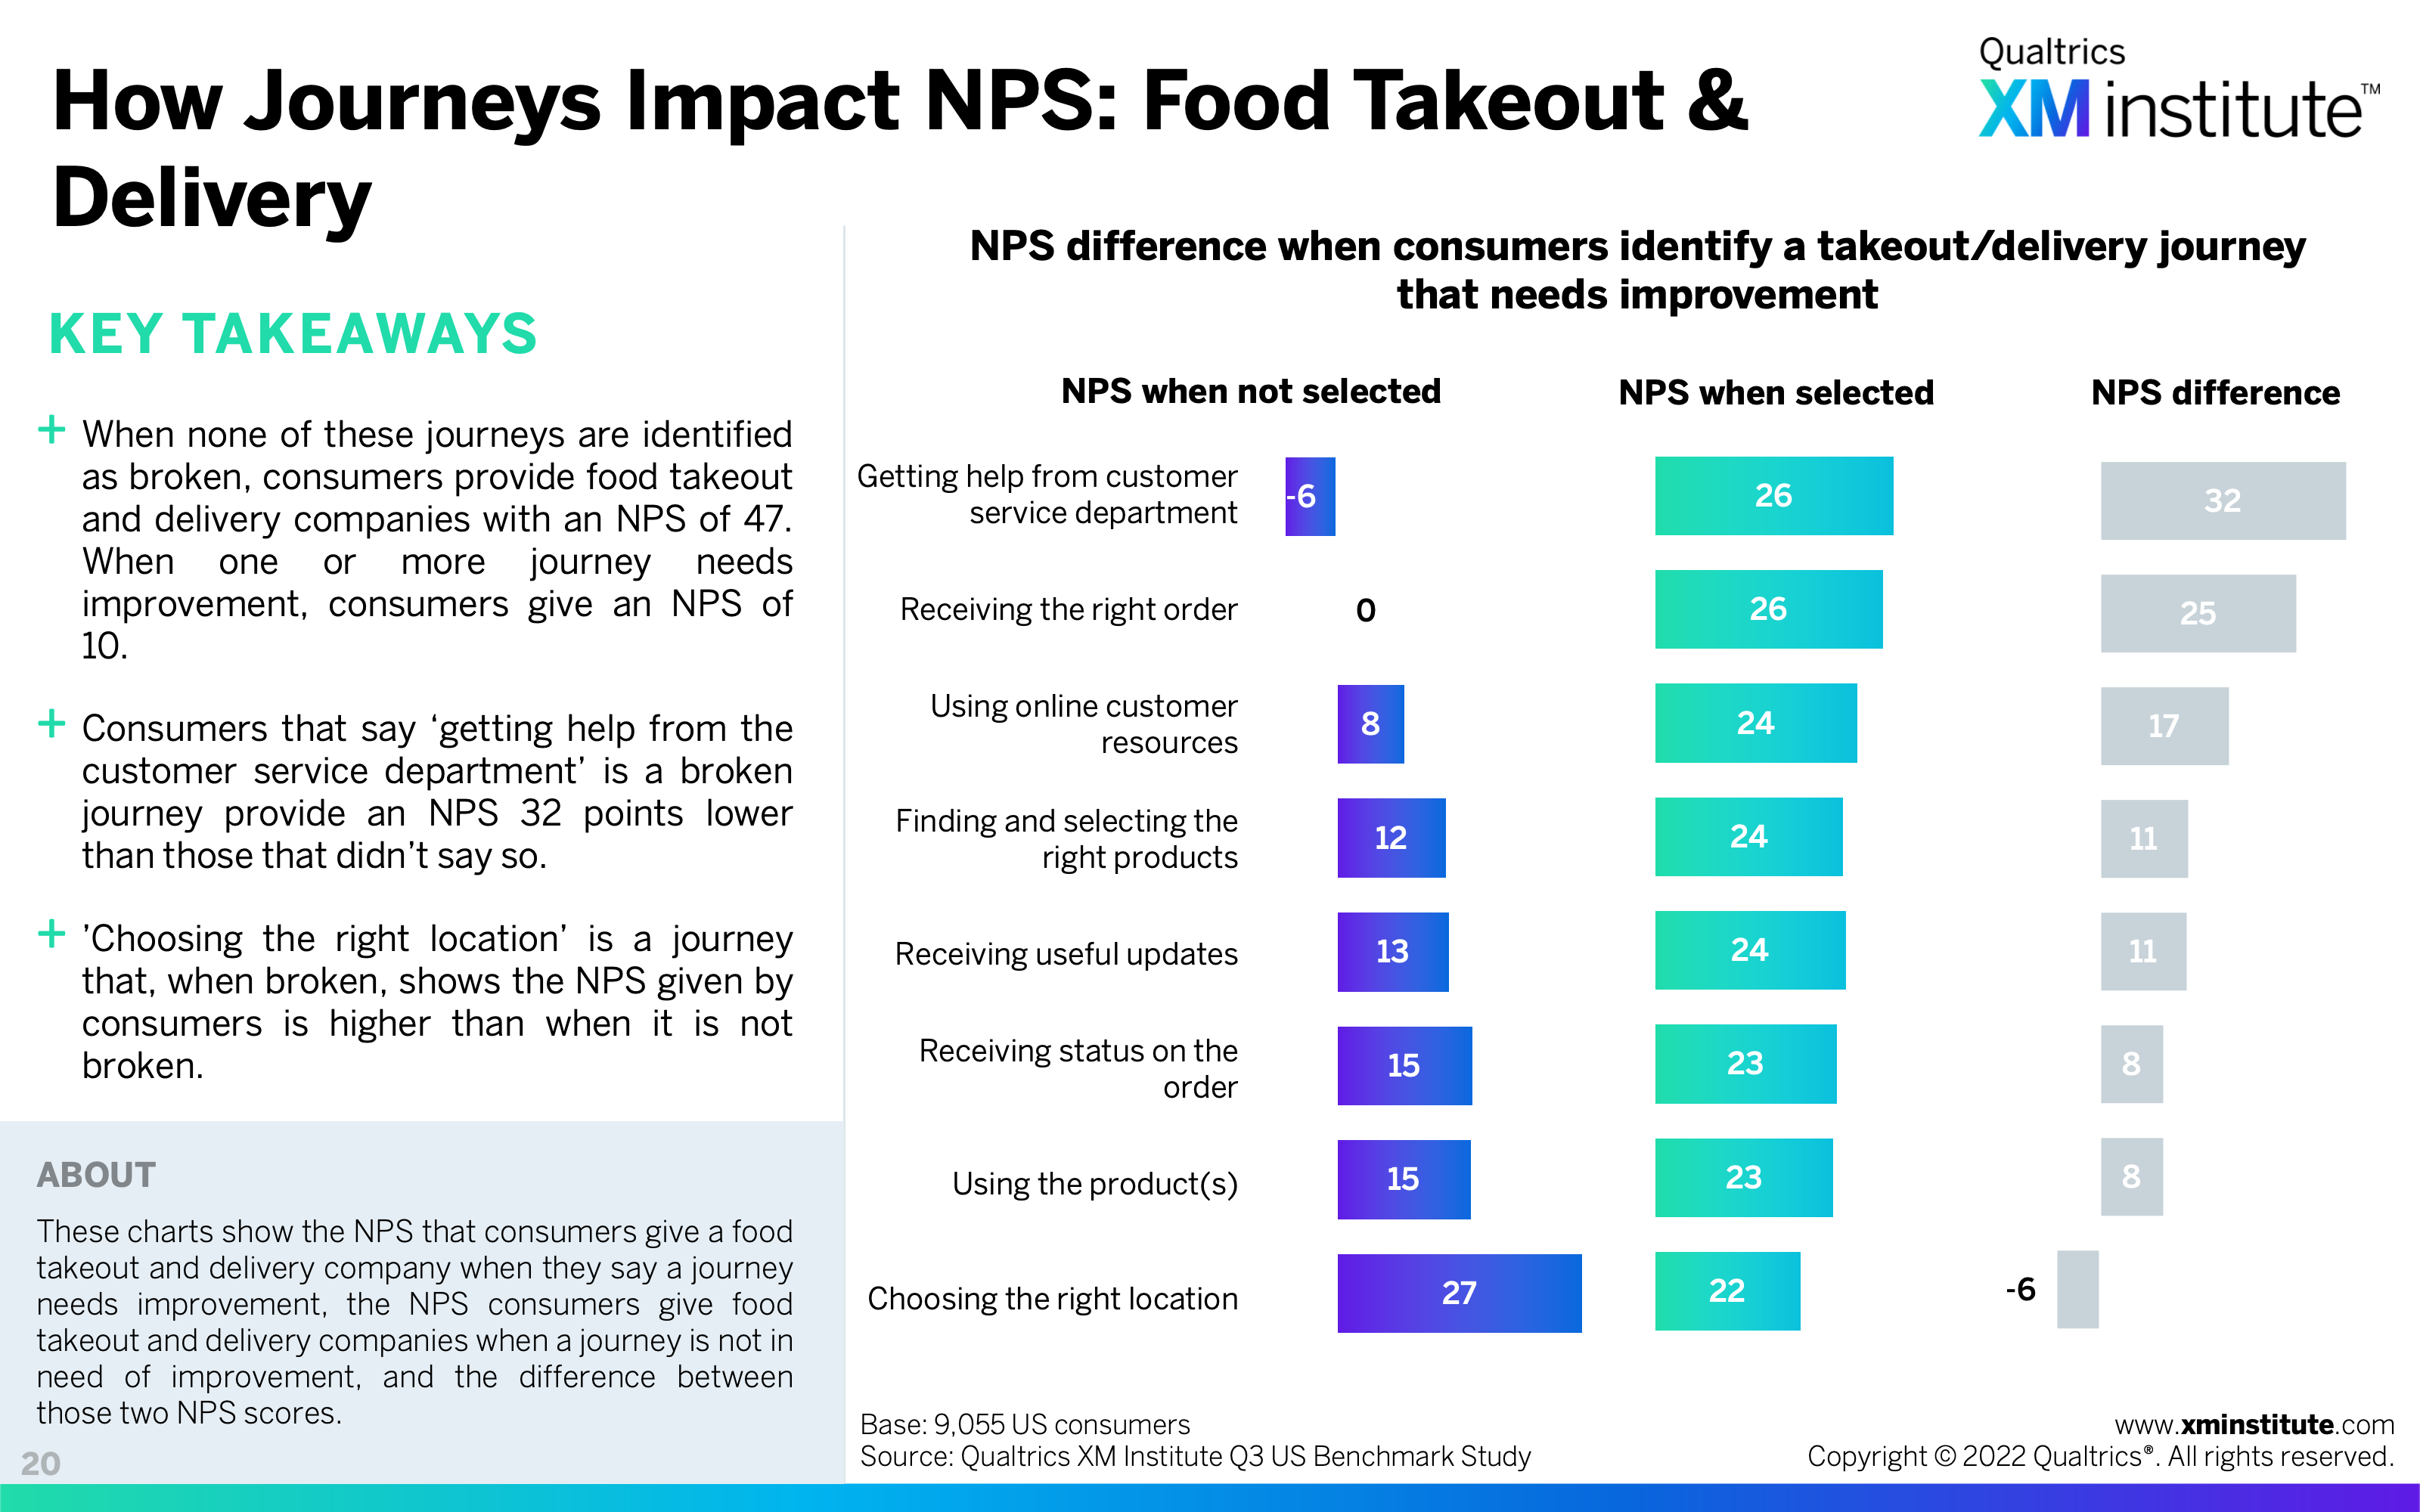
- How Journeys Impact NPS: Food Takeout & Delivery (see Figure 20)
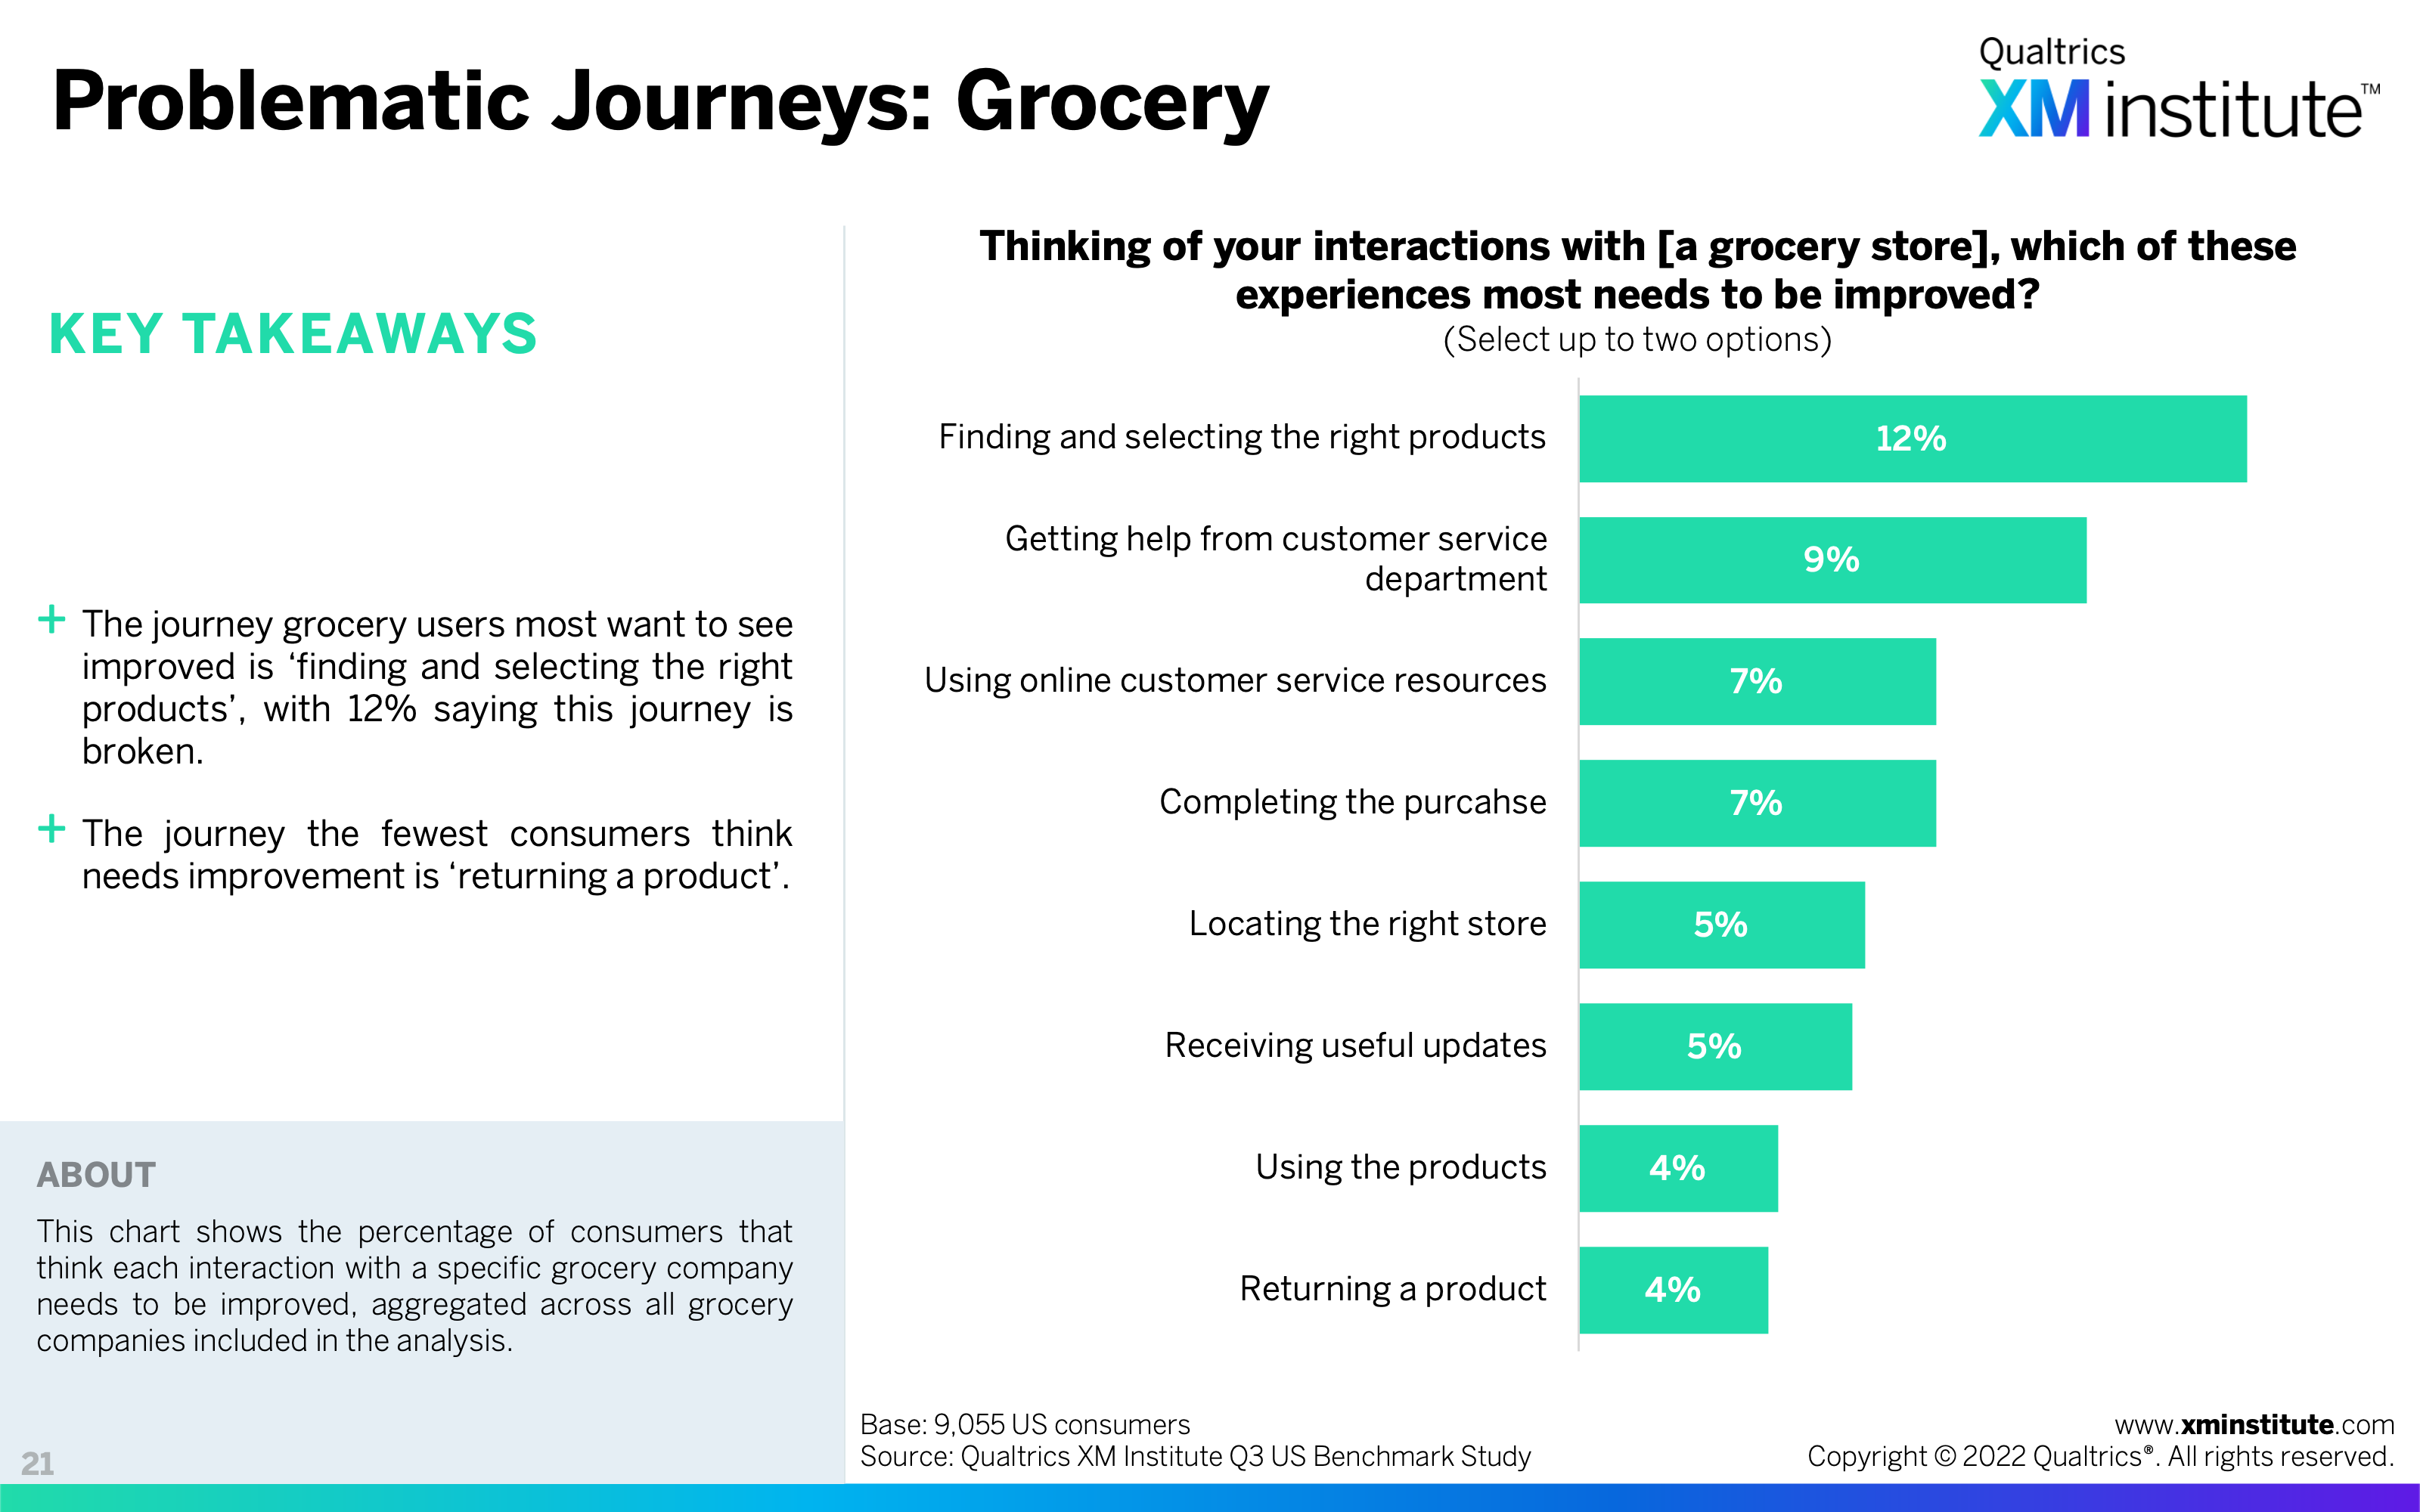
- Problematic Journeys: Grocery (see Figure 21)
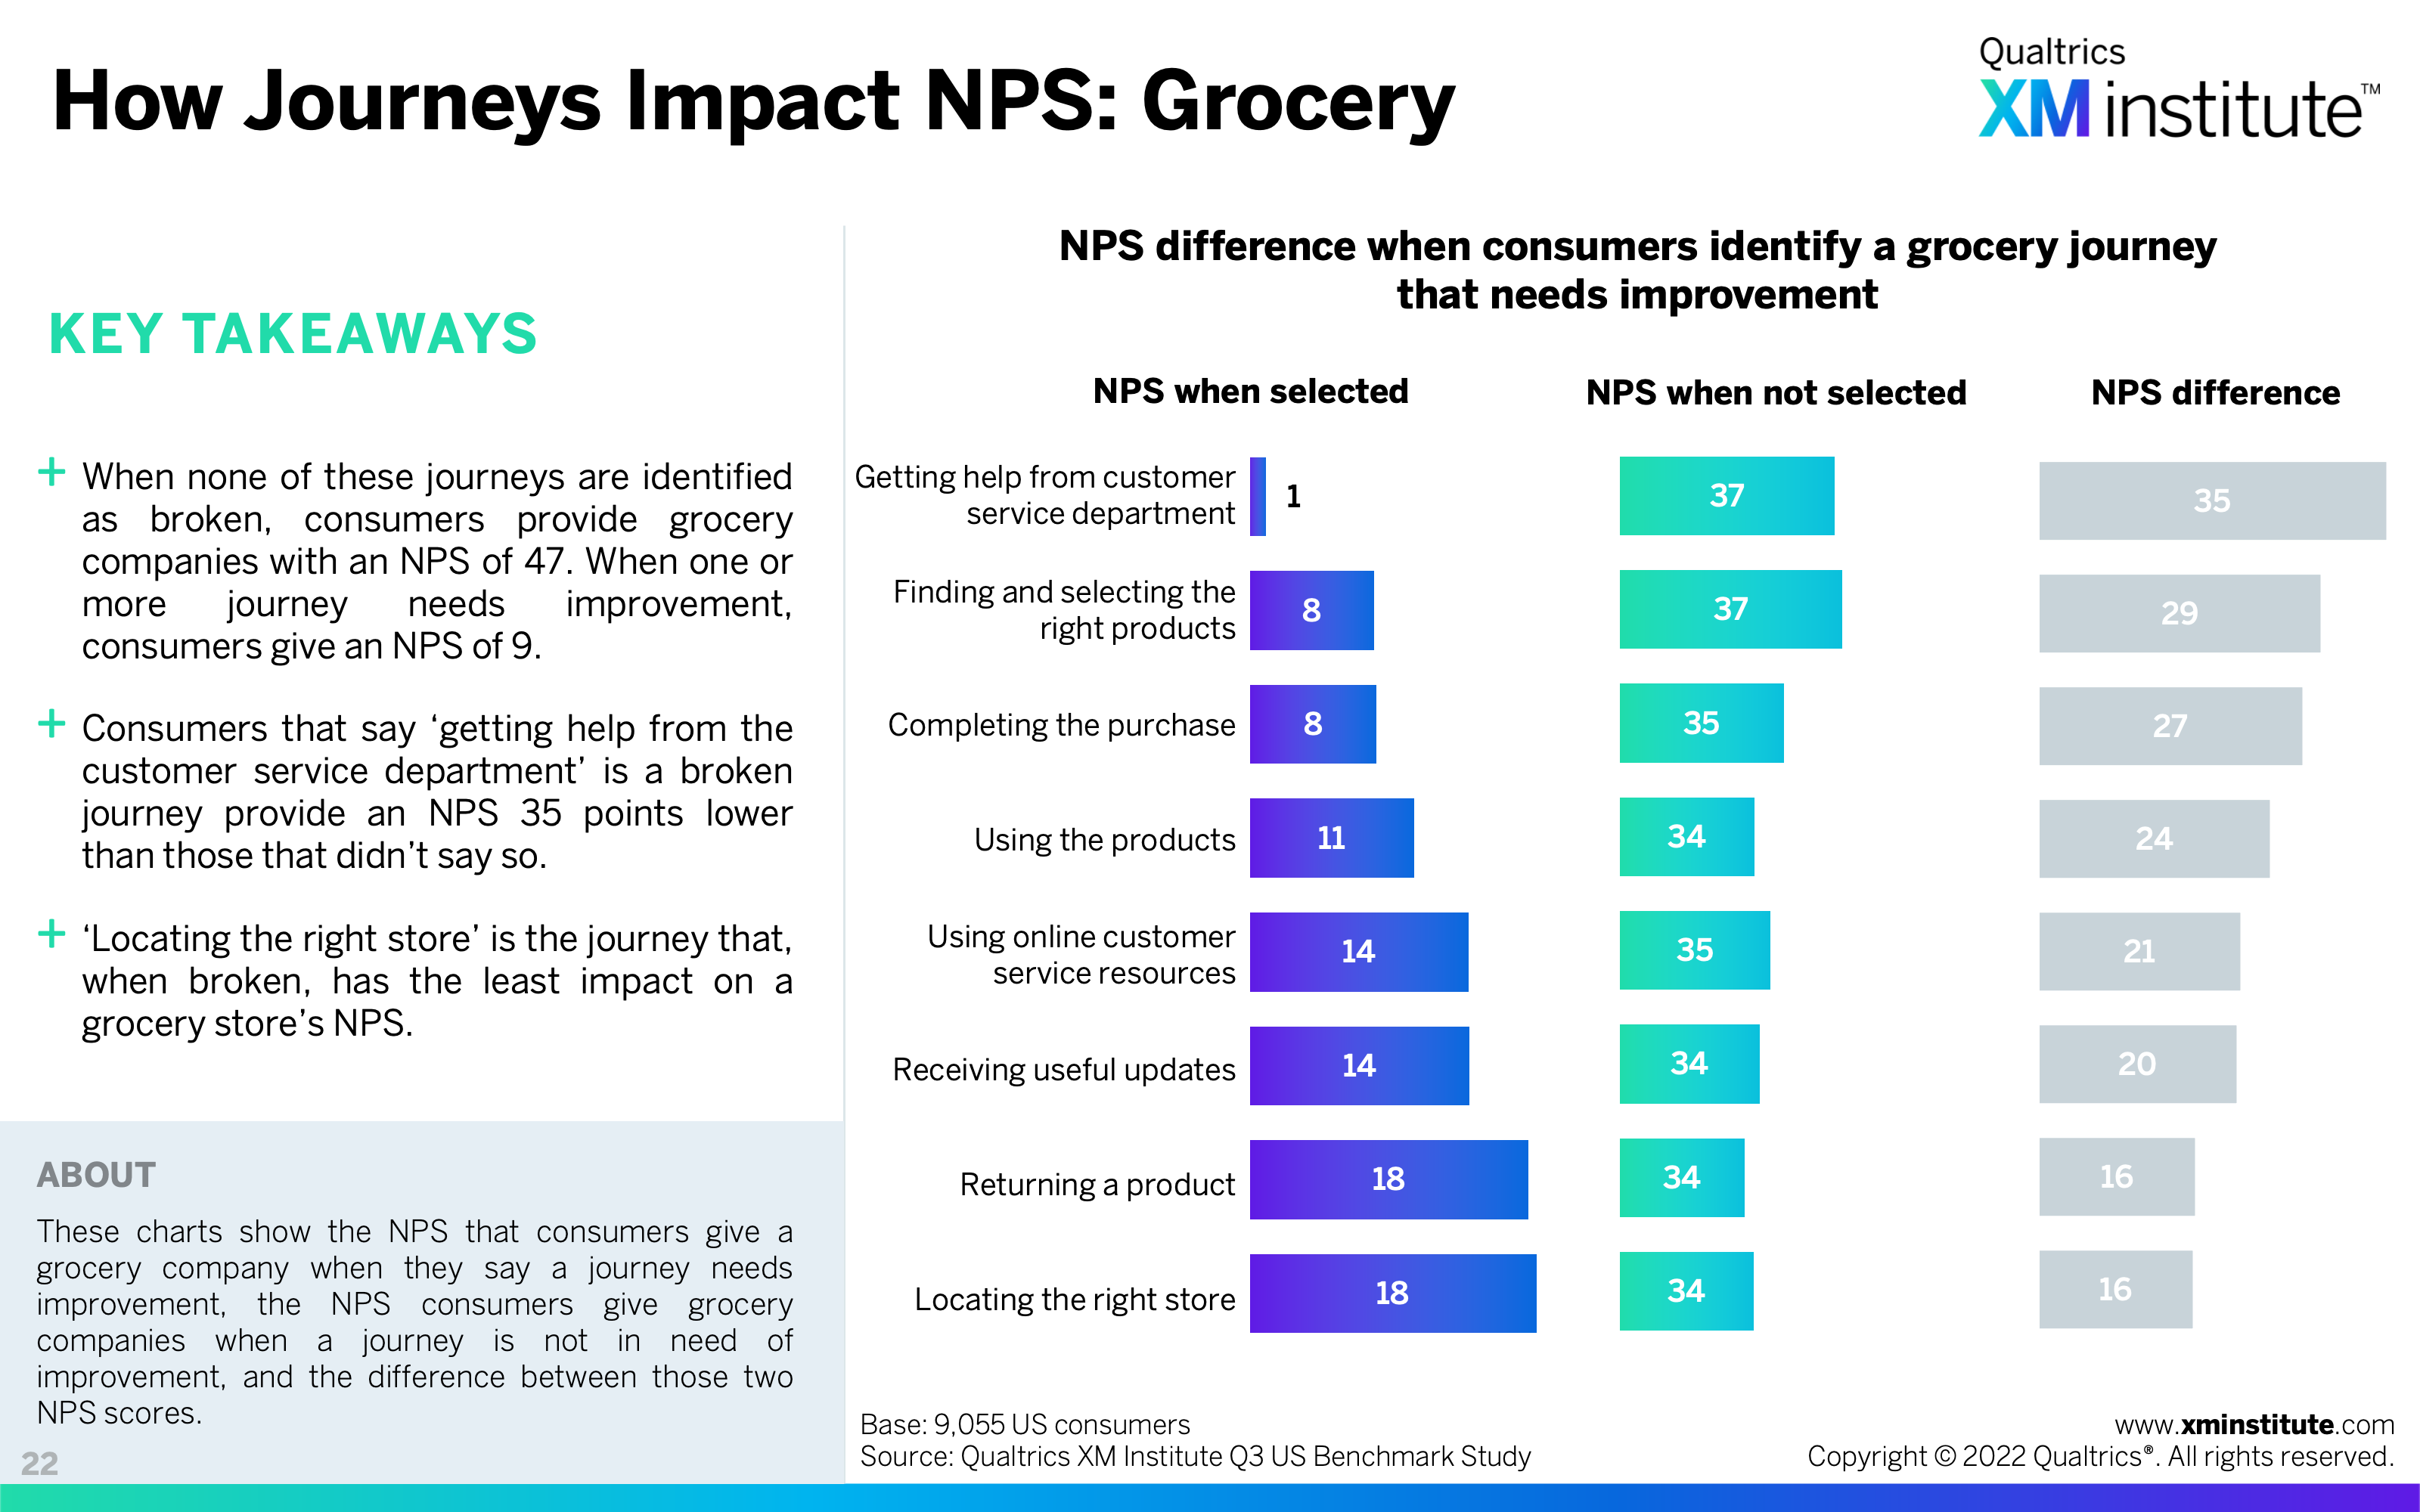
- How Journeys Impact NPS: Grocery (see Figure 22)
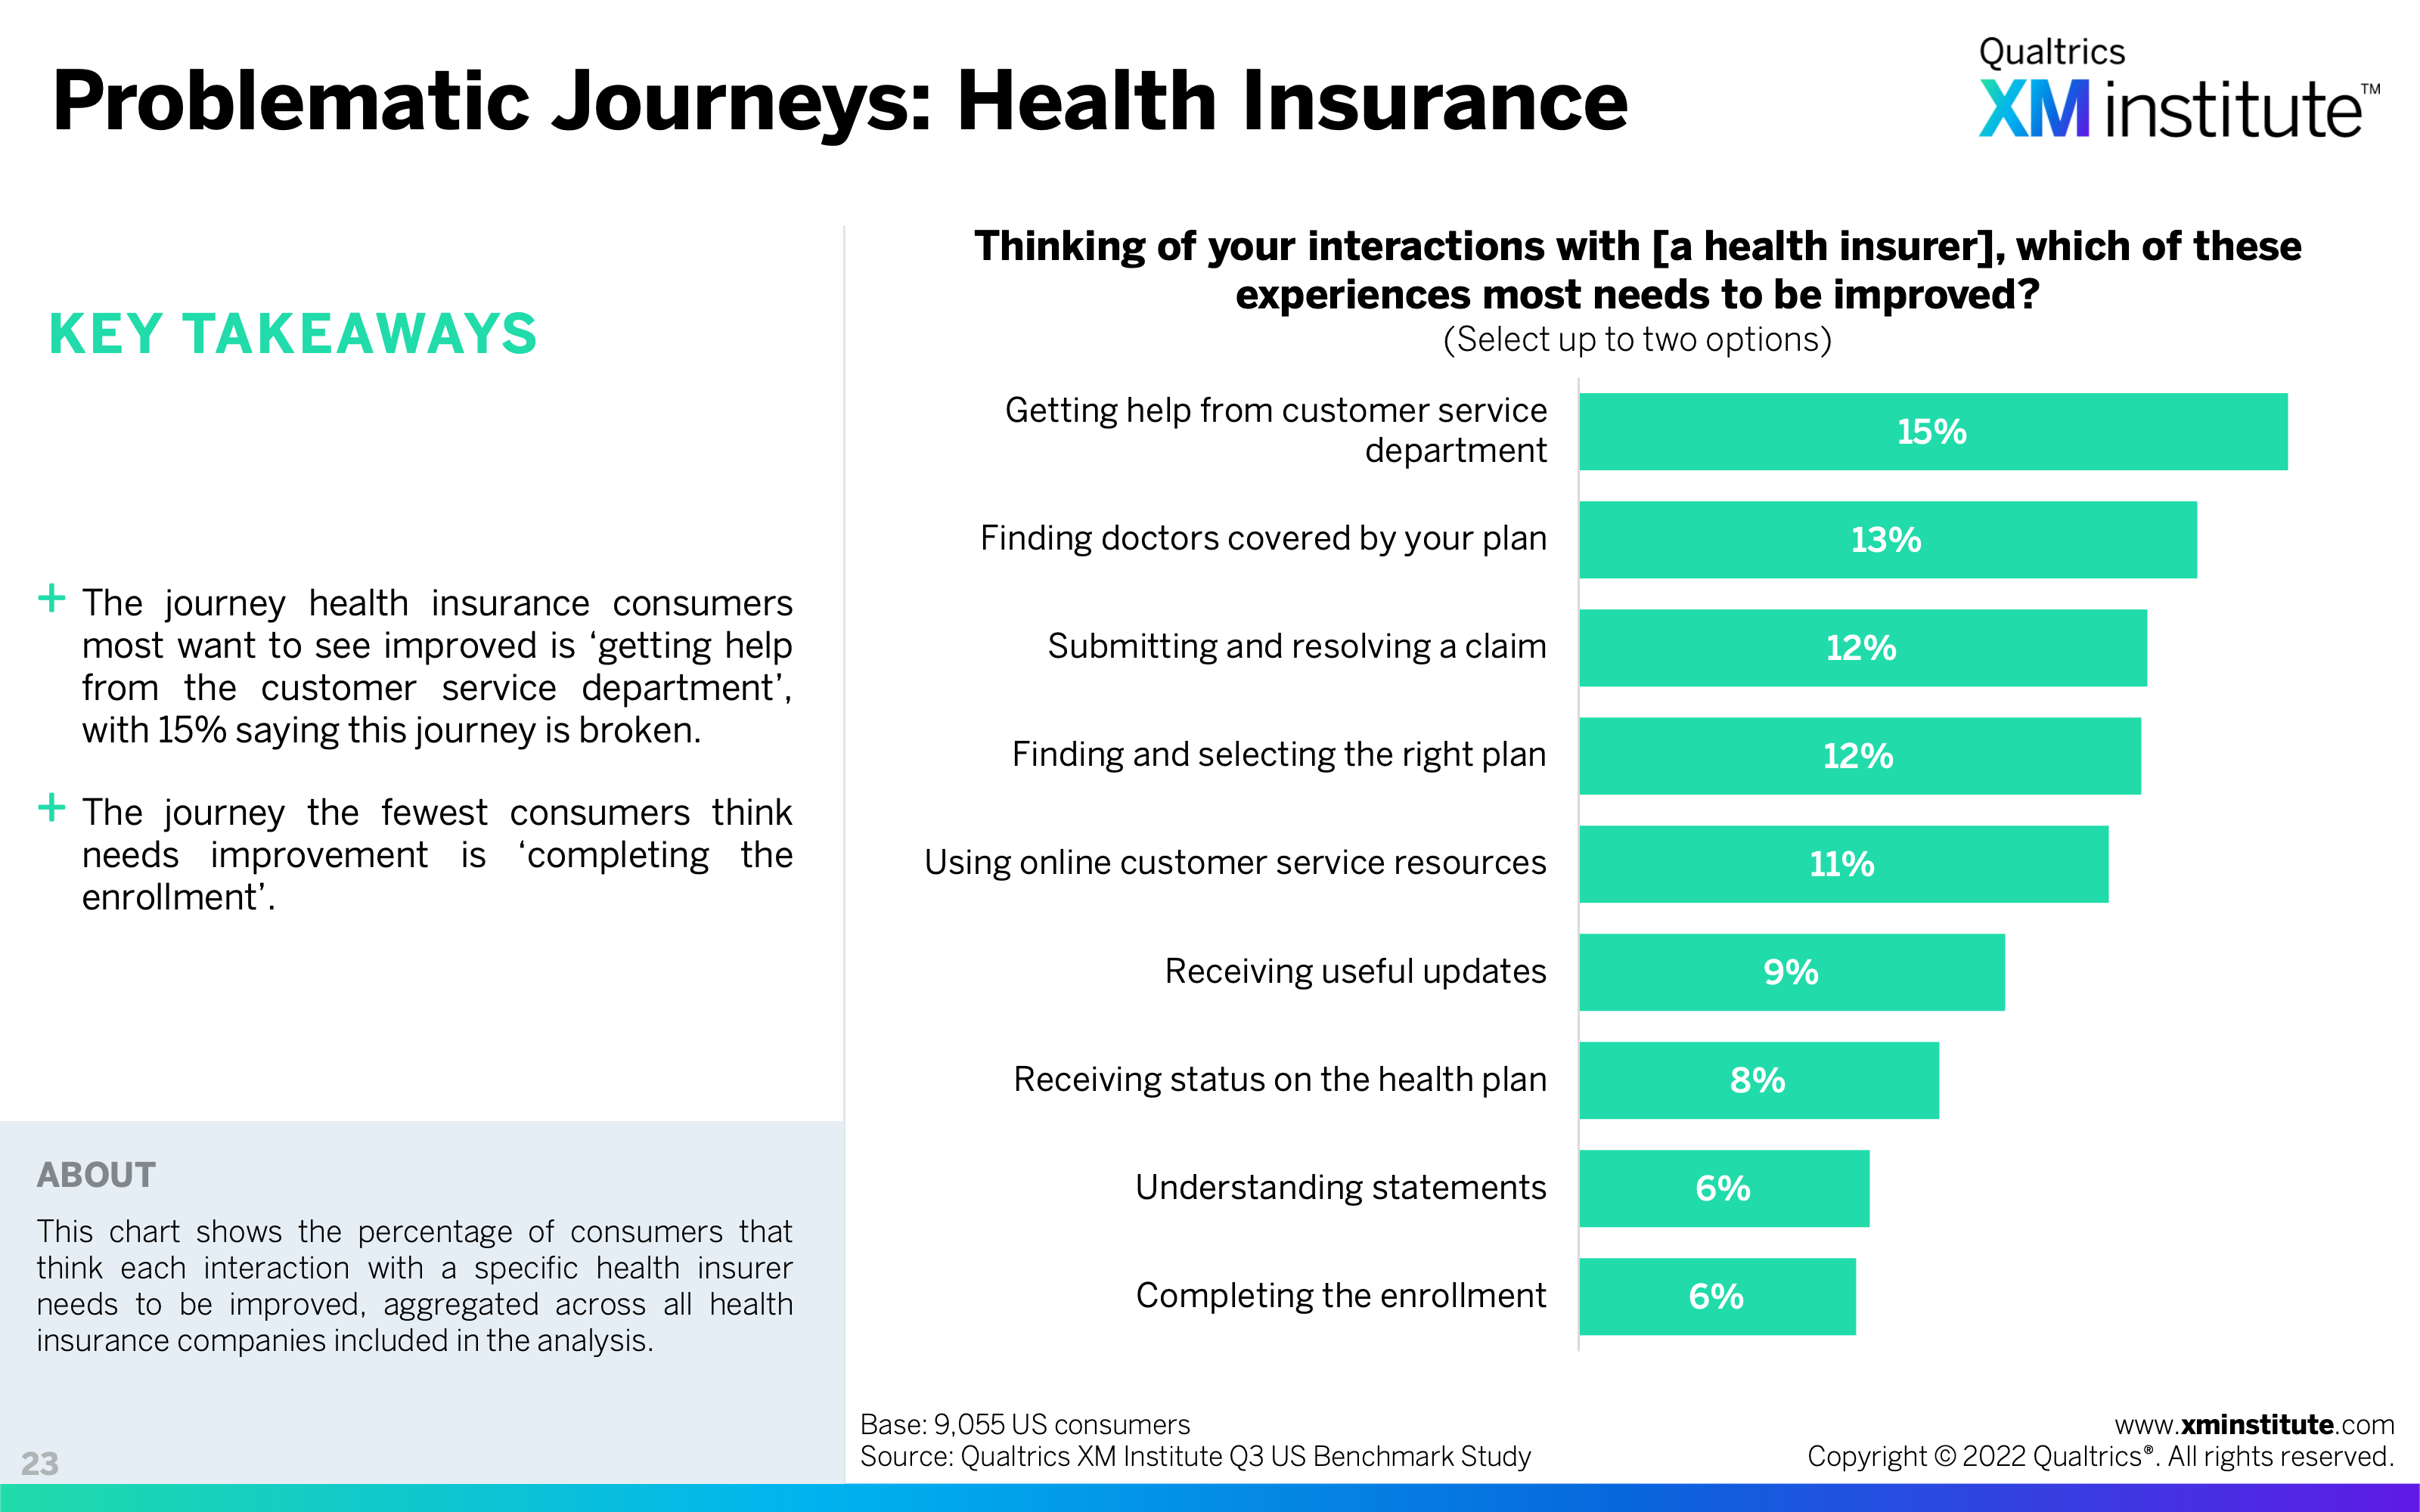
- Problematic Journeys: Health Insurance (see Figure 23)
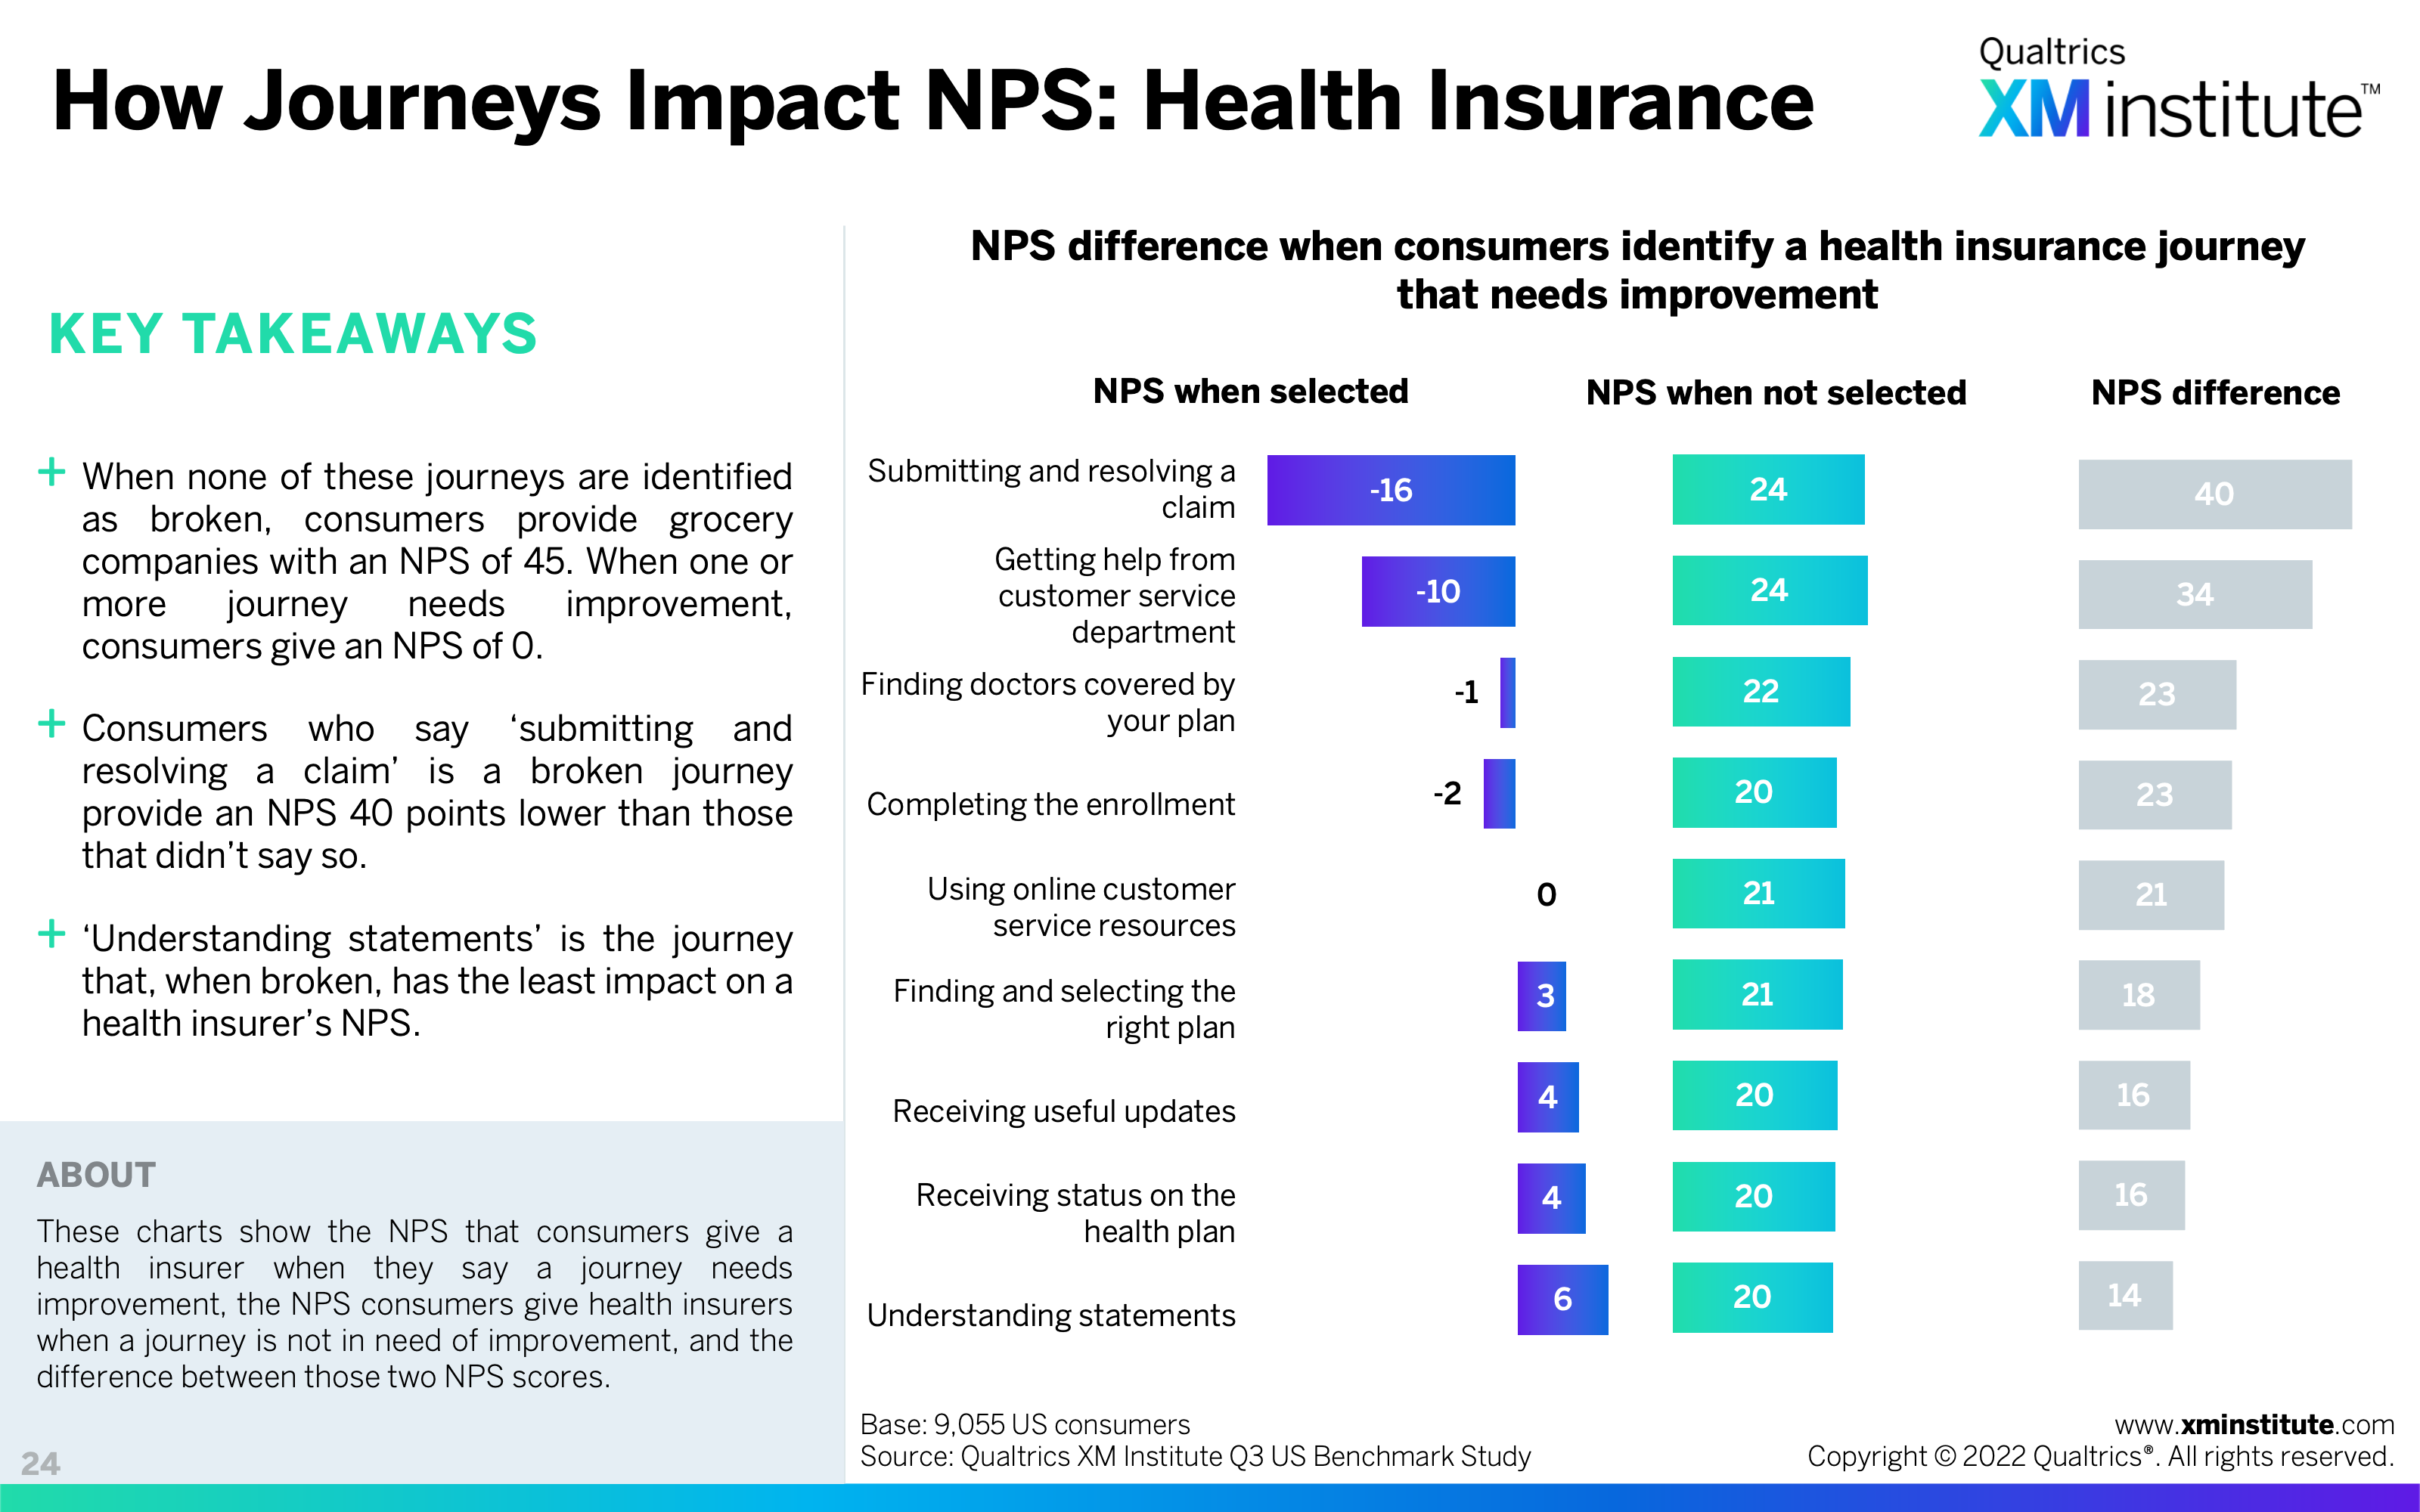
- How Journeys Impact NPS: Health Insurance (see Figure 24)
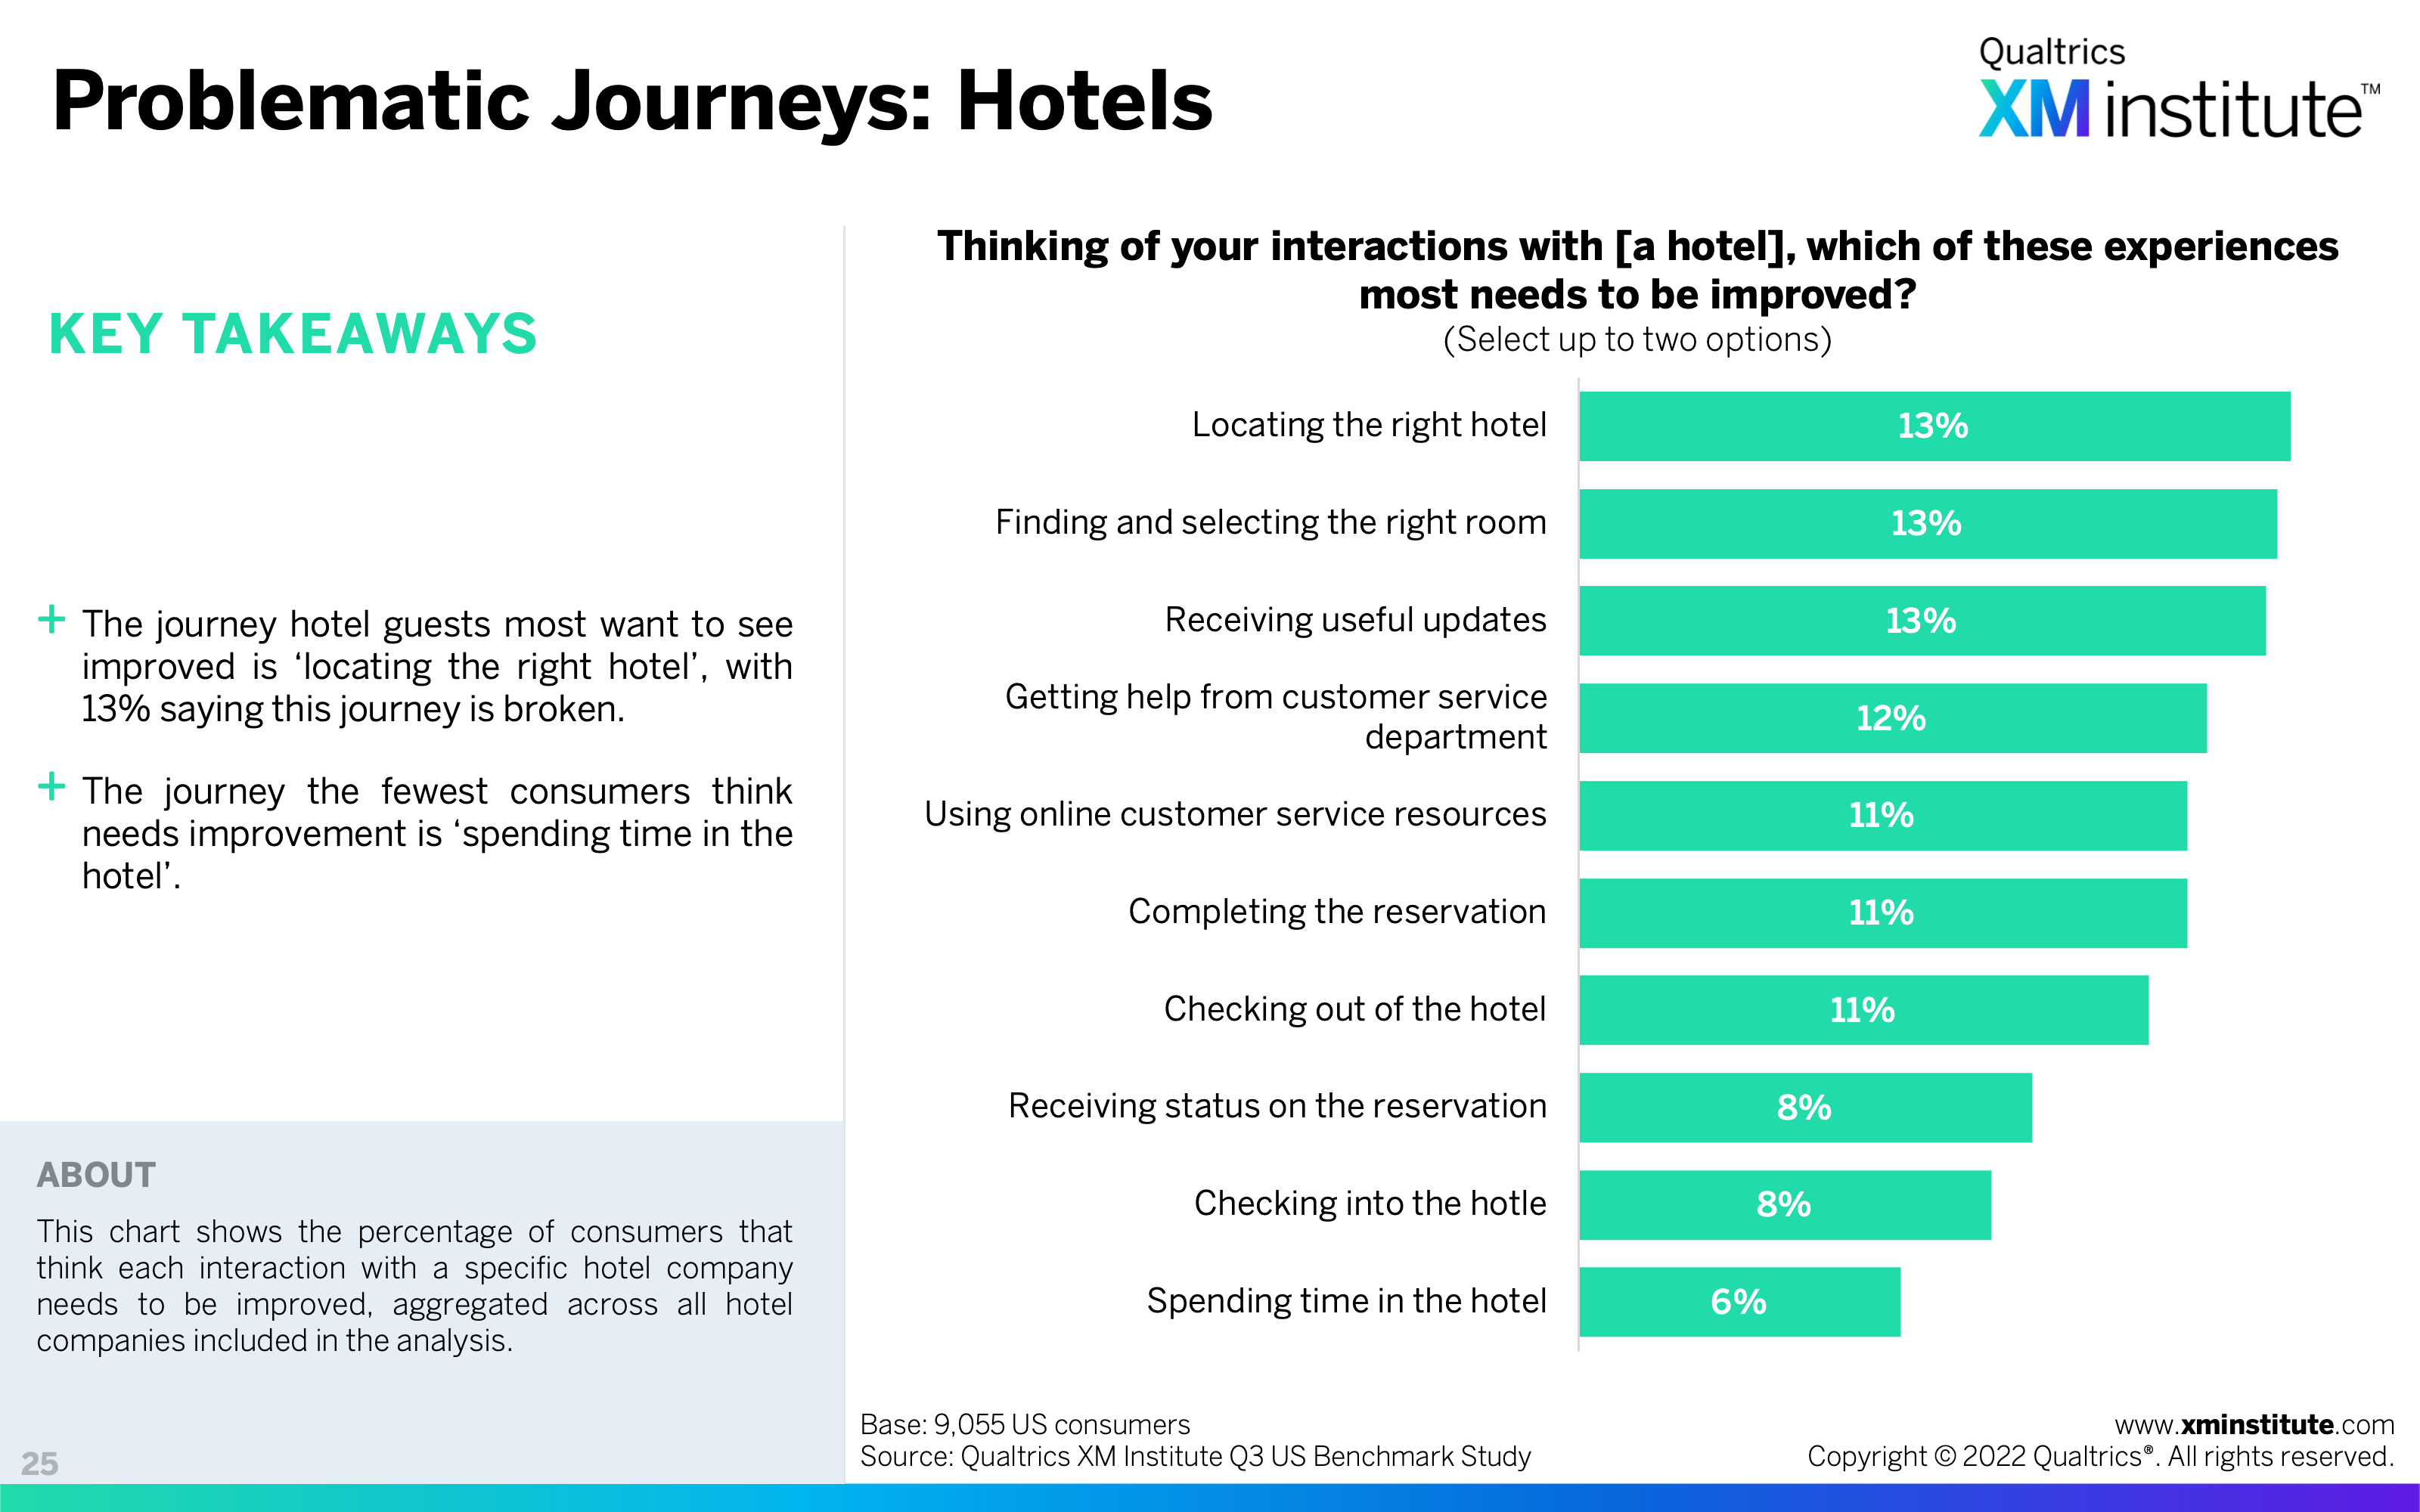
- Problematic Journeys: Hotels (see Figure 25)
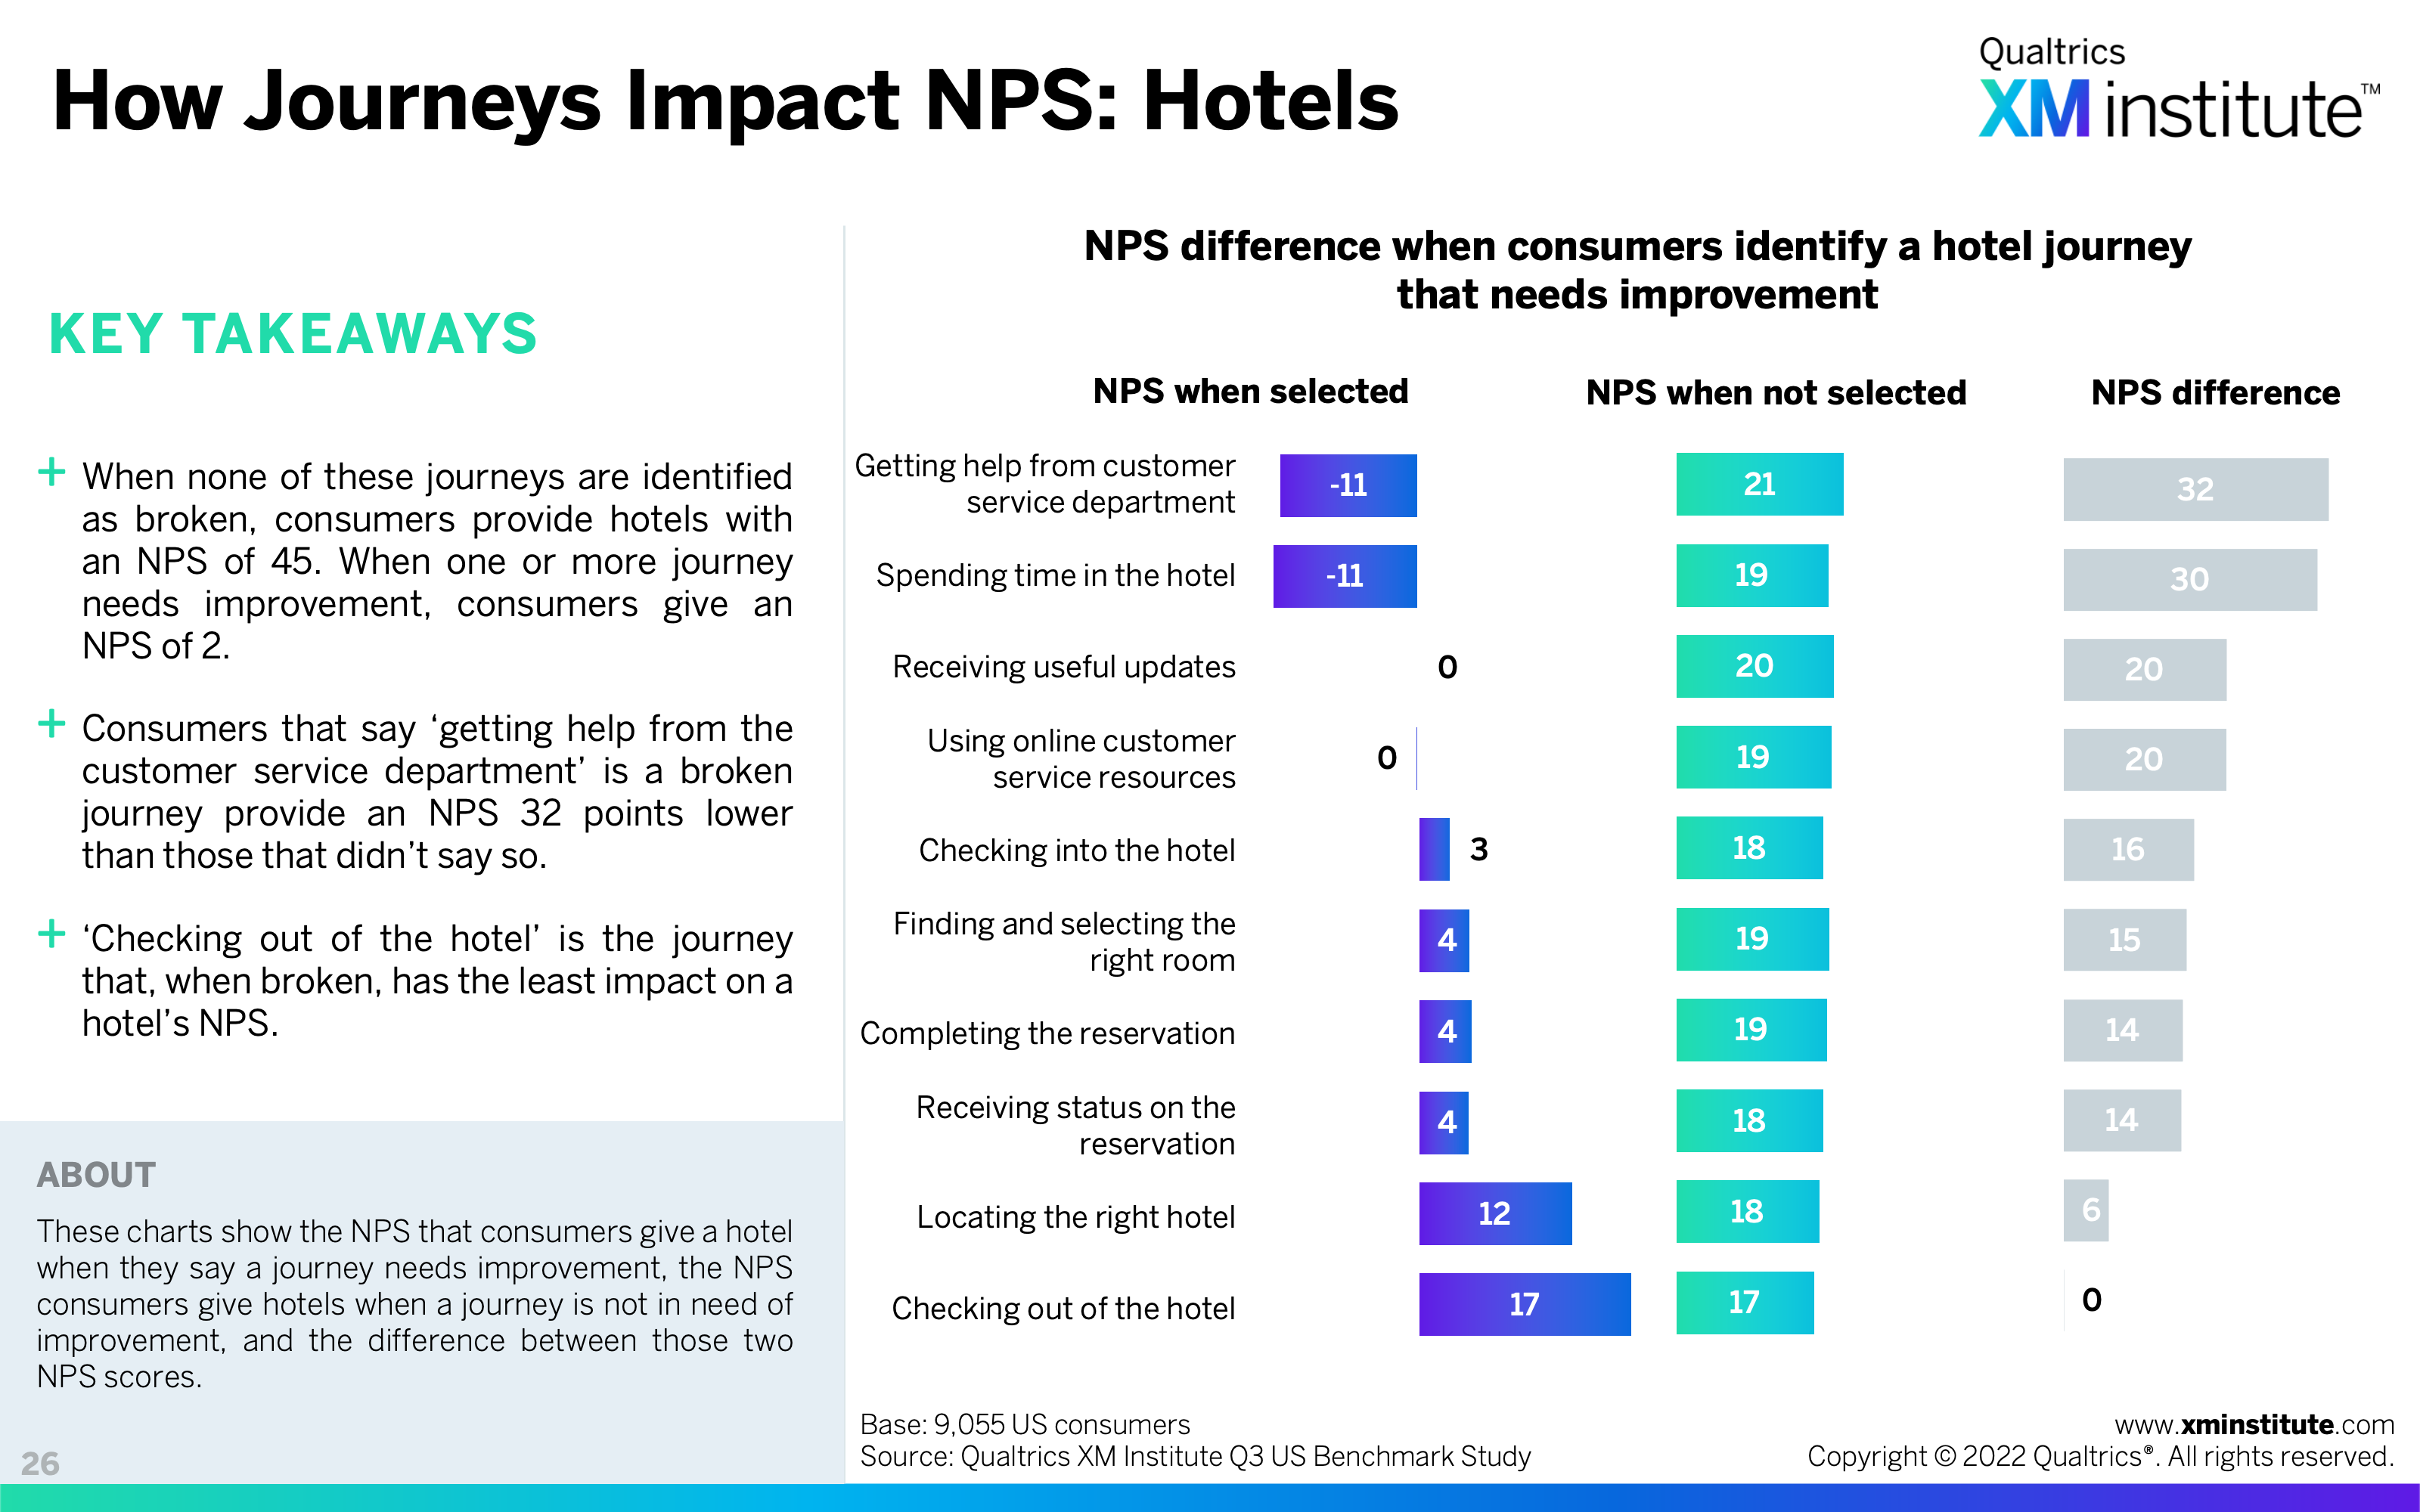
- How Journeys Impact NPS: Hotels (see Figure 26)
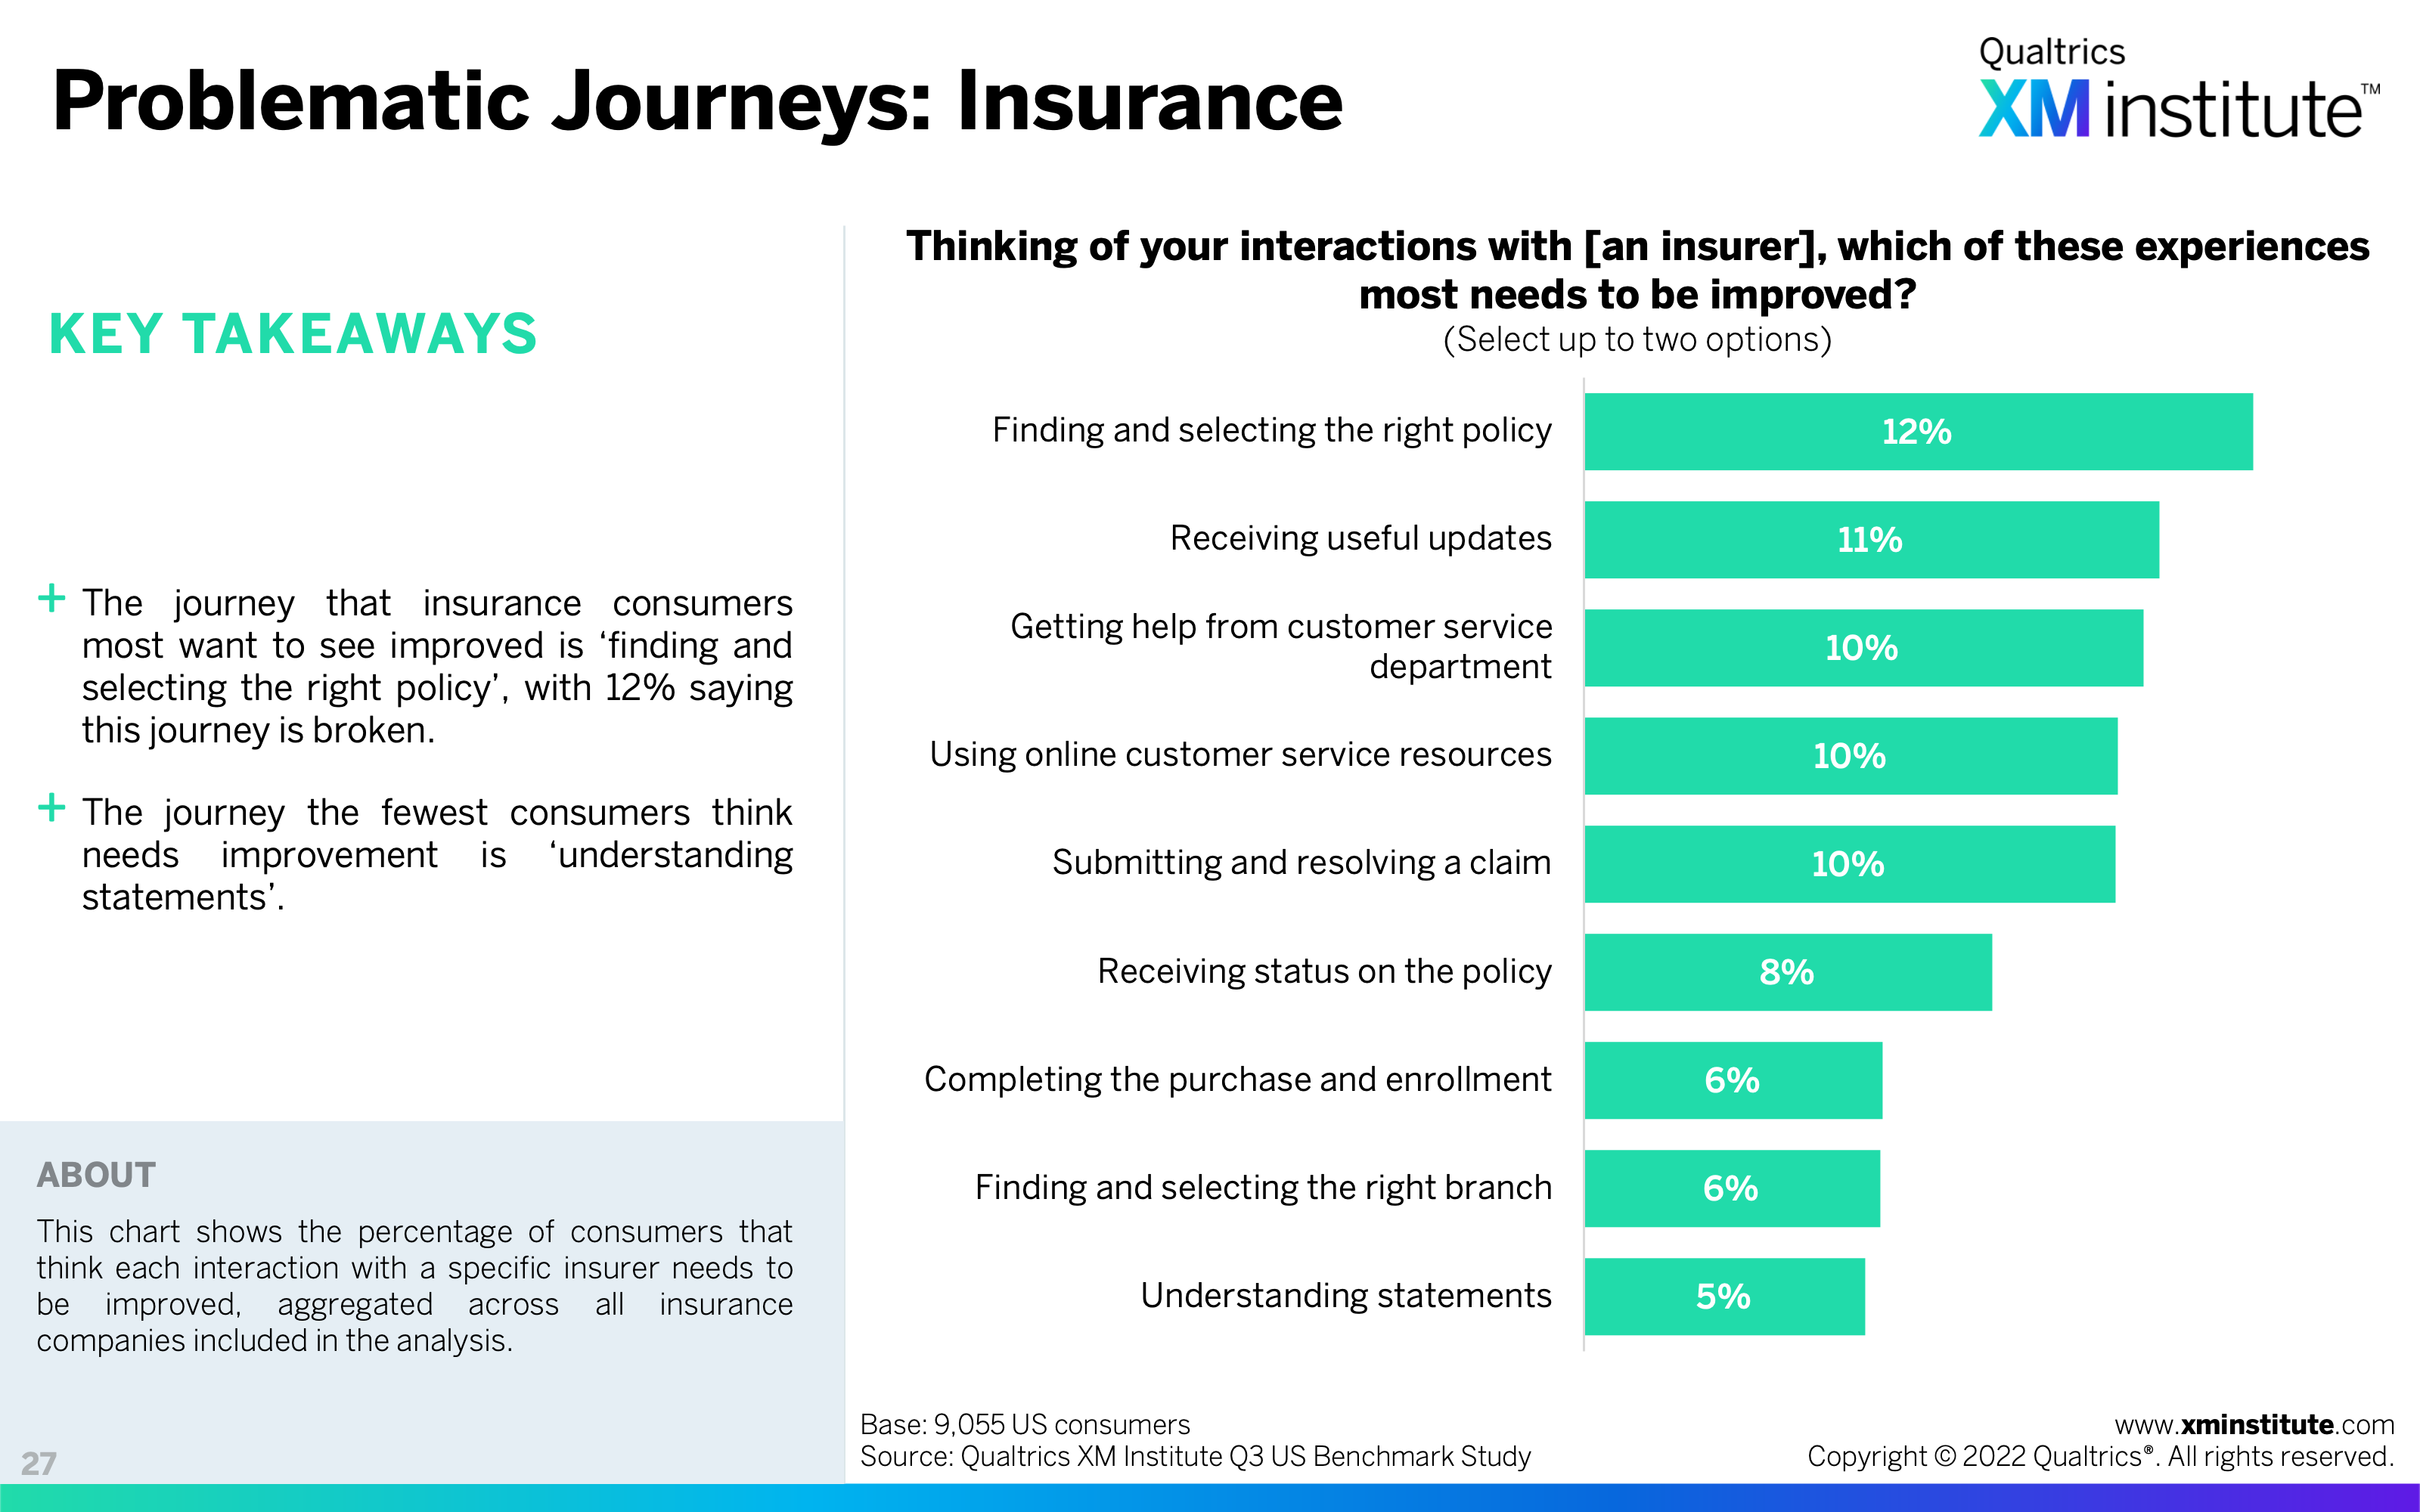
- Problematic Journeys: Insurance (see Figure 27)
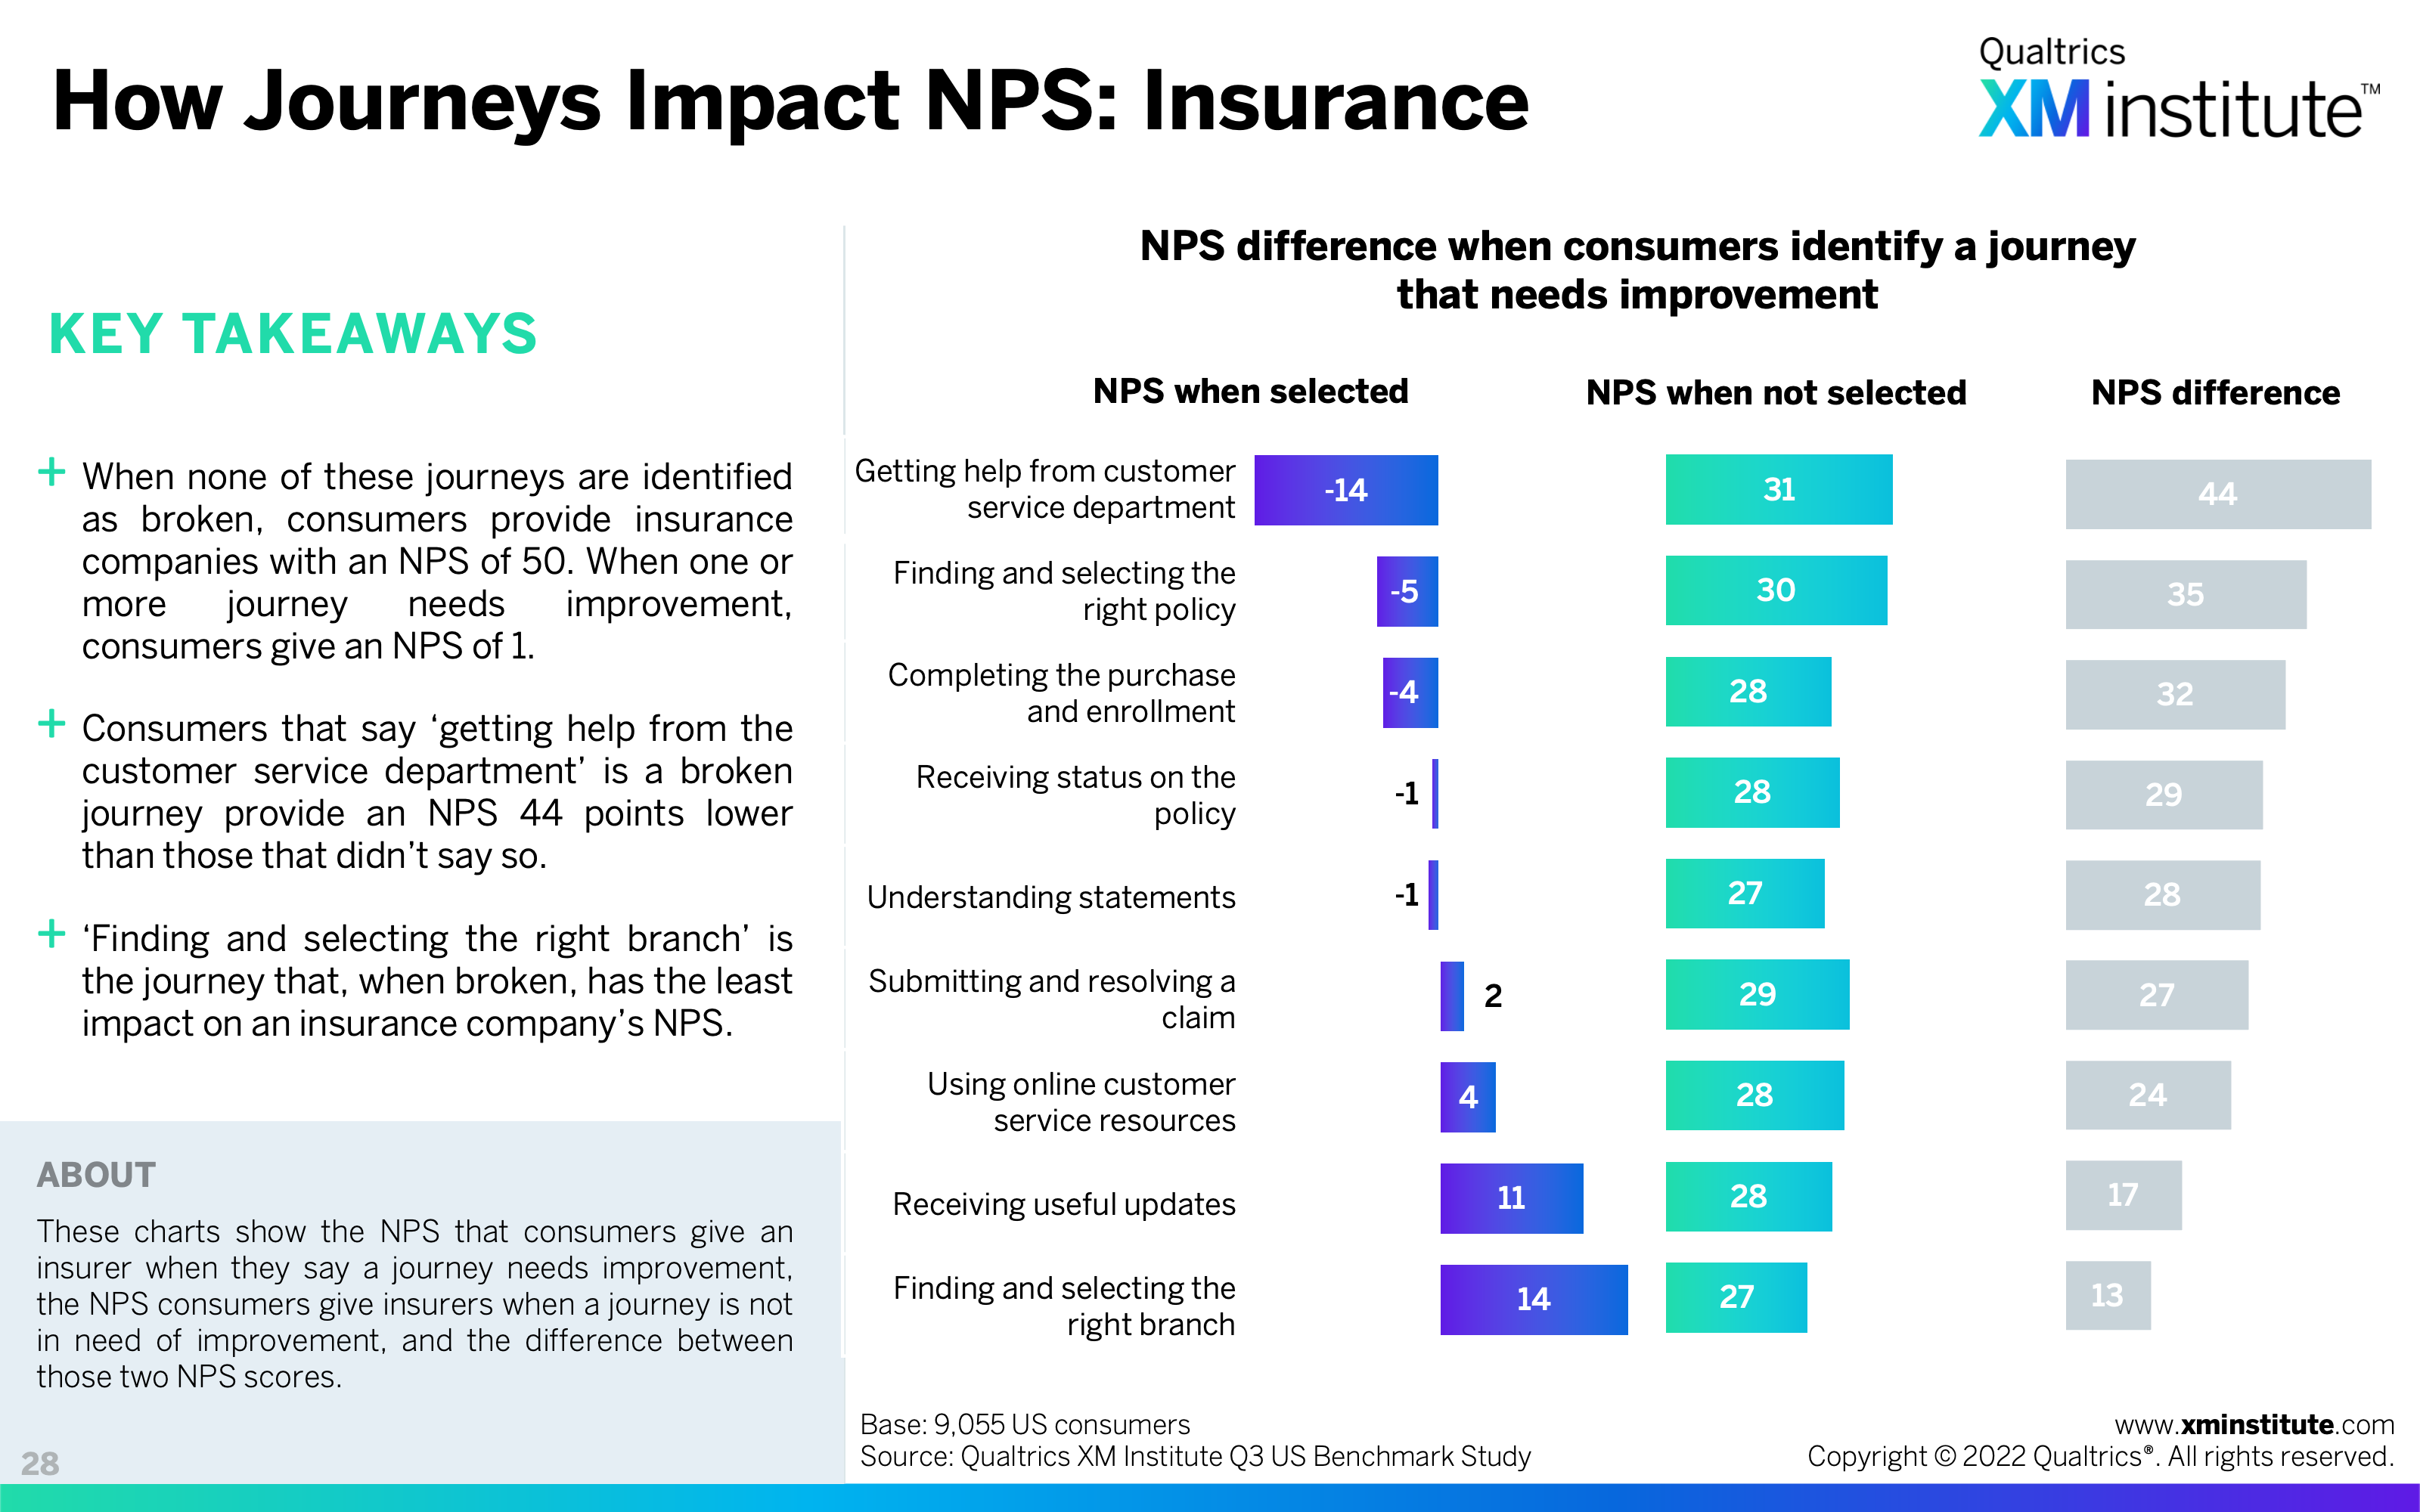
- How Journeys Impact NPS: Insurance (see Figure 28)
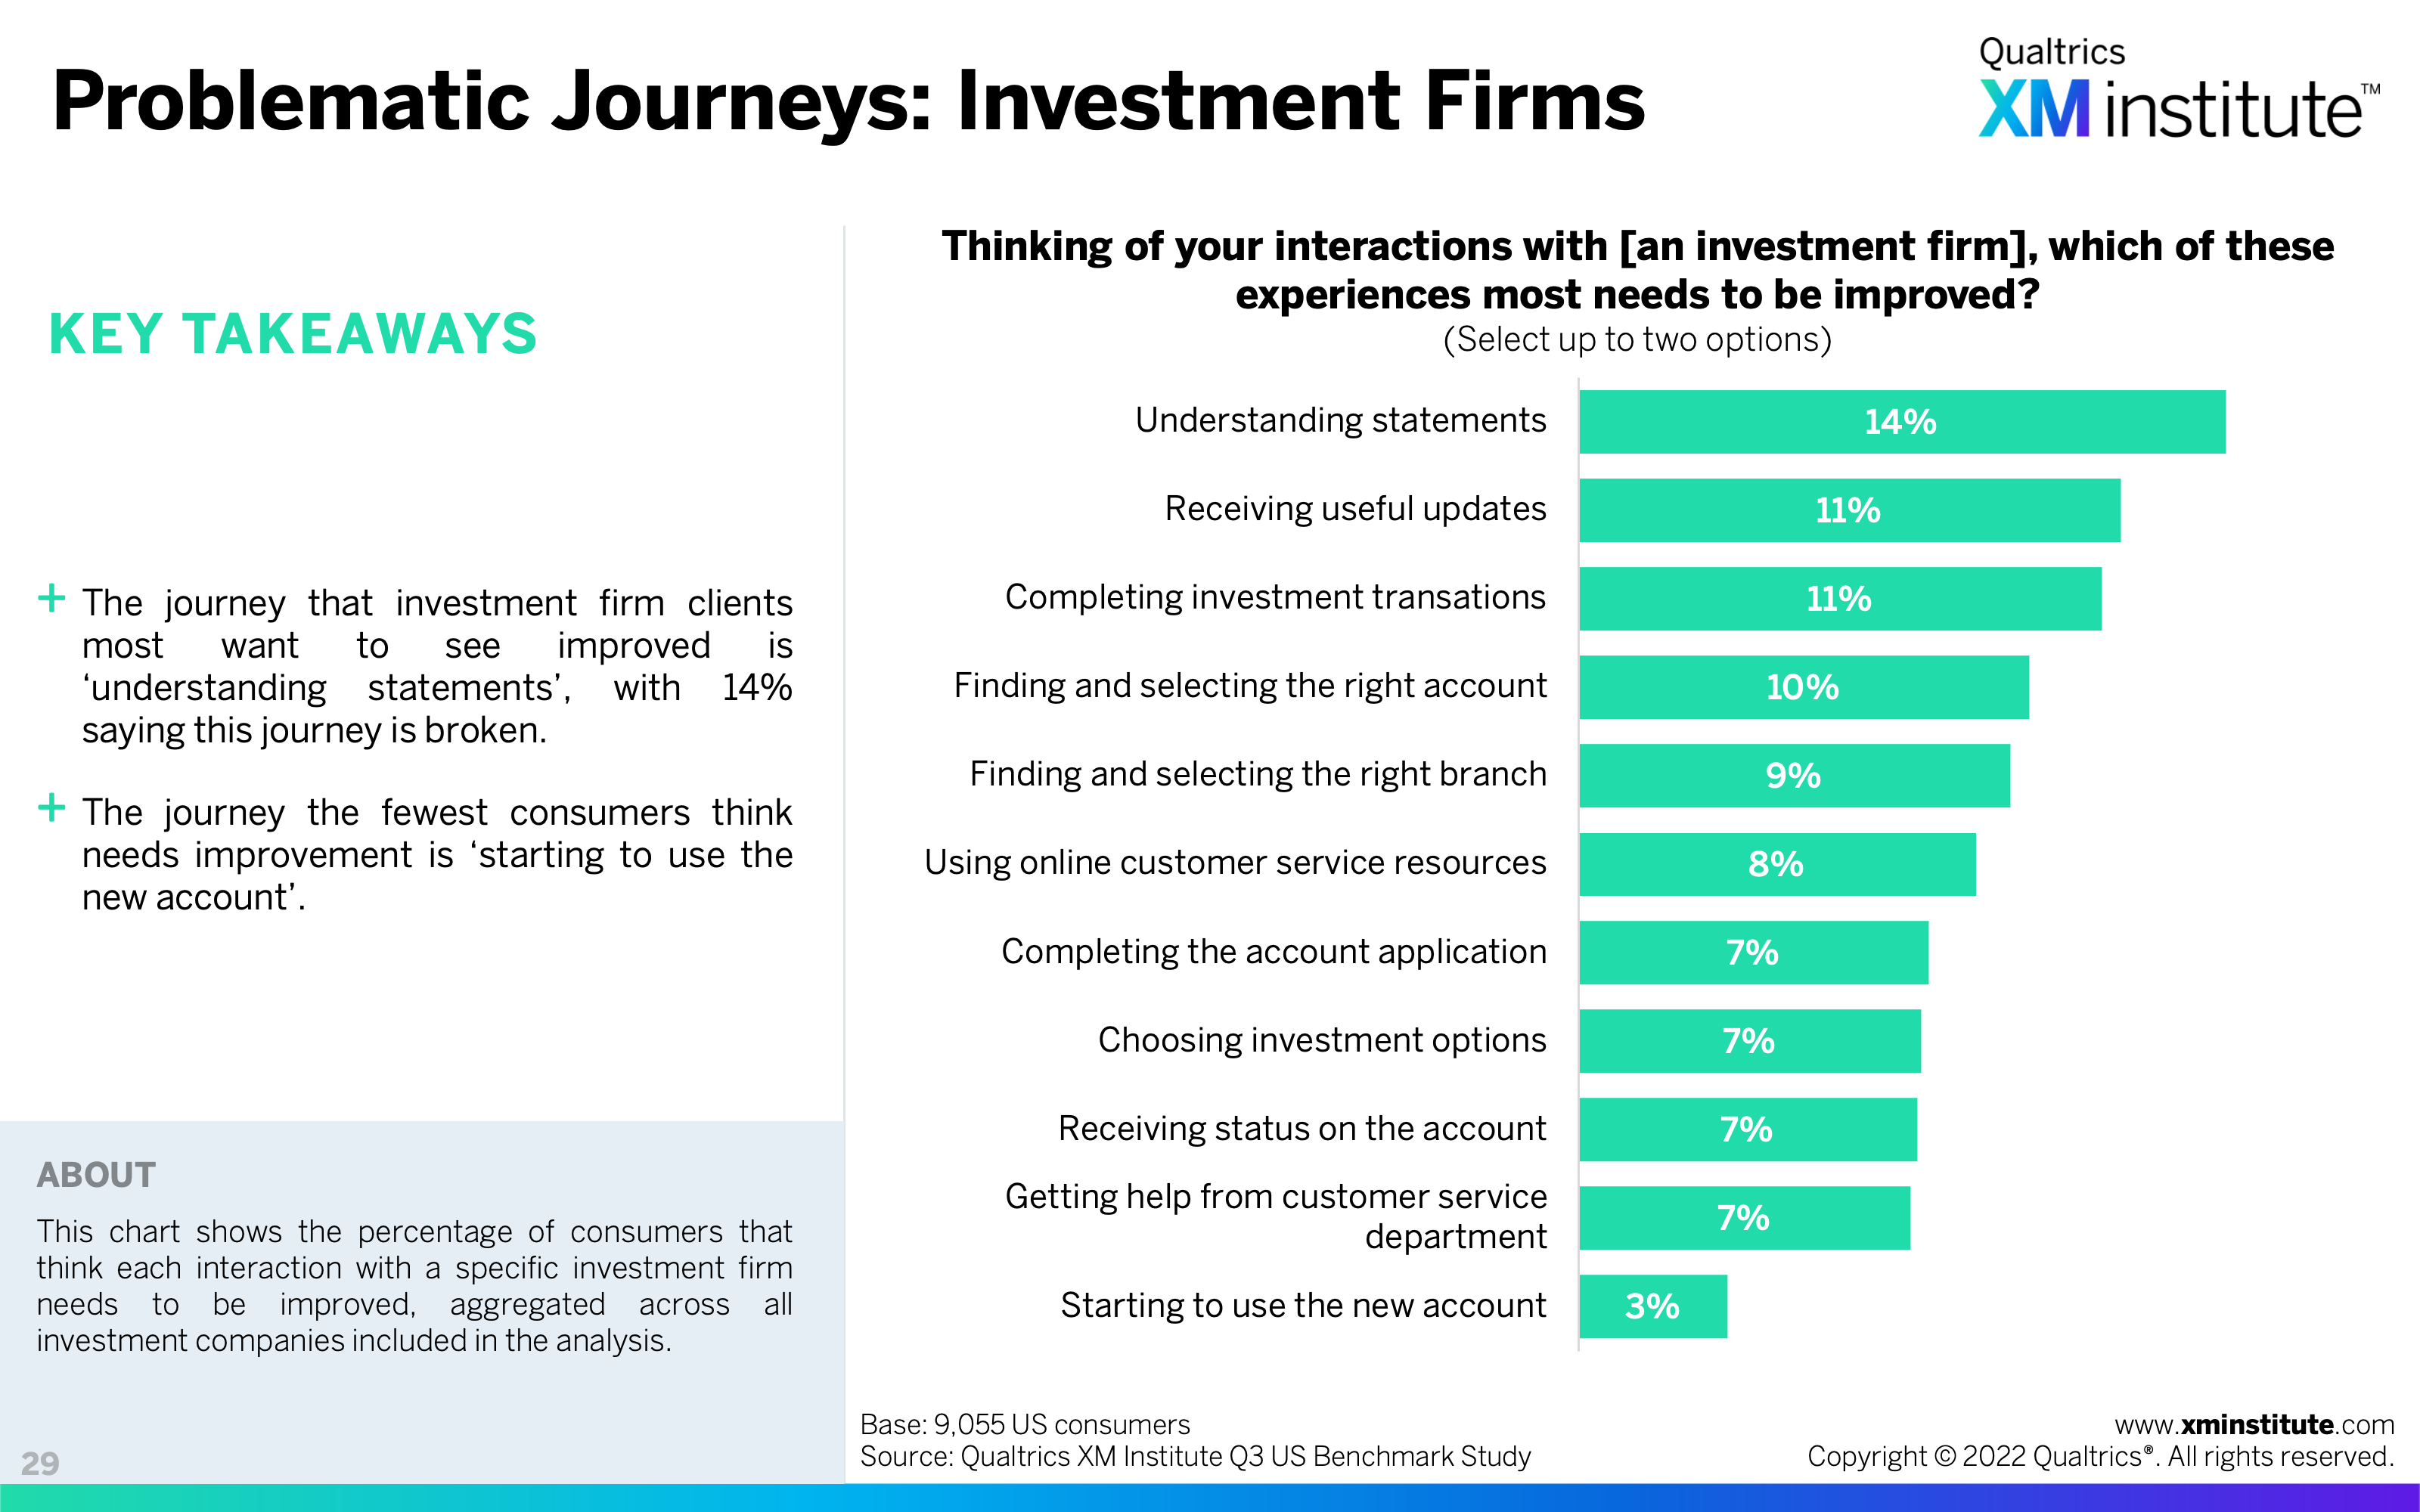
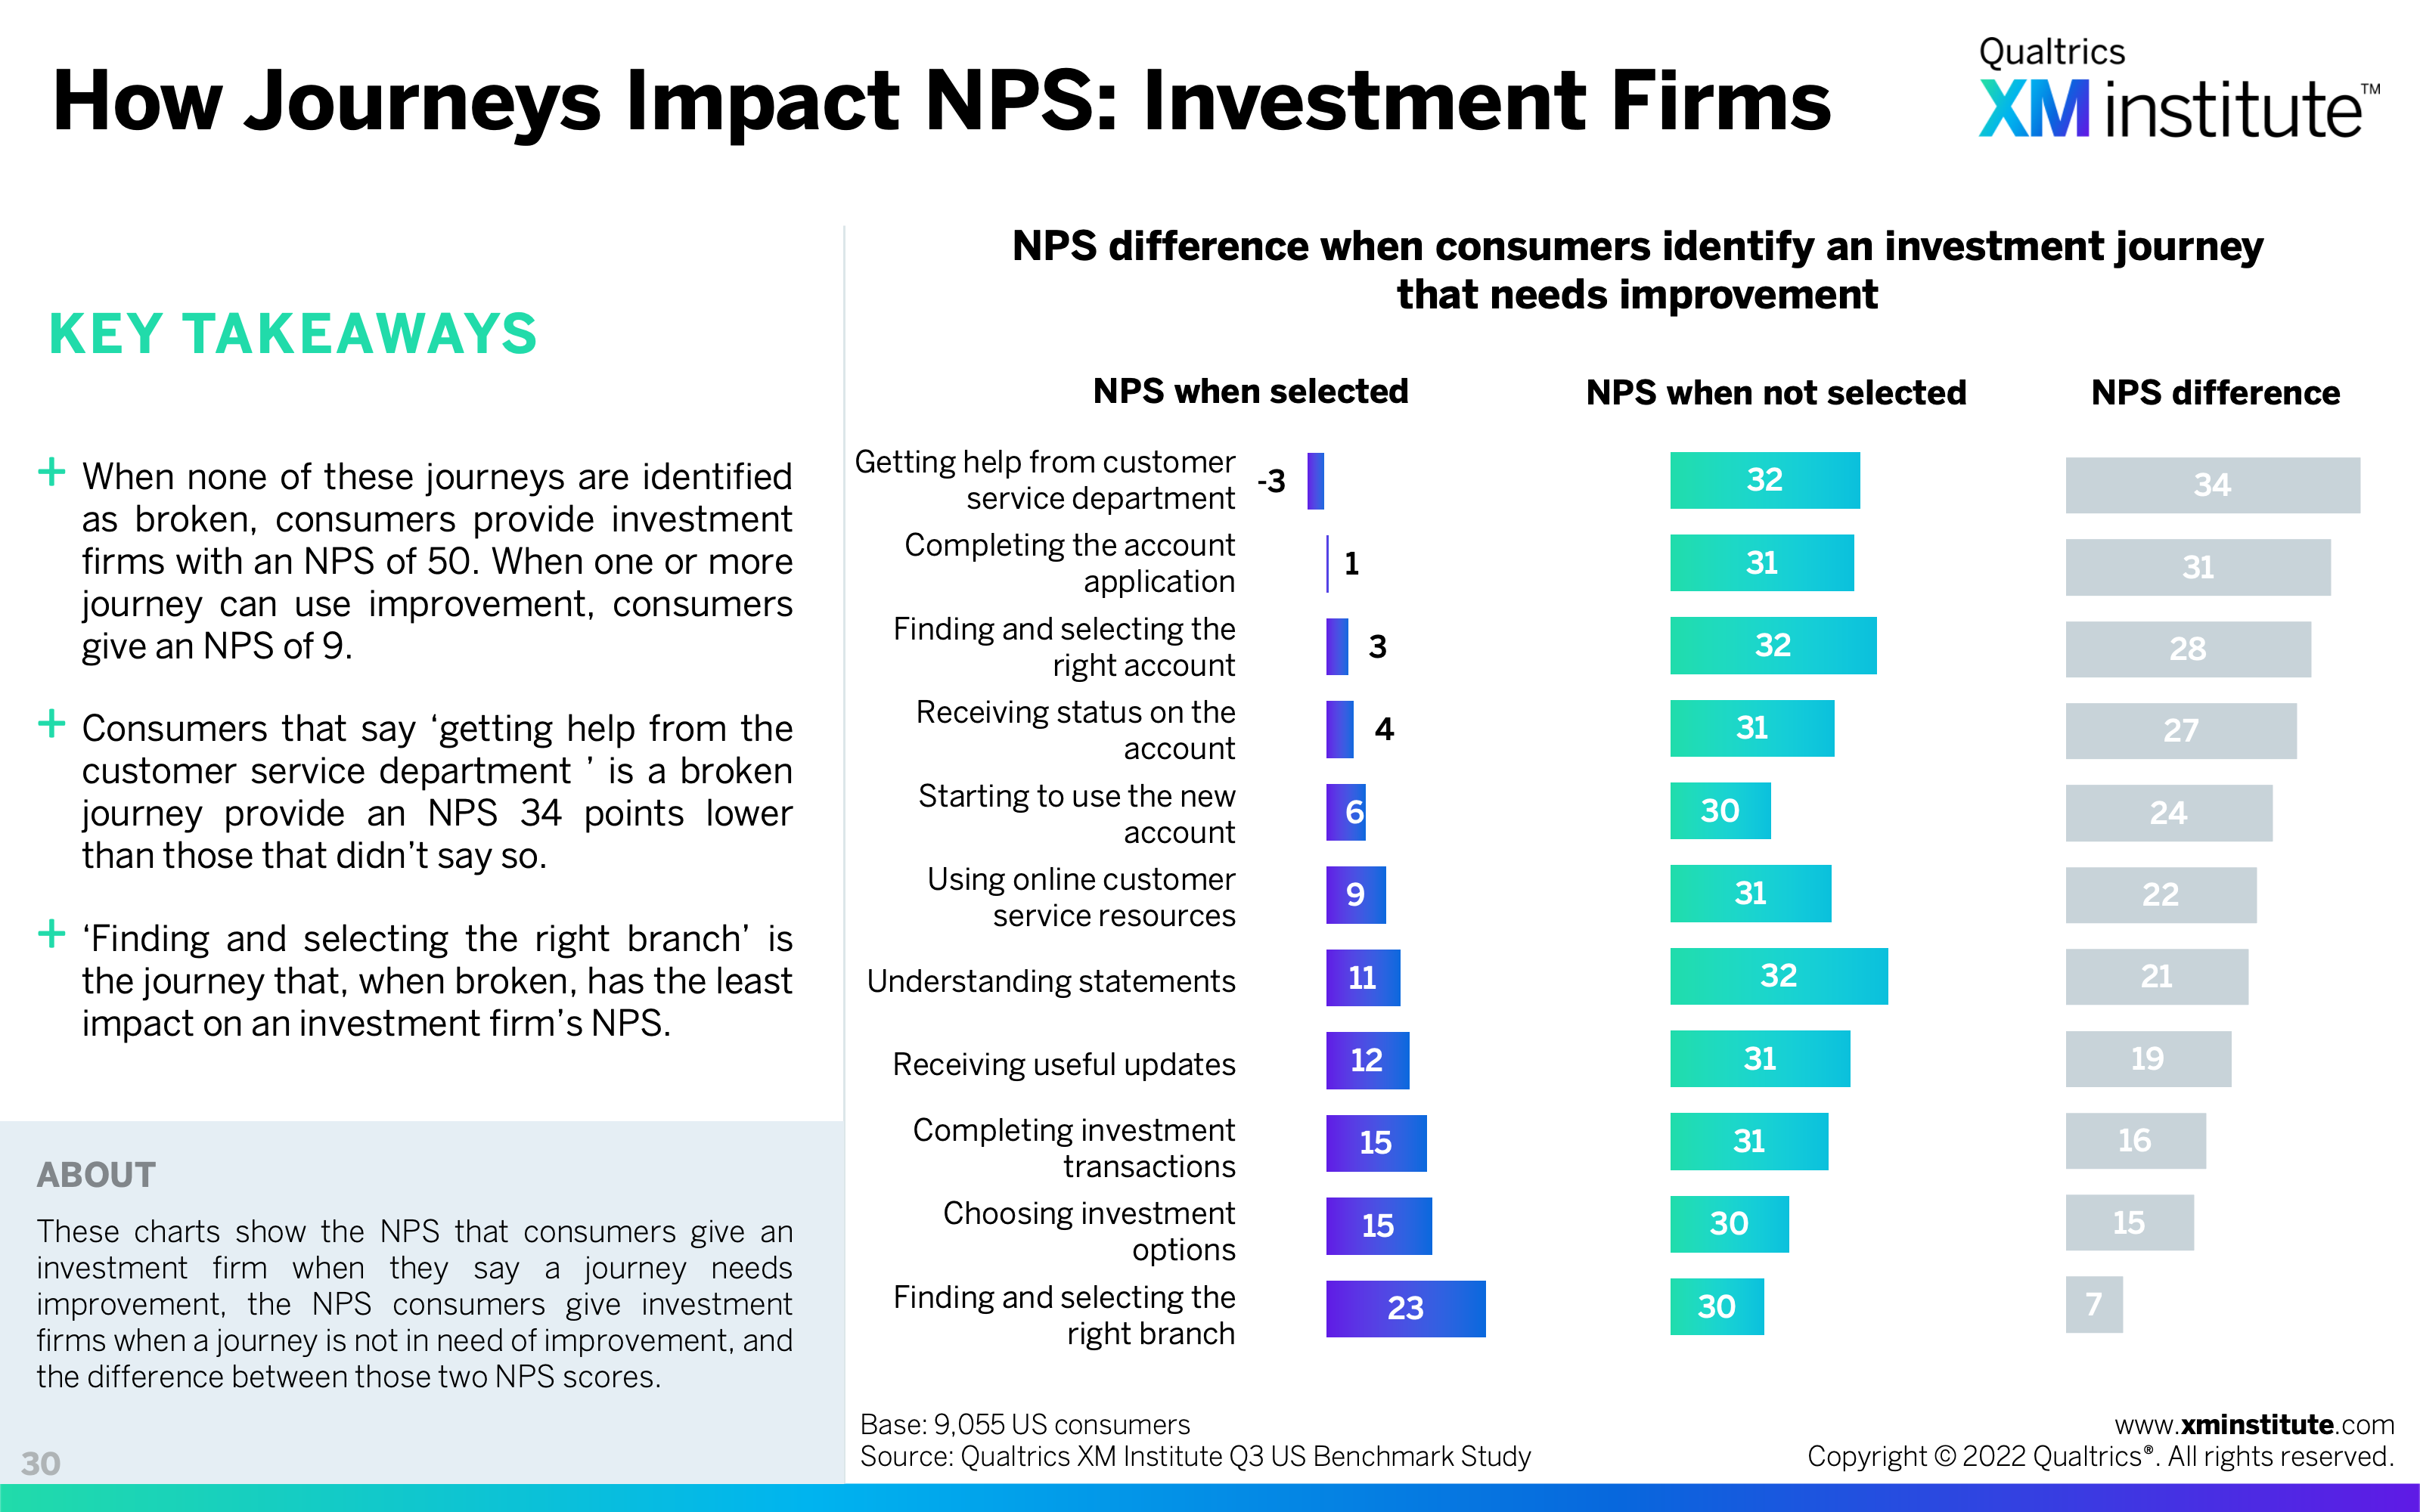
- Problematic Journeys: Investment Firms (see Figure 29)
- How Journeys Impact NPS: Investment Firms (see Figure 30)
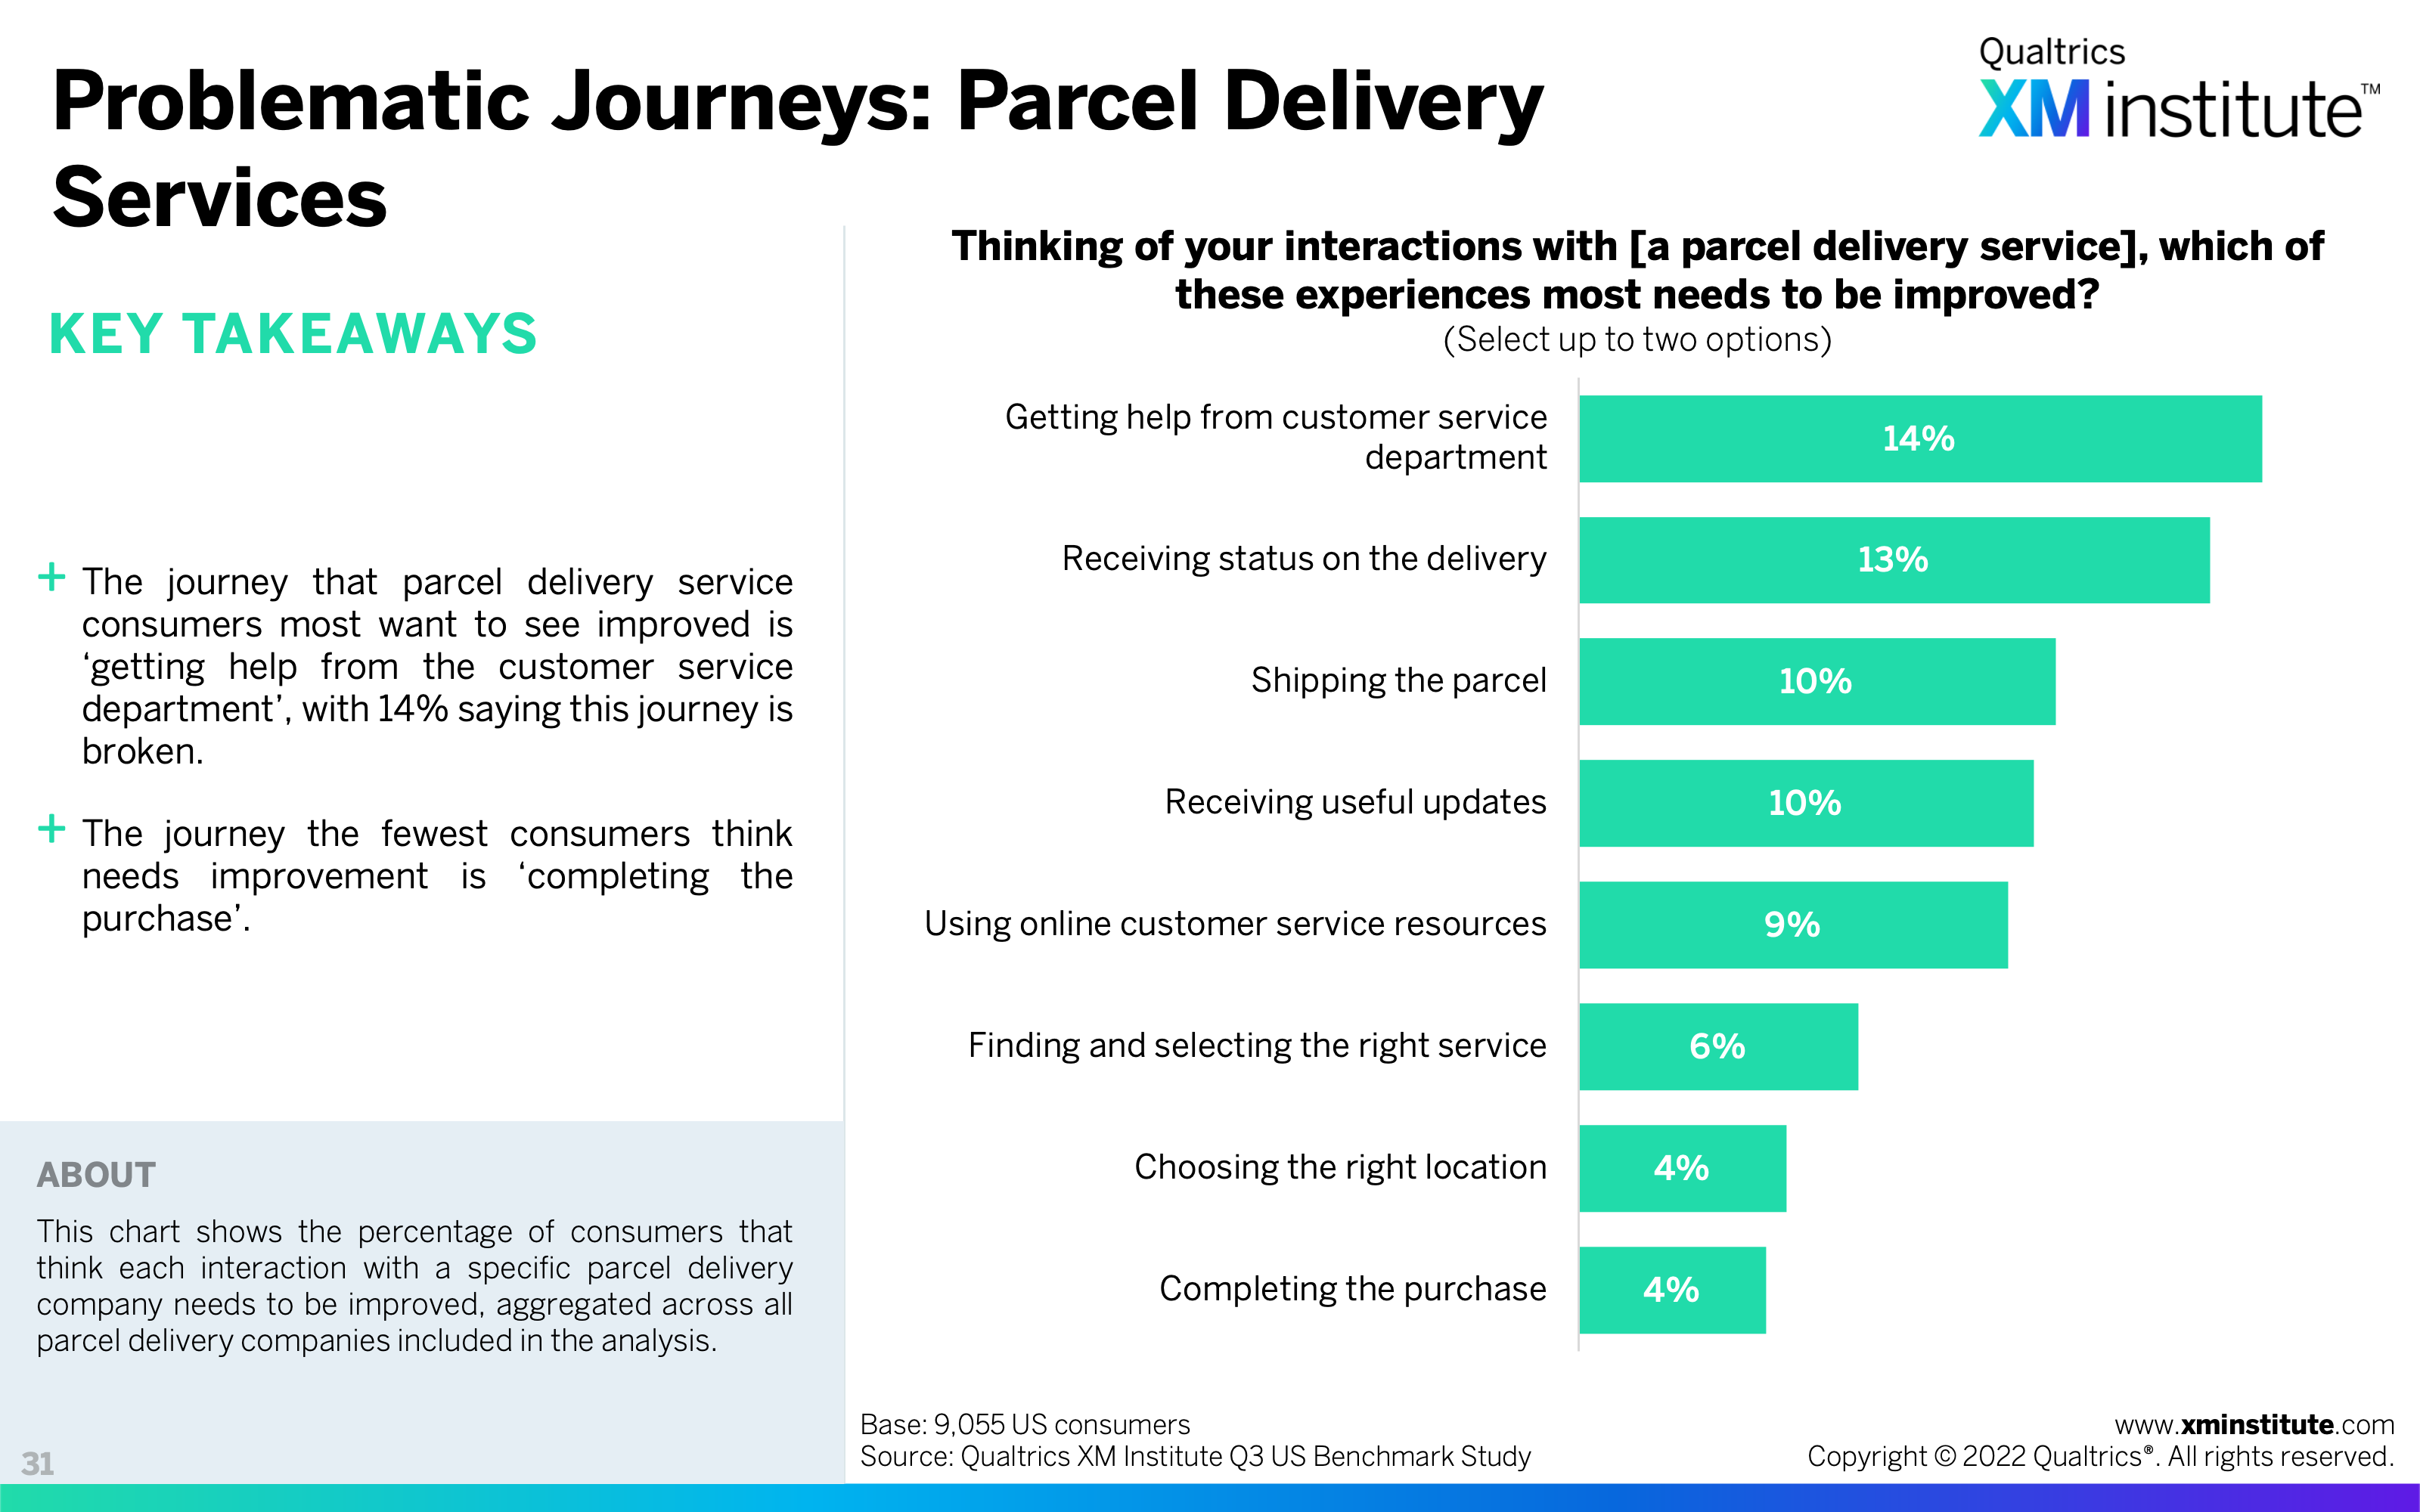
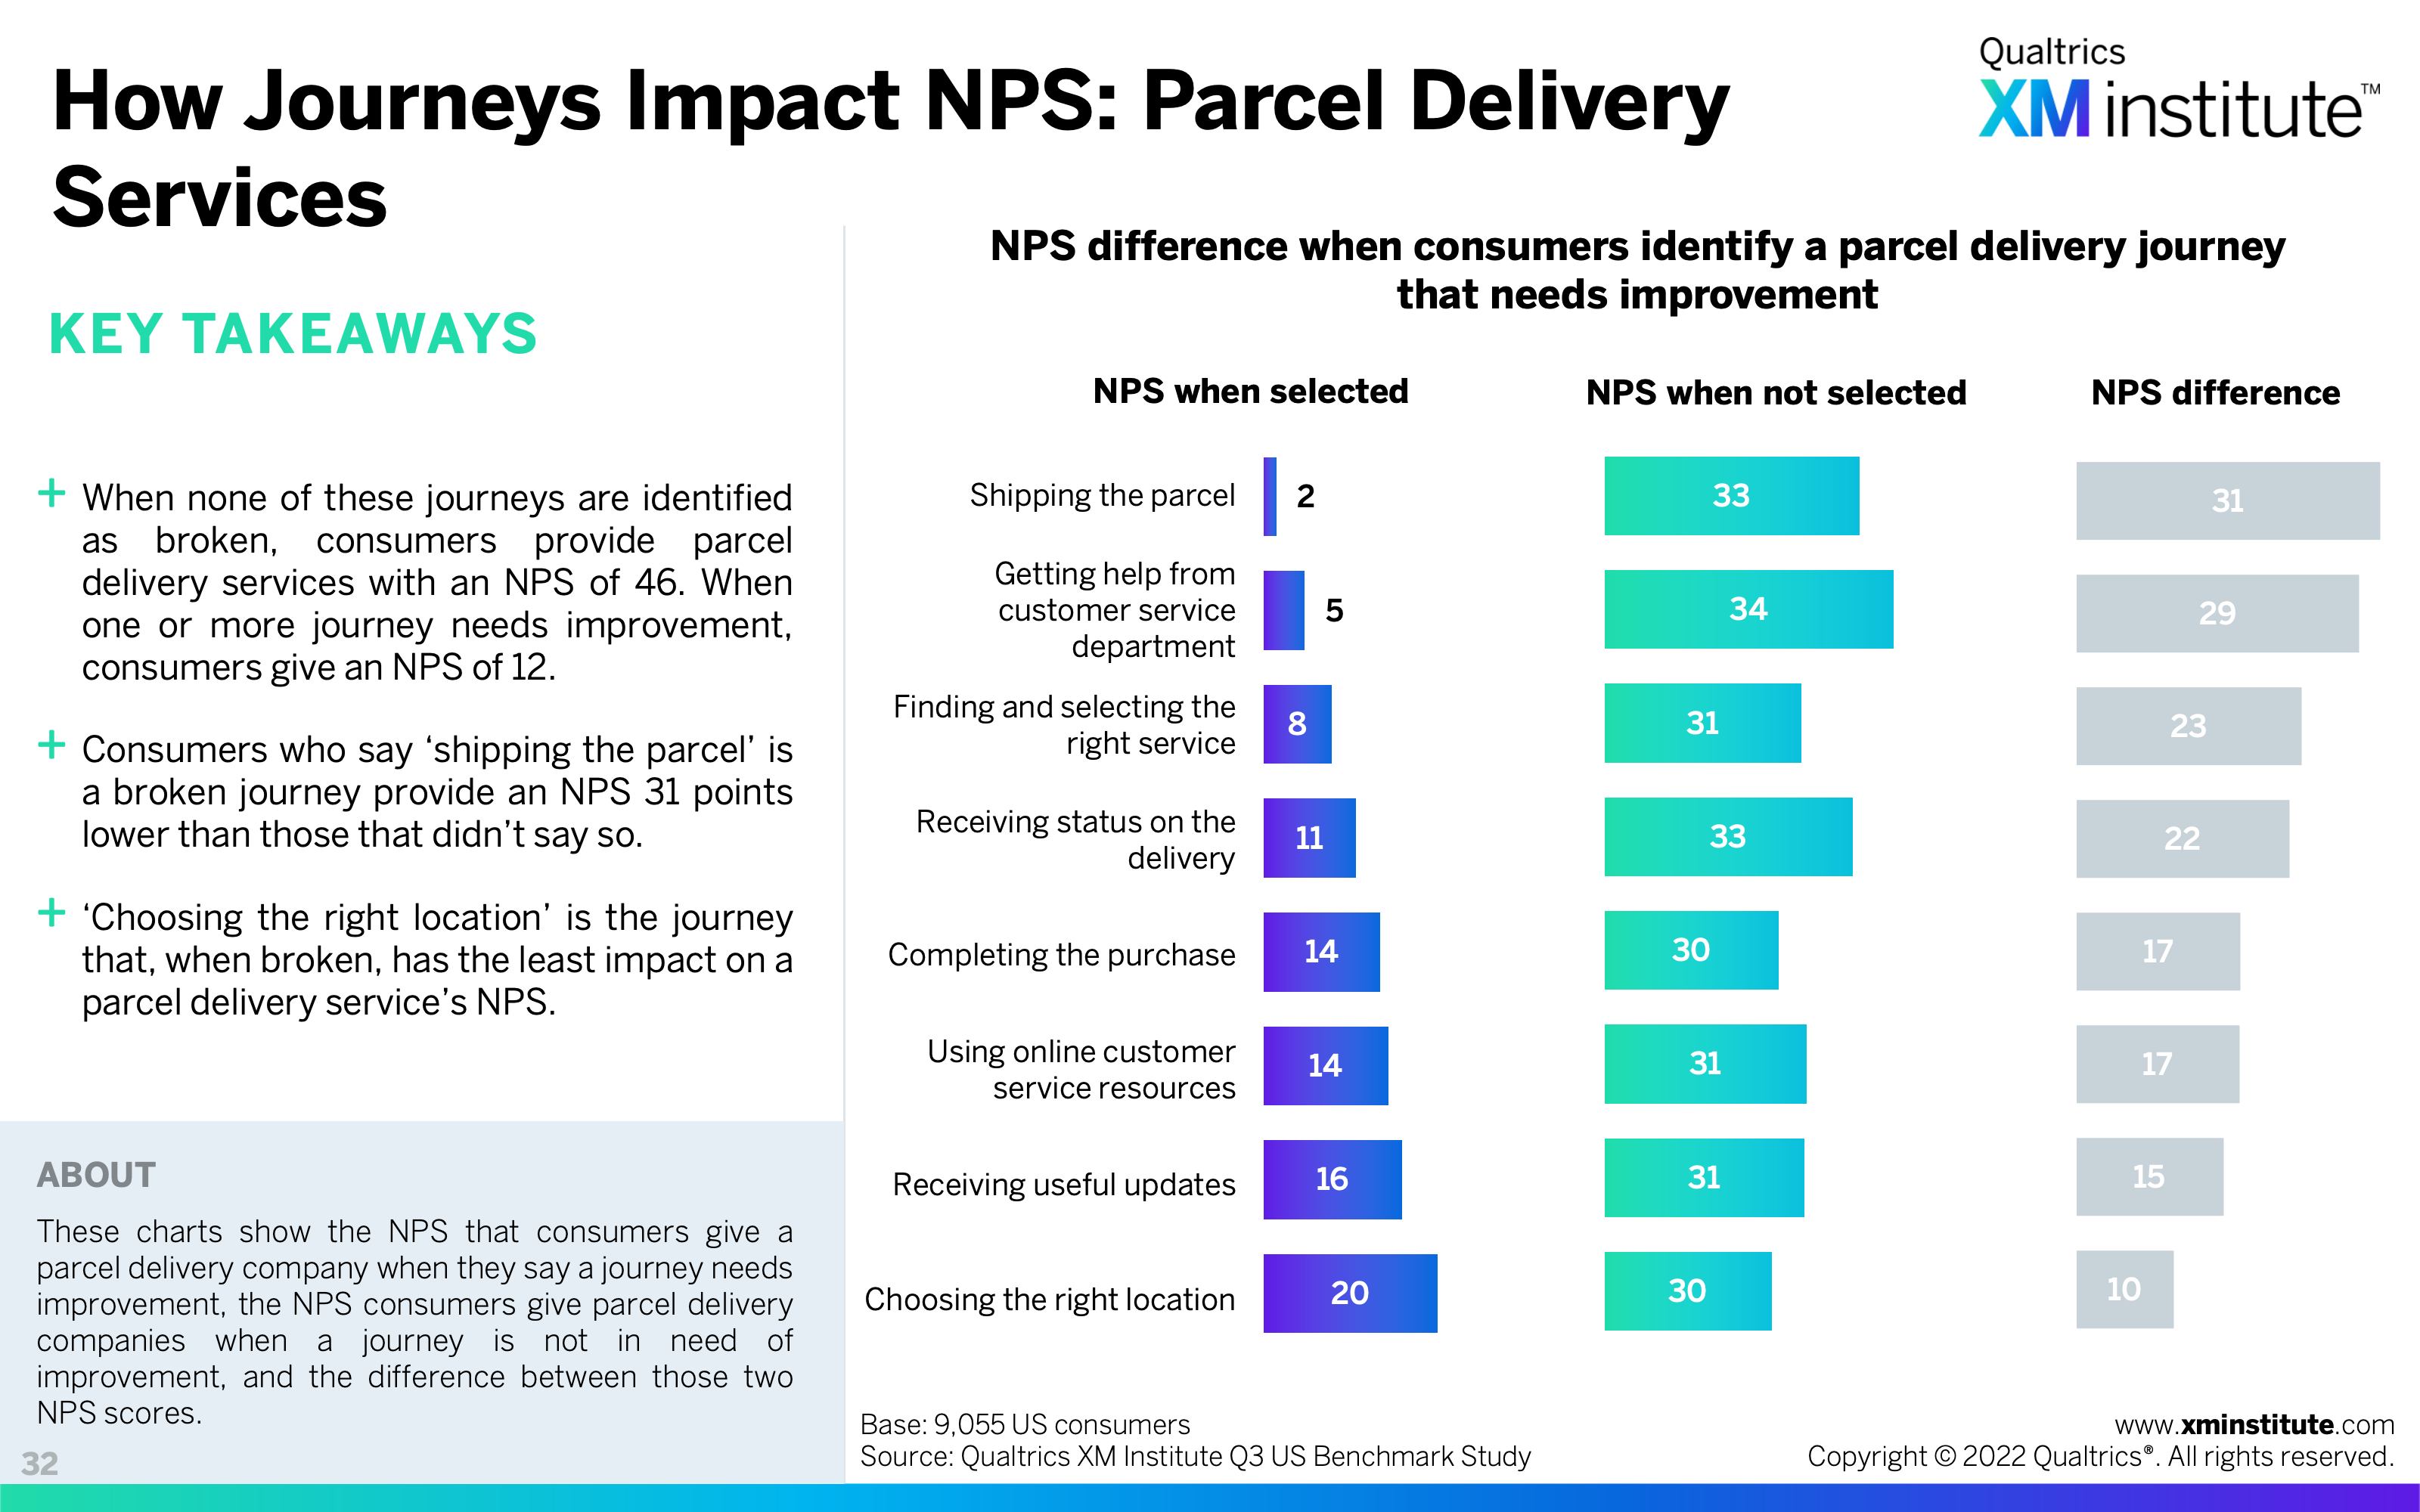
- Problematic Journeys: Parcel Delivery Services (see Figure 31)
- How Journeys Impact NPS: Parcel Delivery Services (see Figure 32)
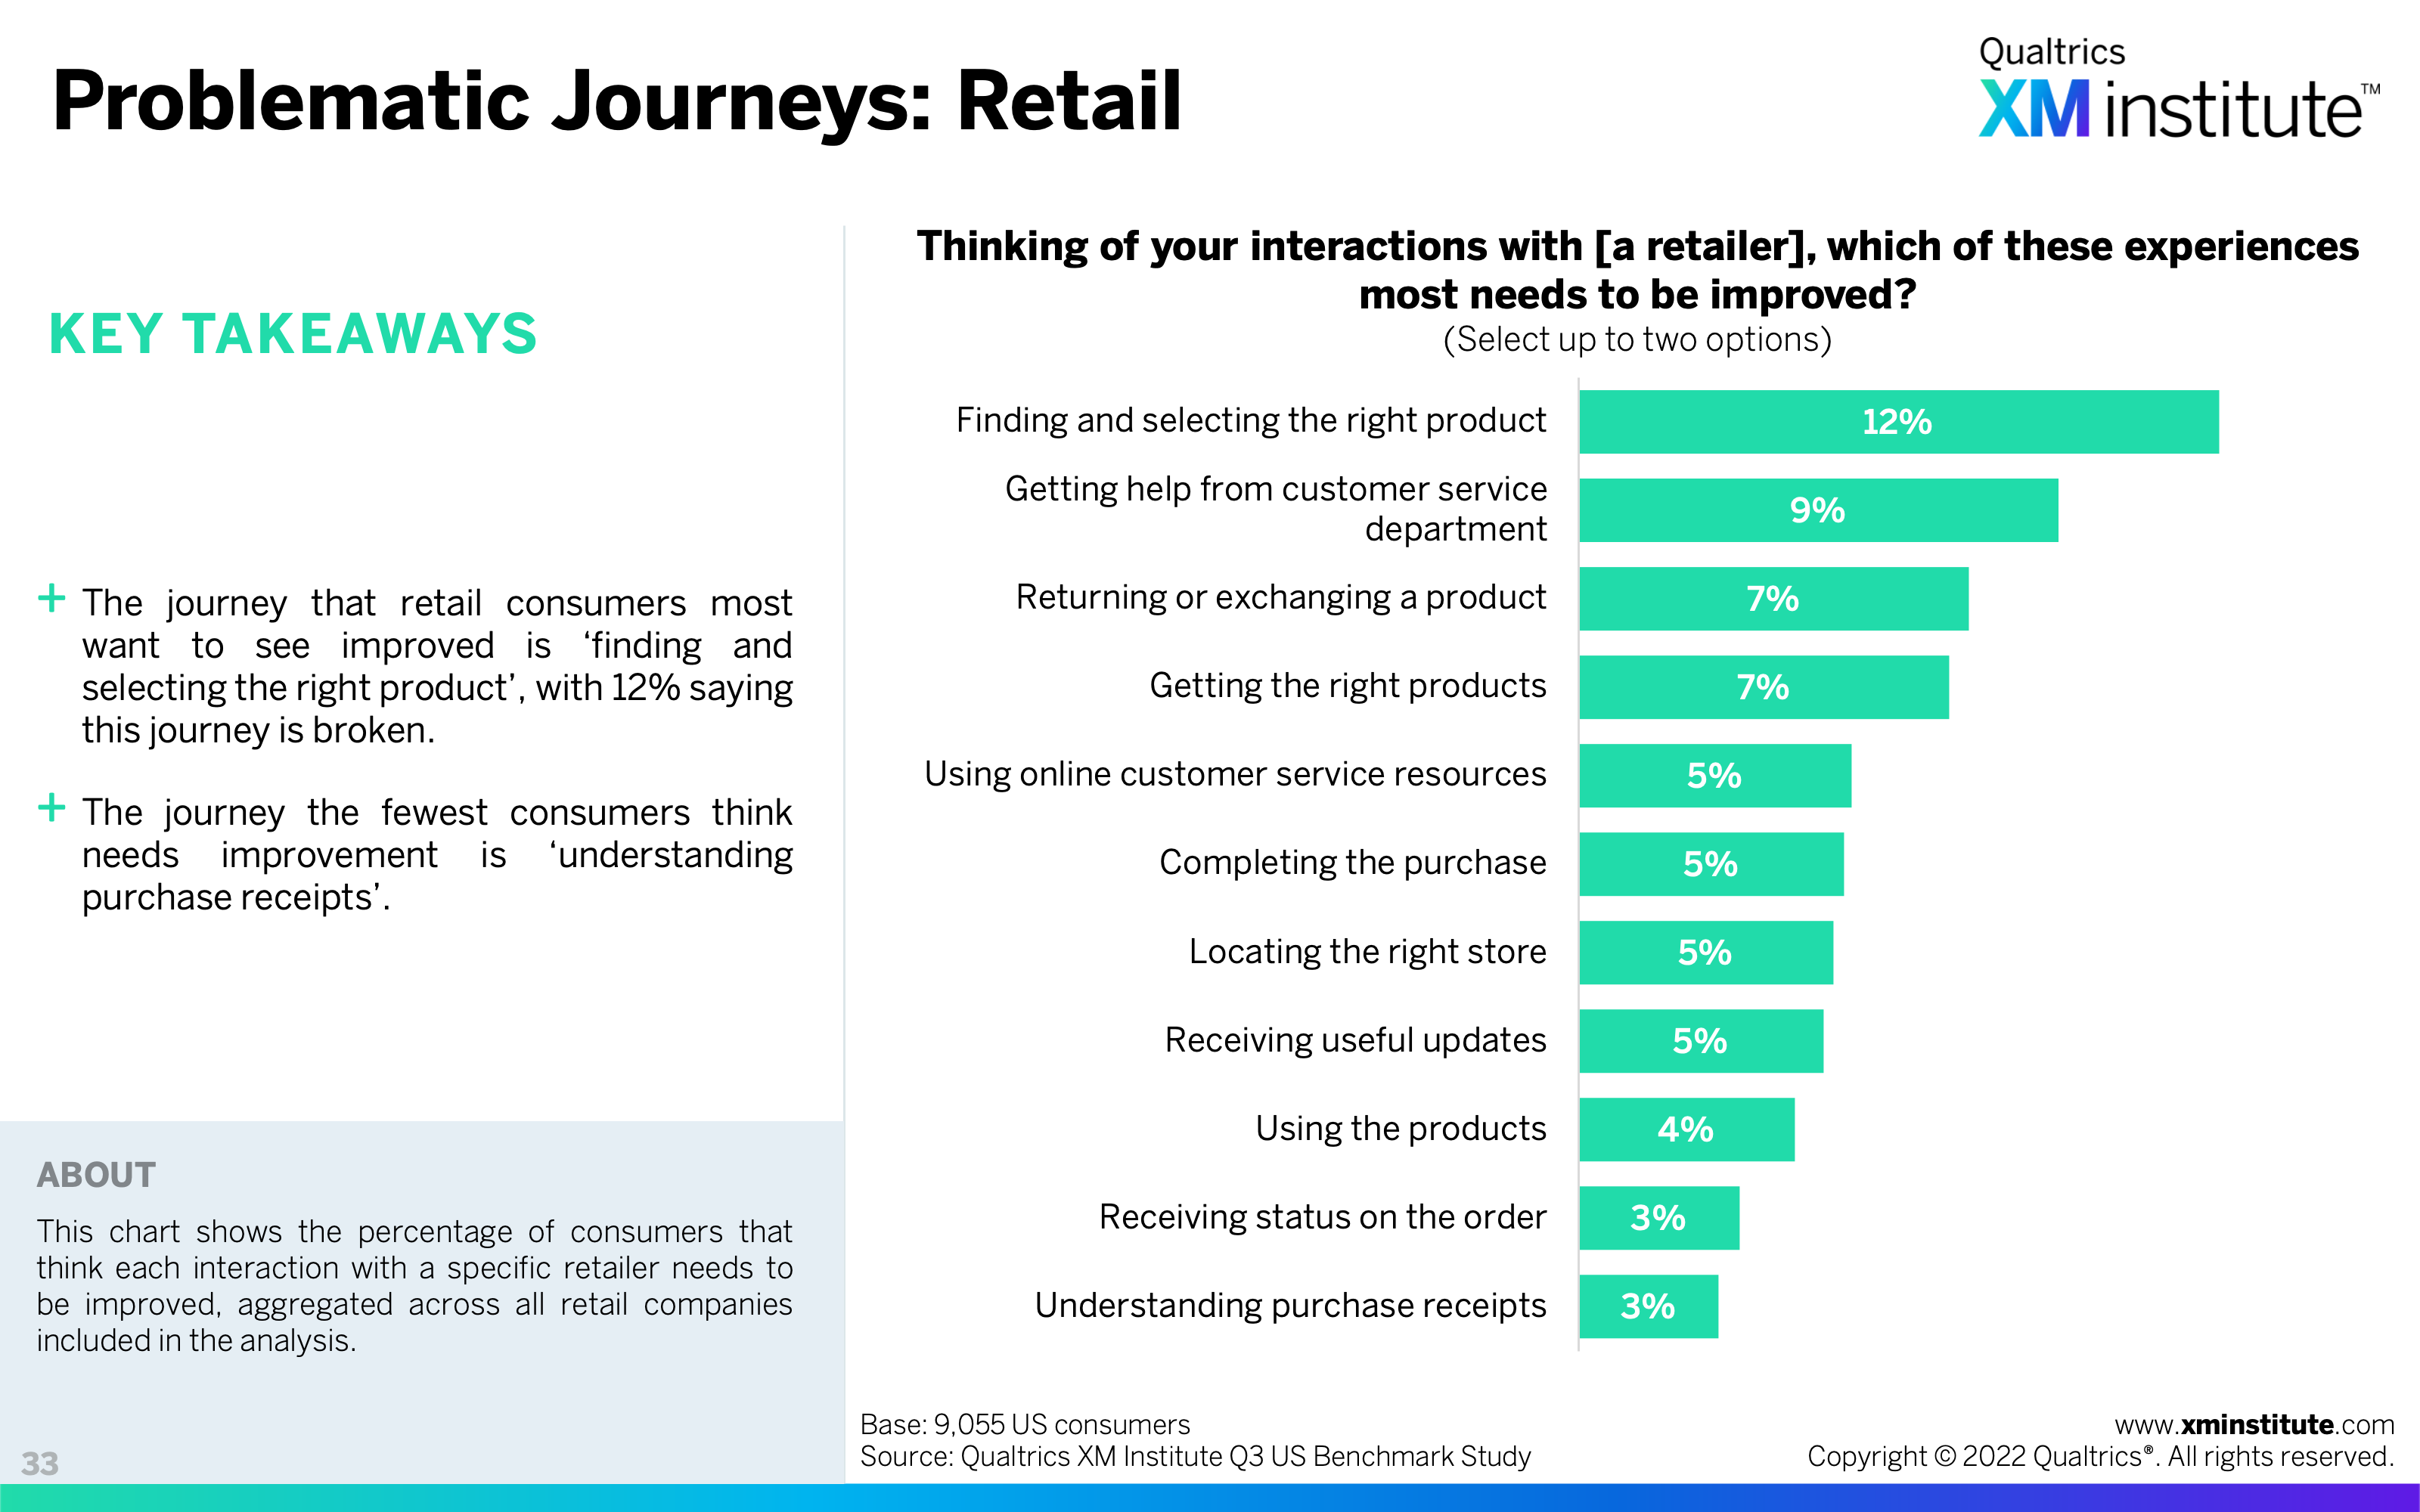
- Problematic Journeys: Retail (see Figure 33)
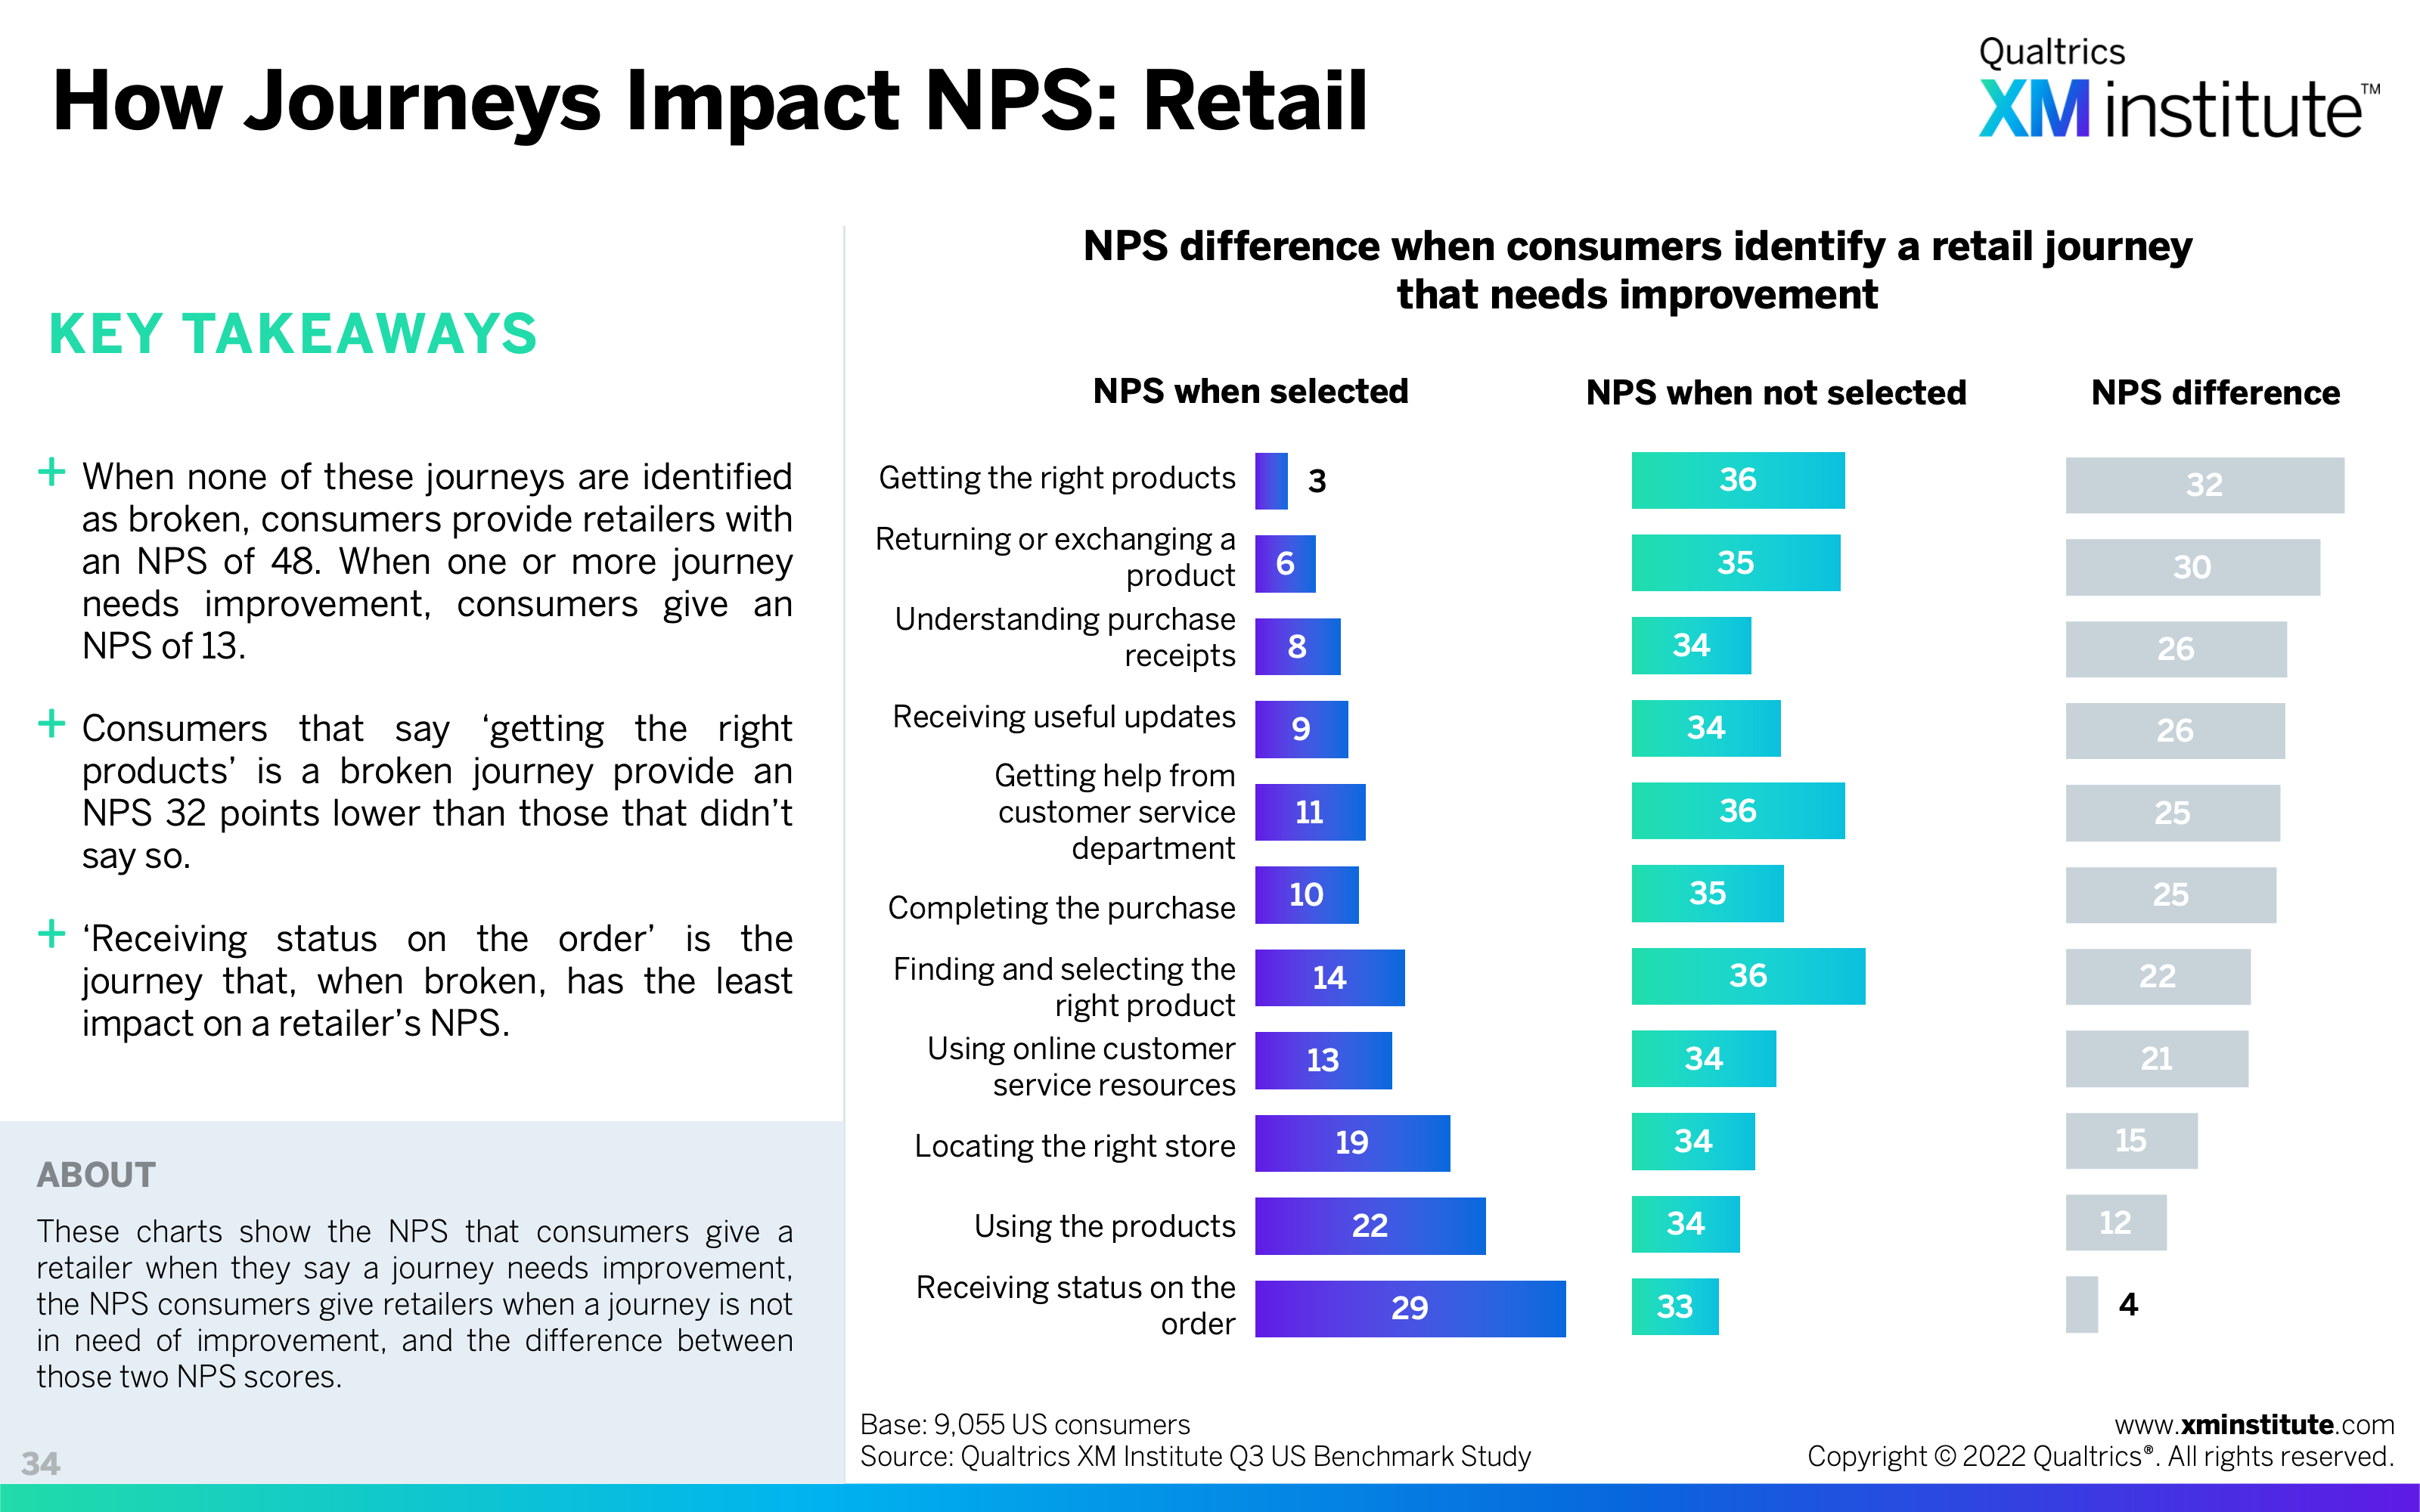
- How Journeys Impact NPS: Retail (see Figure 34)
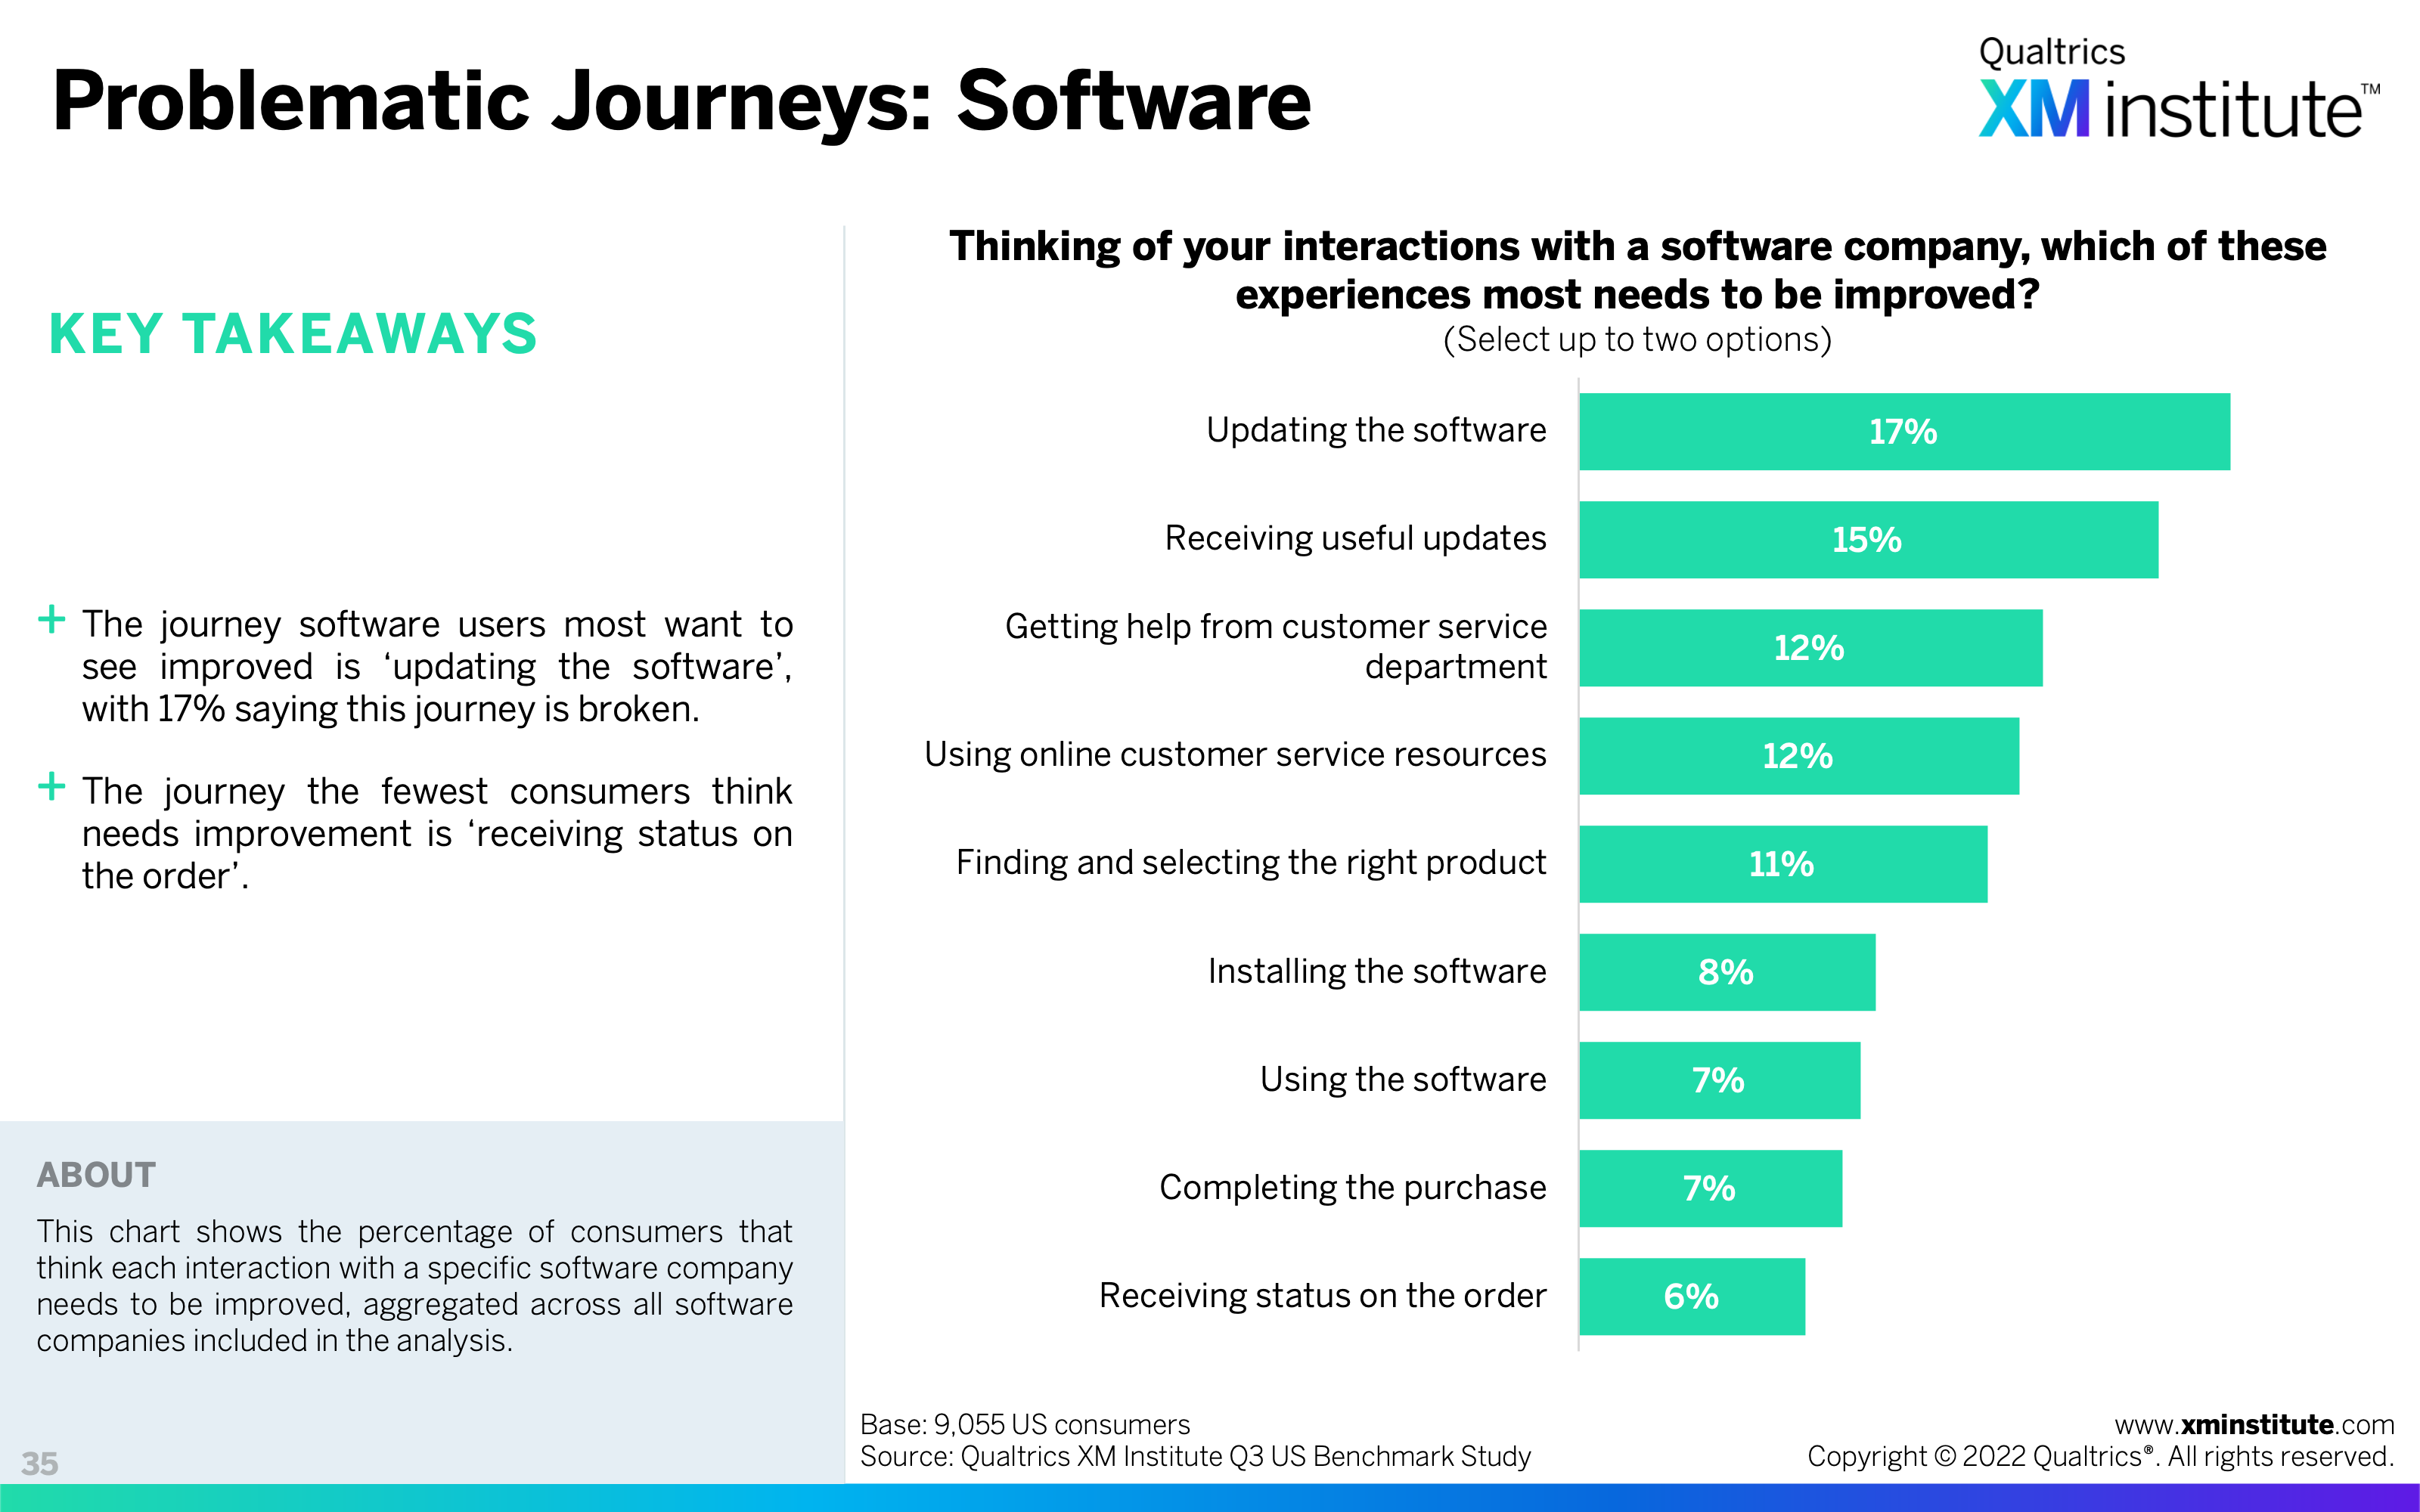
- Problematic Journeys: Software (see Figure 35)
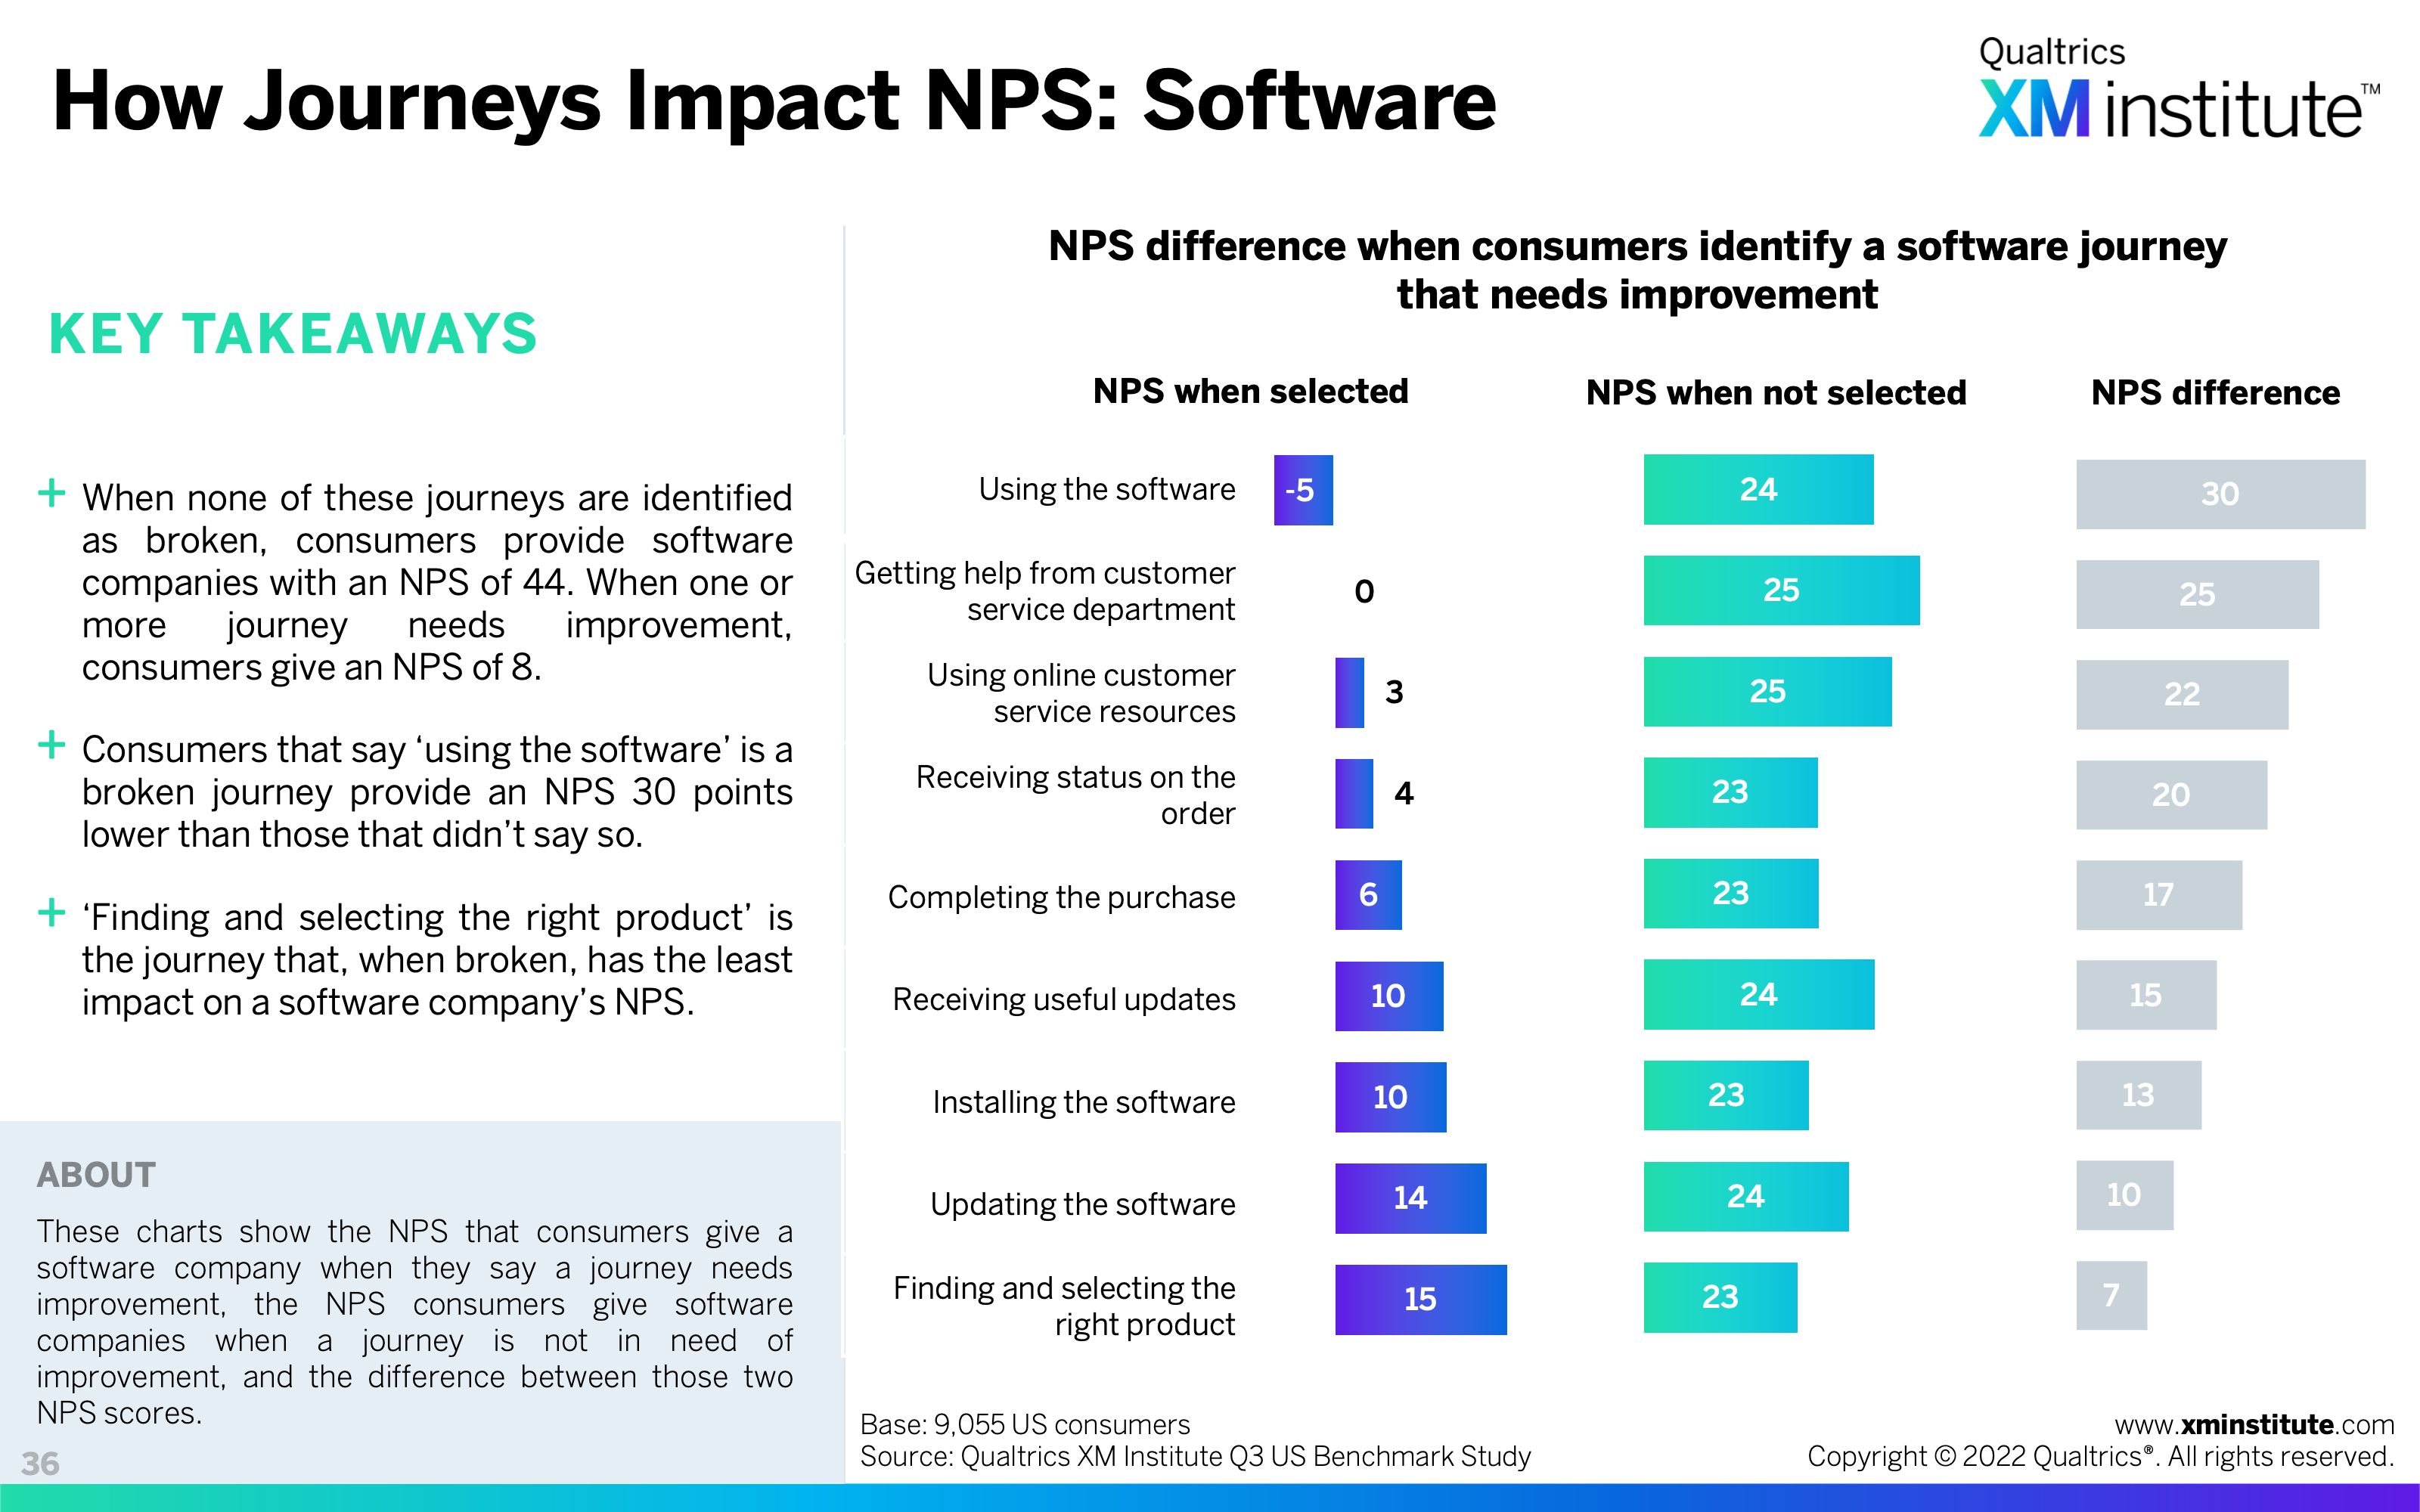
- How Journeys Impact NPS: Software (see Figure 36)
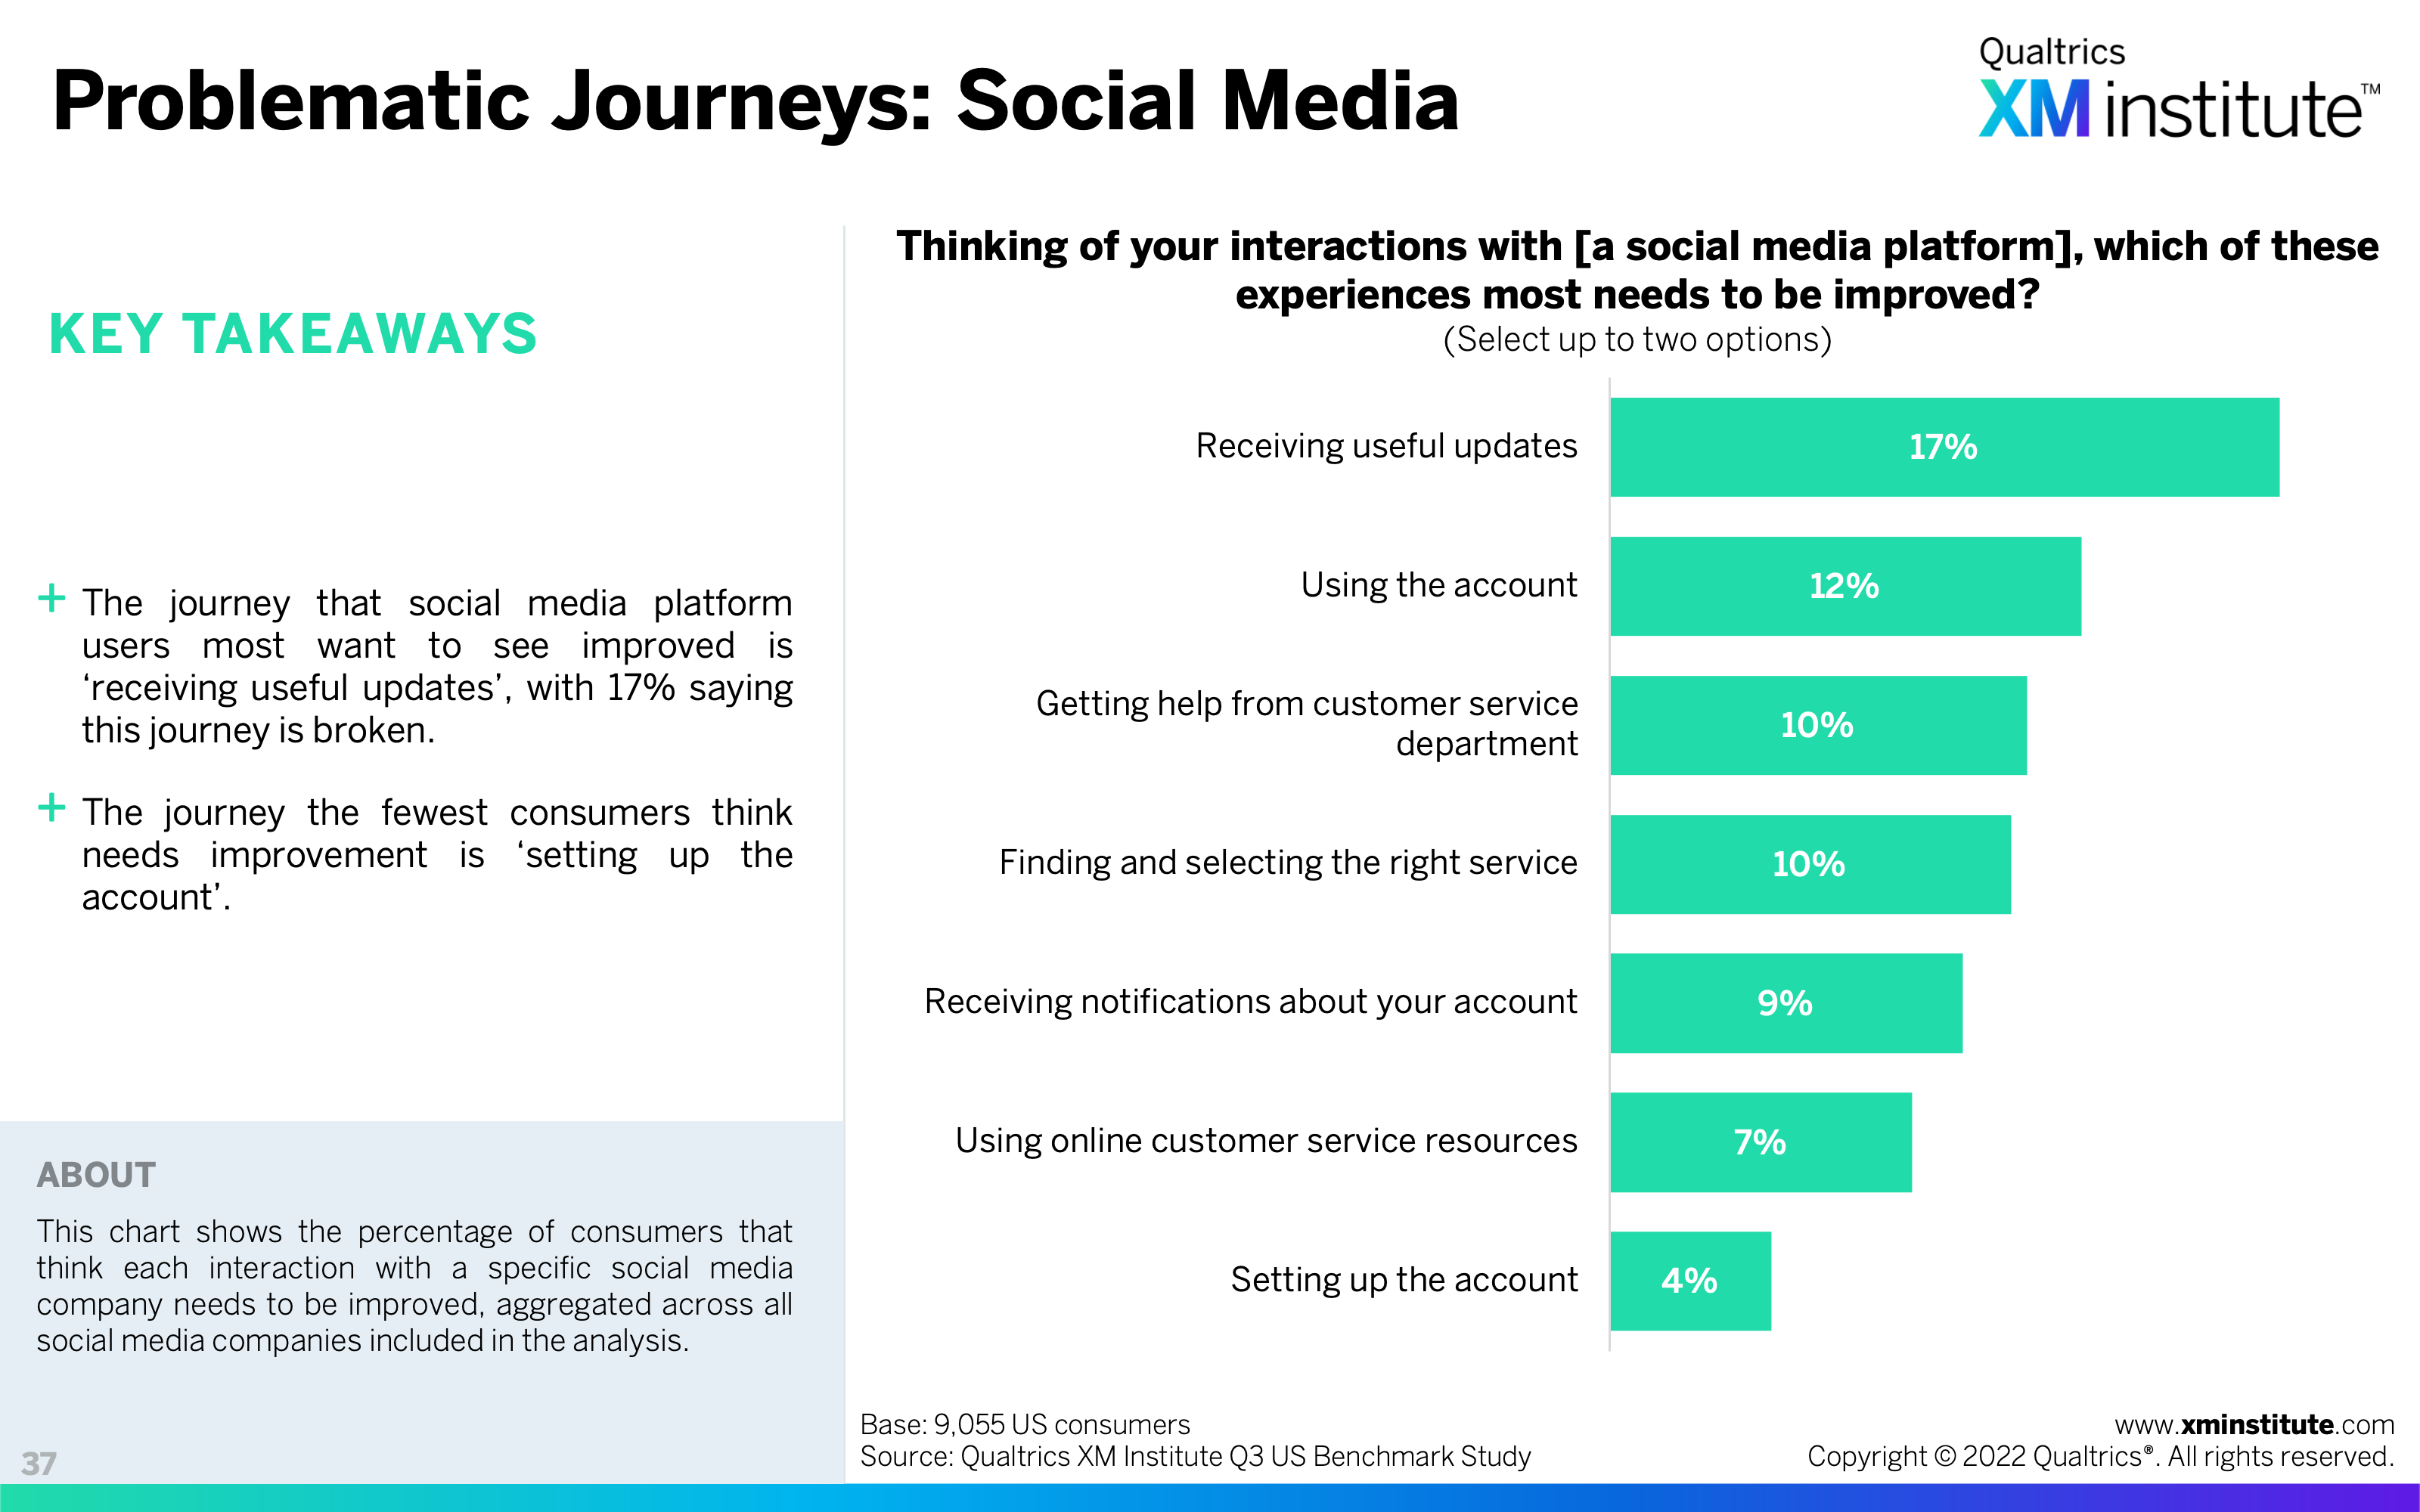
- Problematic Journeys: Social Media (see Figure 37)
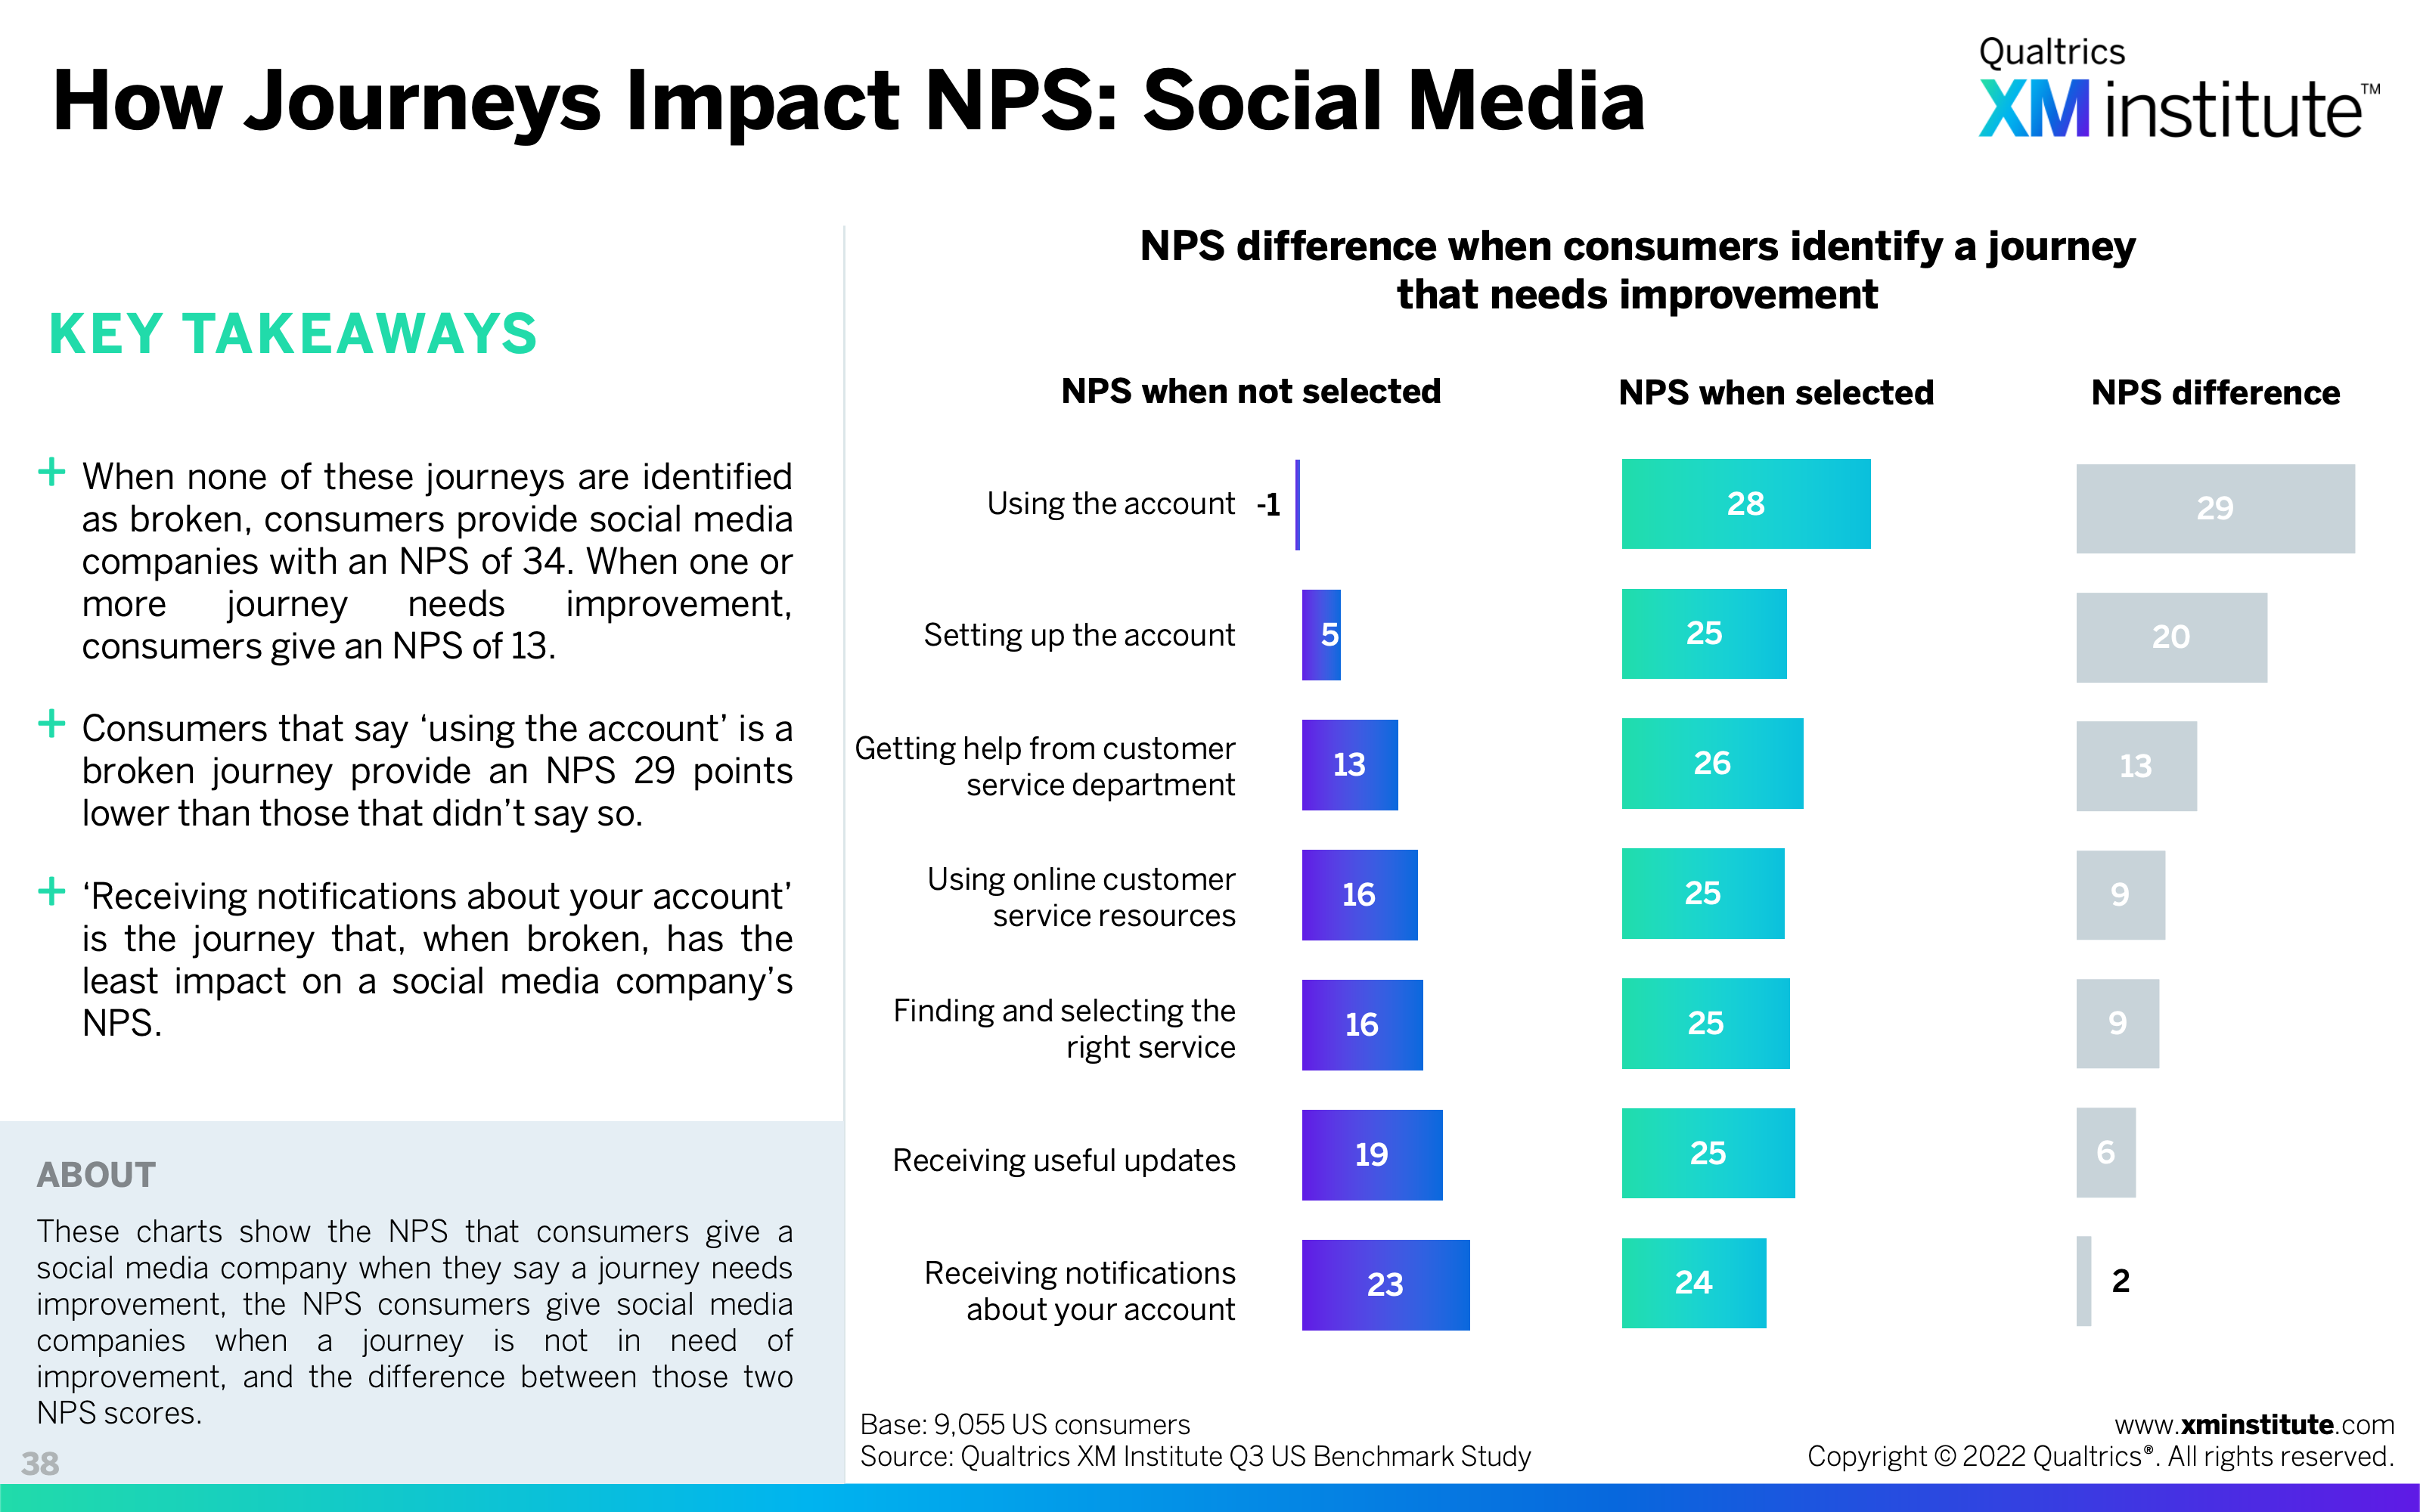
- How Journeys Impact NPS: Social Media (see Figure 38)
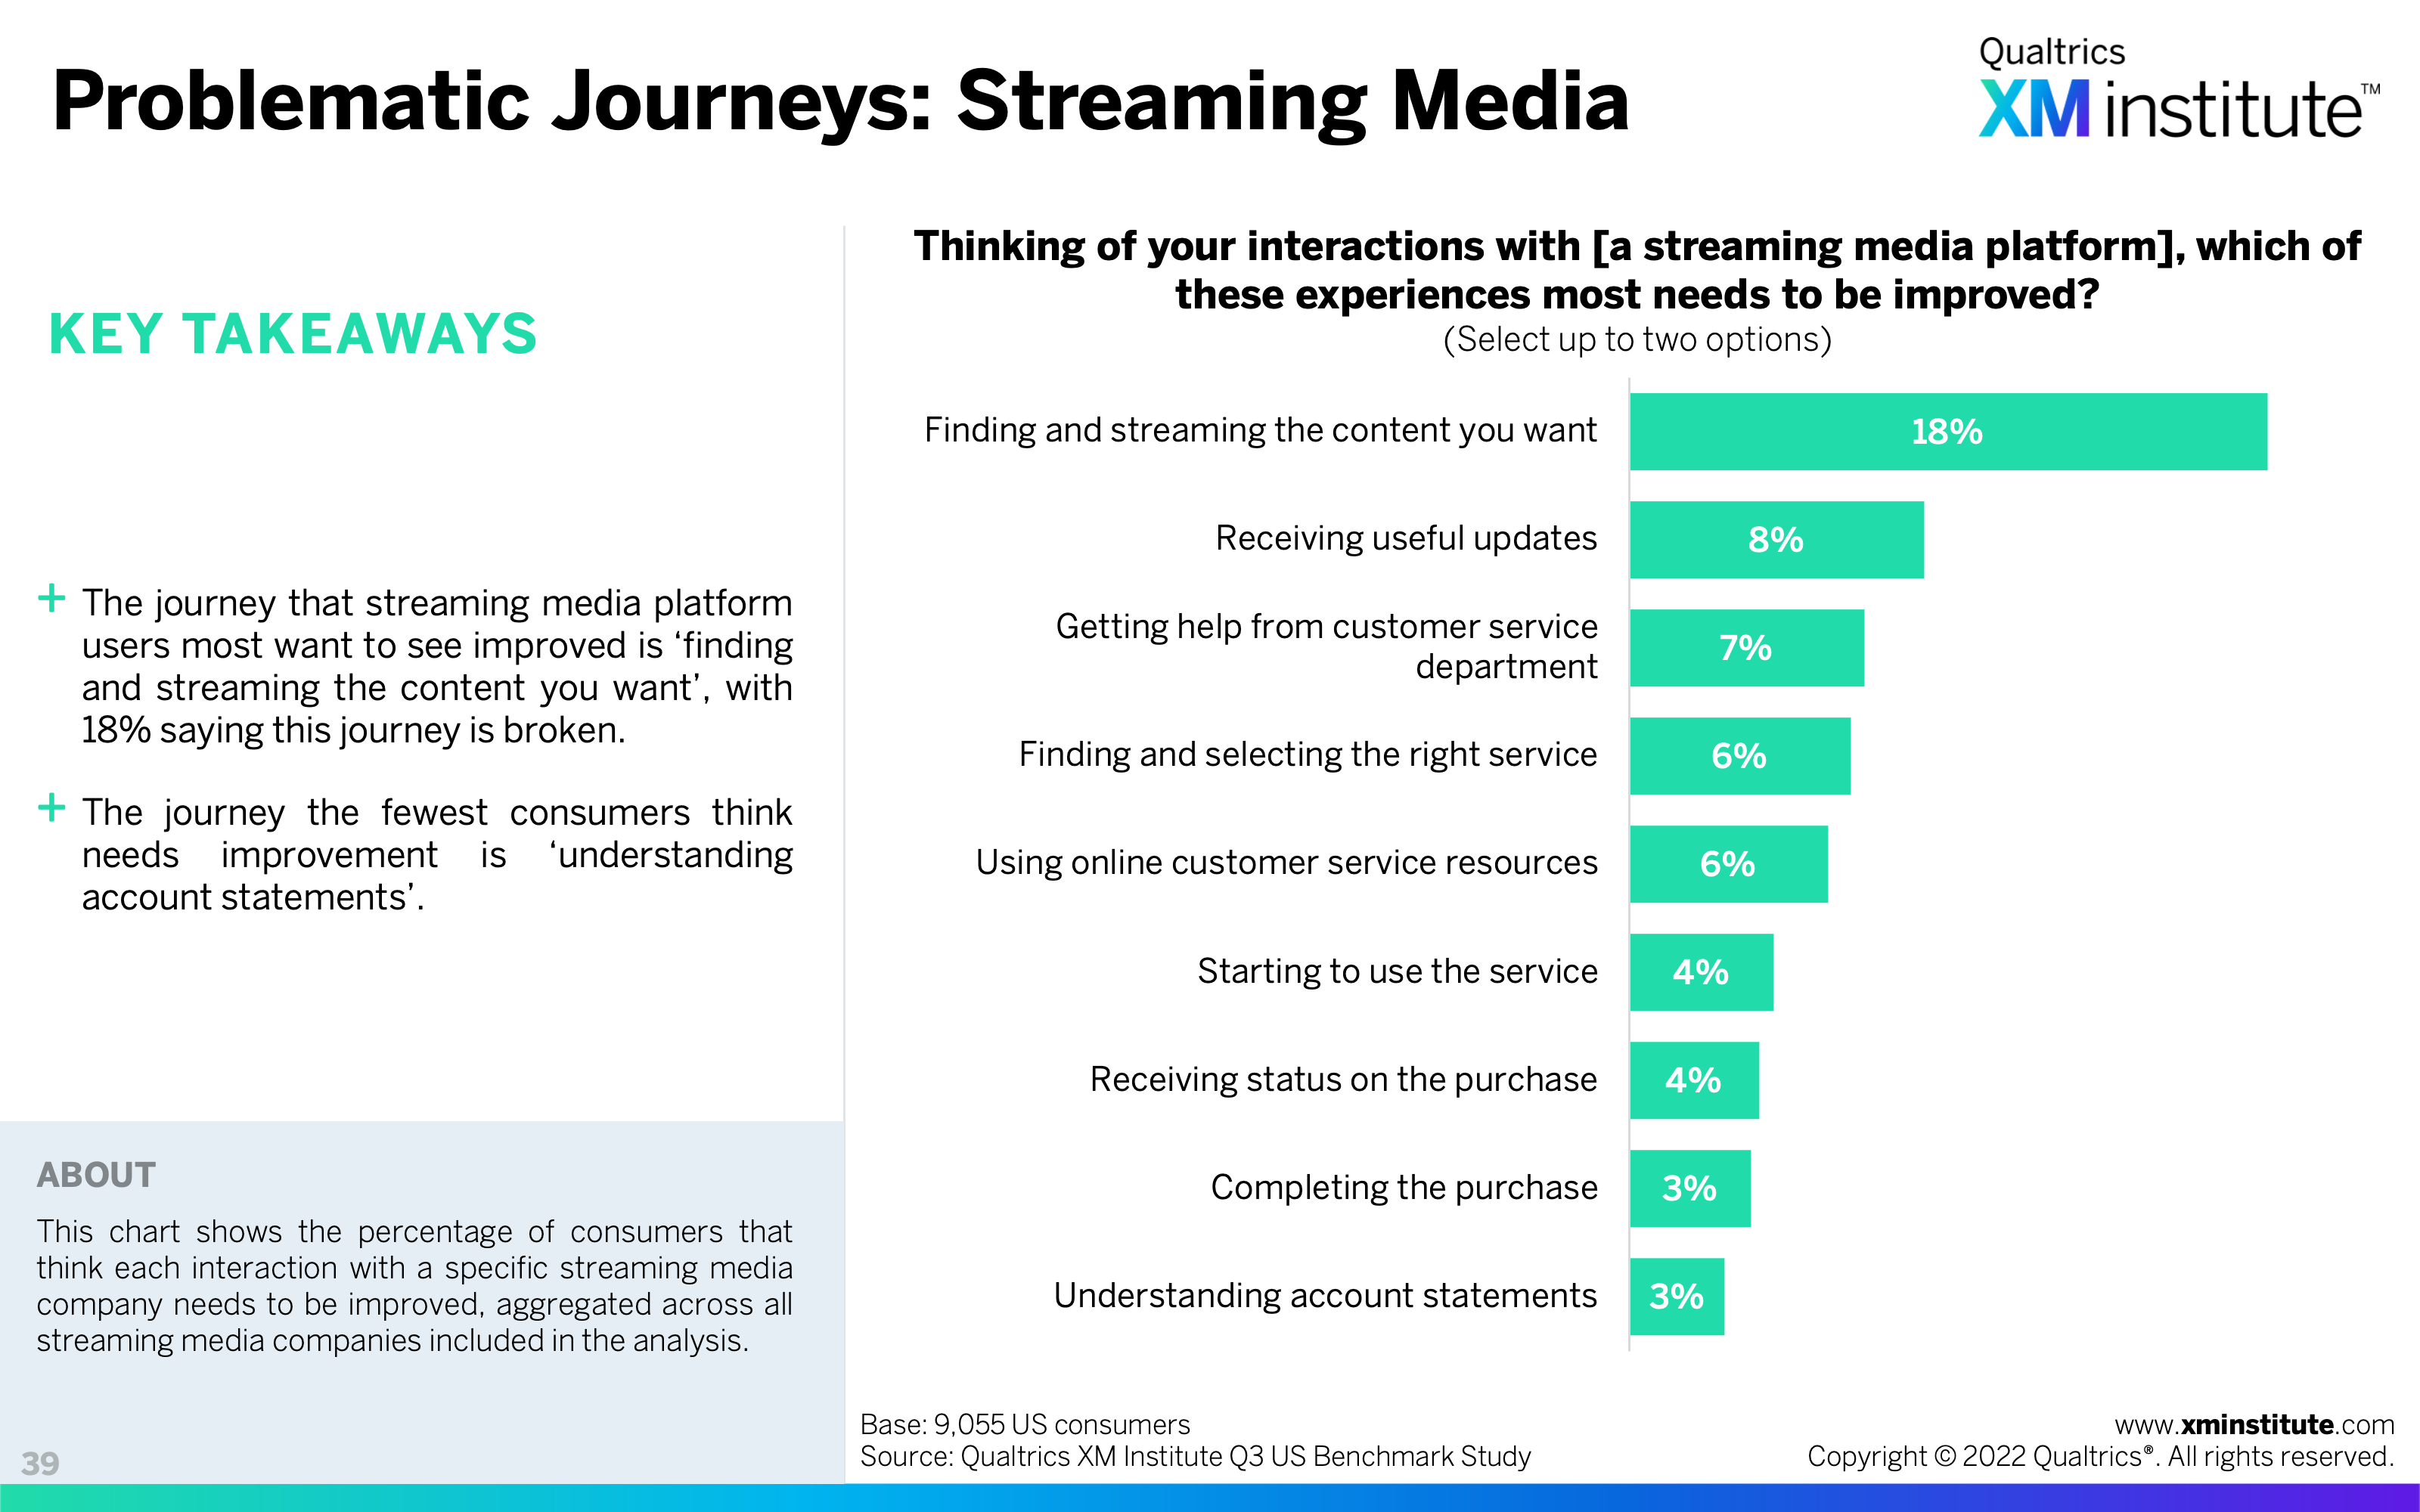
- Problematic Journeys: Streaming Media (see Figure 39)
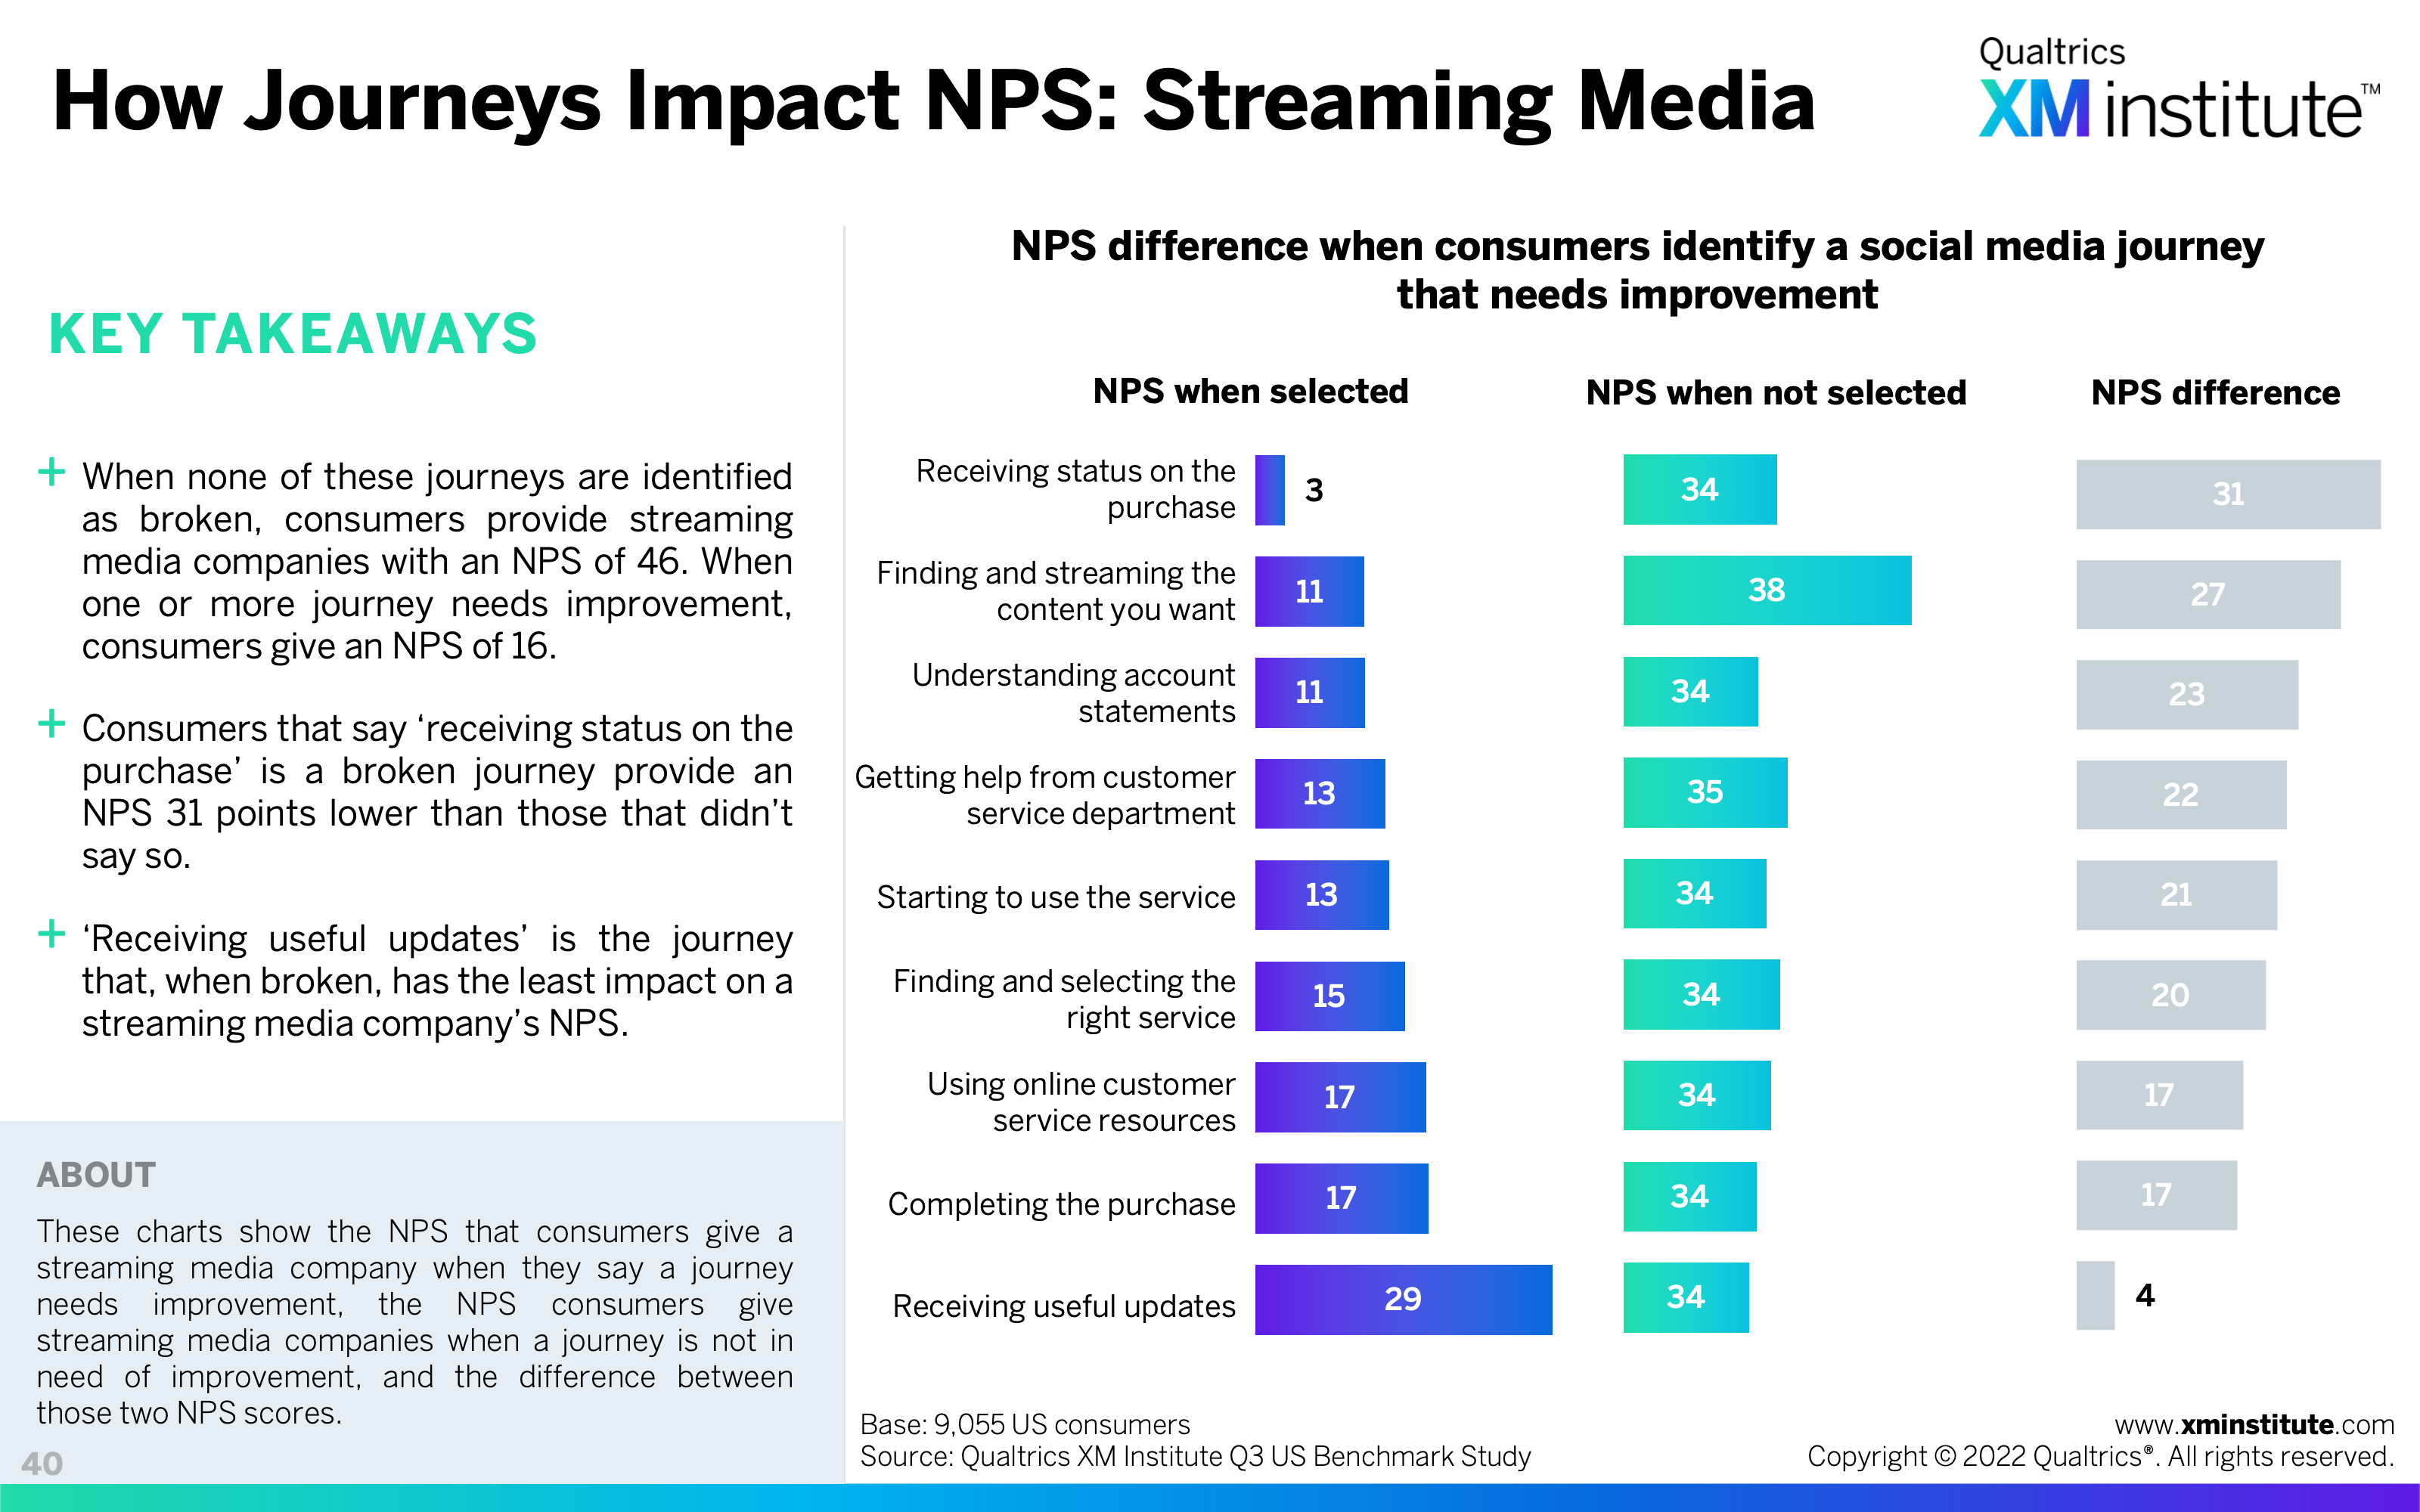
- How Journeys Impact NPS: Streaming Media (see Figure 40)
- Problematic Journeys: TV/Internet Service Provider (see Figure 41)
- How Journeys Impact NPS: TV/Internet Service Provider (see Figure 42)
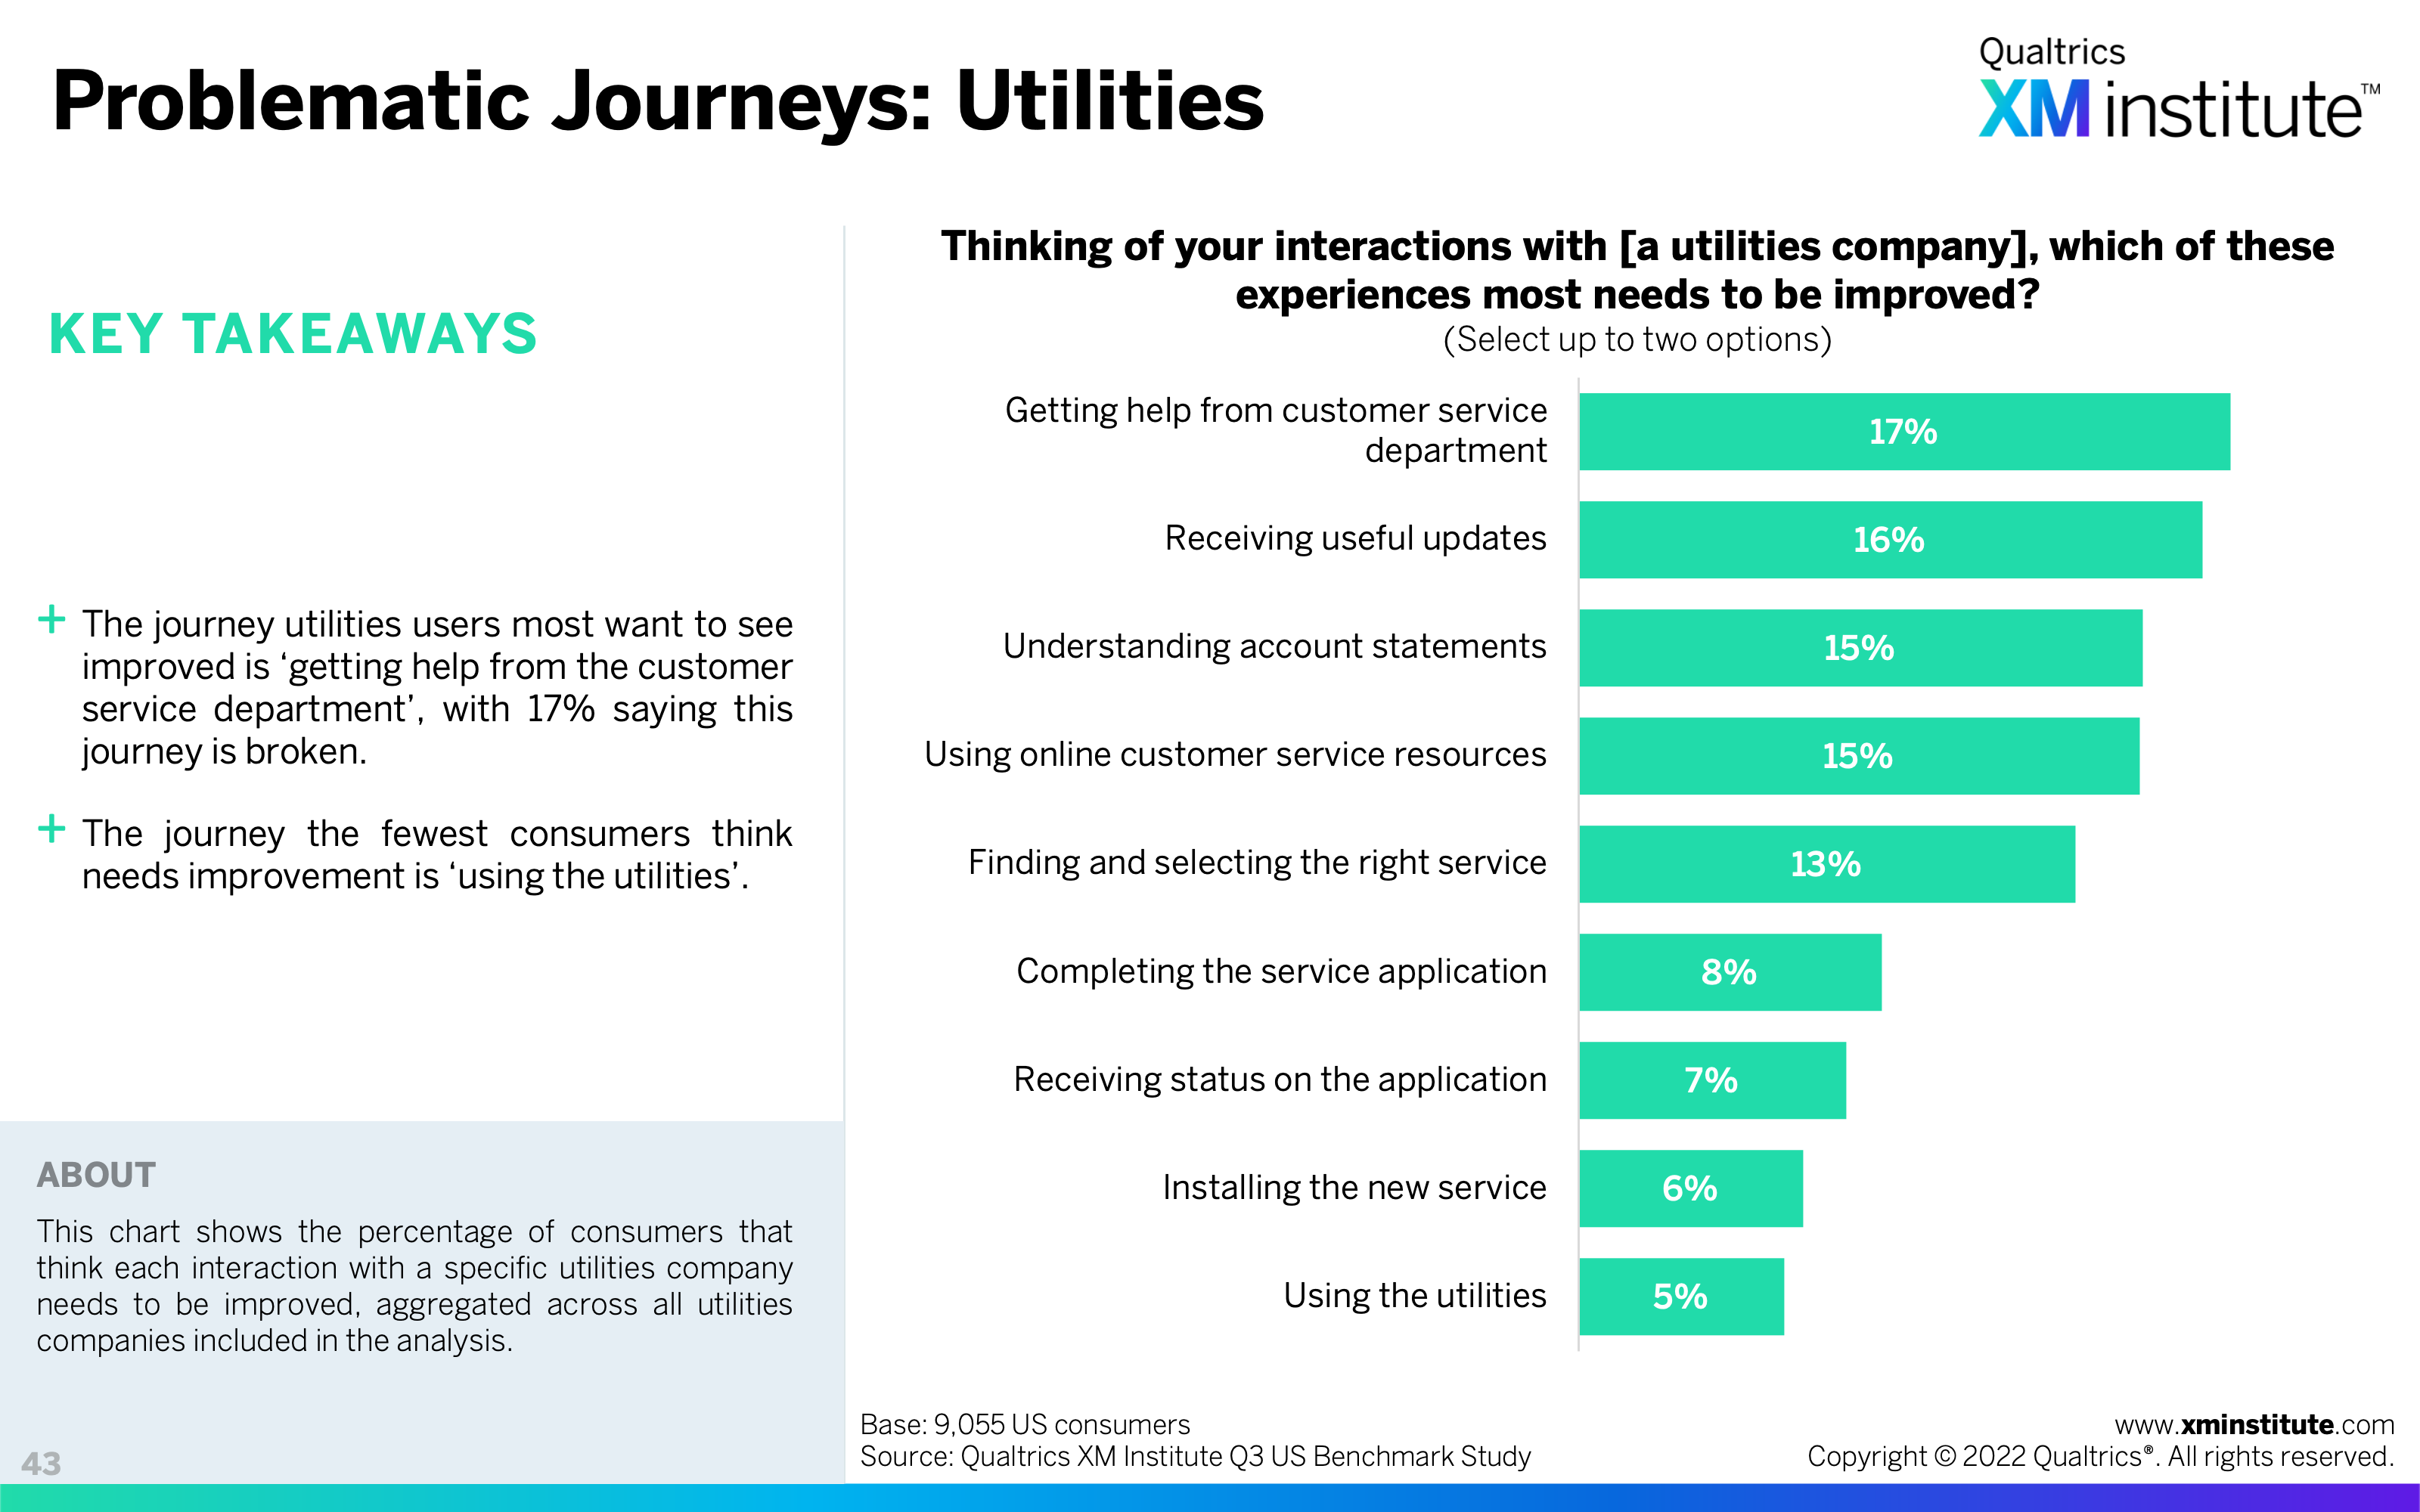
- Problematic Journeys: Utilities (see Figure 43)
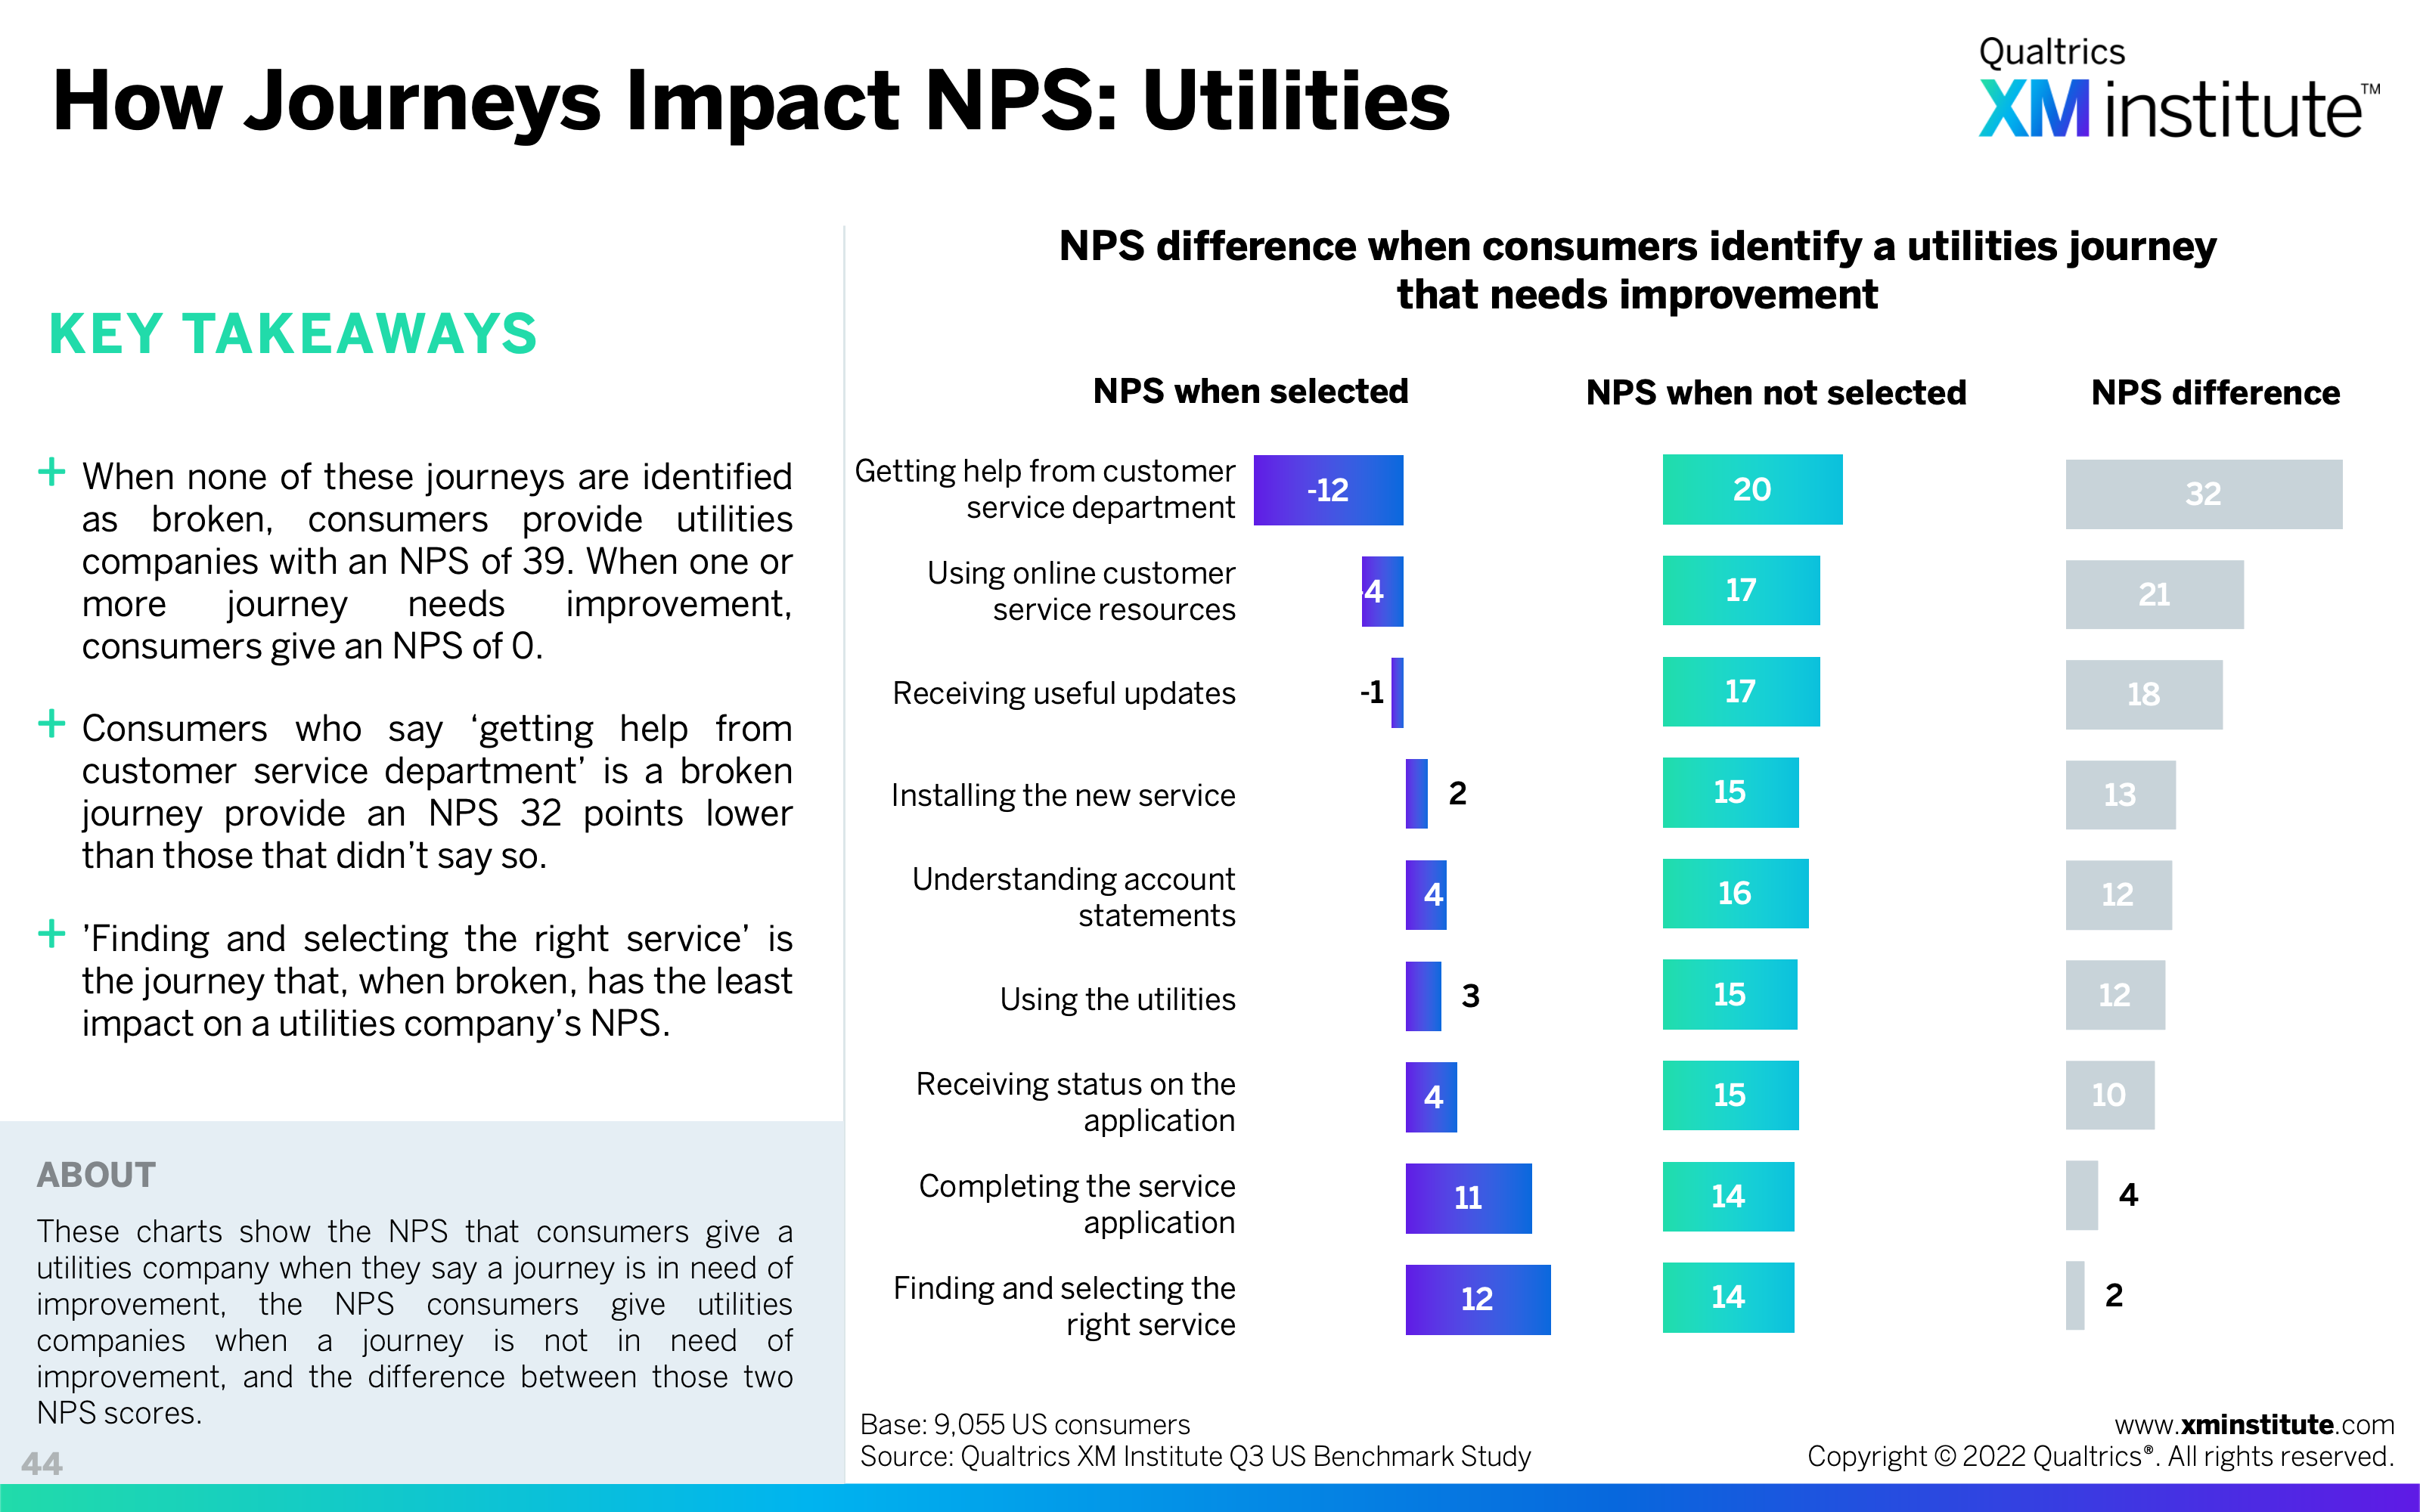
- How Journeys Impact NPS: Utilities (see Figure 44)
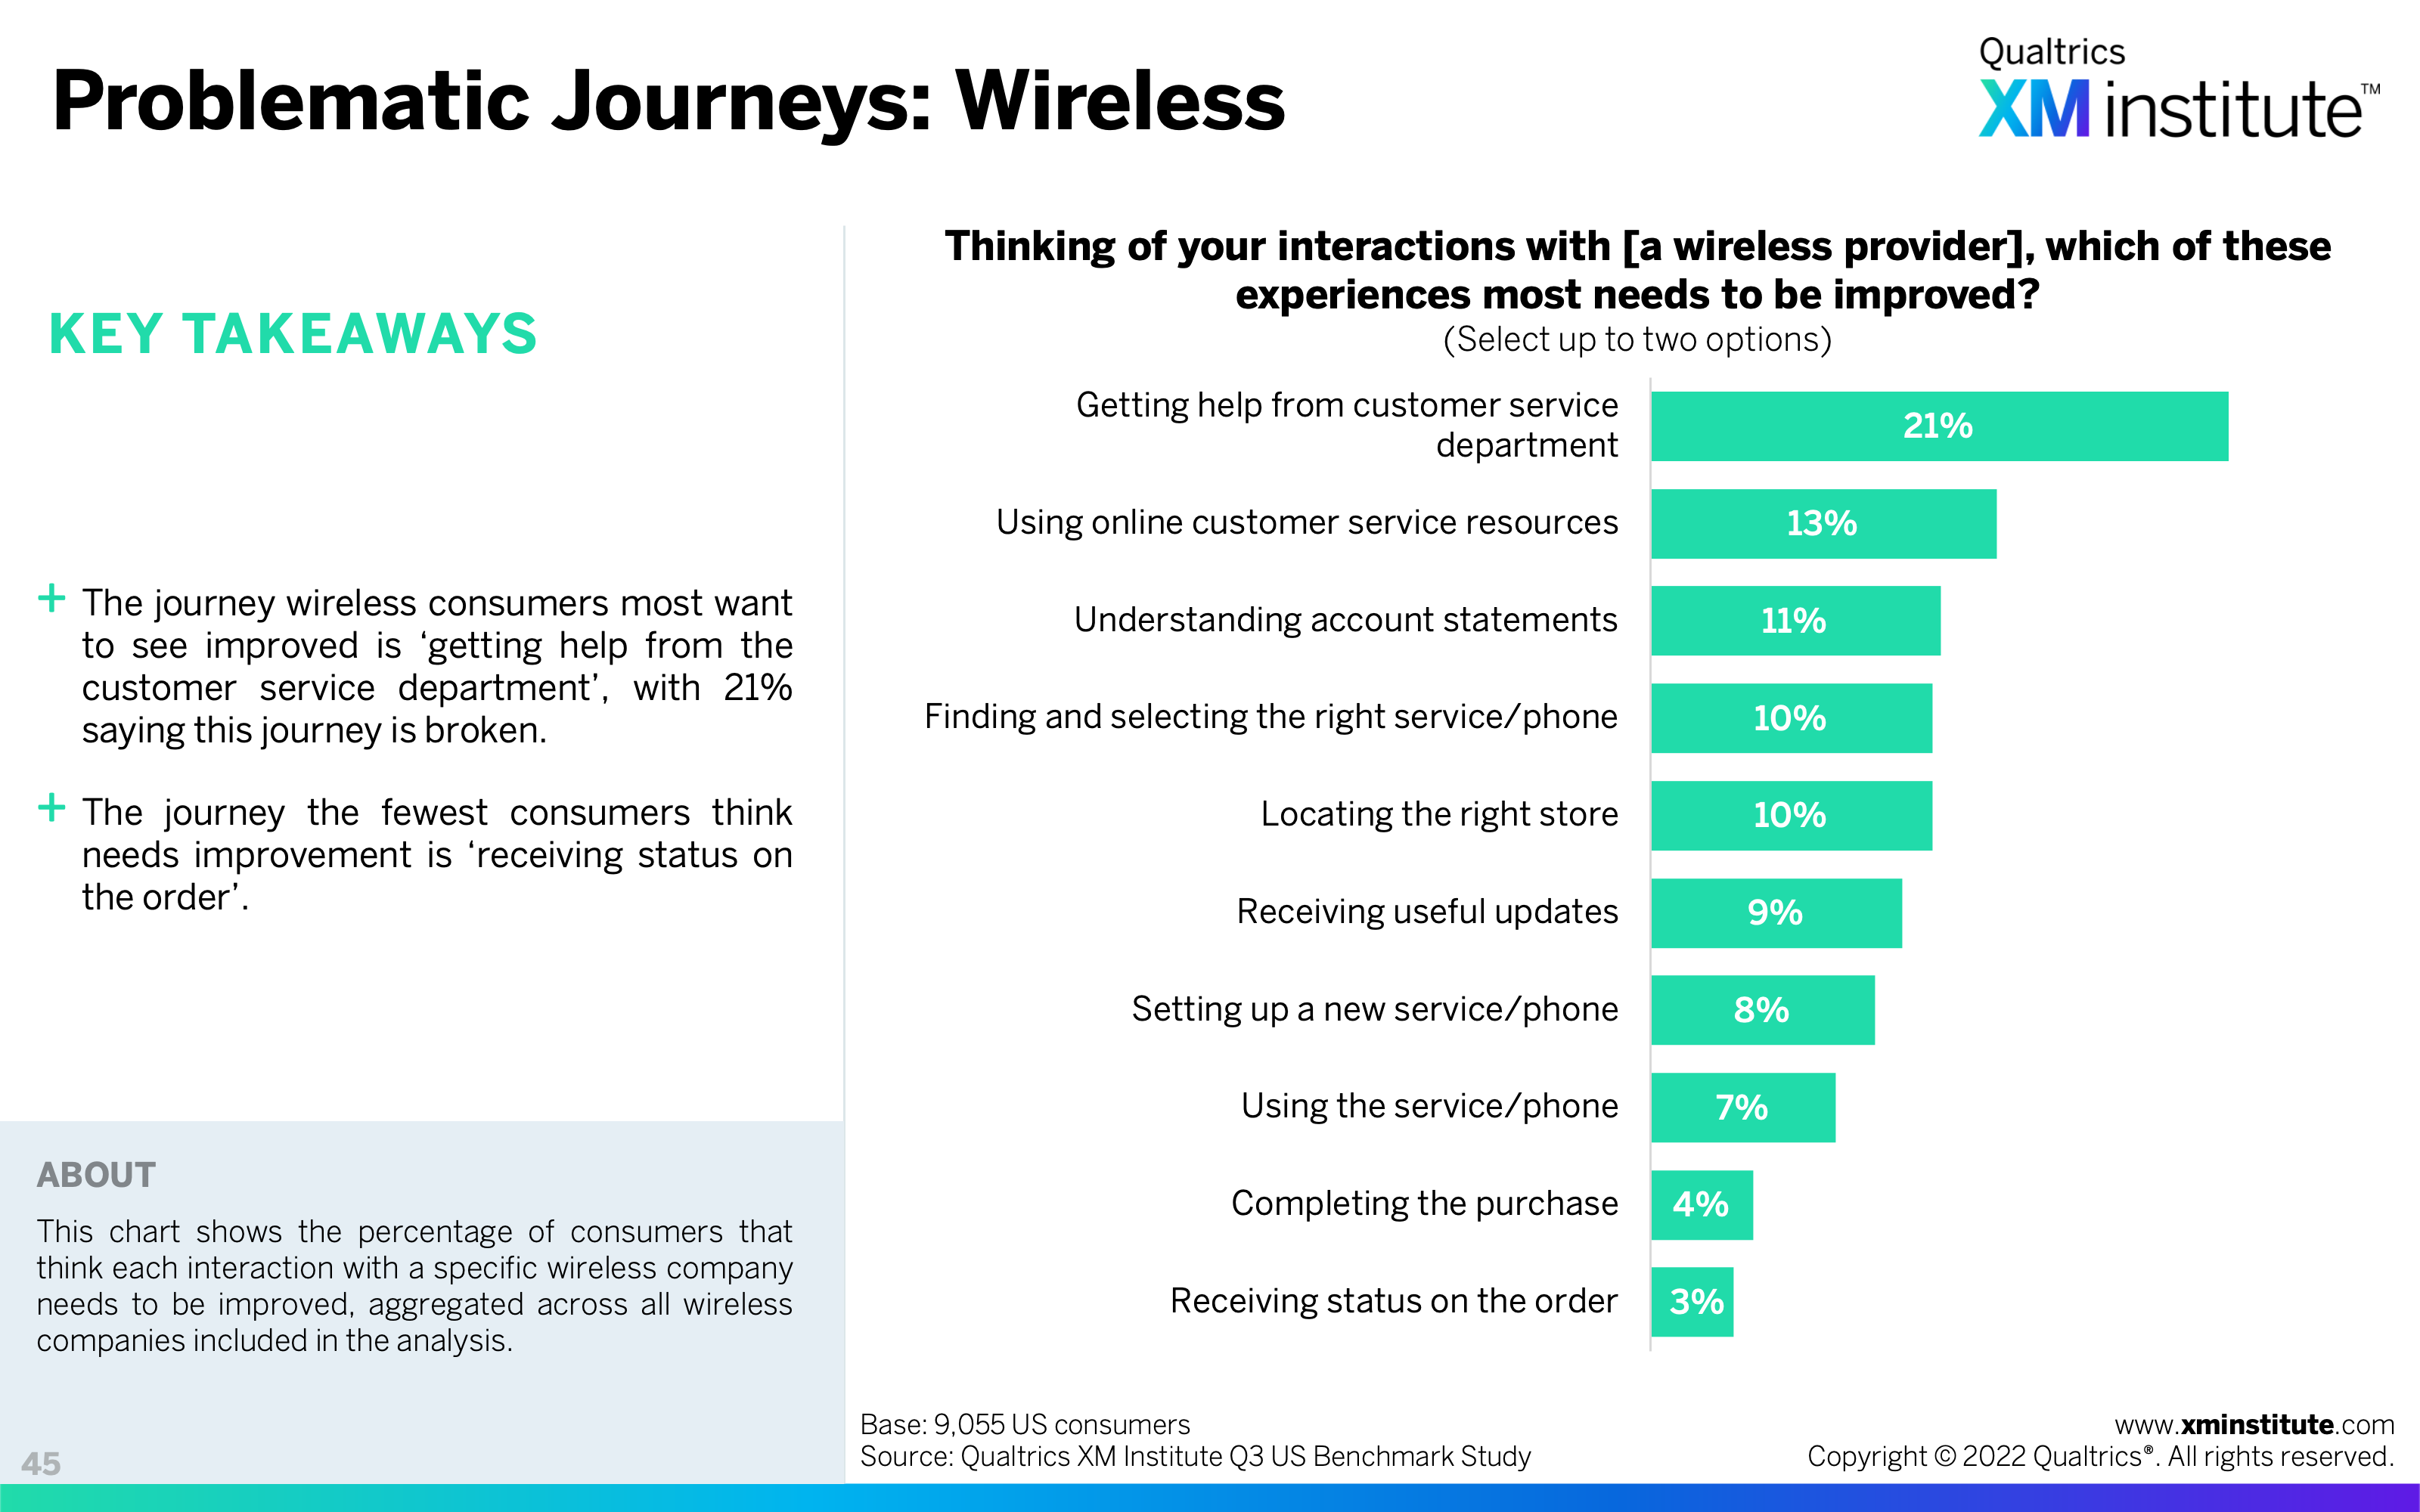
- Problematic Journeys: Wireless (see Figure 45)
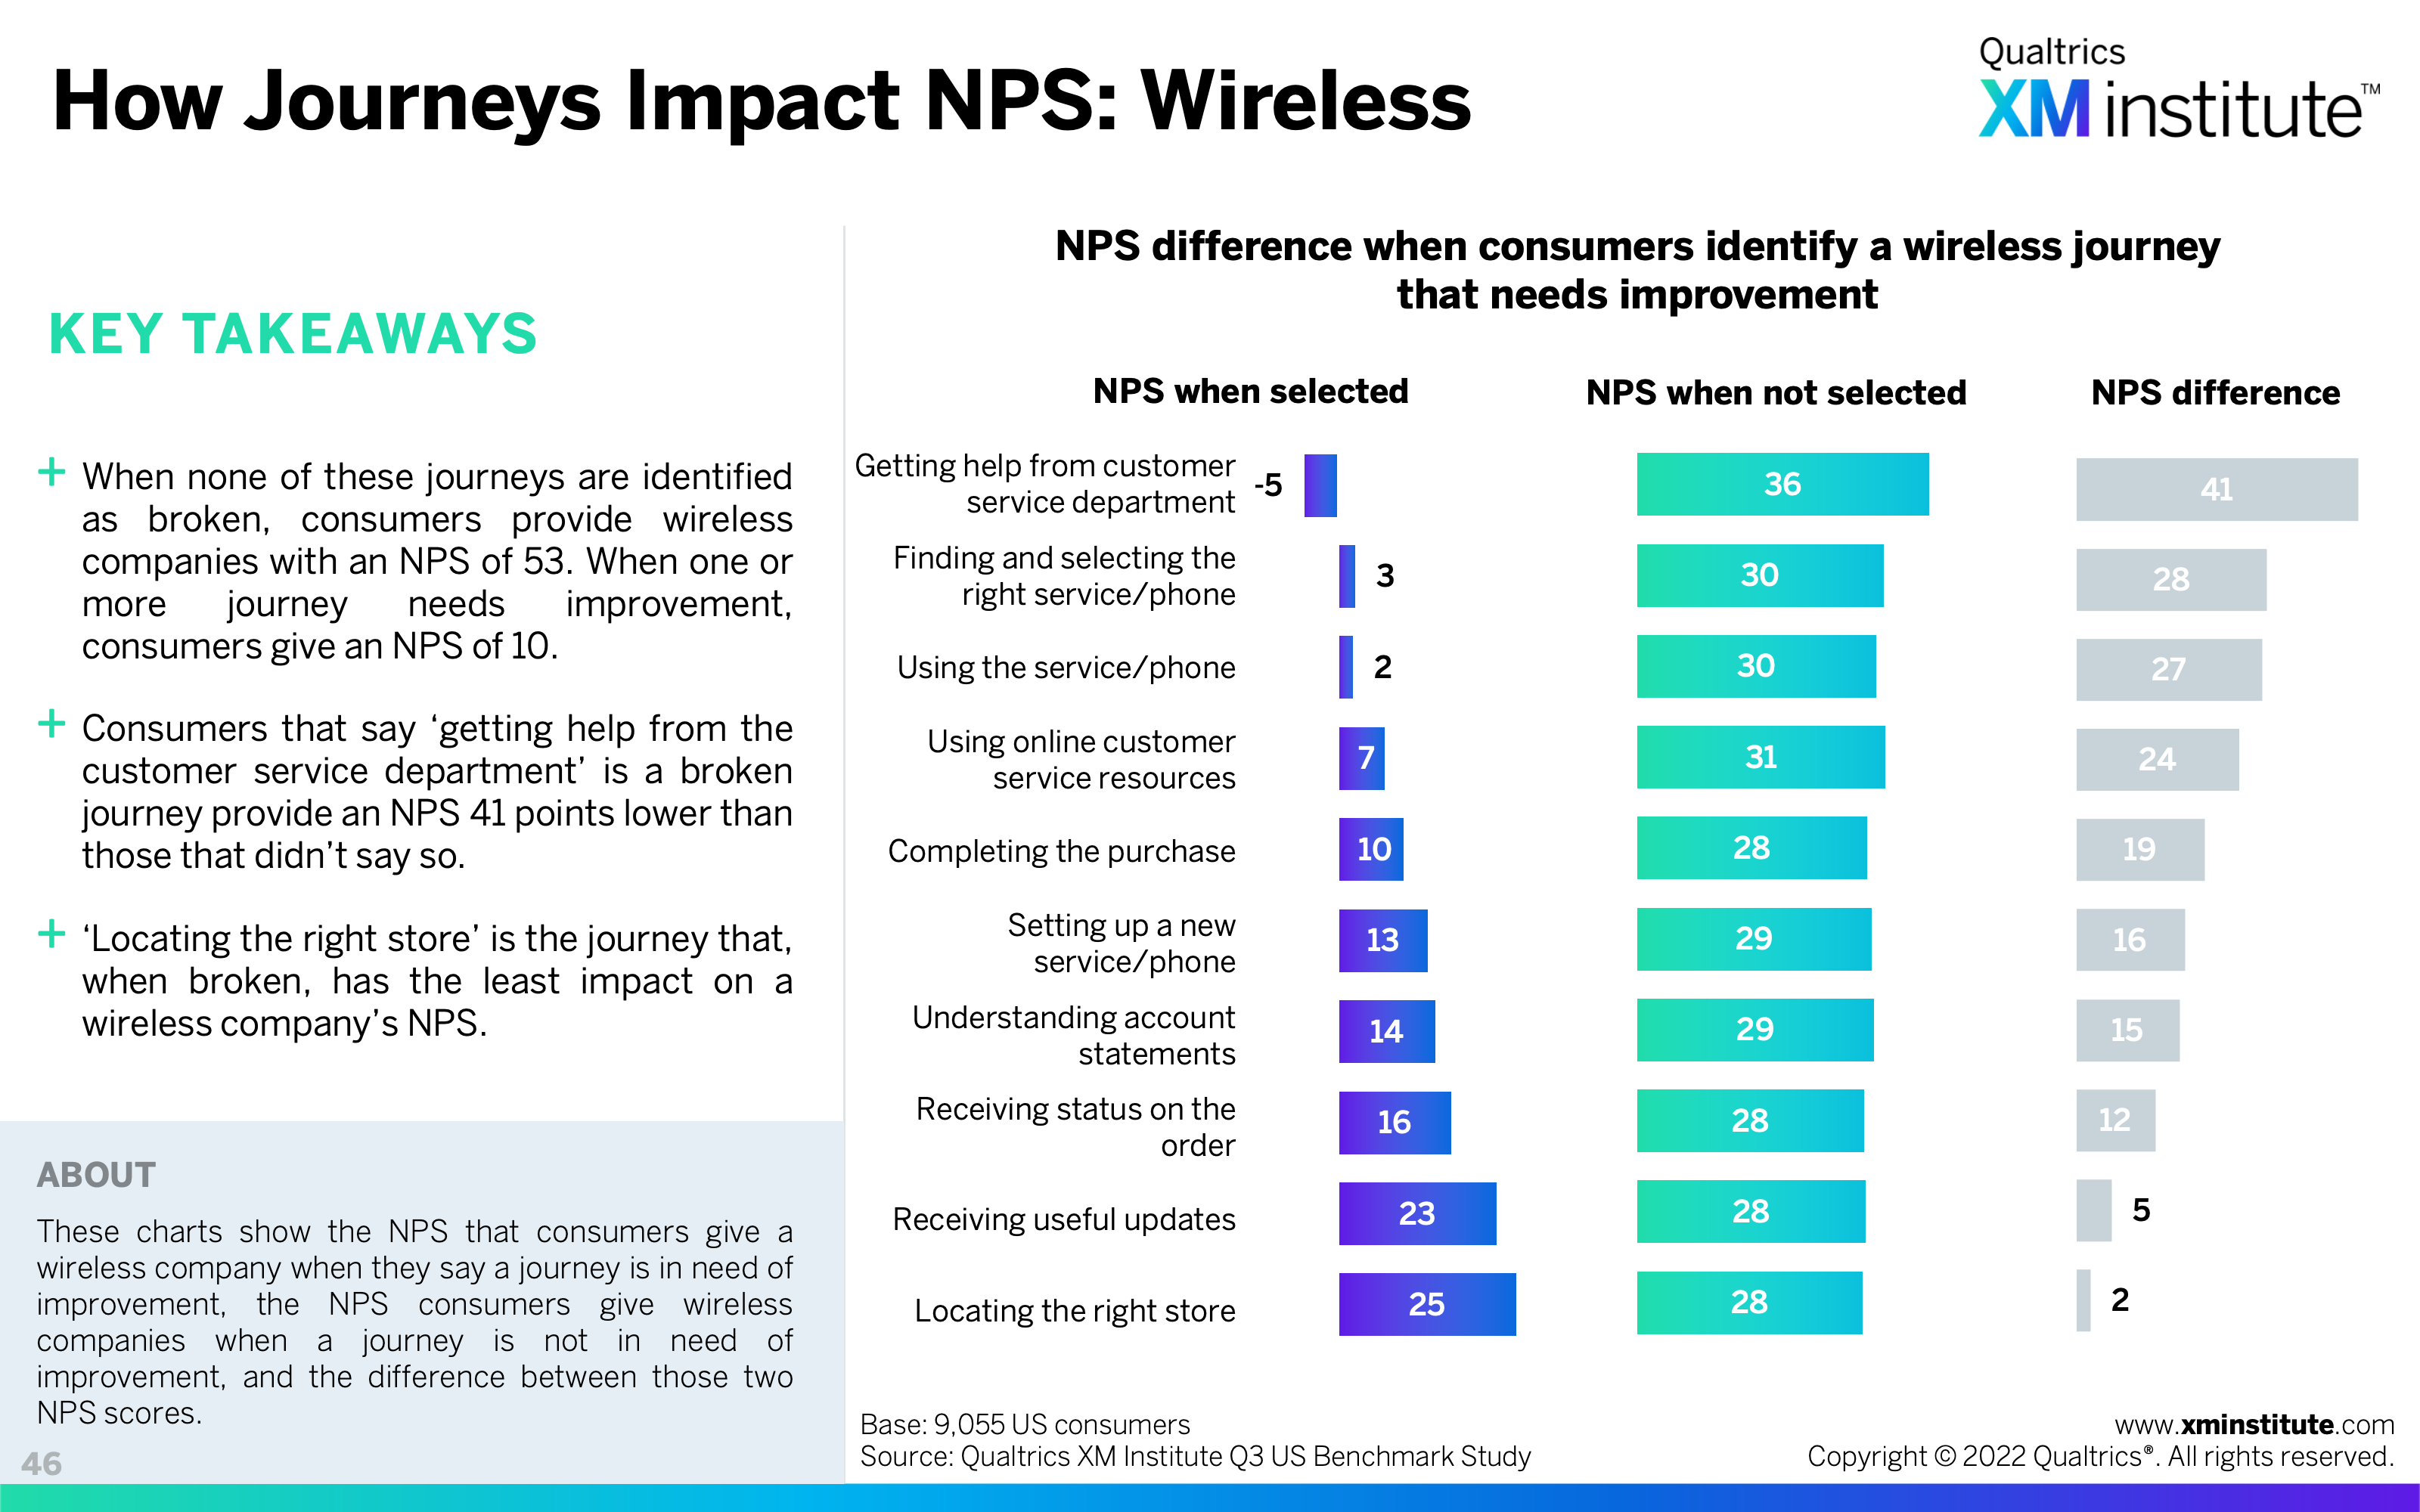
- How Journeys Impact NPS: Wireless (see Figure 46)
- Methodology (see Figure 47)
Journeys Needing Improvement for Individual Industries
Find the U.S. Consumer Journeys Needing Improvement for each individual industry below: