Key Findings
To understand the current state of customer experience (CX) management, Qualtrics XM Institute surveyed 220 CX practitioners at companies with 1,000 or more employees about their organizations’ CX efforts and asked them to complete our CX Competency & Maturity Assessment. Highlights from the research include:
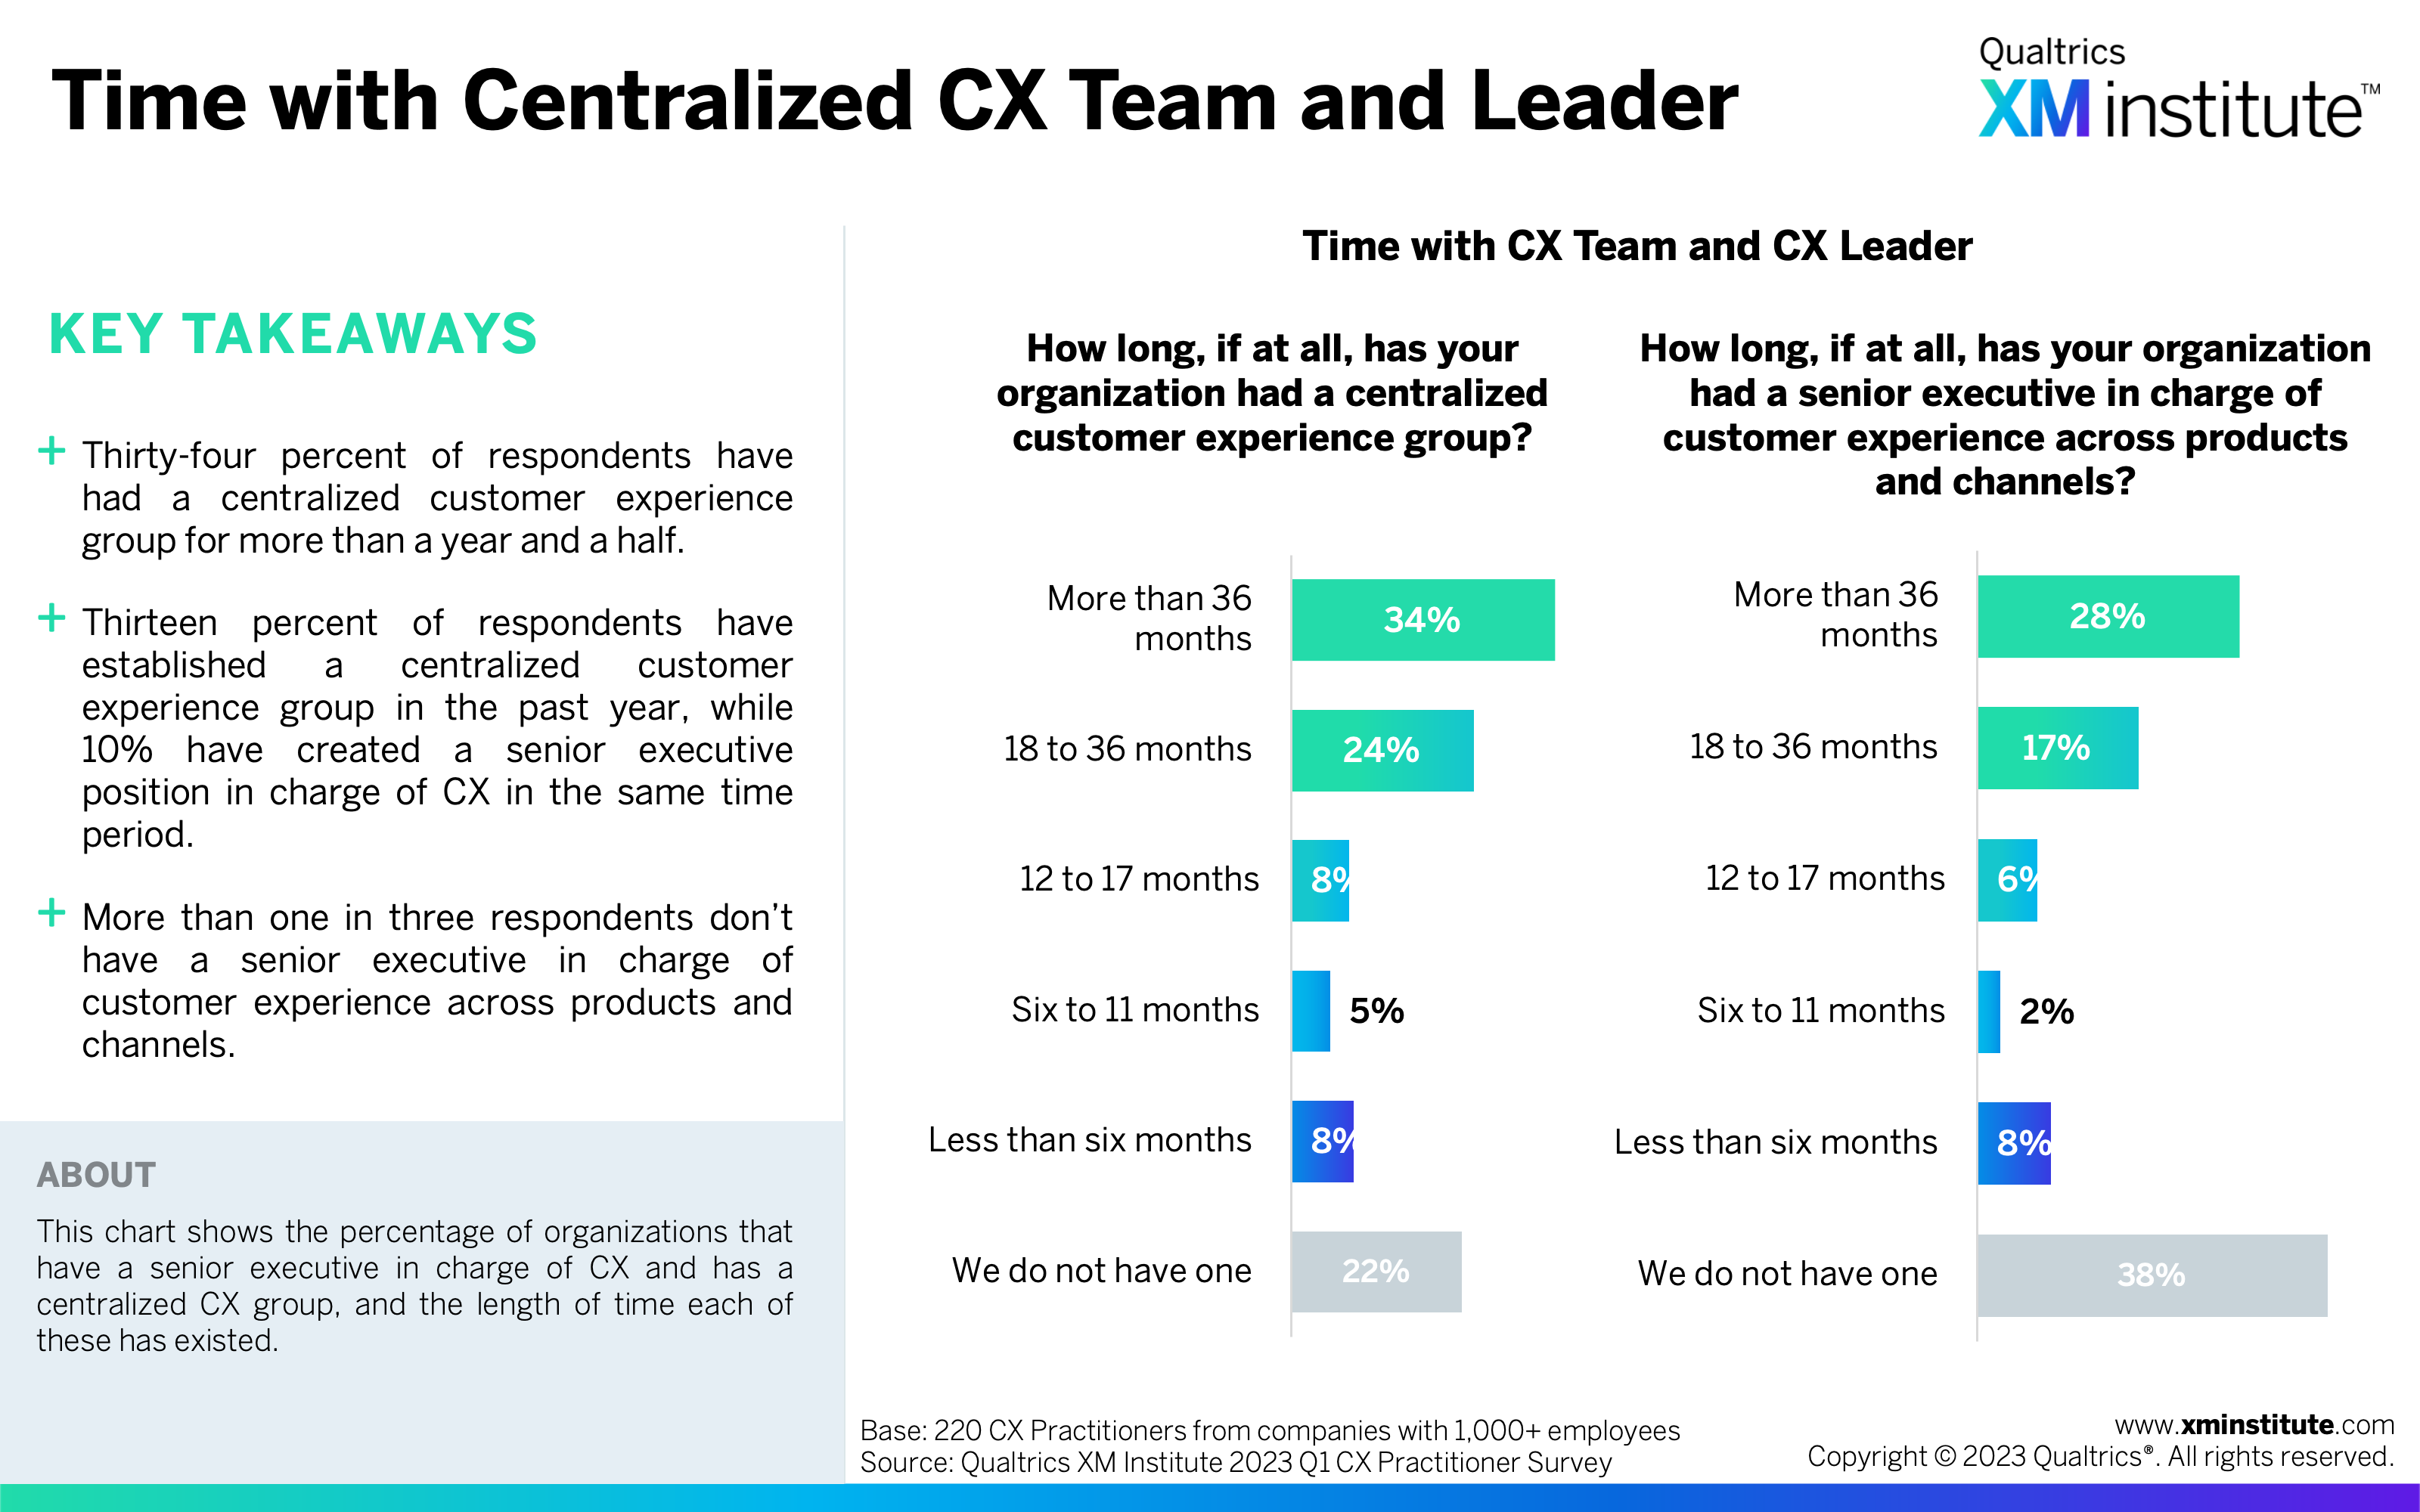
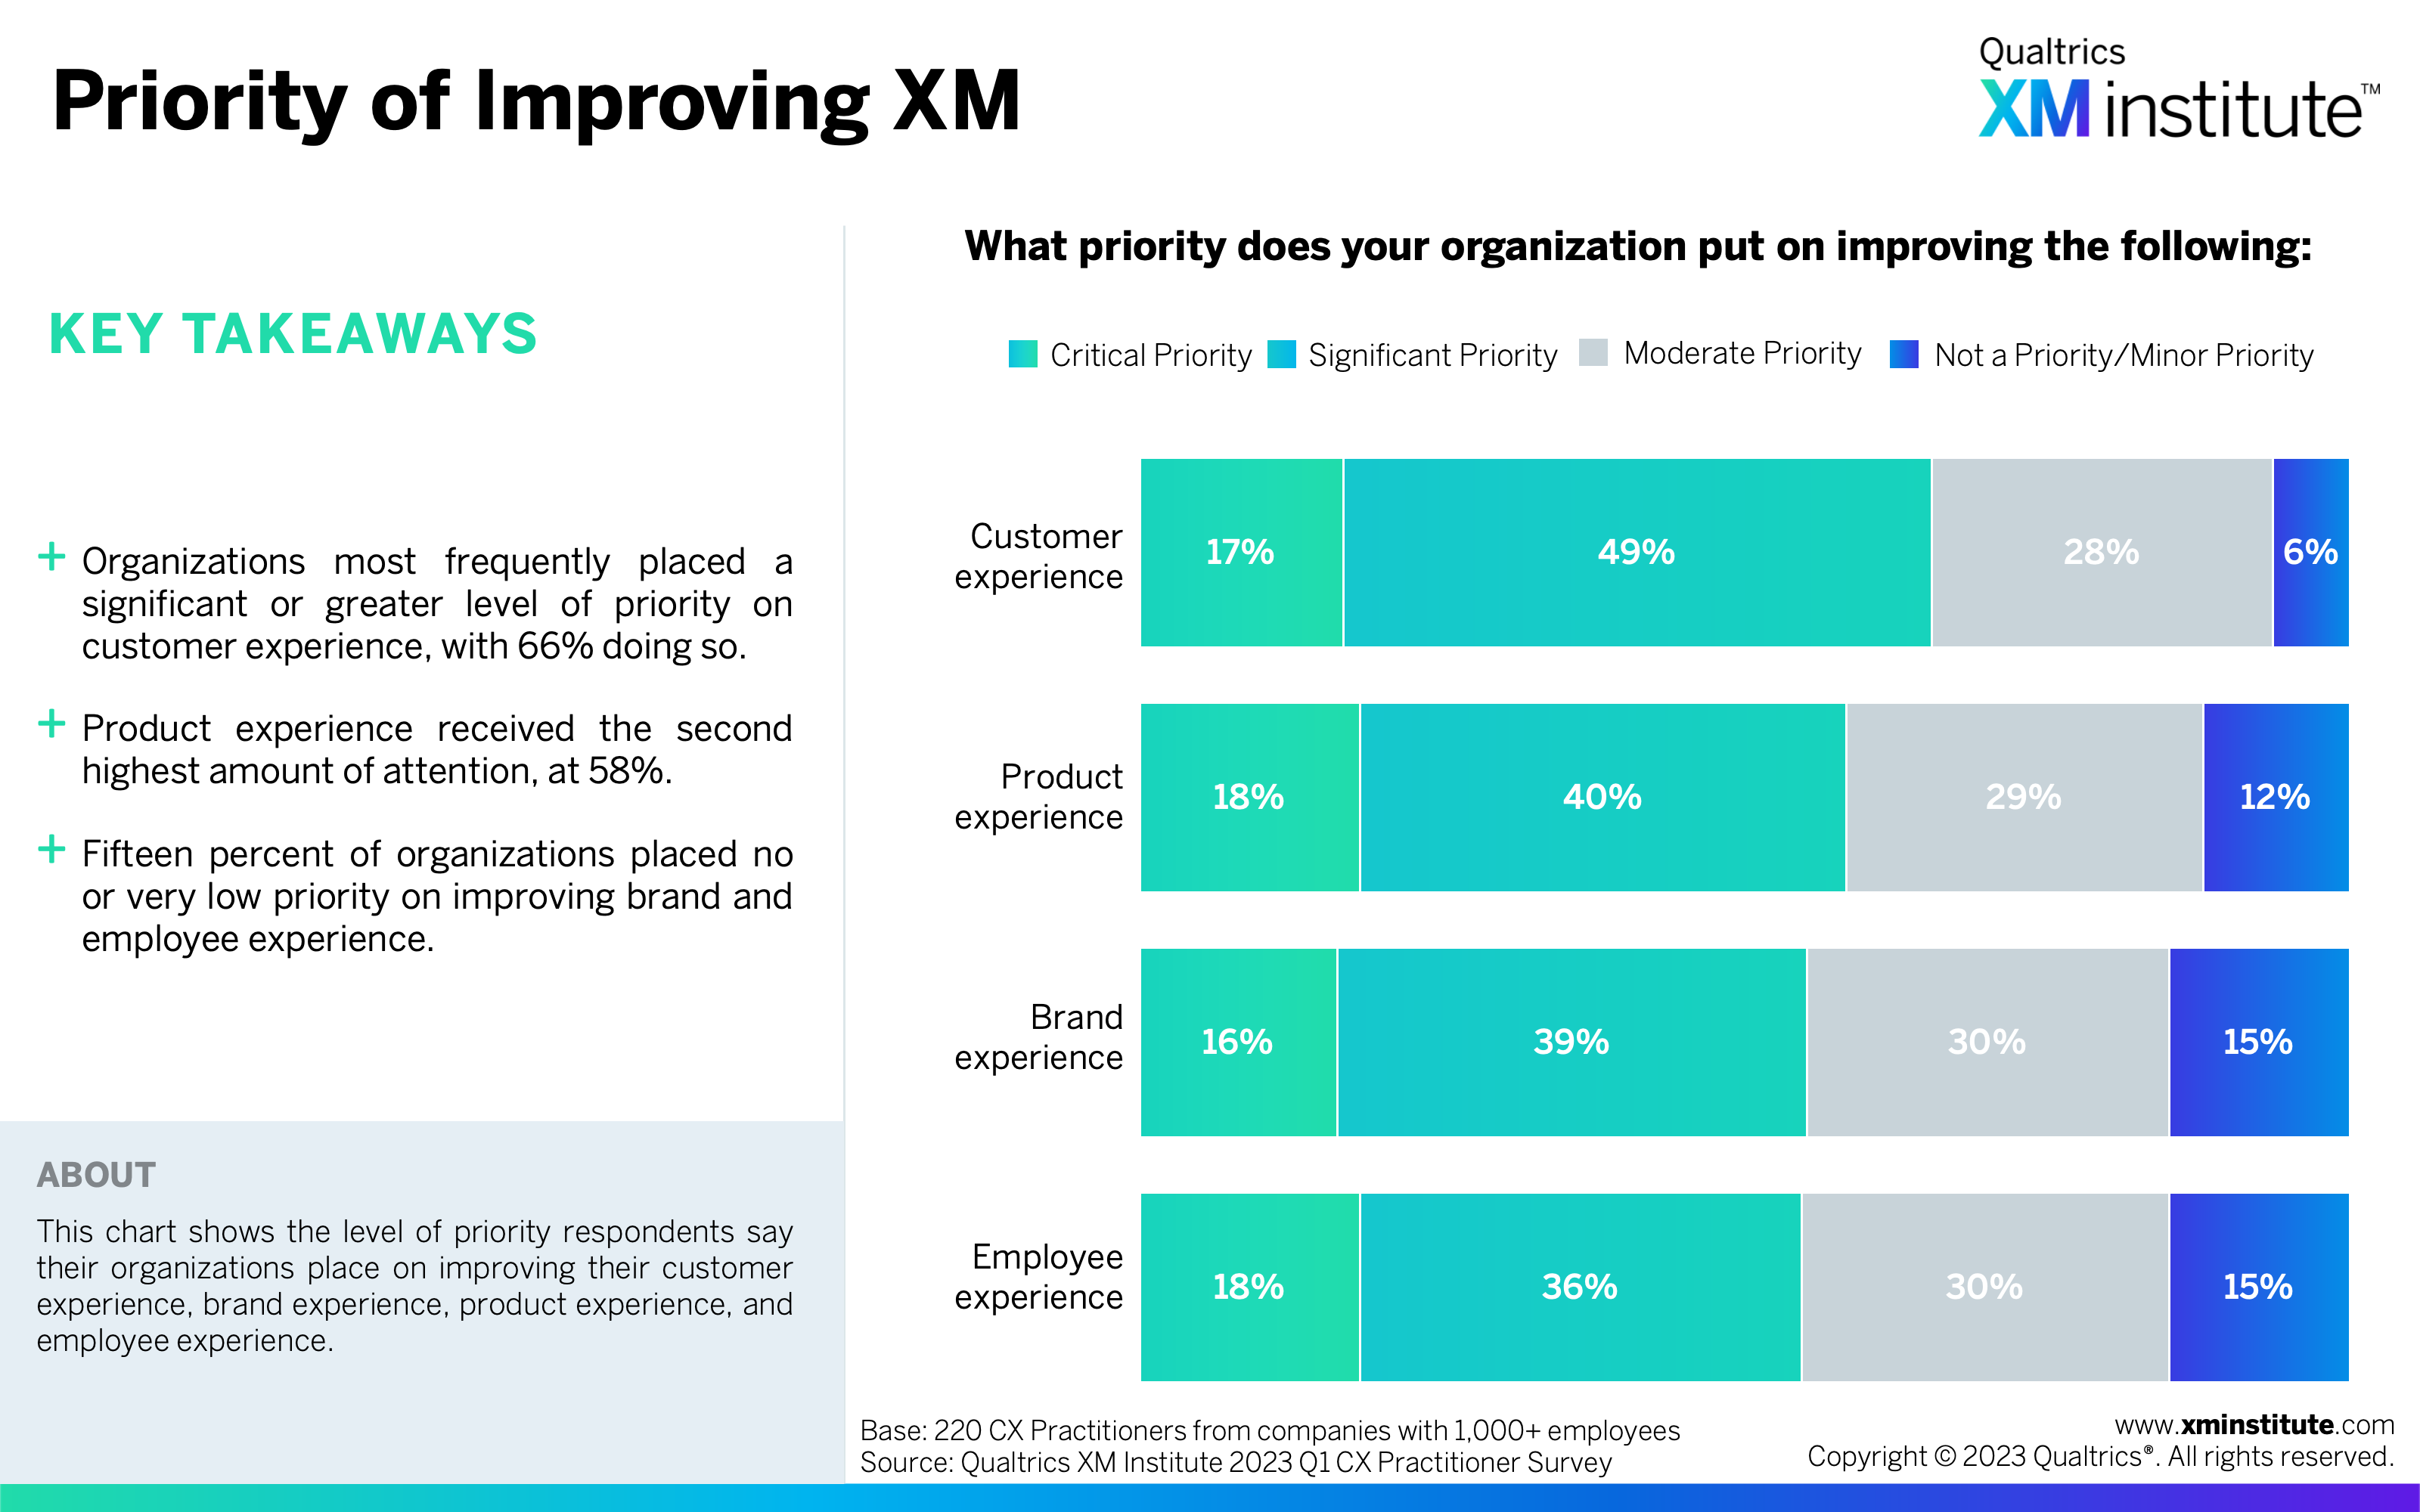
- CX is a high priority. Customer experience is a ‘significant’ or ‘critical’ priority for 66% of organizations. Seventy-eight percent have a centralized customer experience team, and 62% have a senior executive in charge of CX across products and channels.
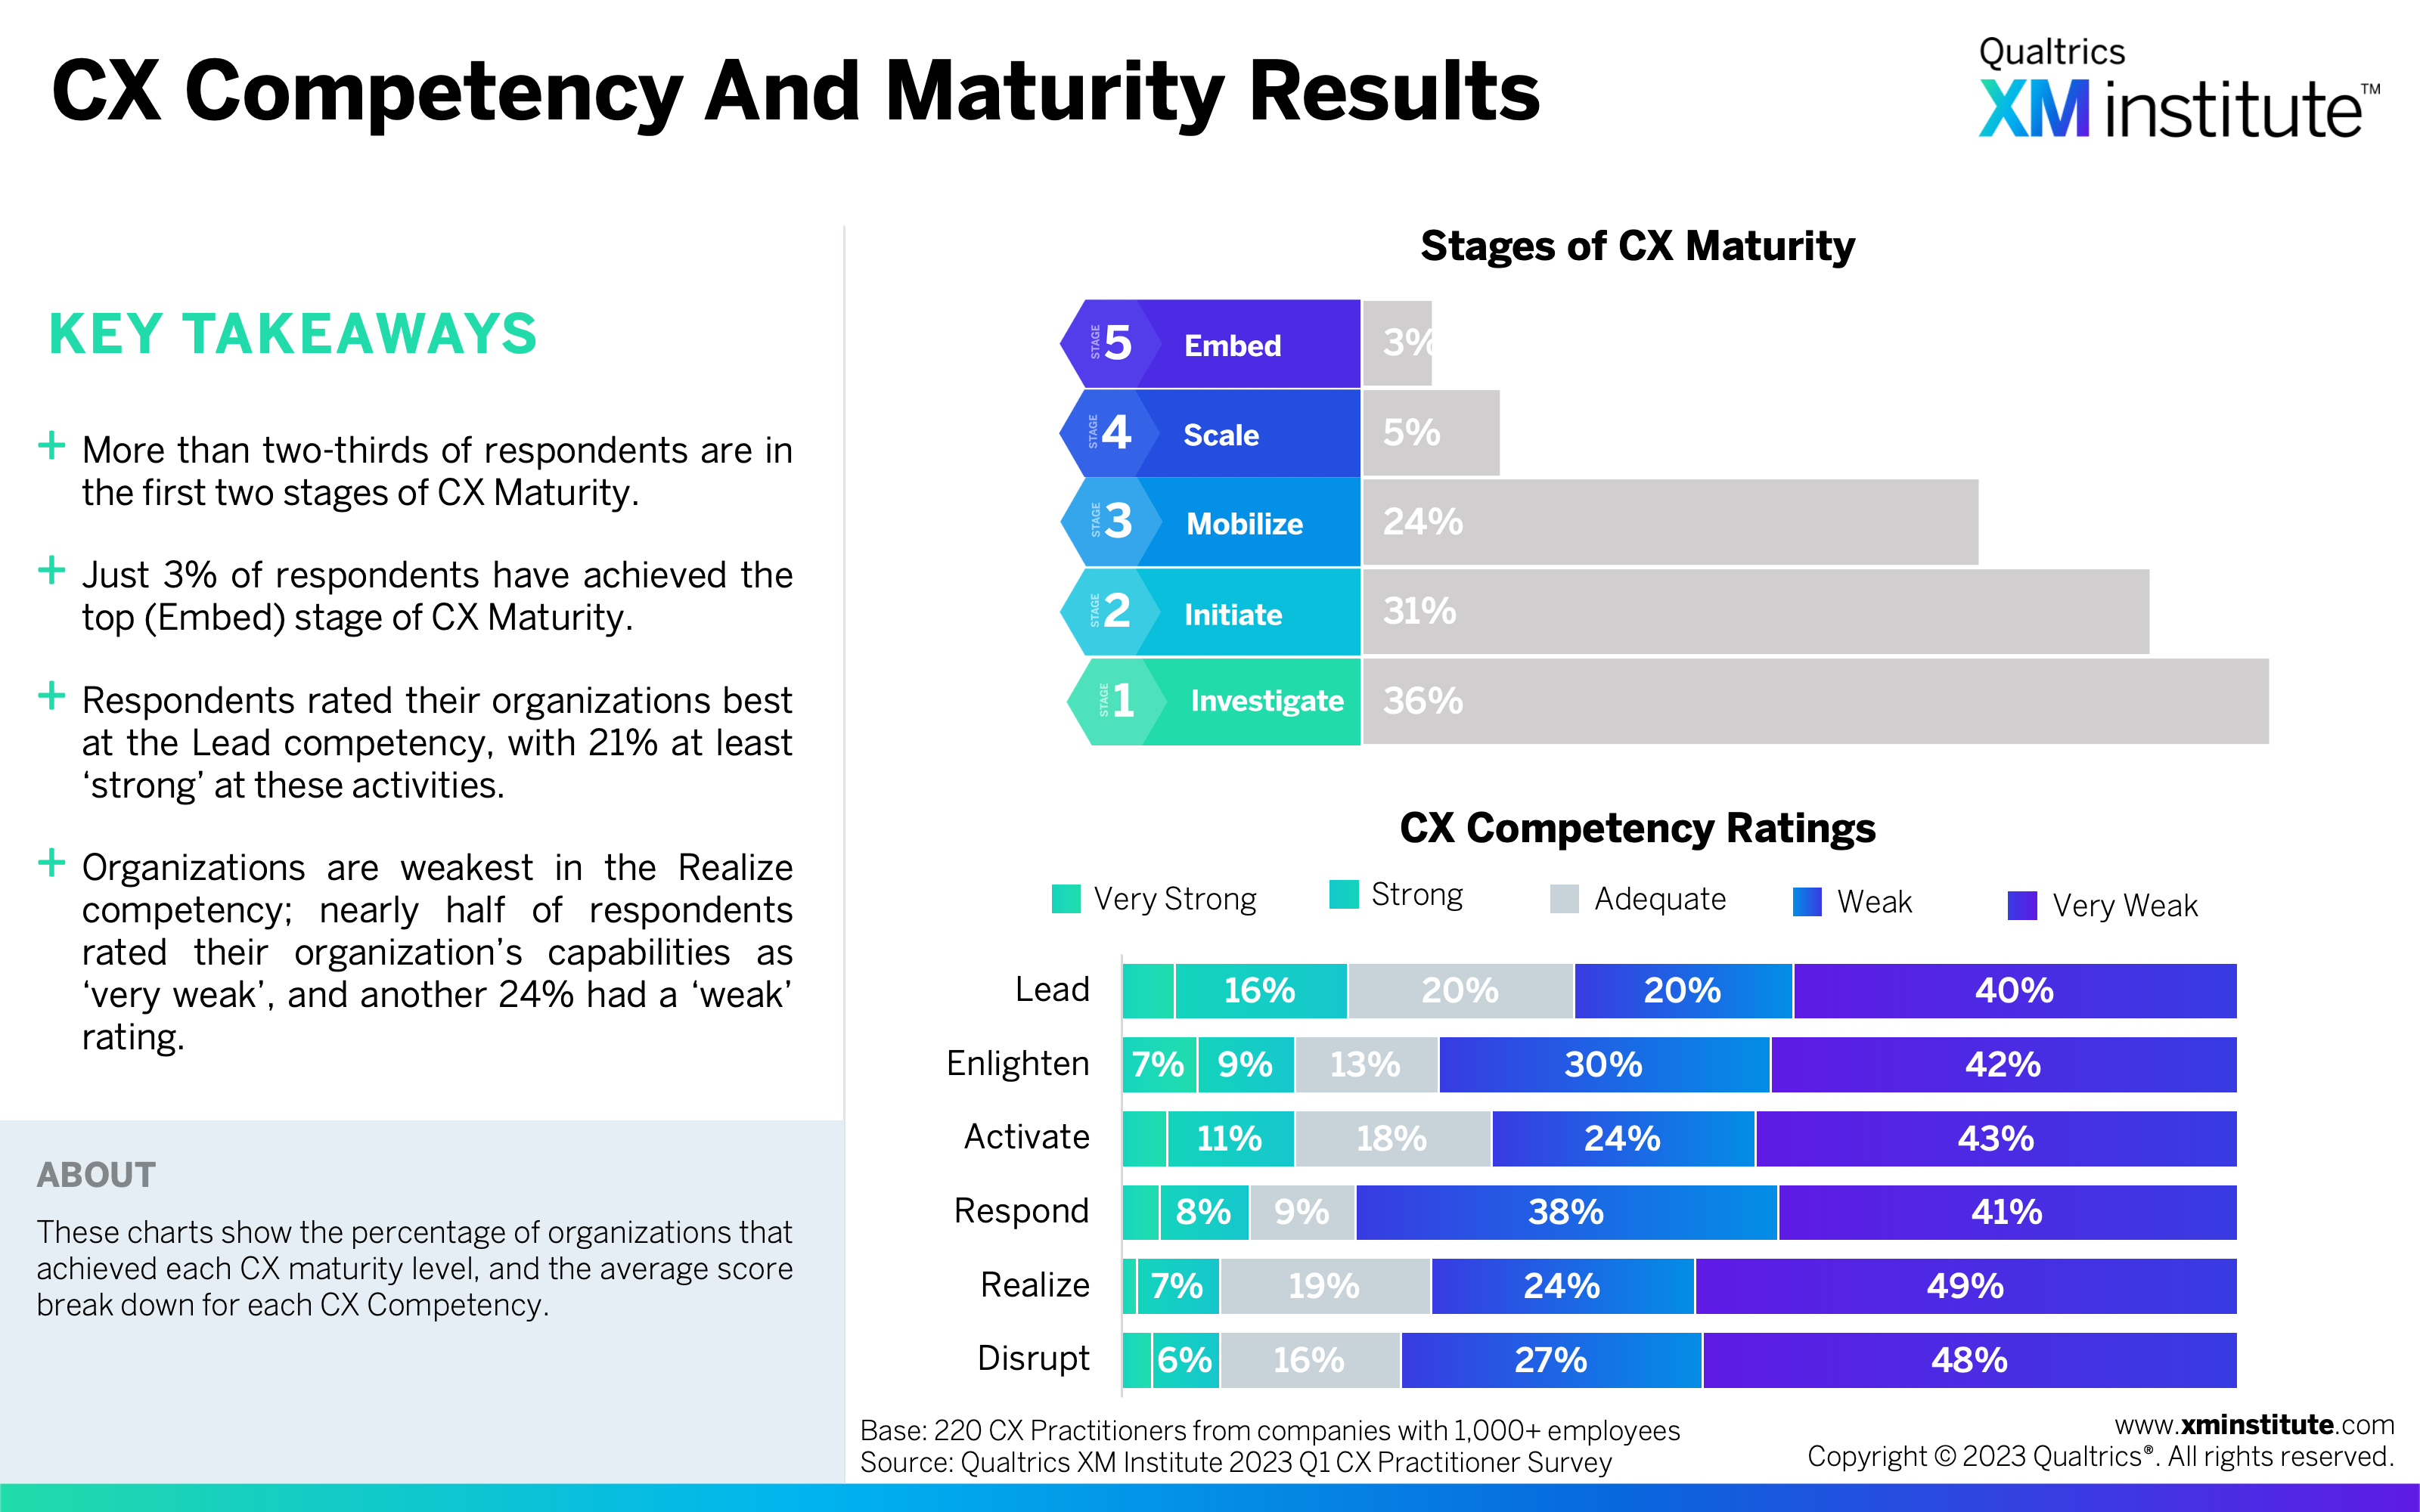
- Most organizations are in the first two stages of CX maturity. Just 3% of organizations reached the highest stage of maturity, Embed. More than two-thirds of organizations fell into the first two stages of maturity, Investigate (36%) and Initiate (31%). Use the Customer Experience (CX) Maturity Assessment to evaluate your organization’s CX skills and competencies.
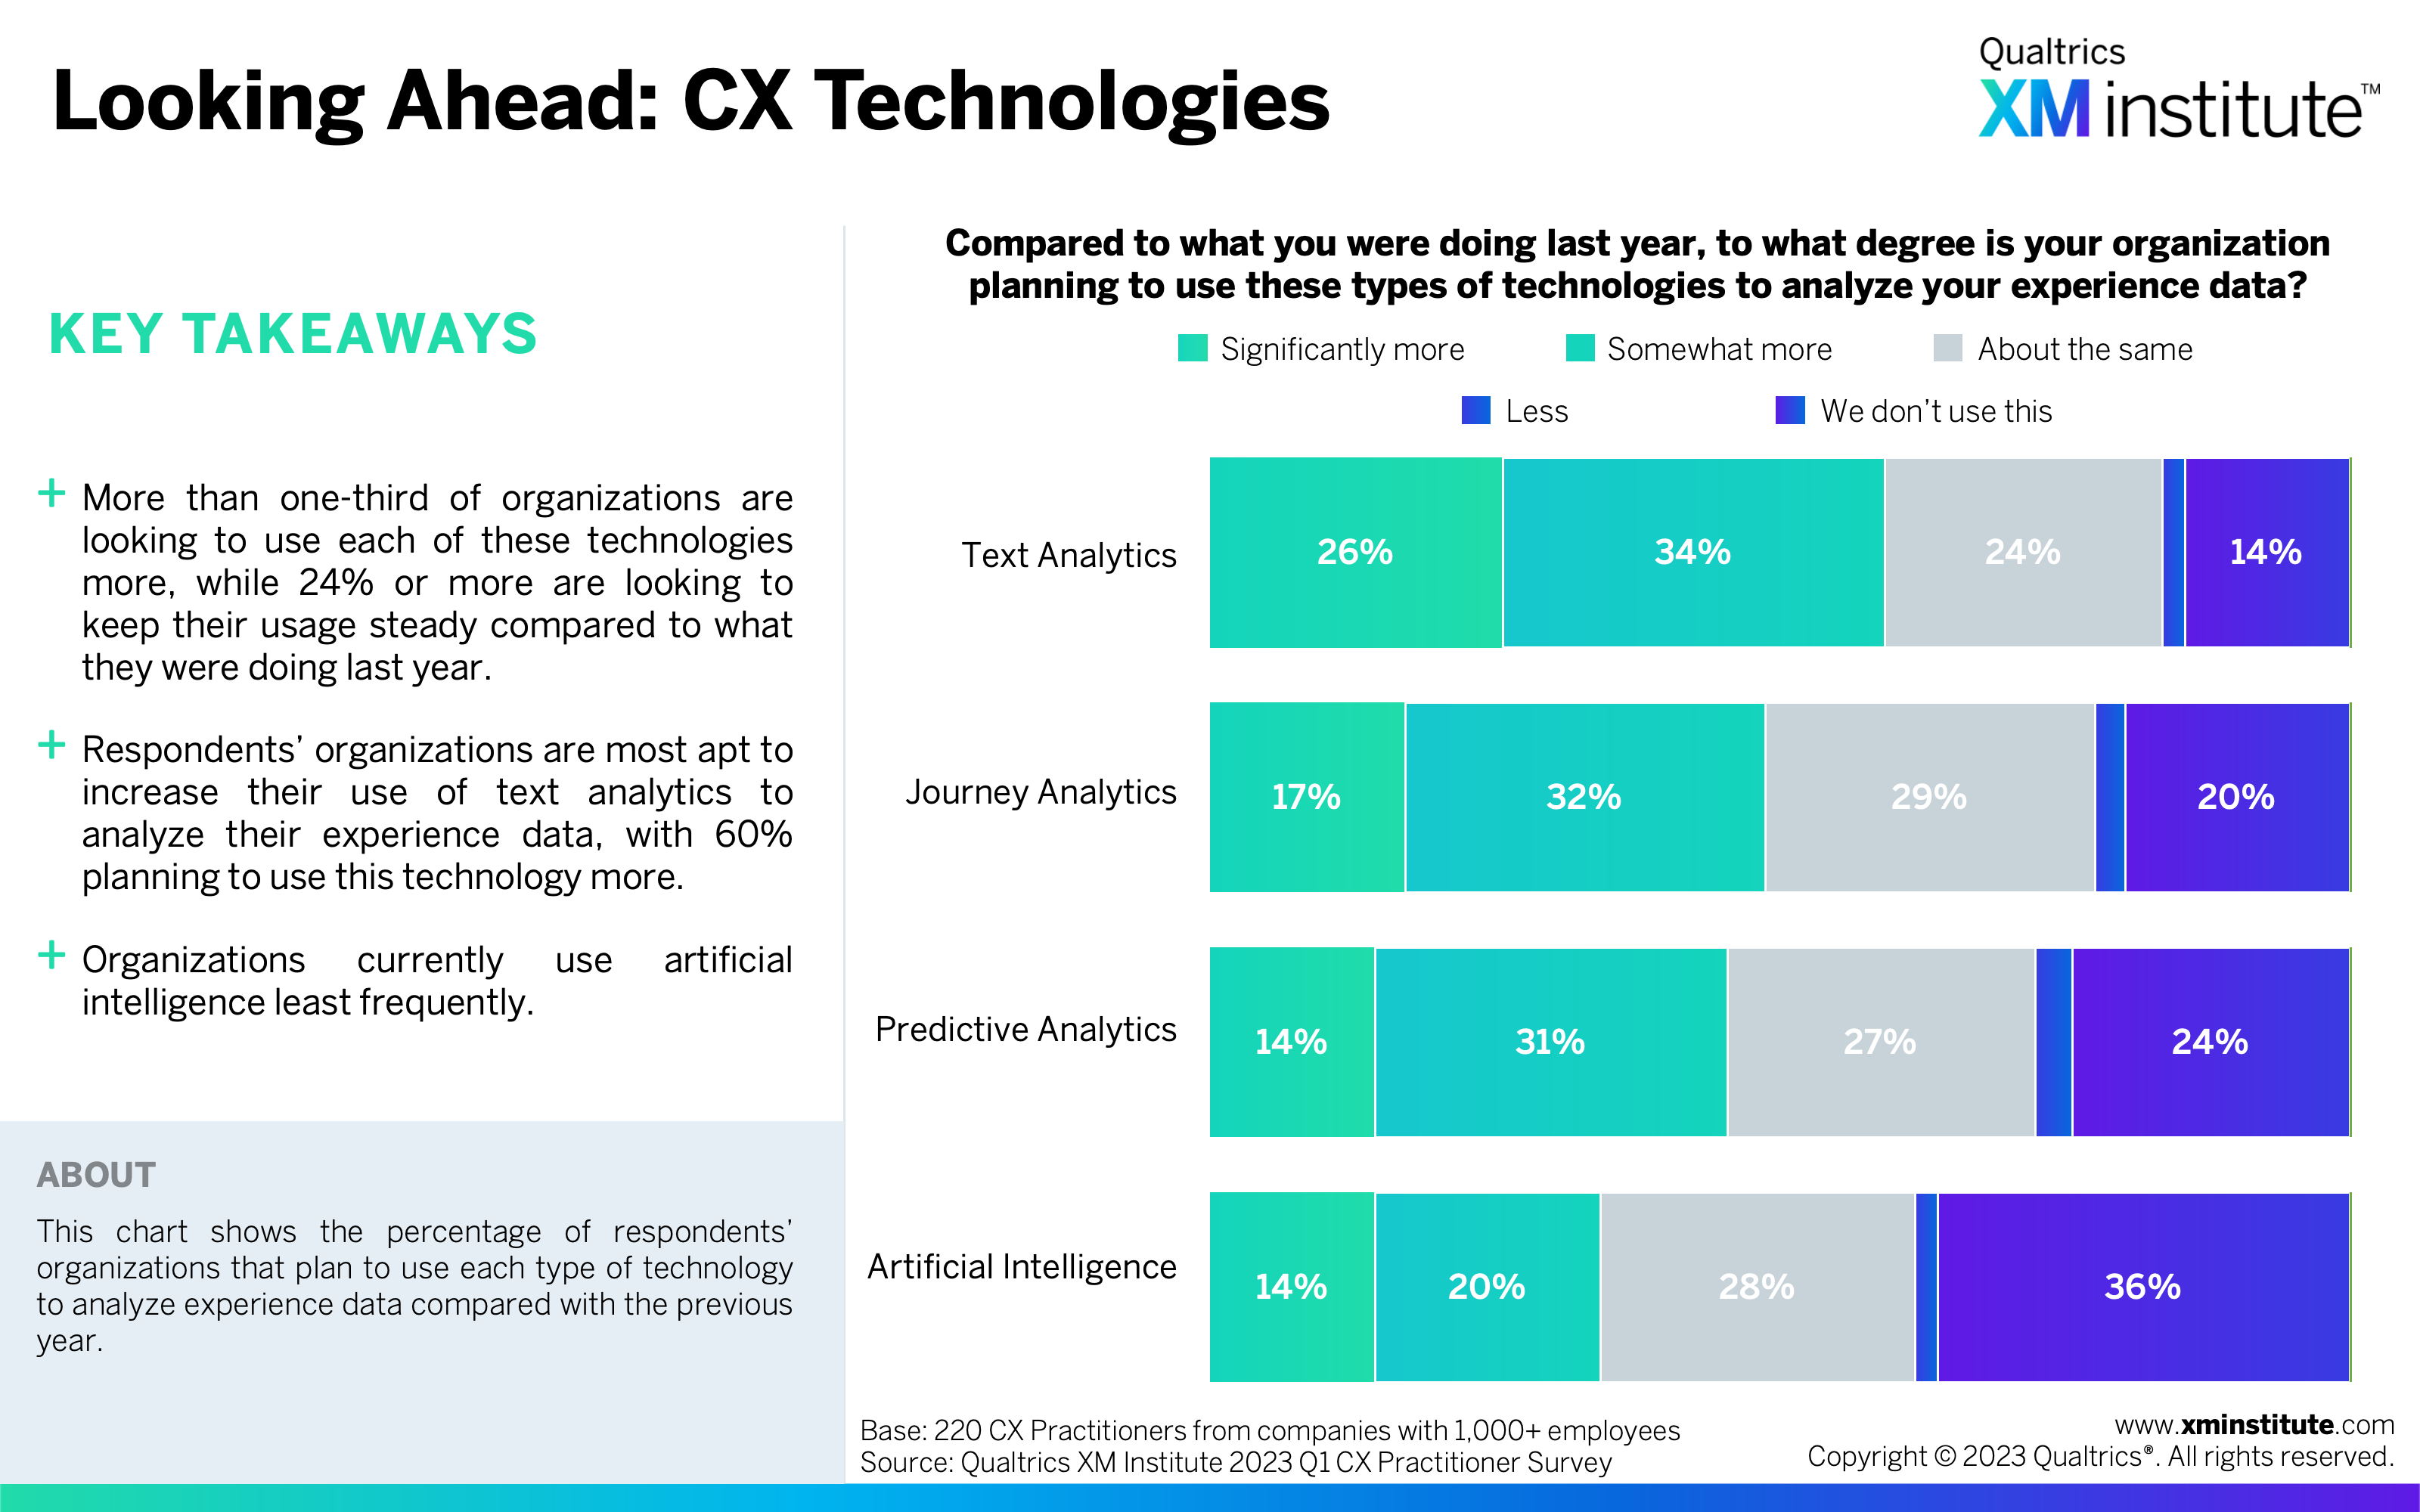
- Organizations are planning to expand into new CX technologies. Sixty percent of respondents said their organization is planning to use text analytics ‘somewhat’ or ‘significantly’ more than they were doing so last year. Forty-nine percent of respondents’ organizations plan to use journey analytics more as well.
- CX Leaders’ business outcomes benefit more from their CX programs. Compared to CX laggards, CX Leaders (companies with CX Competency & Maturity Assessment scores above the median score) were more likely to report that their CX programs have significantly improved key business outcomes for their organization, including customer retention, cross-selling, employee retention, and cost reduction.
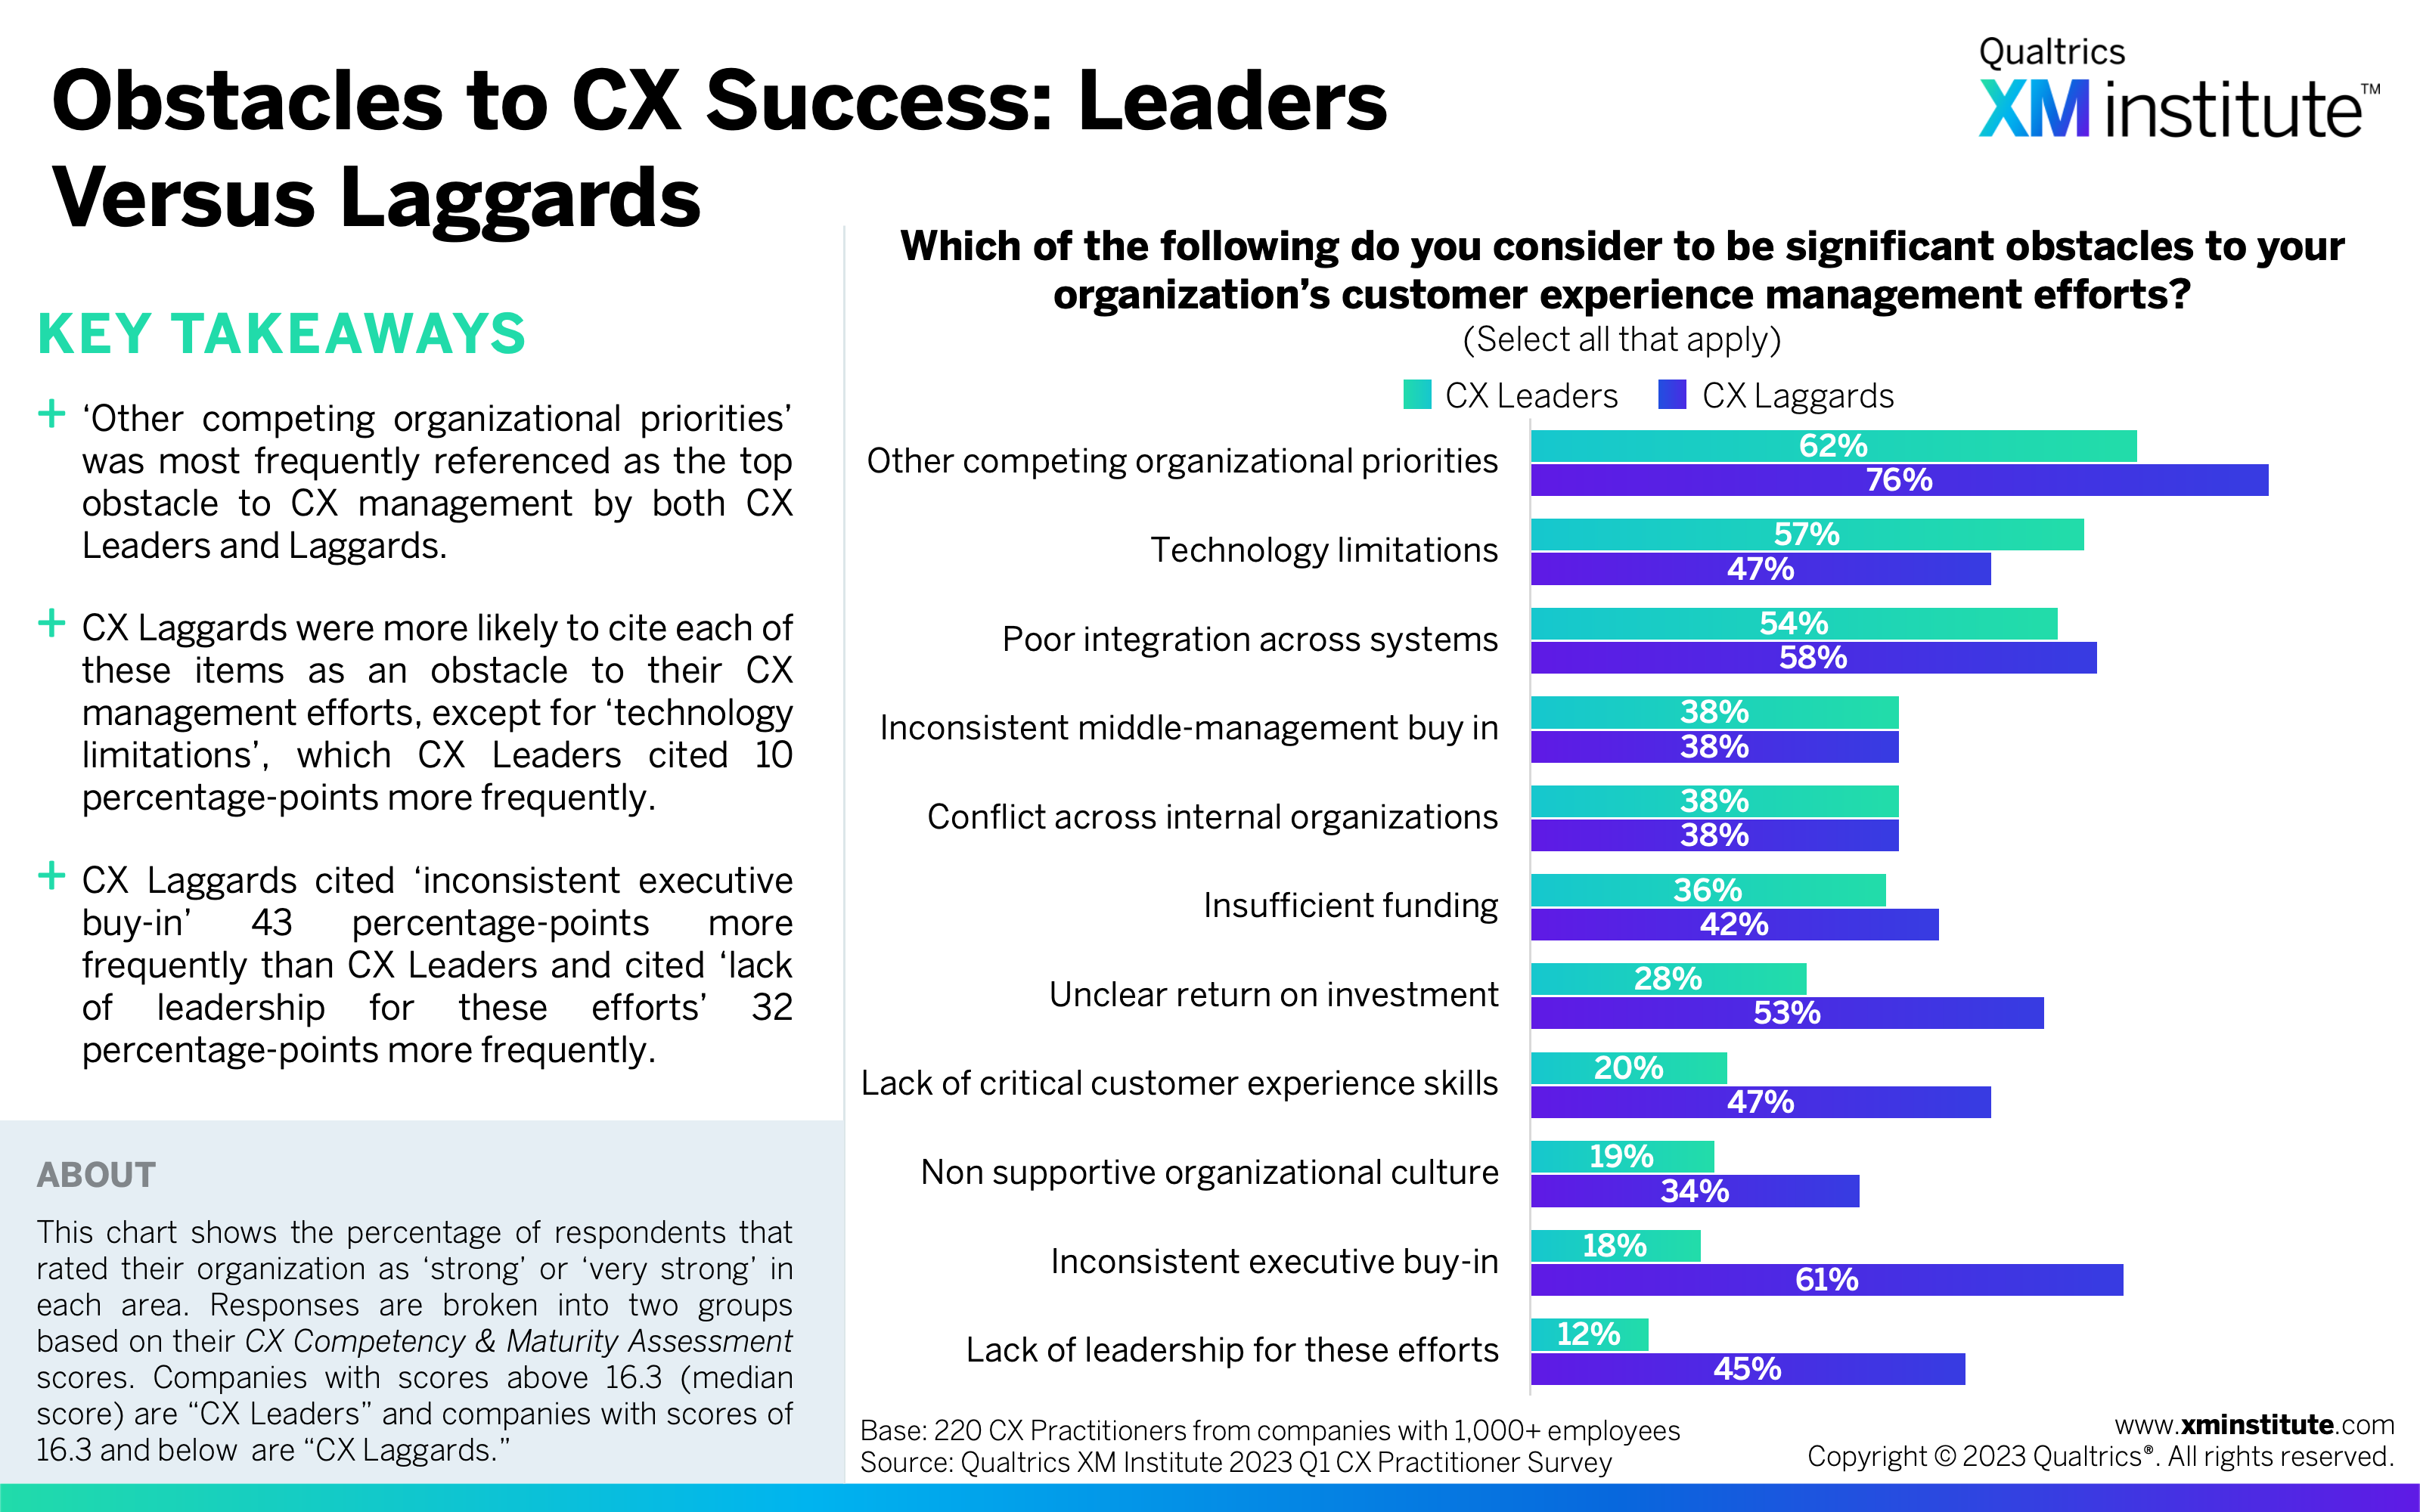
- ‘Other competing organizational priorities’ is the top obstacle to CX success. Both CX Leaders and CX Laggards cited this as a significant obstacle to their CX management efforts, with Laggards citing this 14 percentage points more frequently. The largest gap between CX Leaders’ and Laggards’ obstacles was for ‘inconsistent executive buy-in’– Laggards cited this obstacle 43 percentage points more than CX leaders.
Figures
Here are the figures in this data snapshot:
- Time with Centralized CX Team and Leader (see Figure 1)
- Priority of Improving XM (see Figure 2)
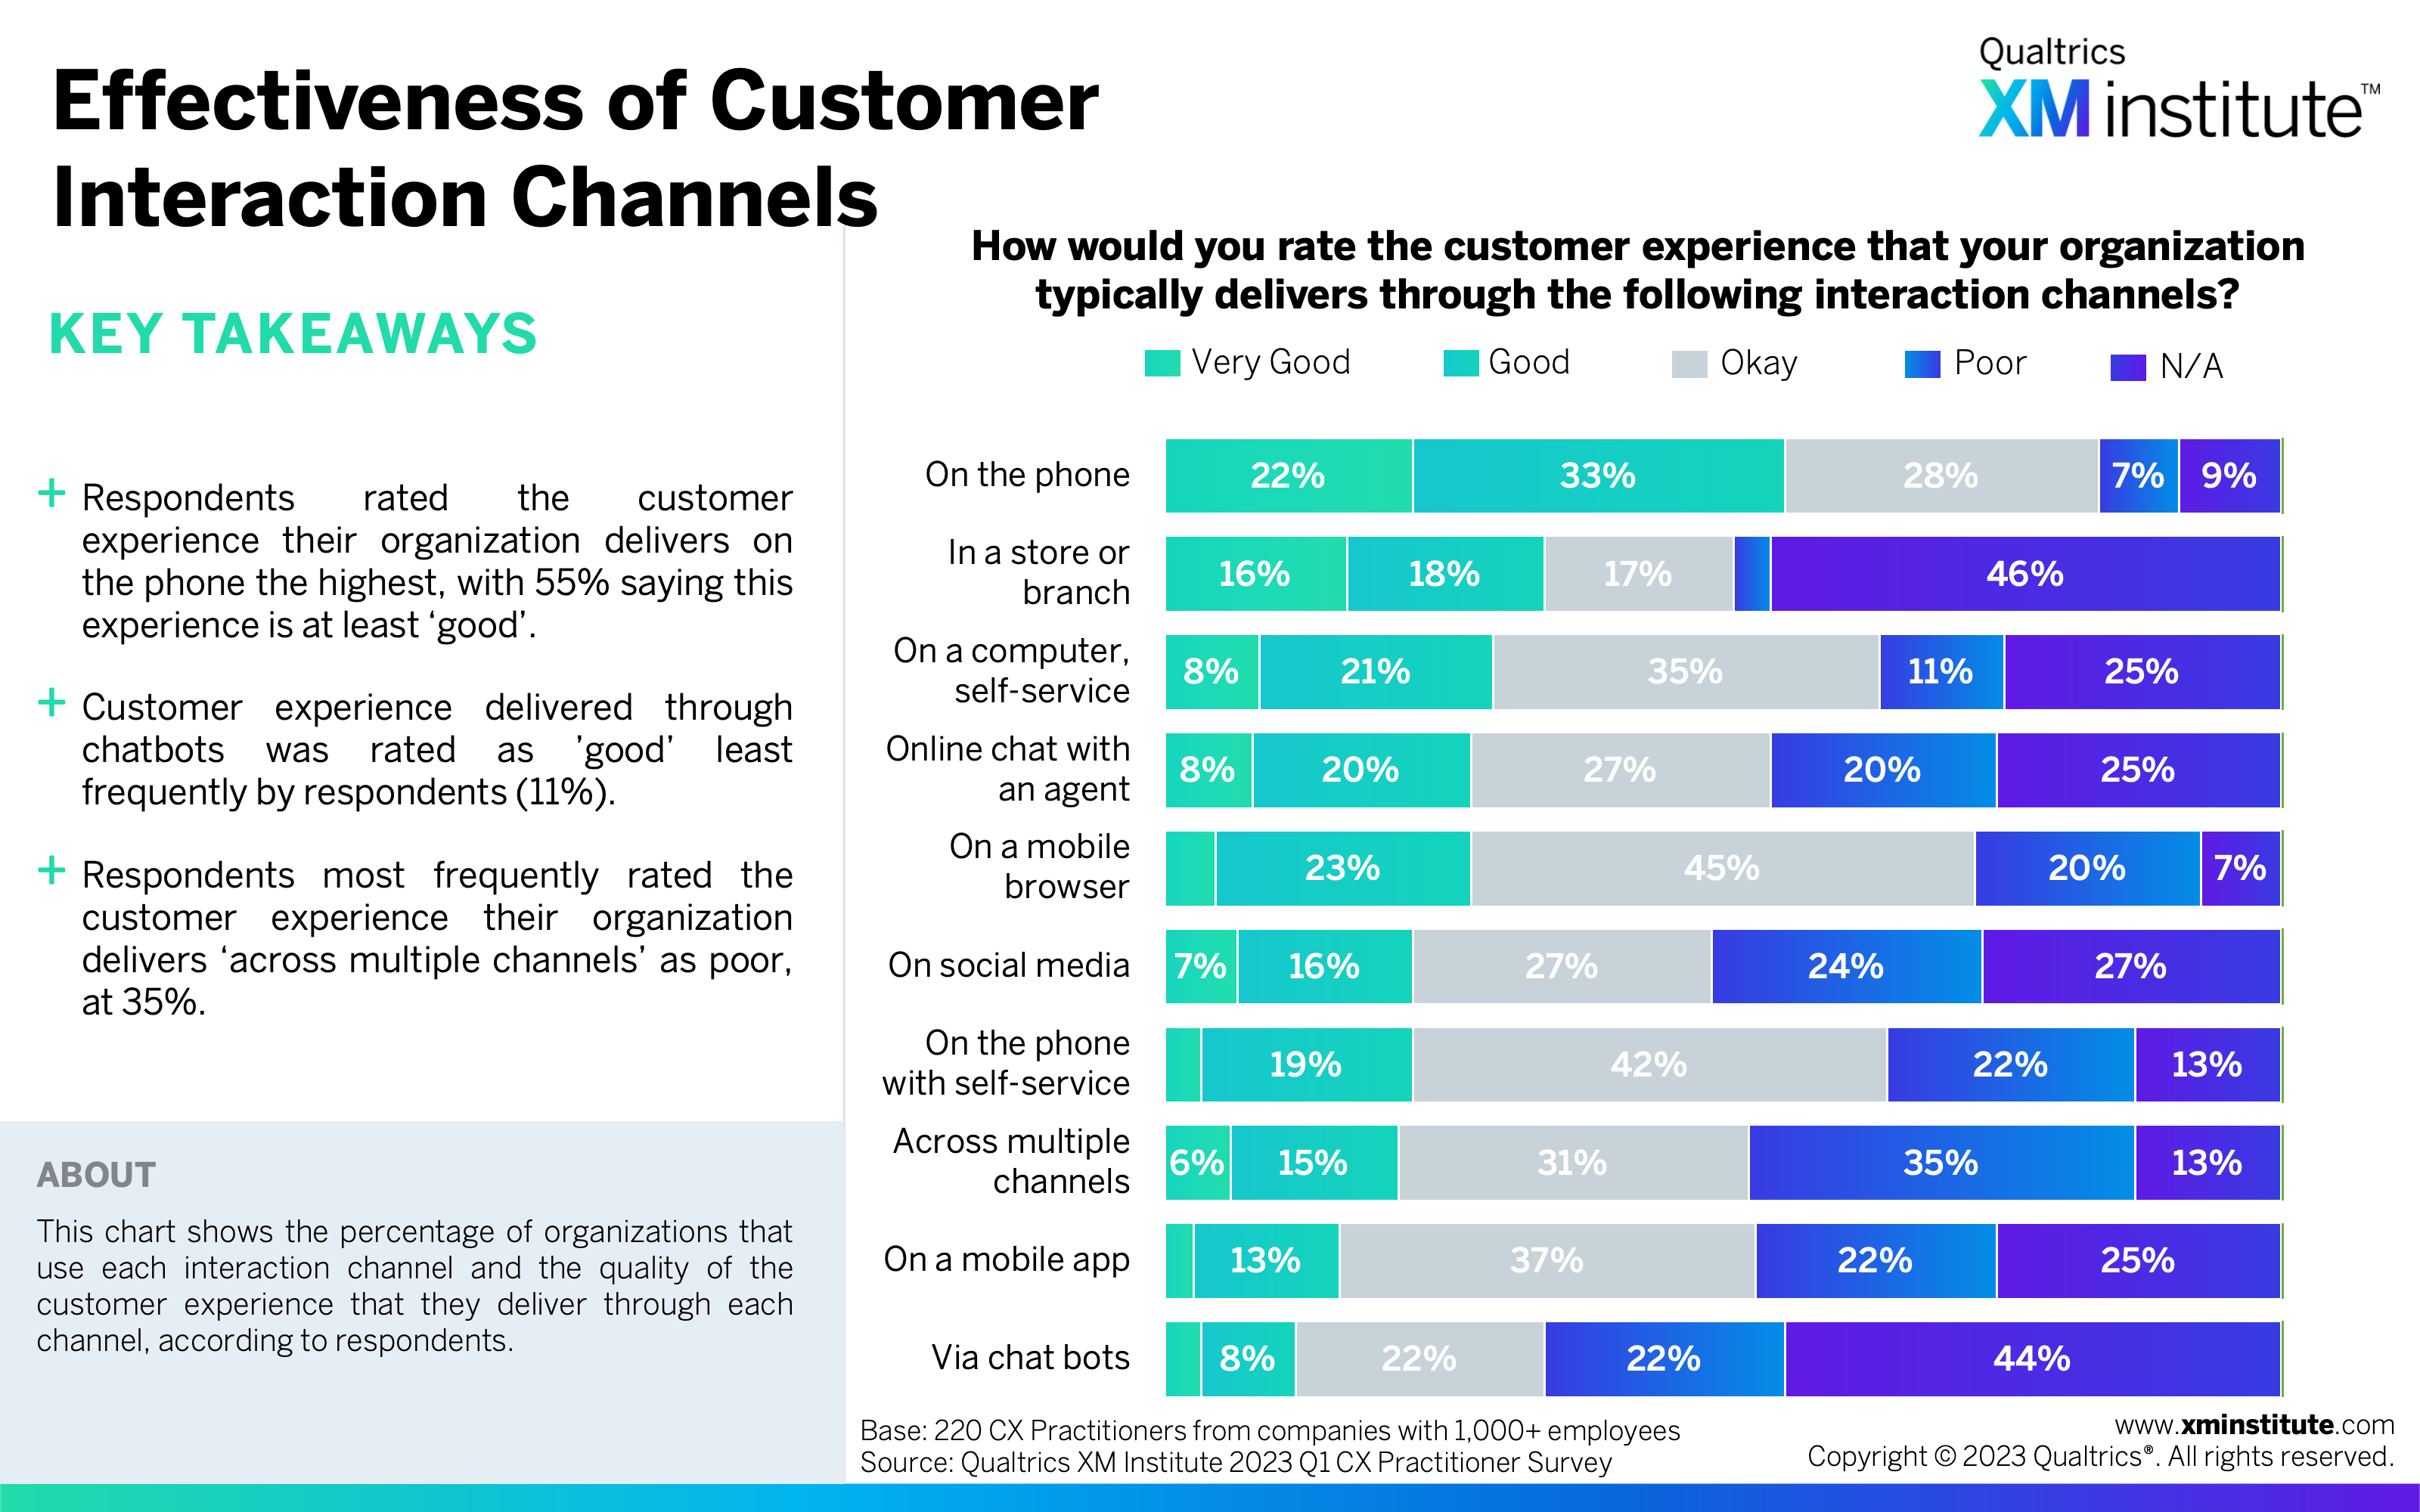
- Effectiveness of Customer Interaction Channels (see Figure 3)
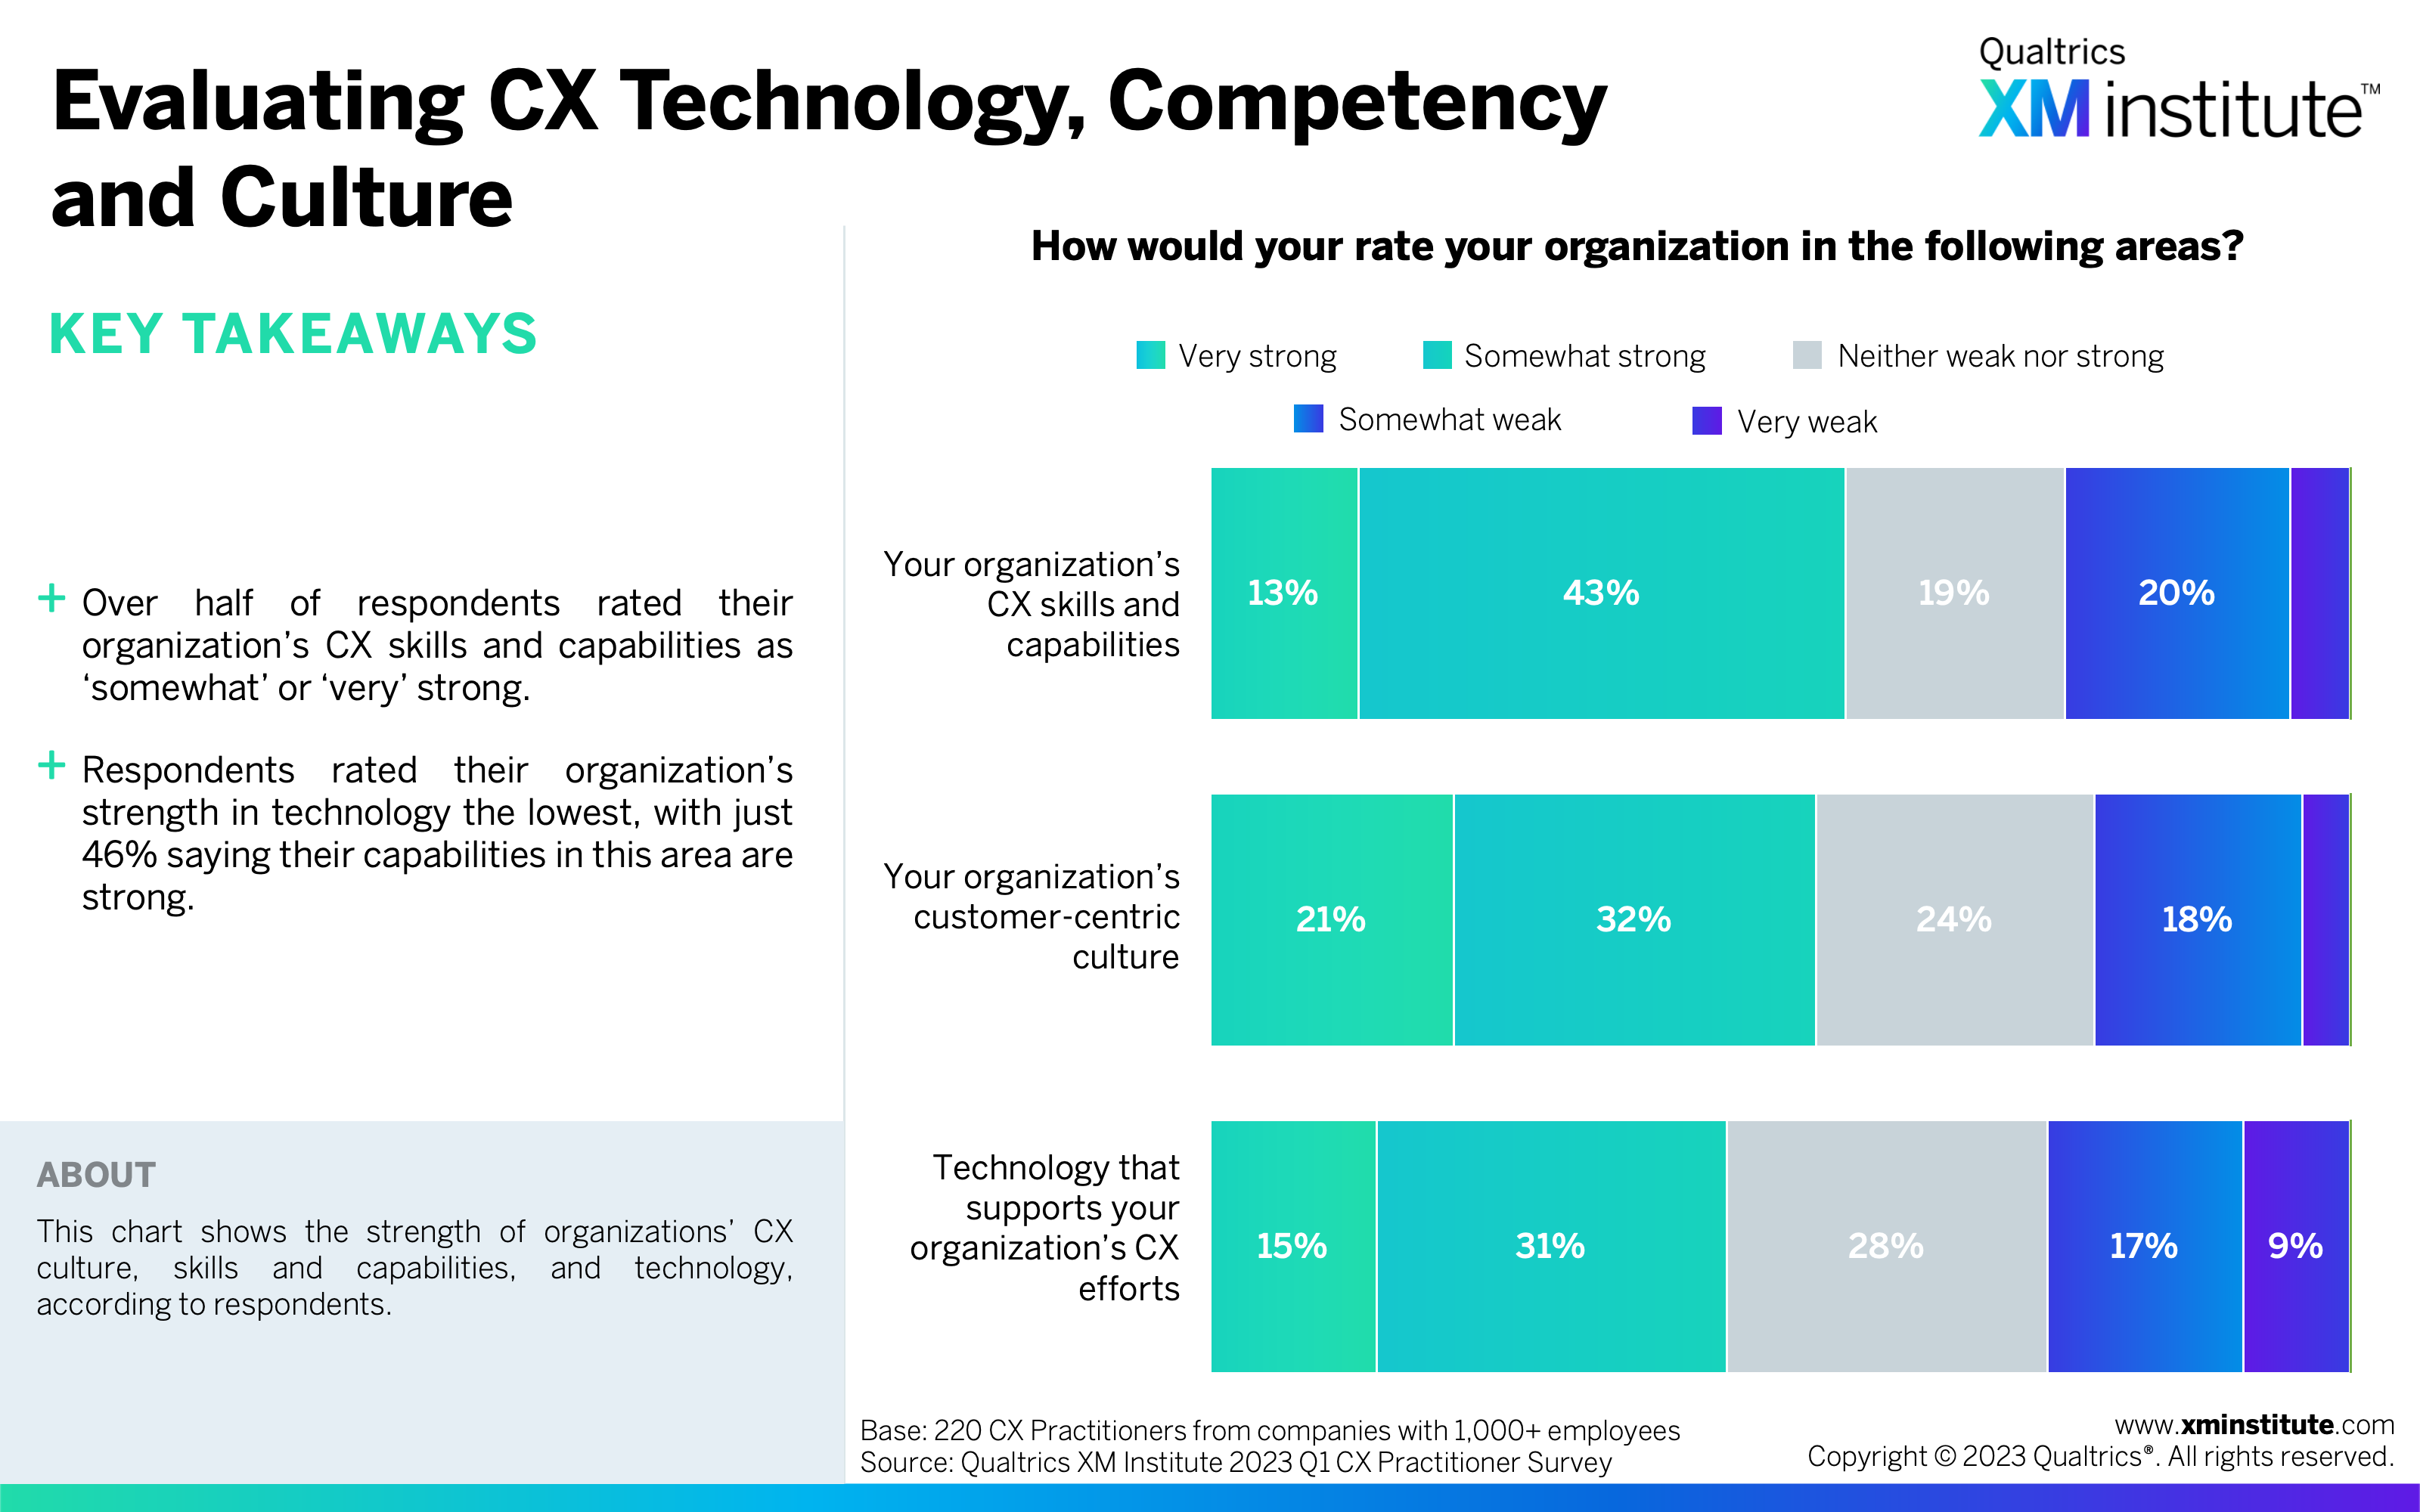
- Evaluating CX Technology, Competency, and Culture (see Figure 4)
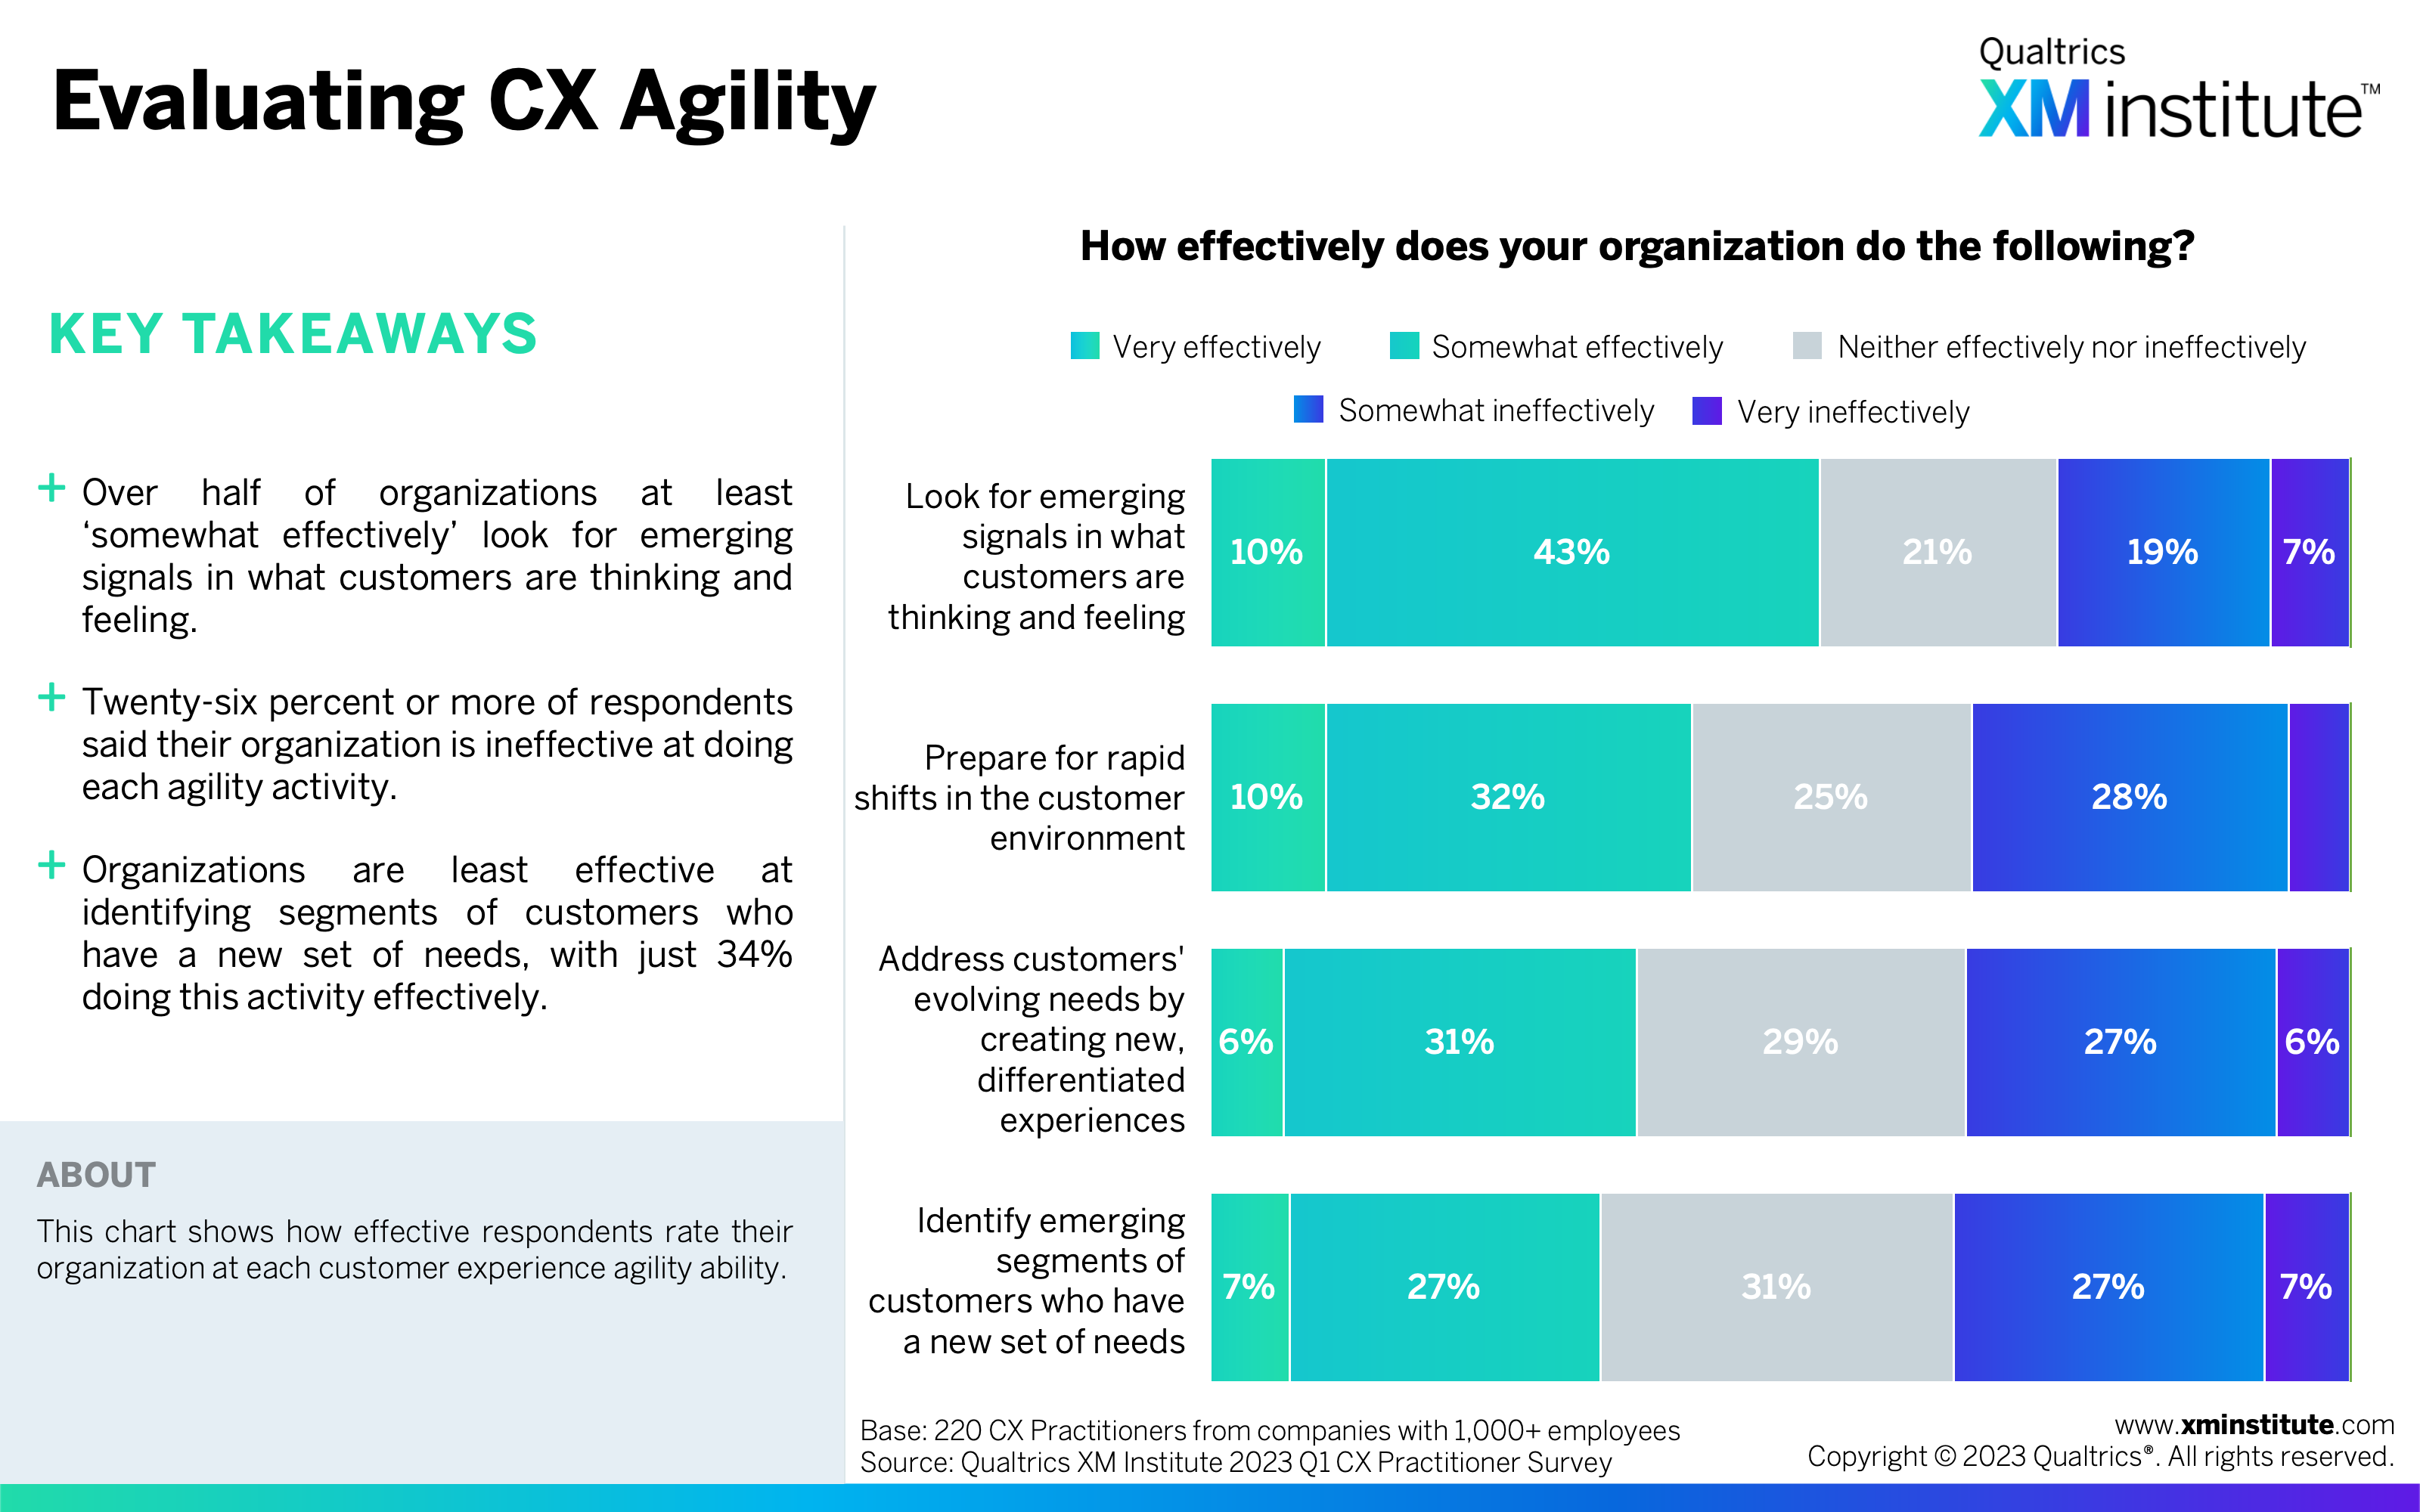
- Evaluating CX Agility (see Figure 5)
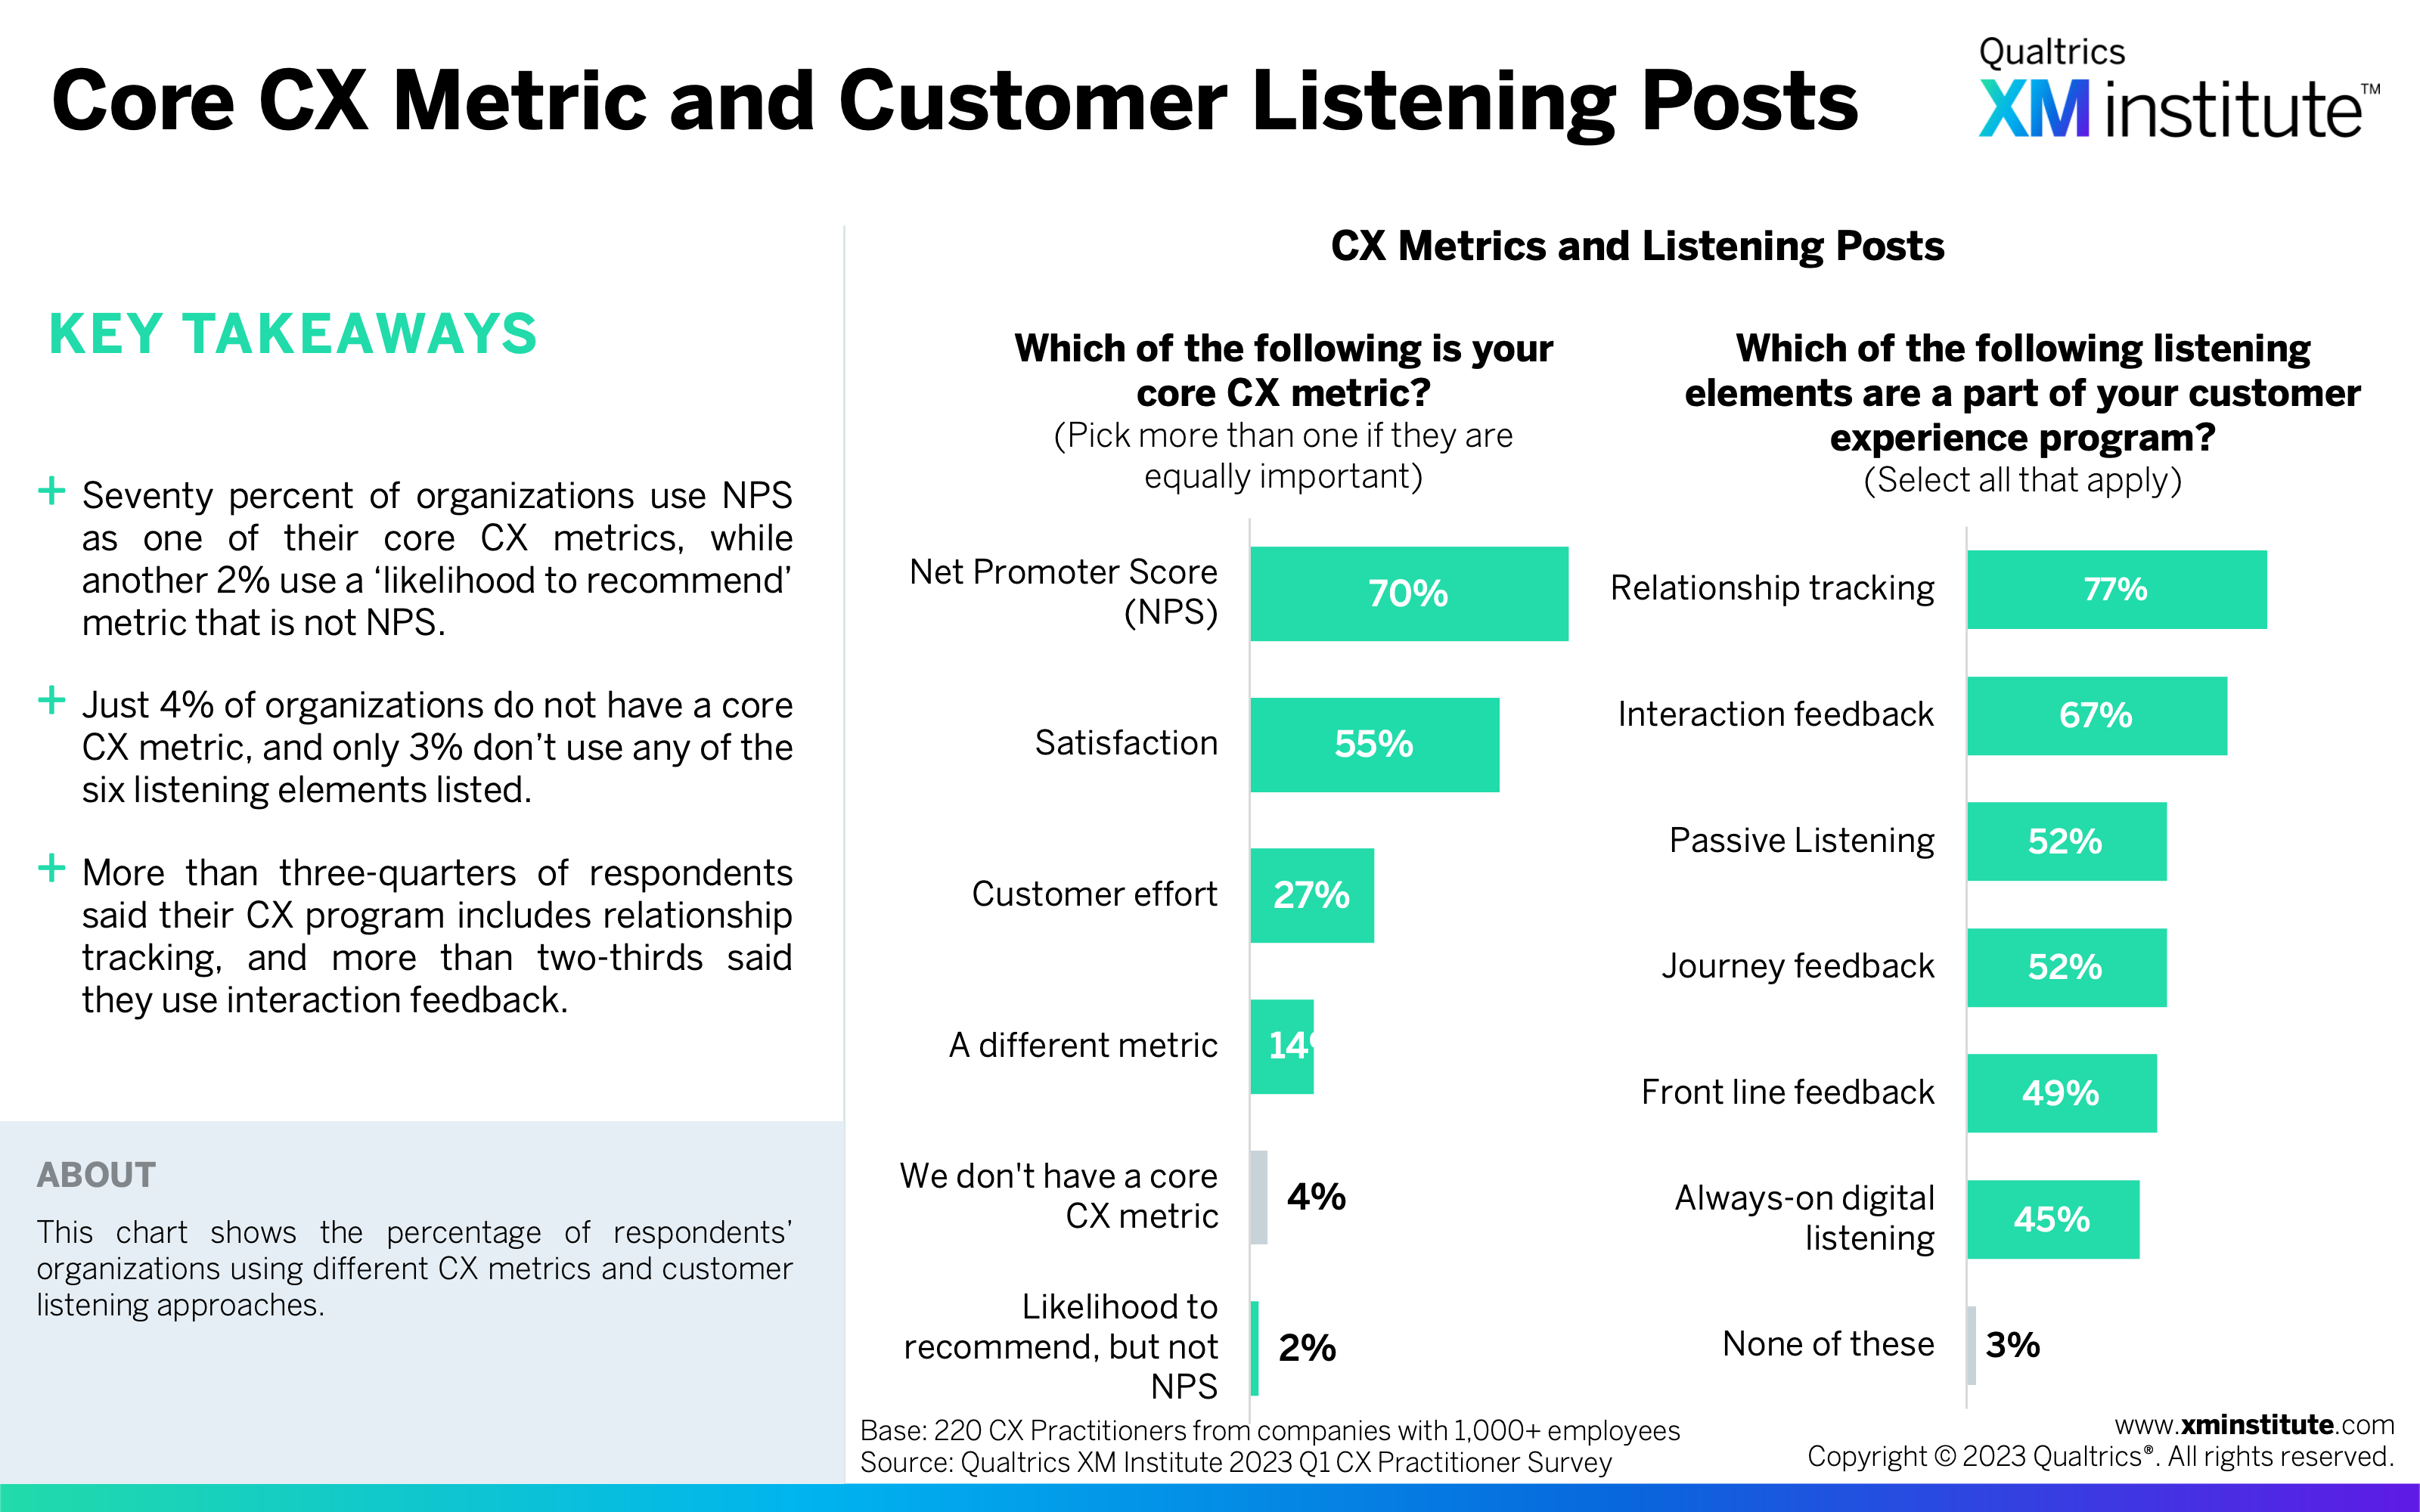
- Core CX Metric and Customer Listening Posts (see Figure 6)
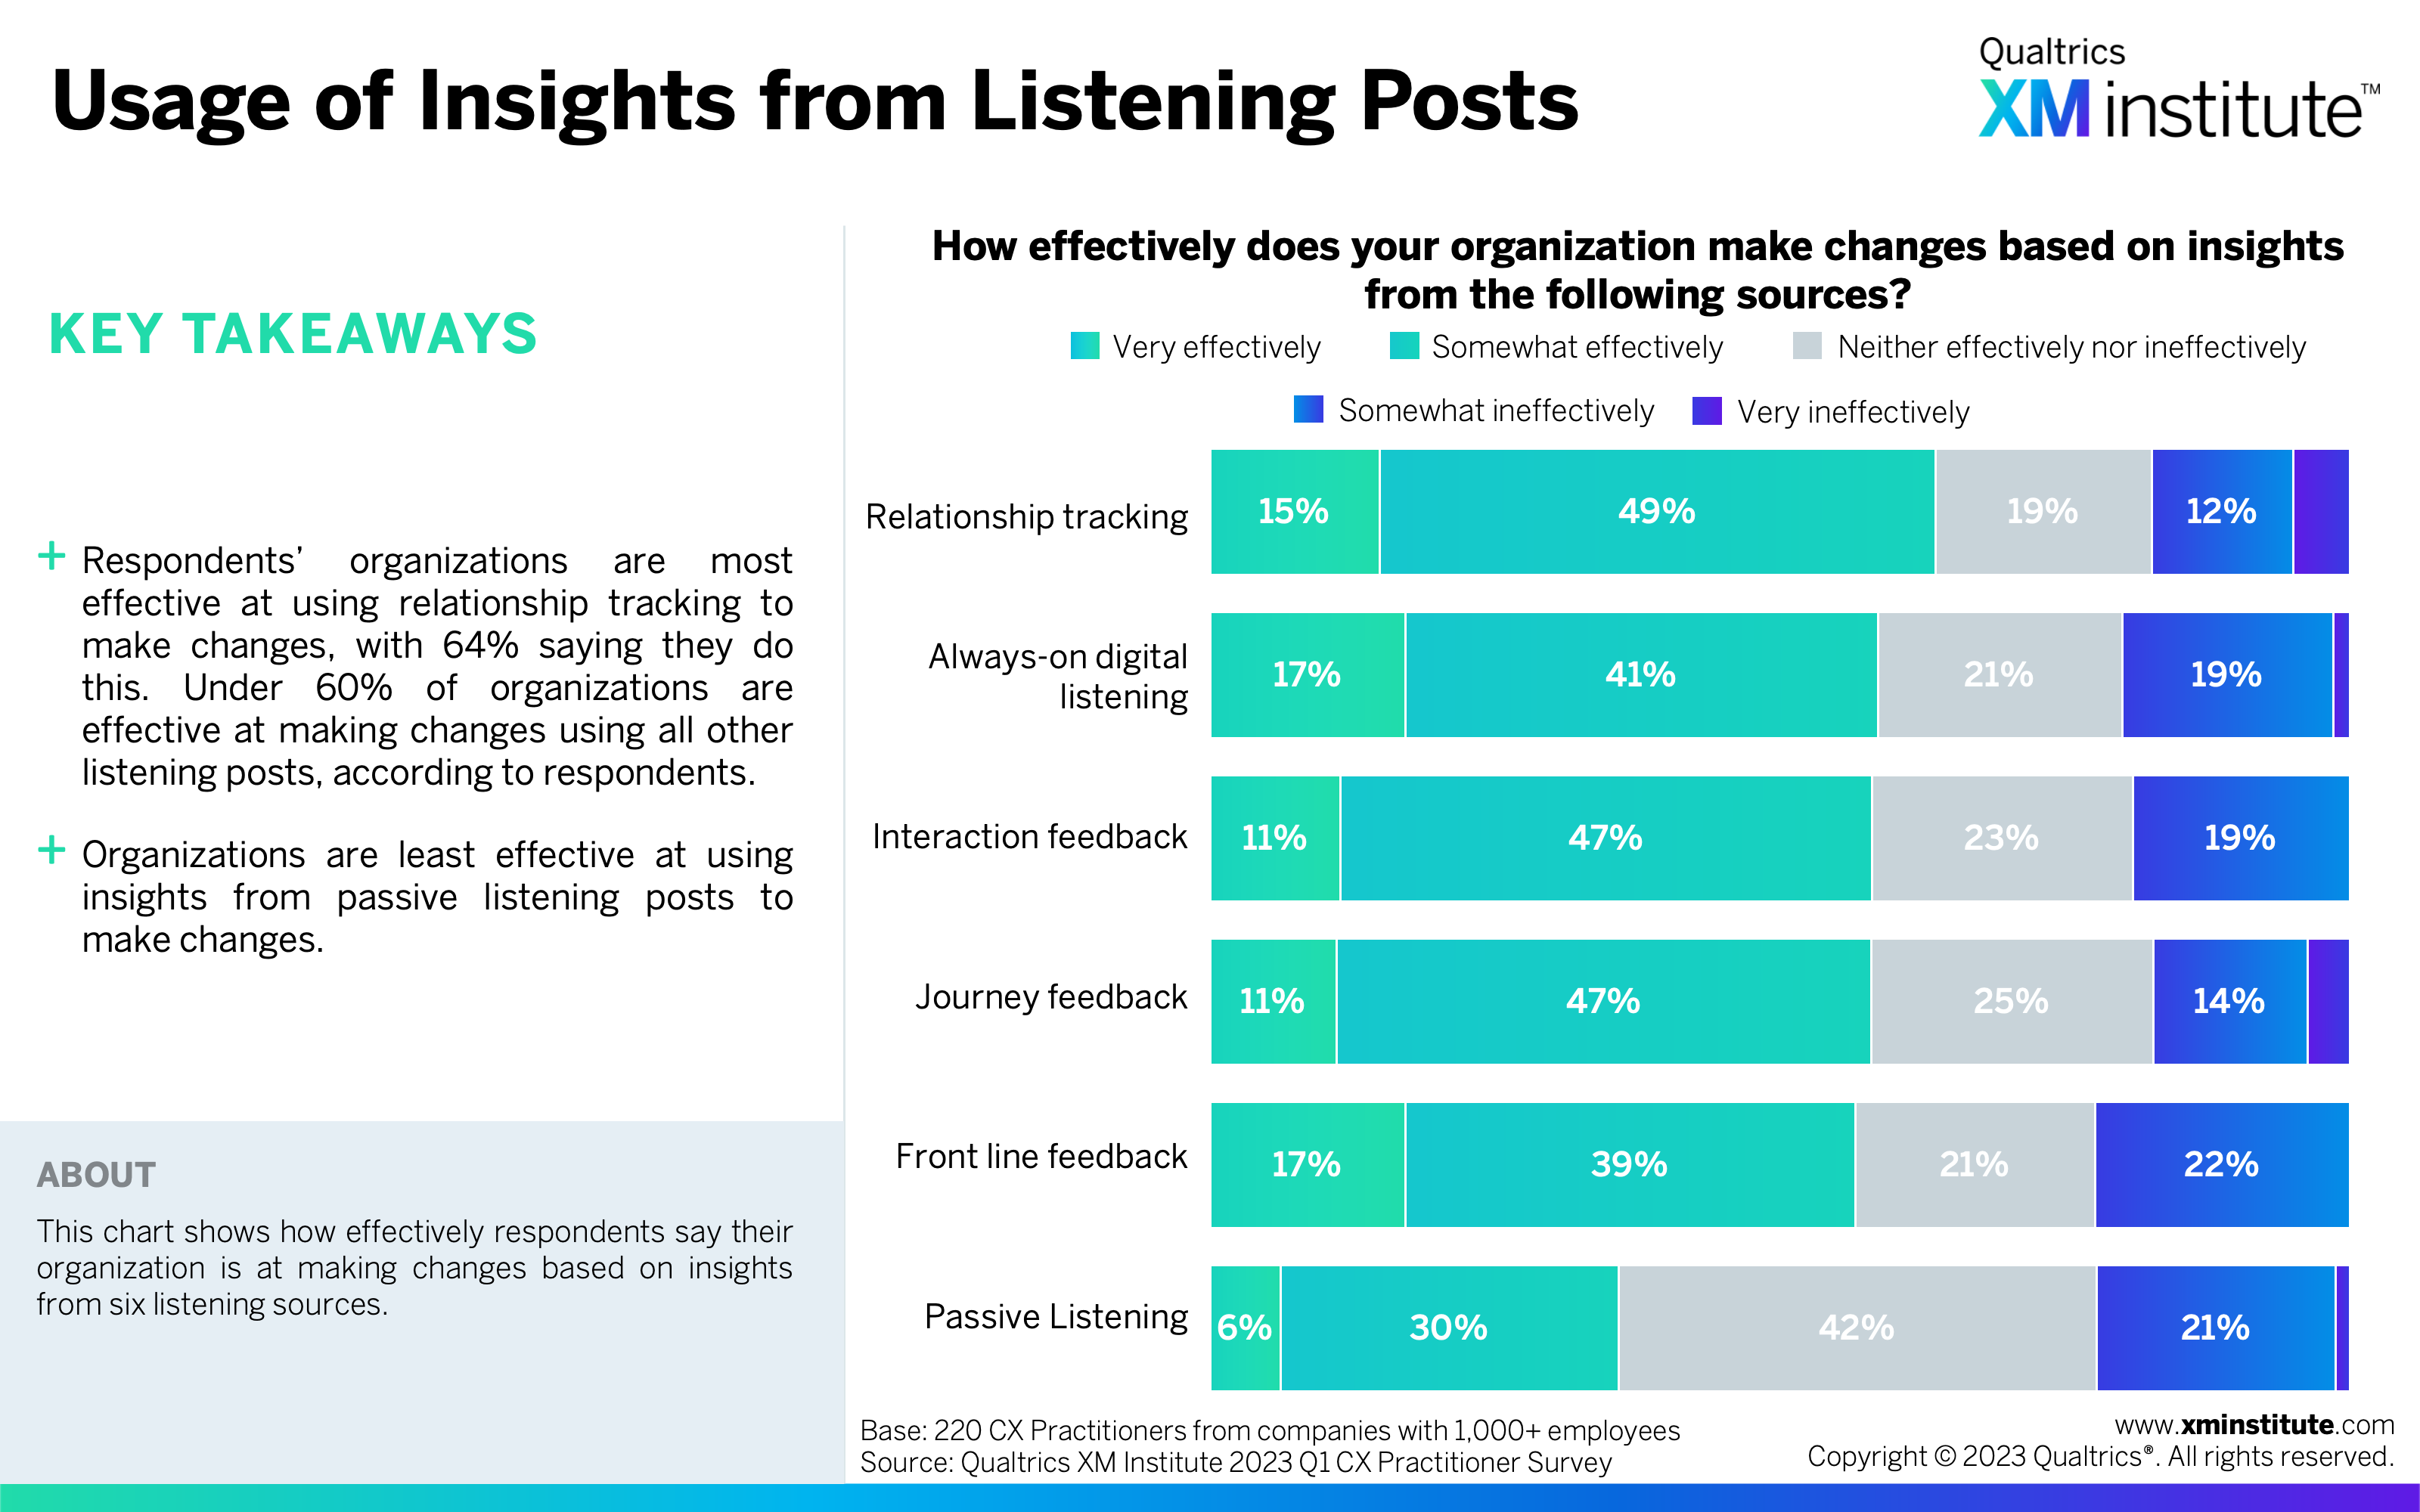
- Usage of Insights from Listening Posts (see Figure 7)
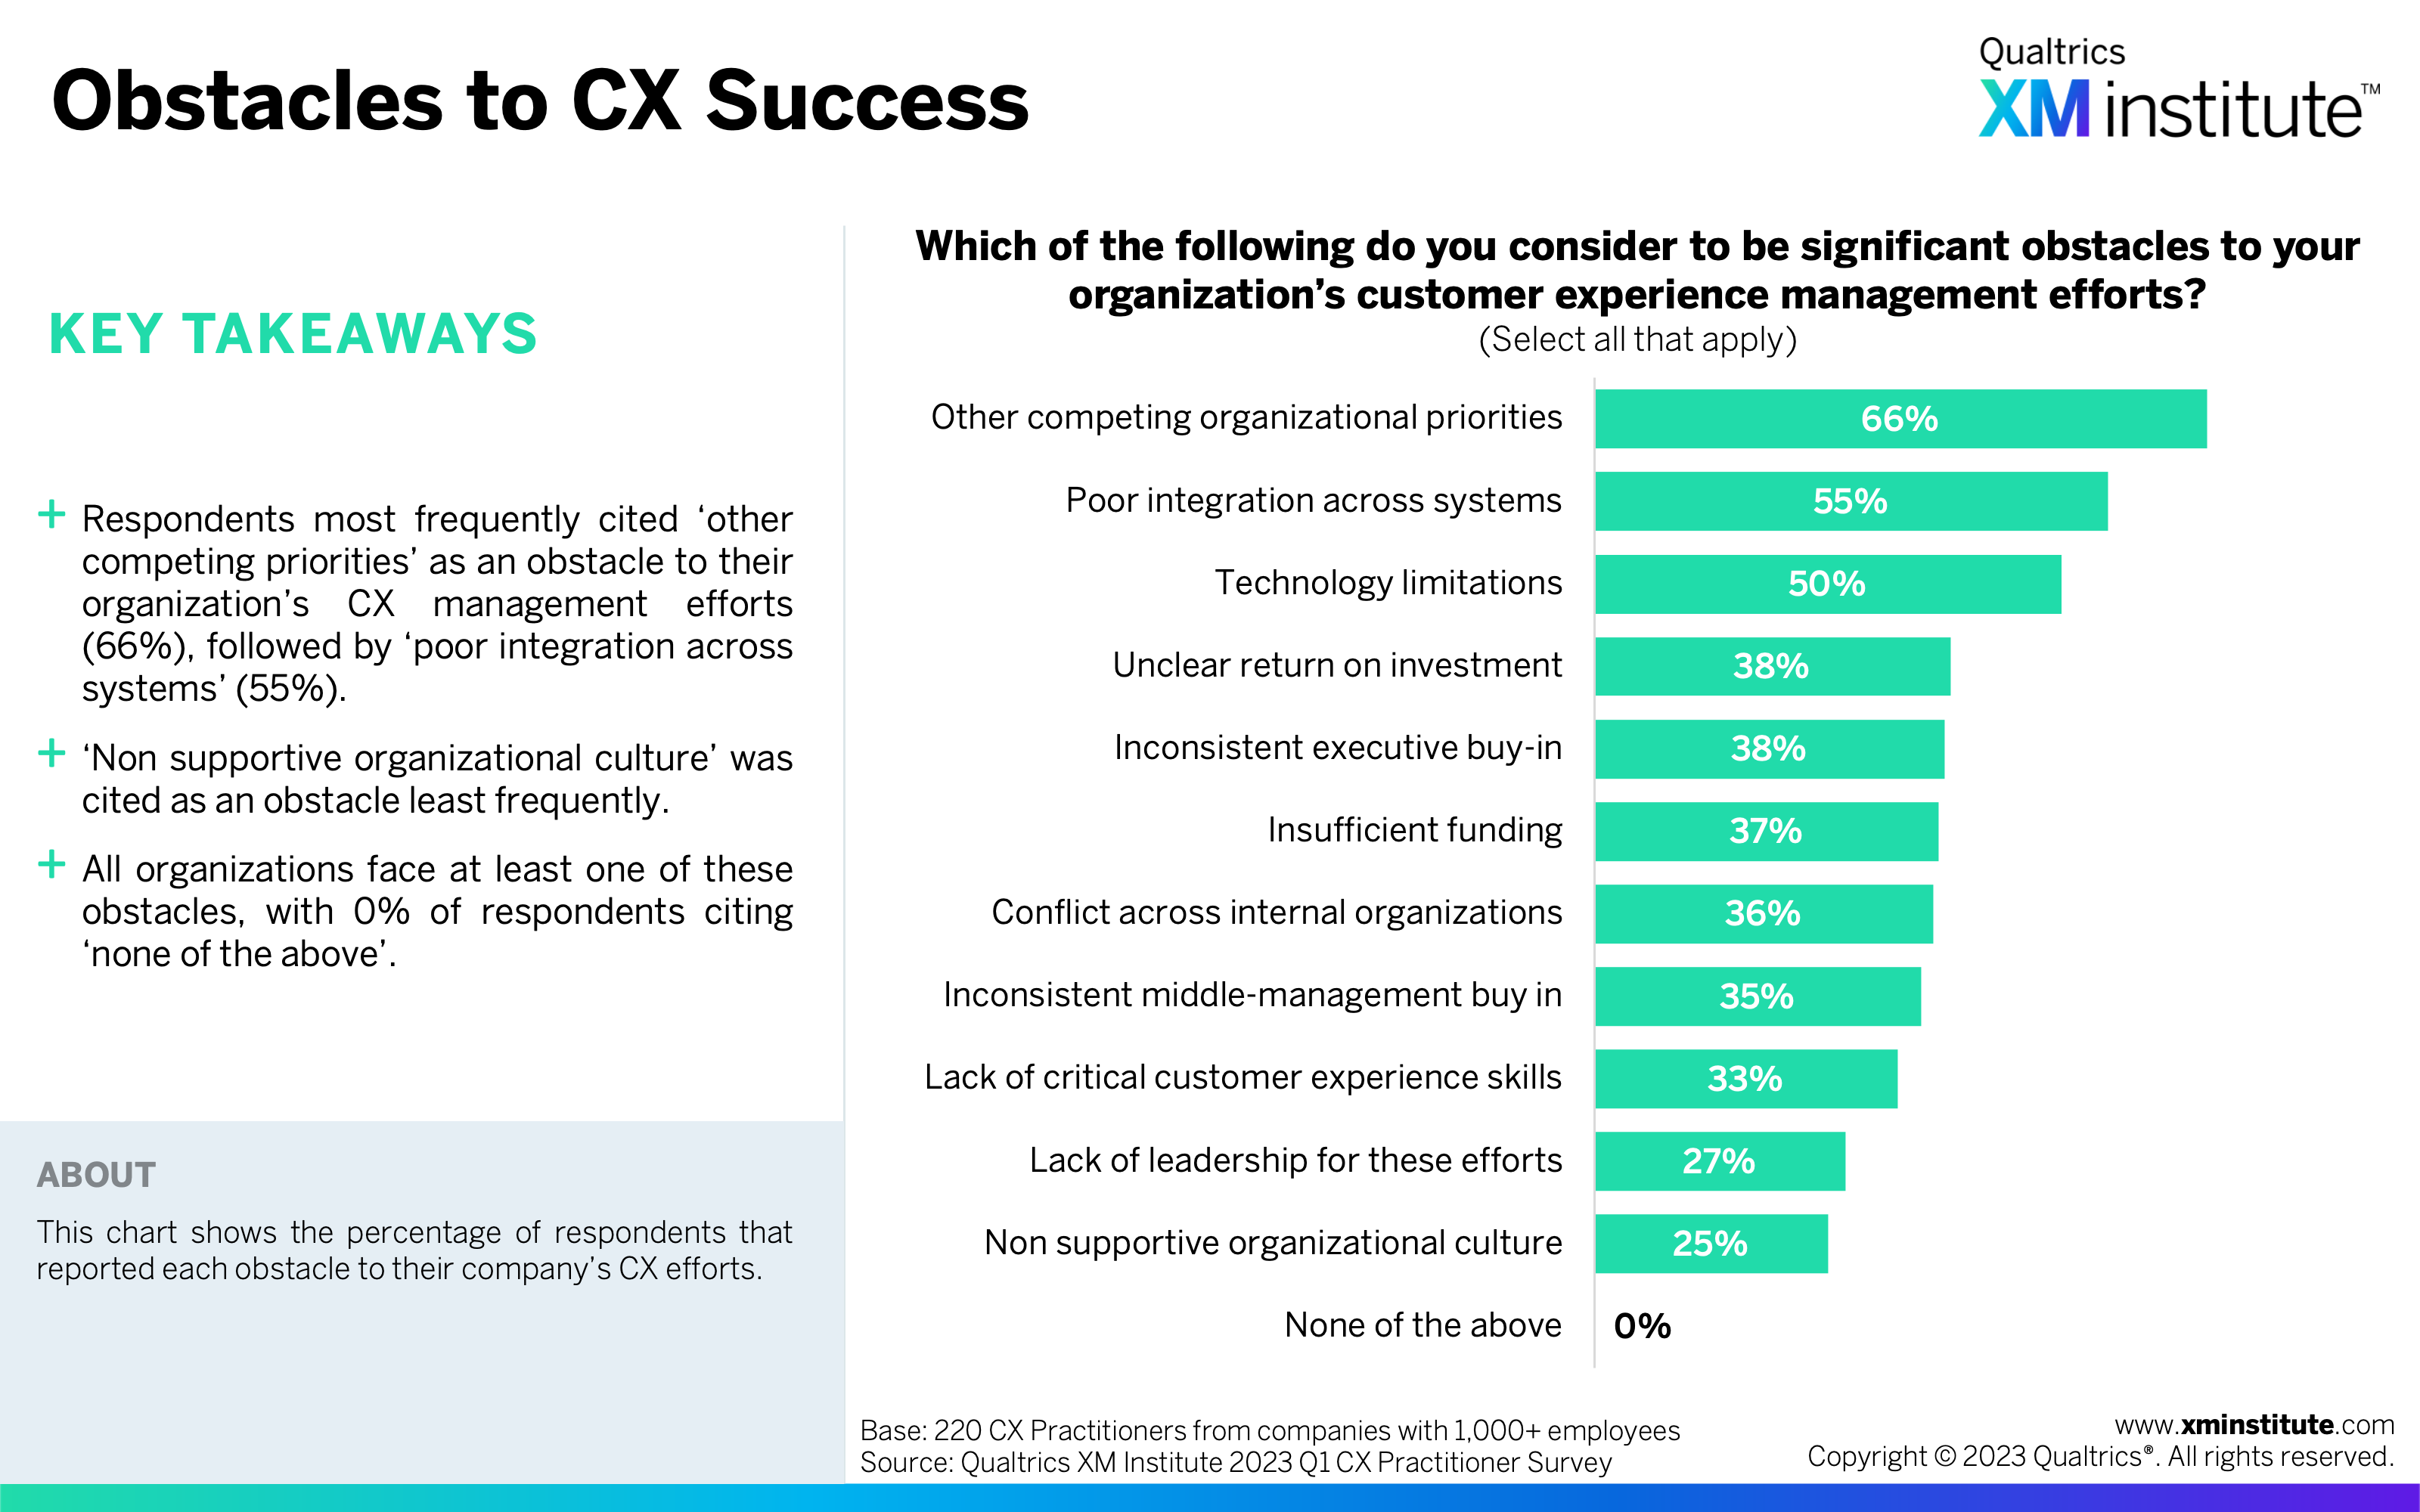
- Obstacles to CX Success (see Figure 8)
- Looking Ahead: CX Technologies (see Figure 9)
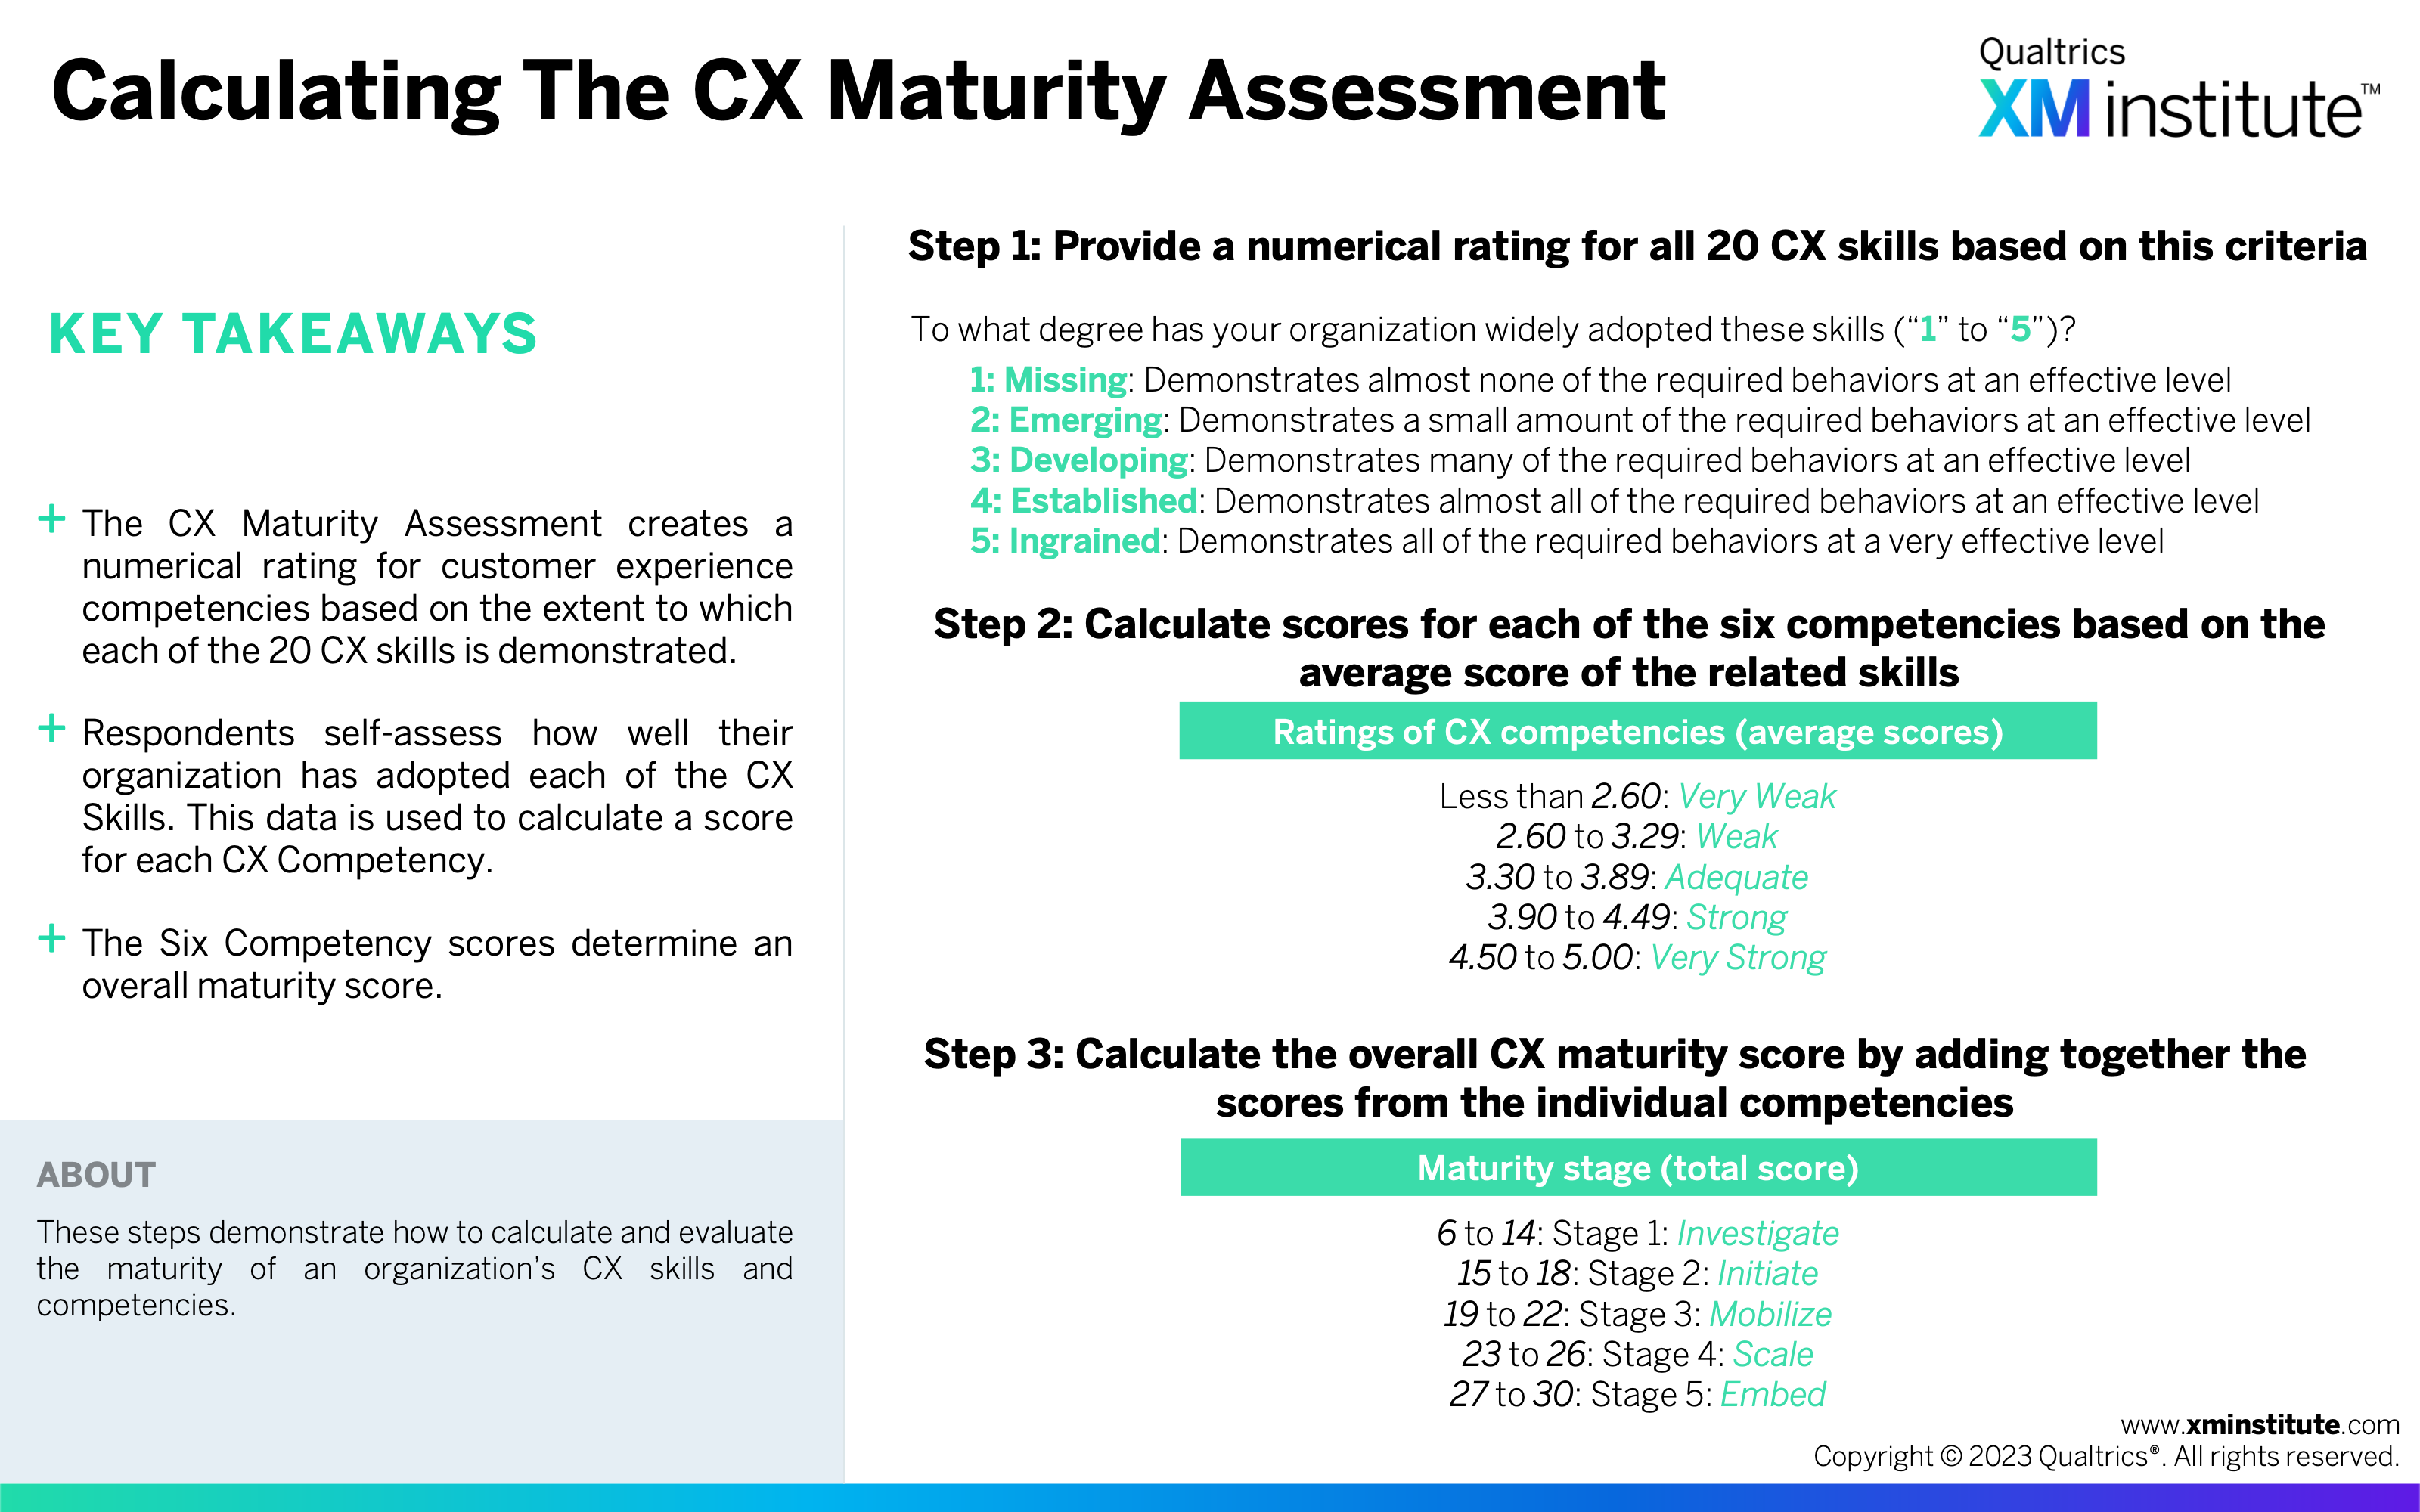
- Calculating the CX Maturity Assessment (see Figure 10)
- CX Competency and Maturity Results (see Figure 11)
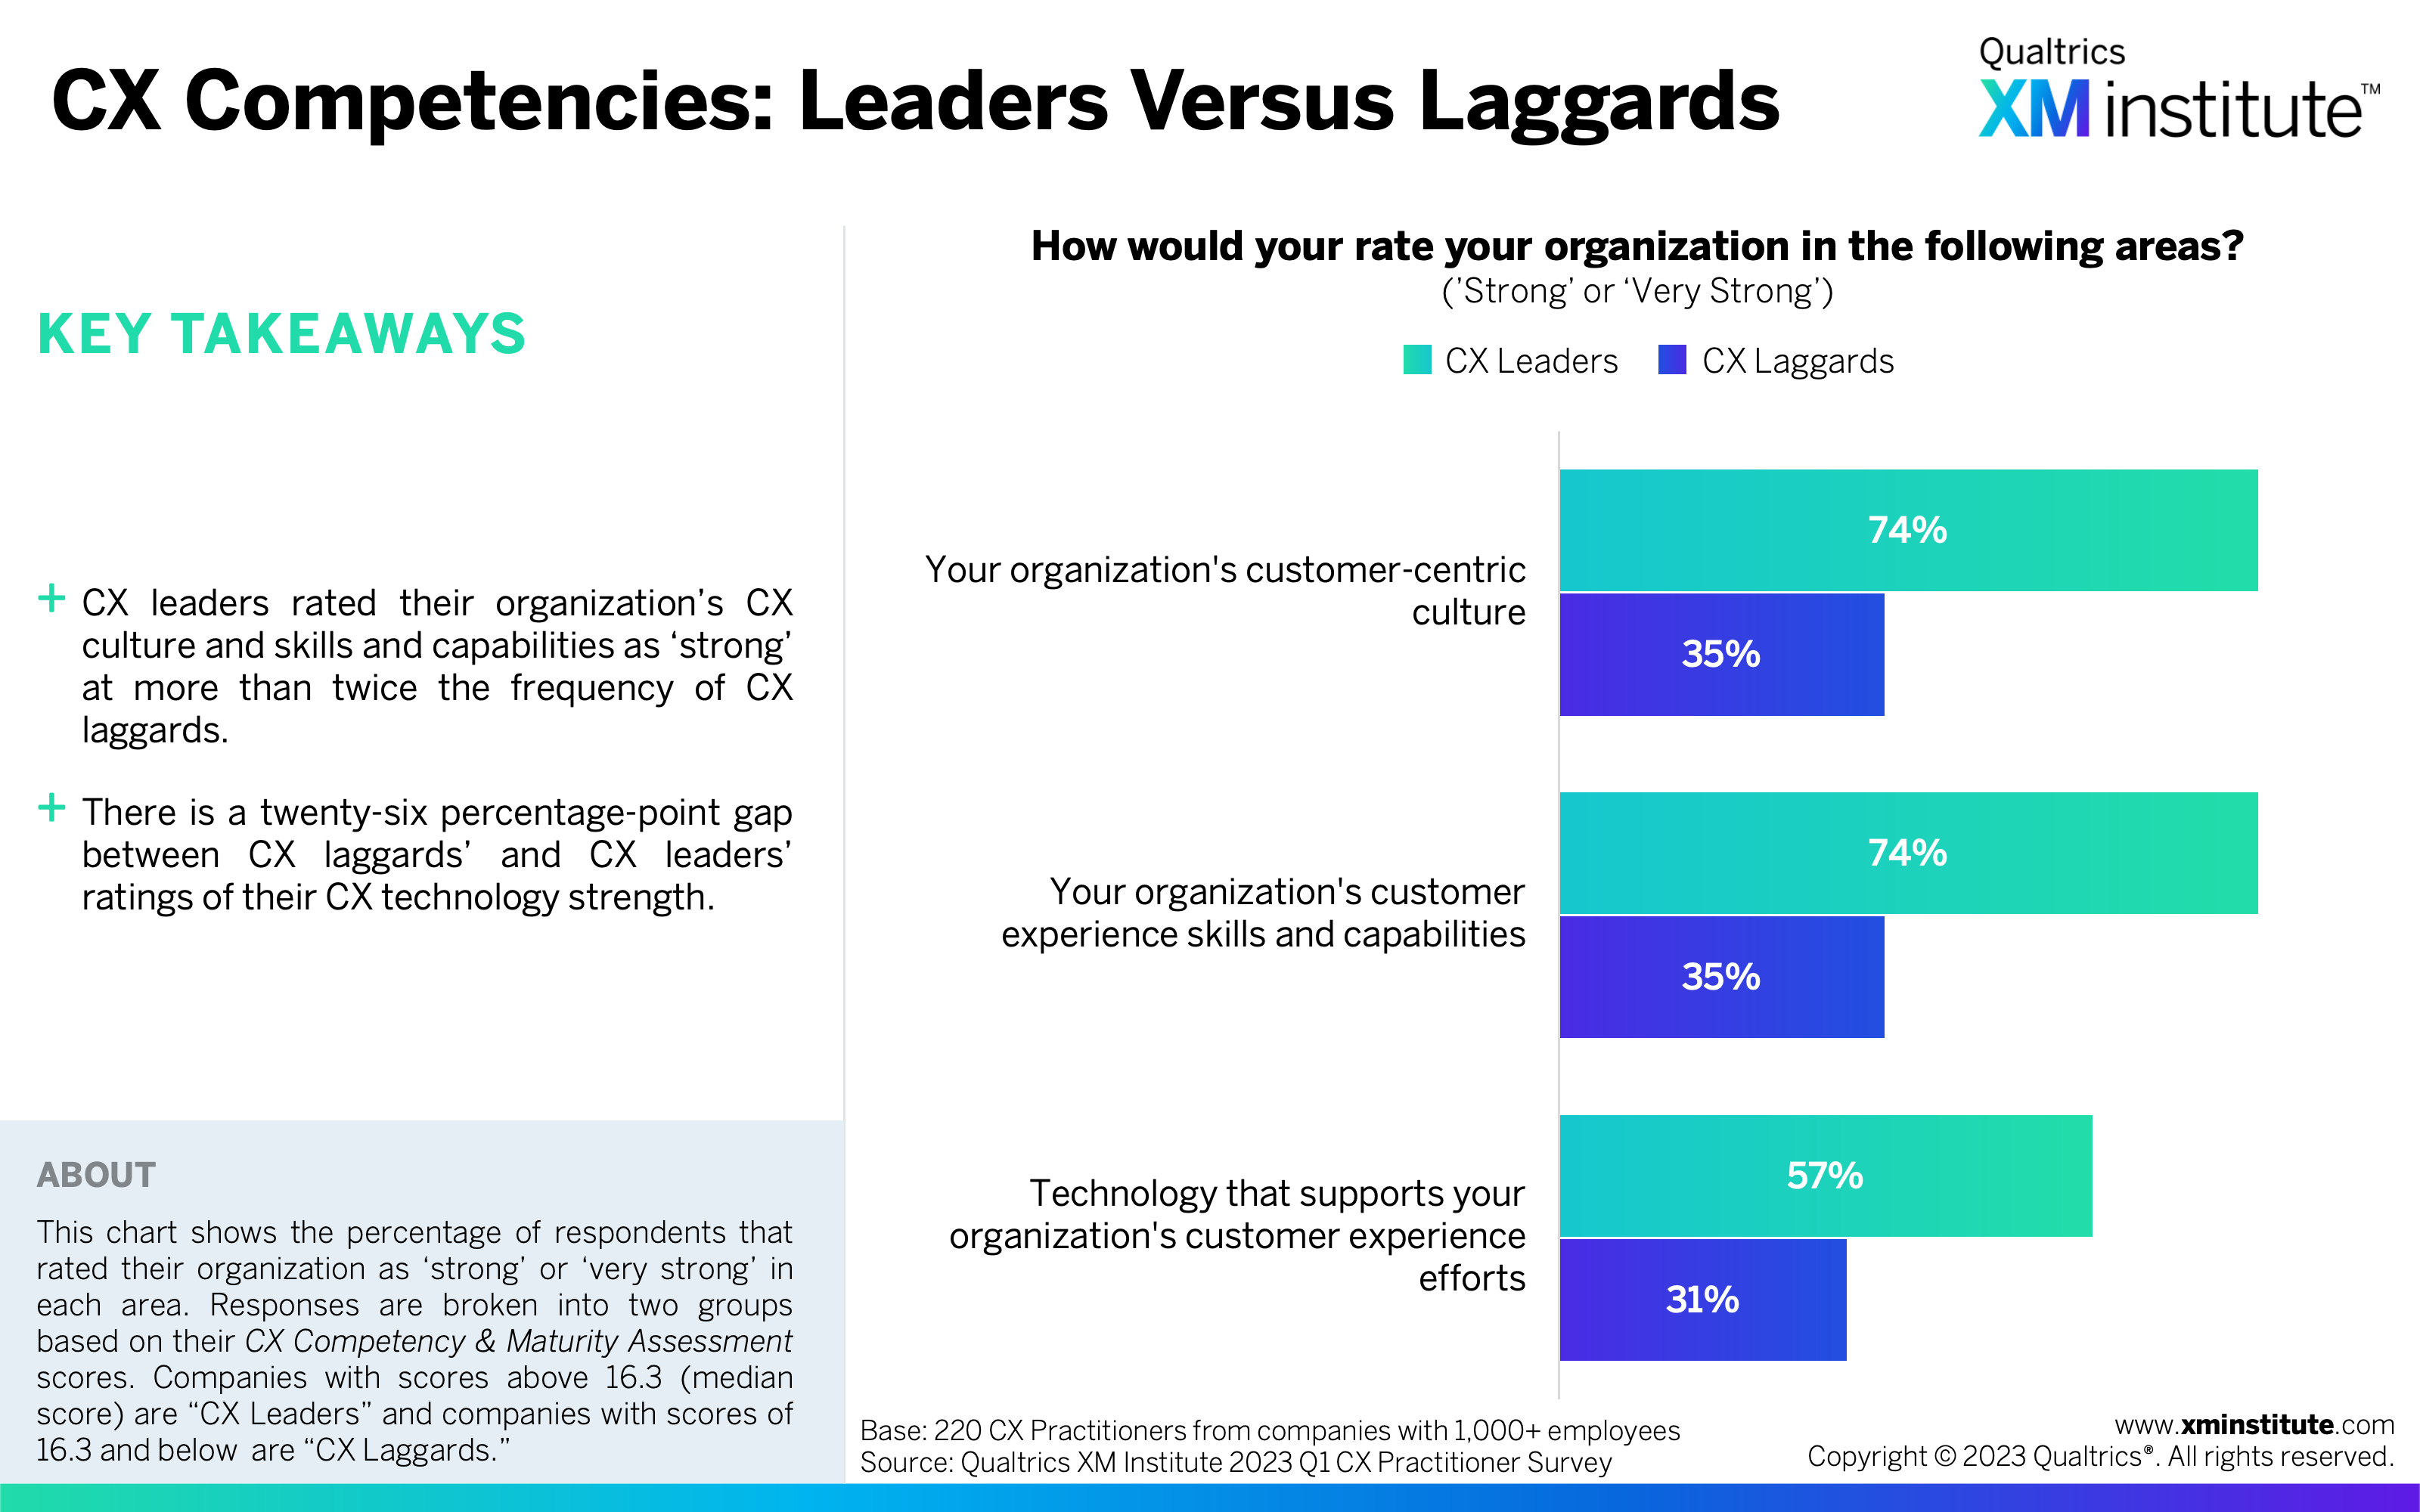
- CX Competencies: Leaders Versus Laggards (see Figure 12)
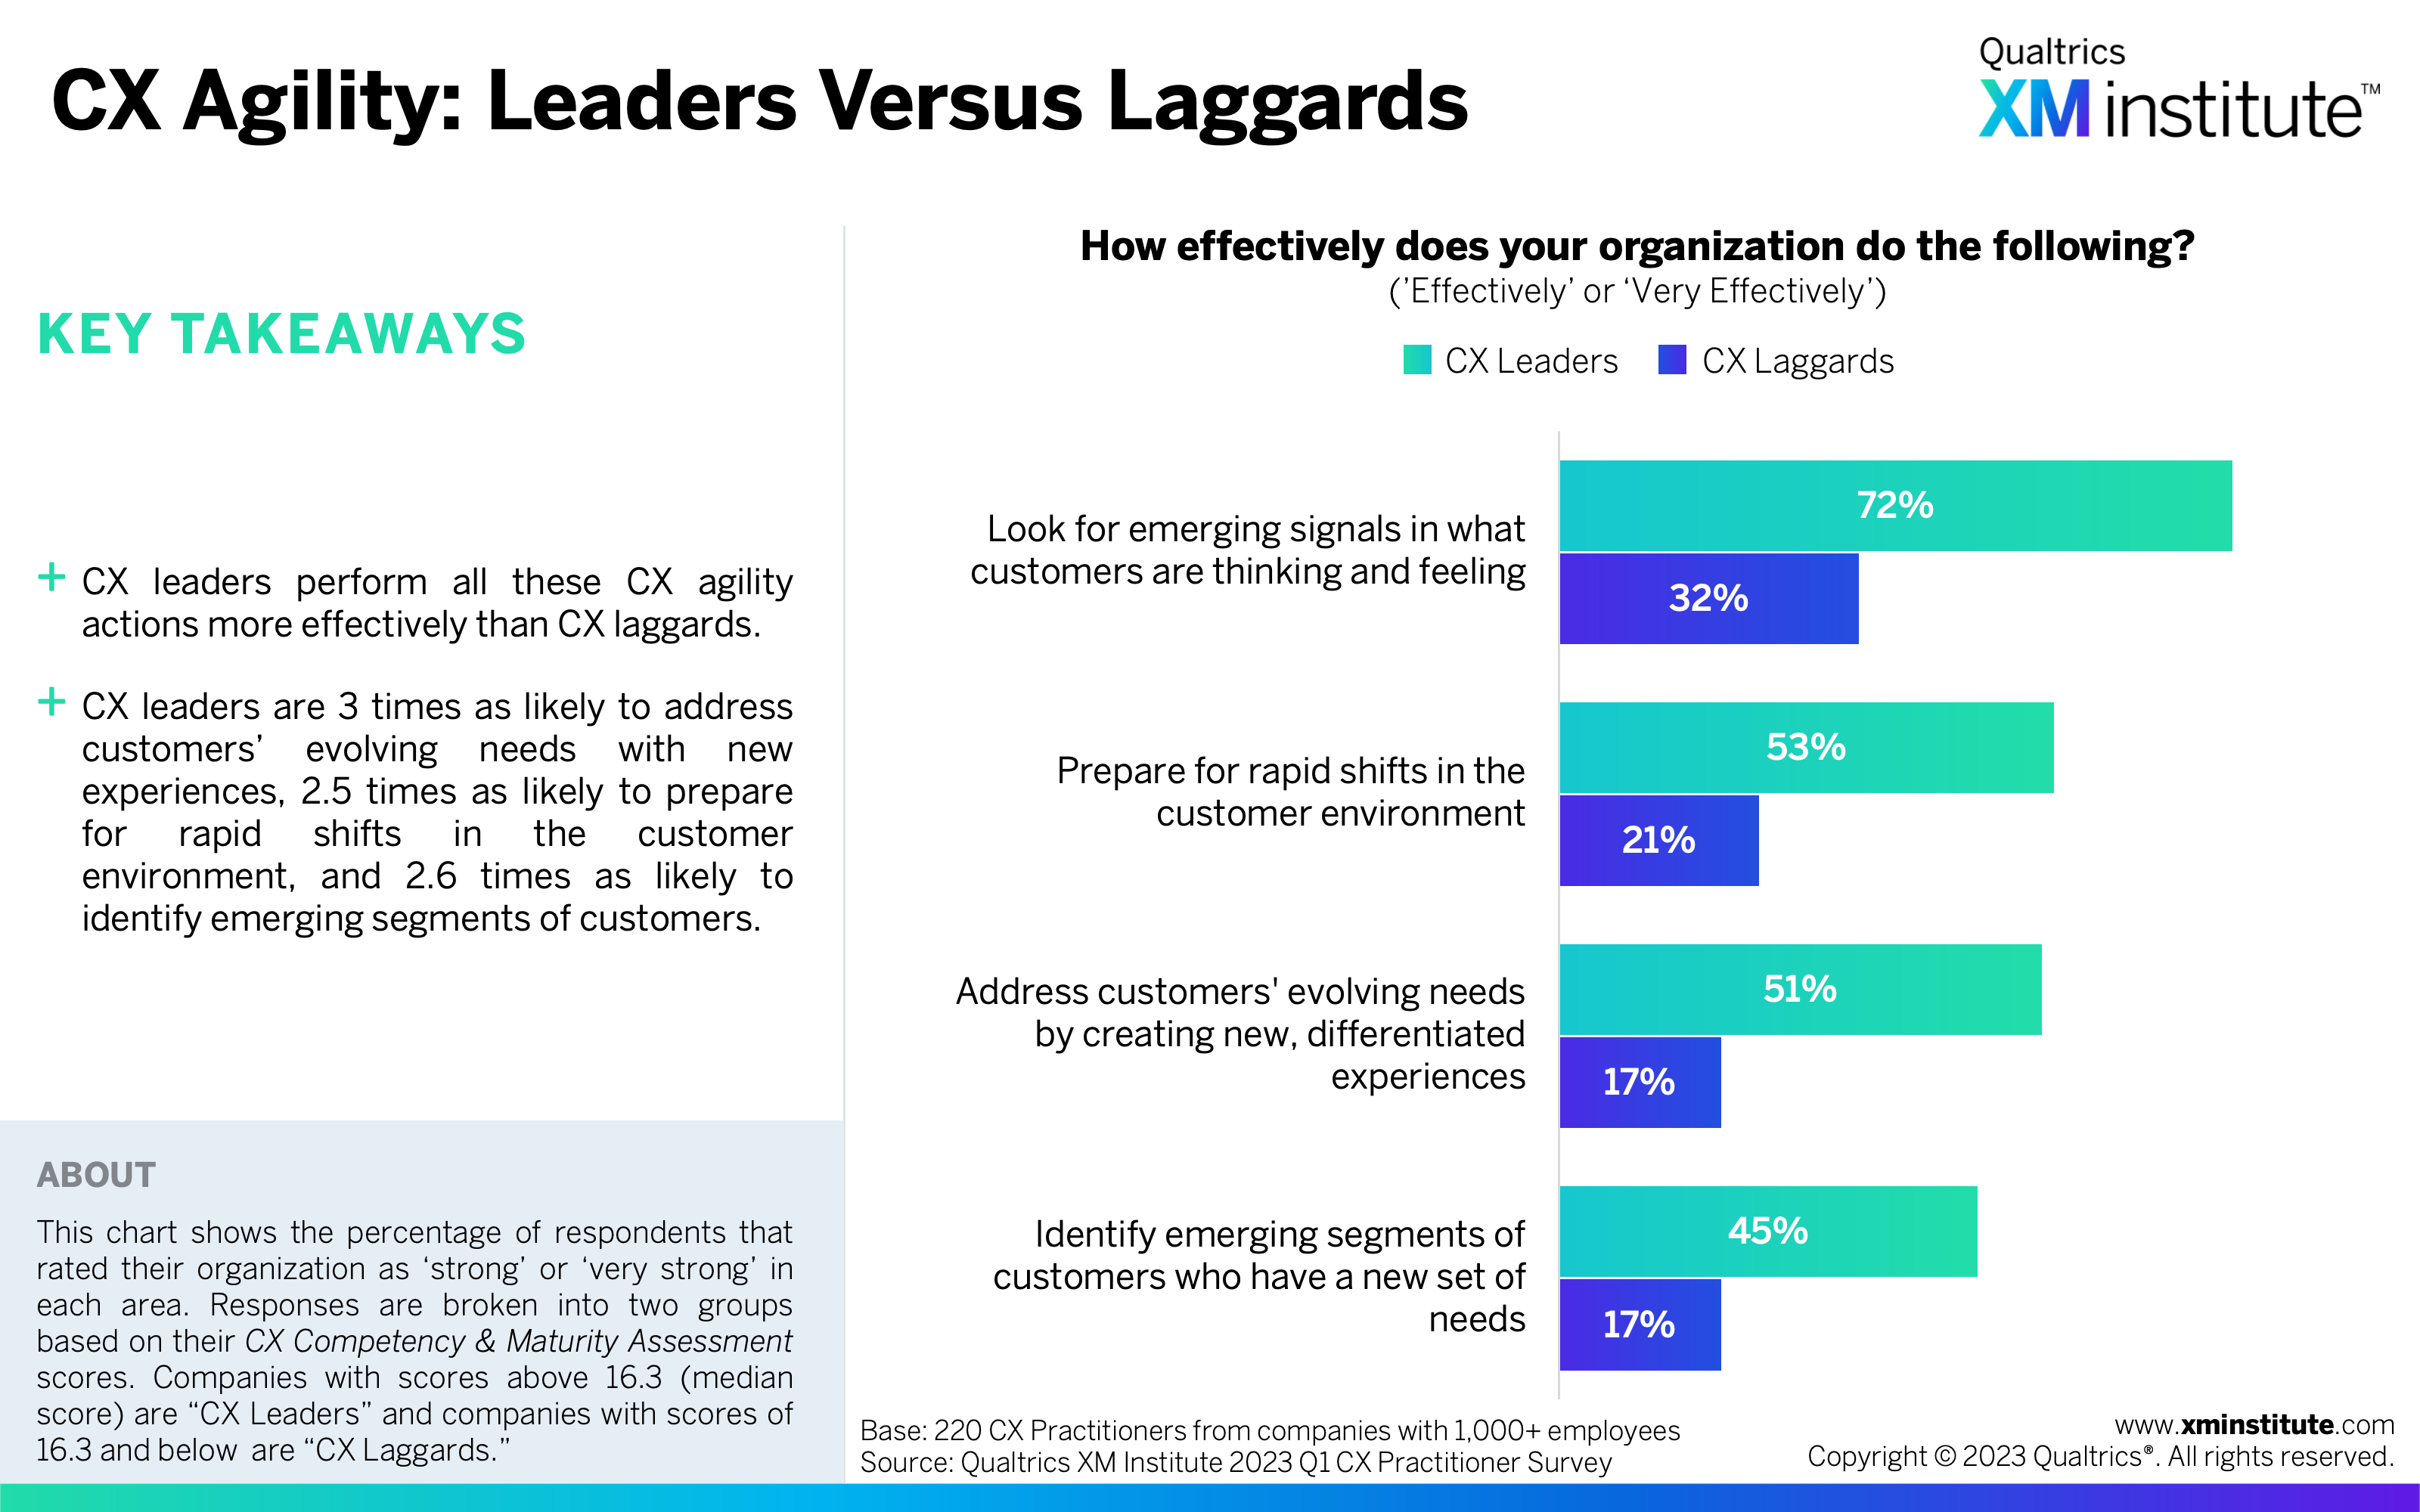
- CX Agility: Leaders Versus Laggards (see Figure 13)
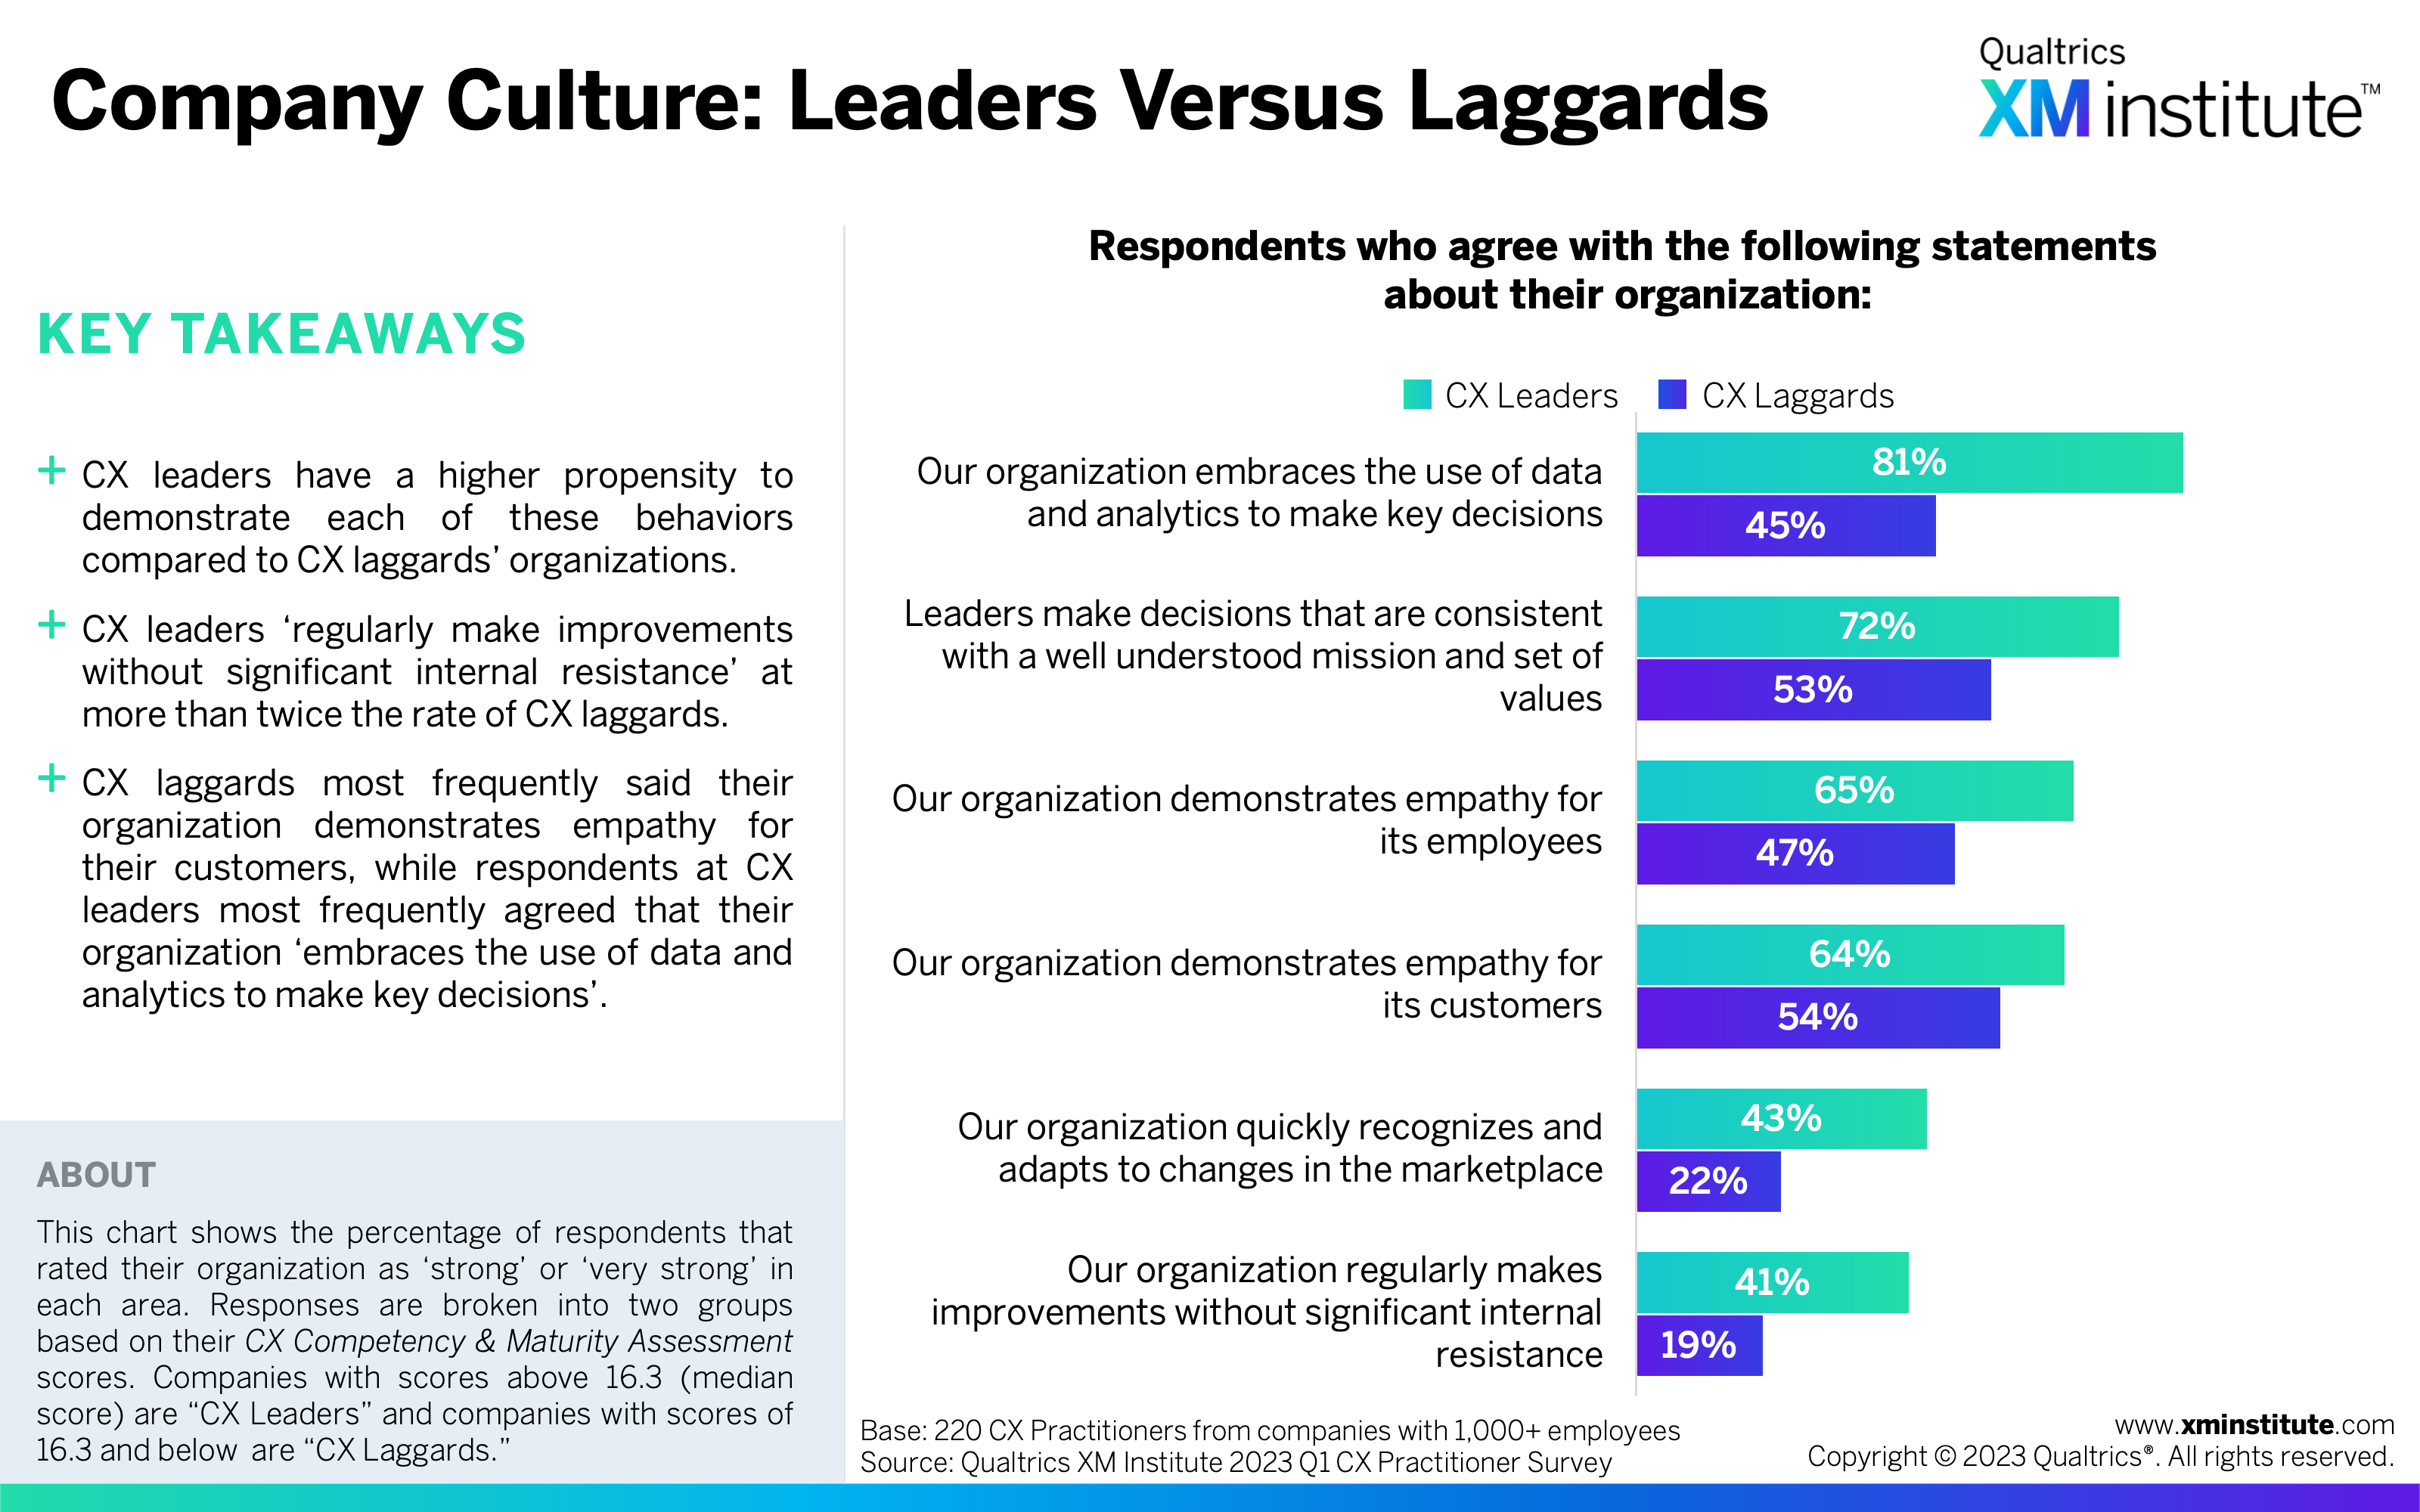
- Company Culture: Leaders Versus Laggards (see Figure 14)
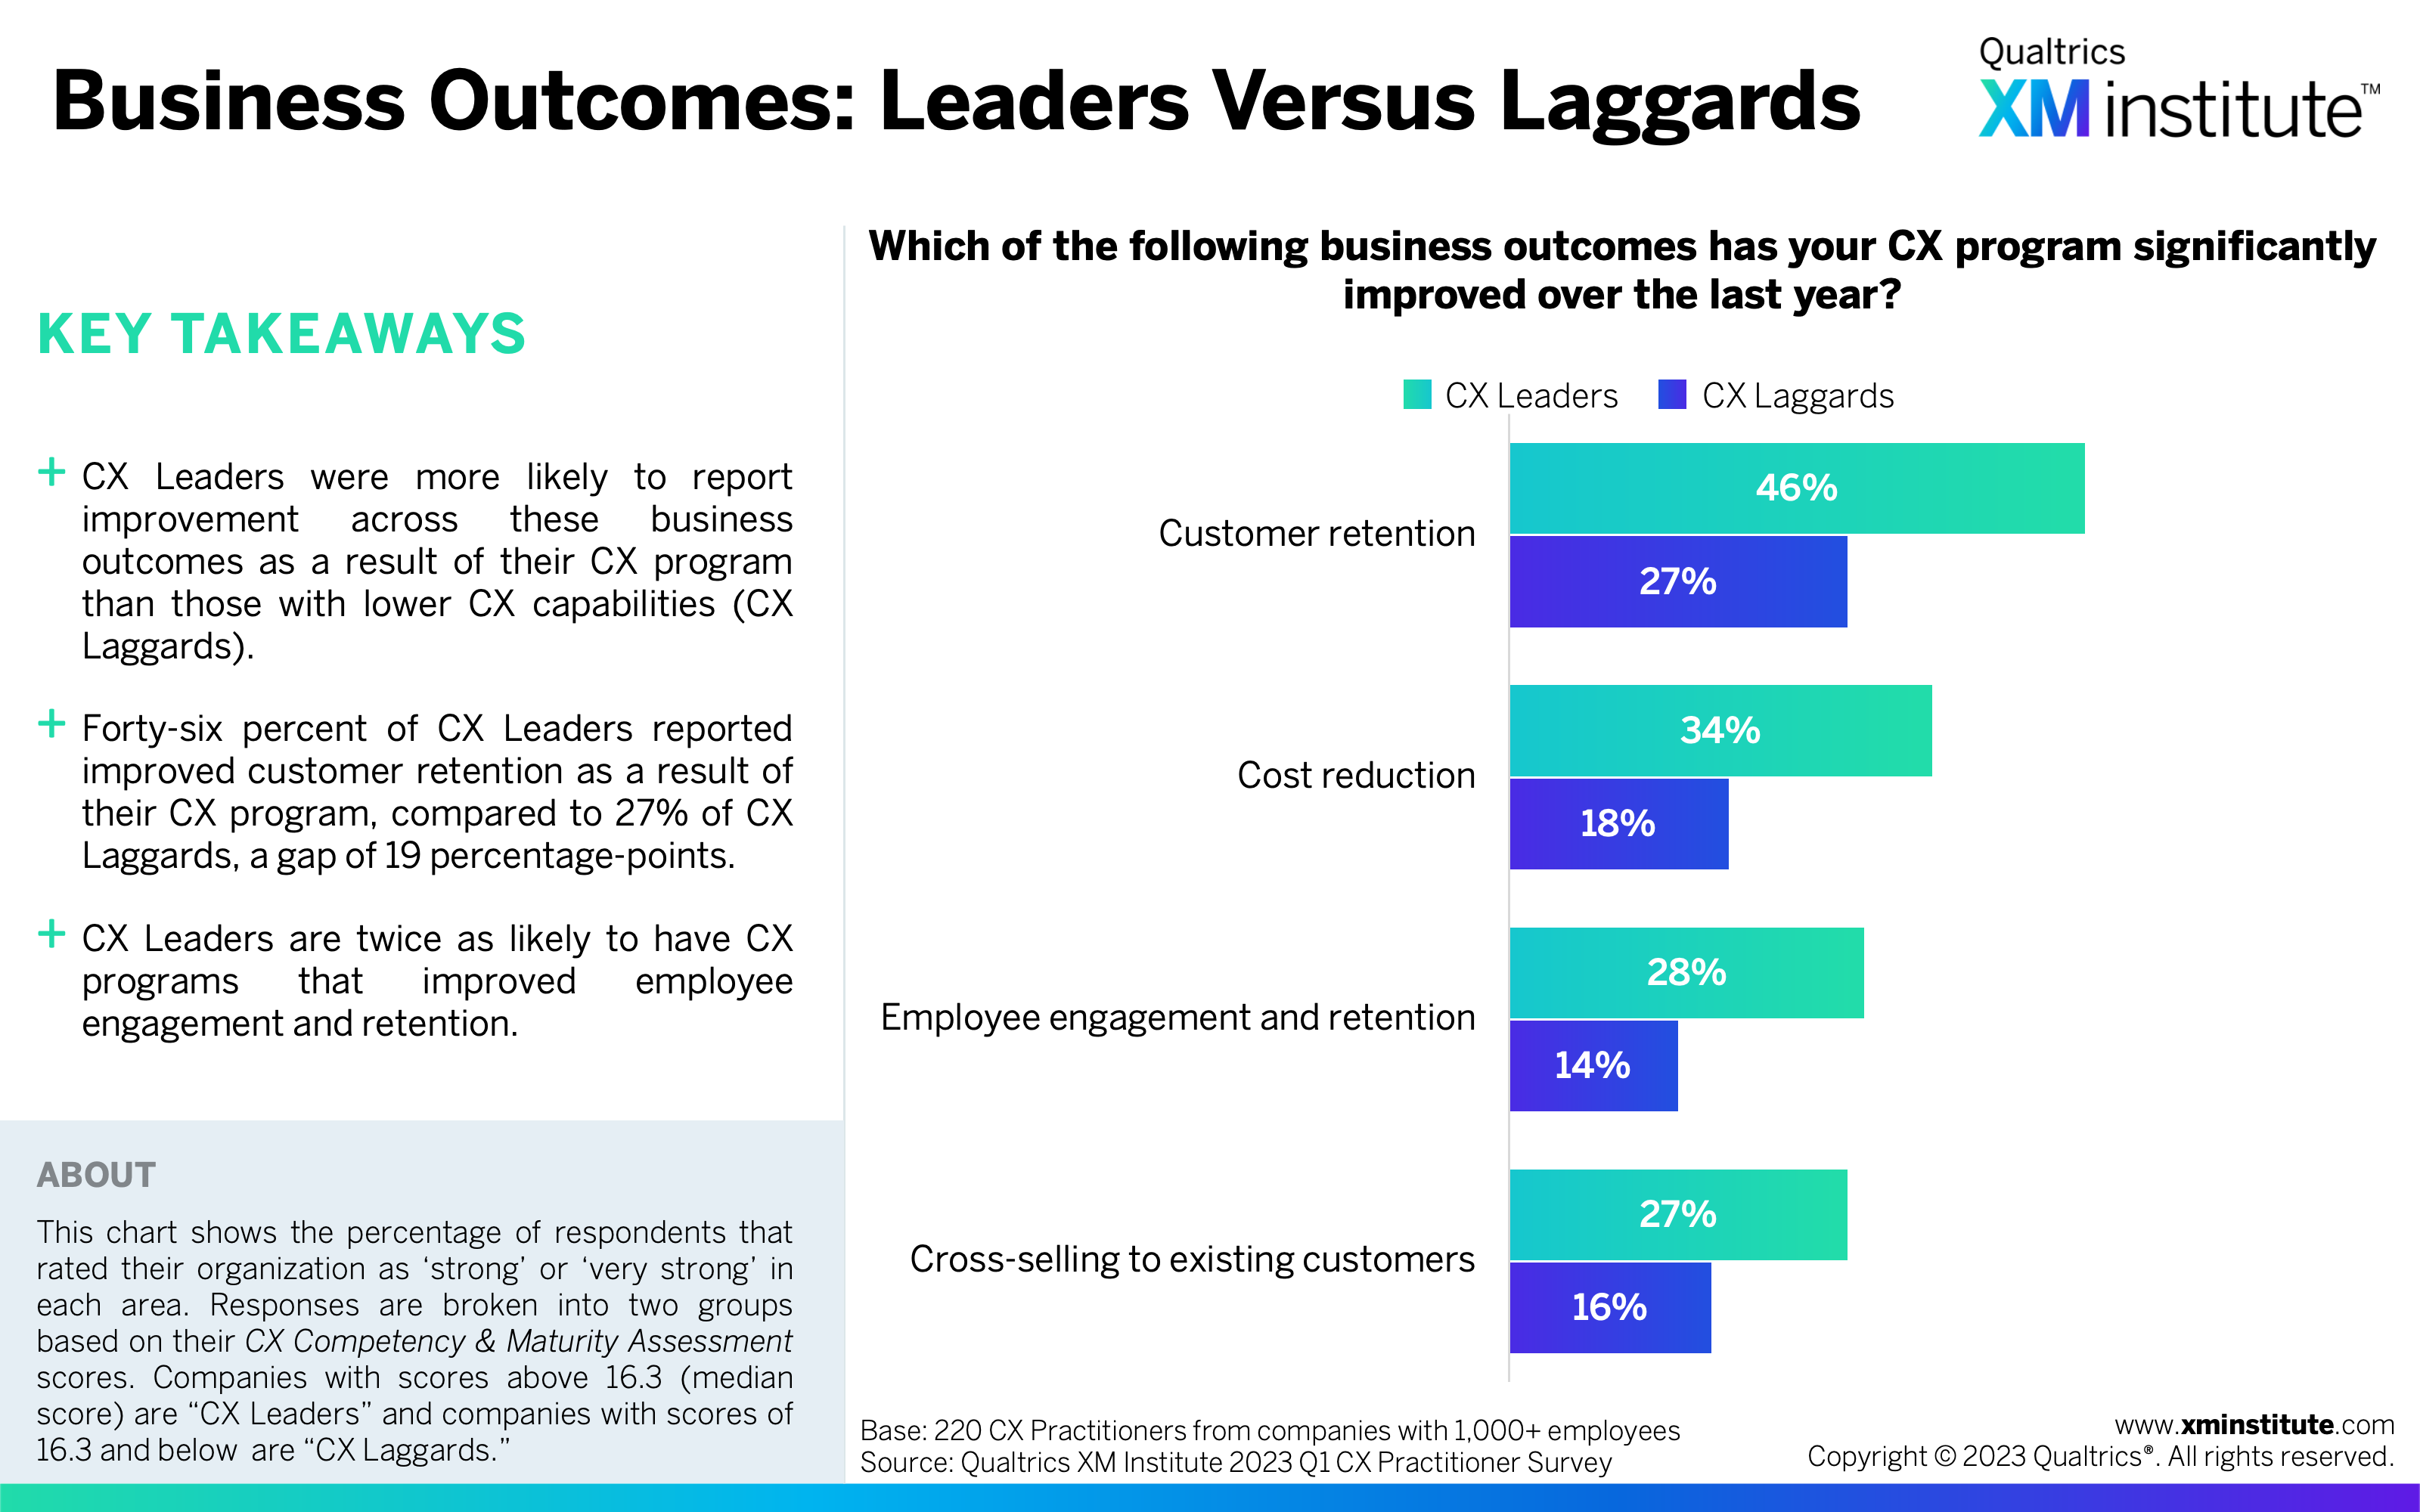
- Business Outcomes: Leaders Versus Laggards (see Figure 15)
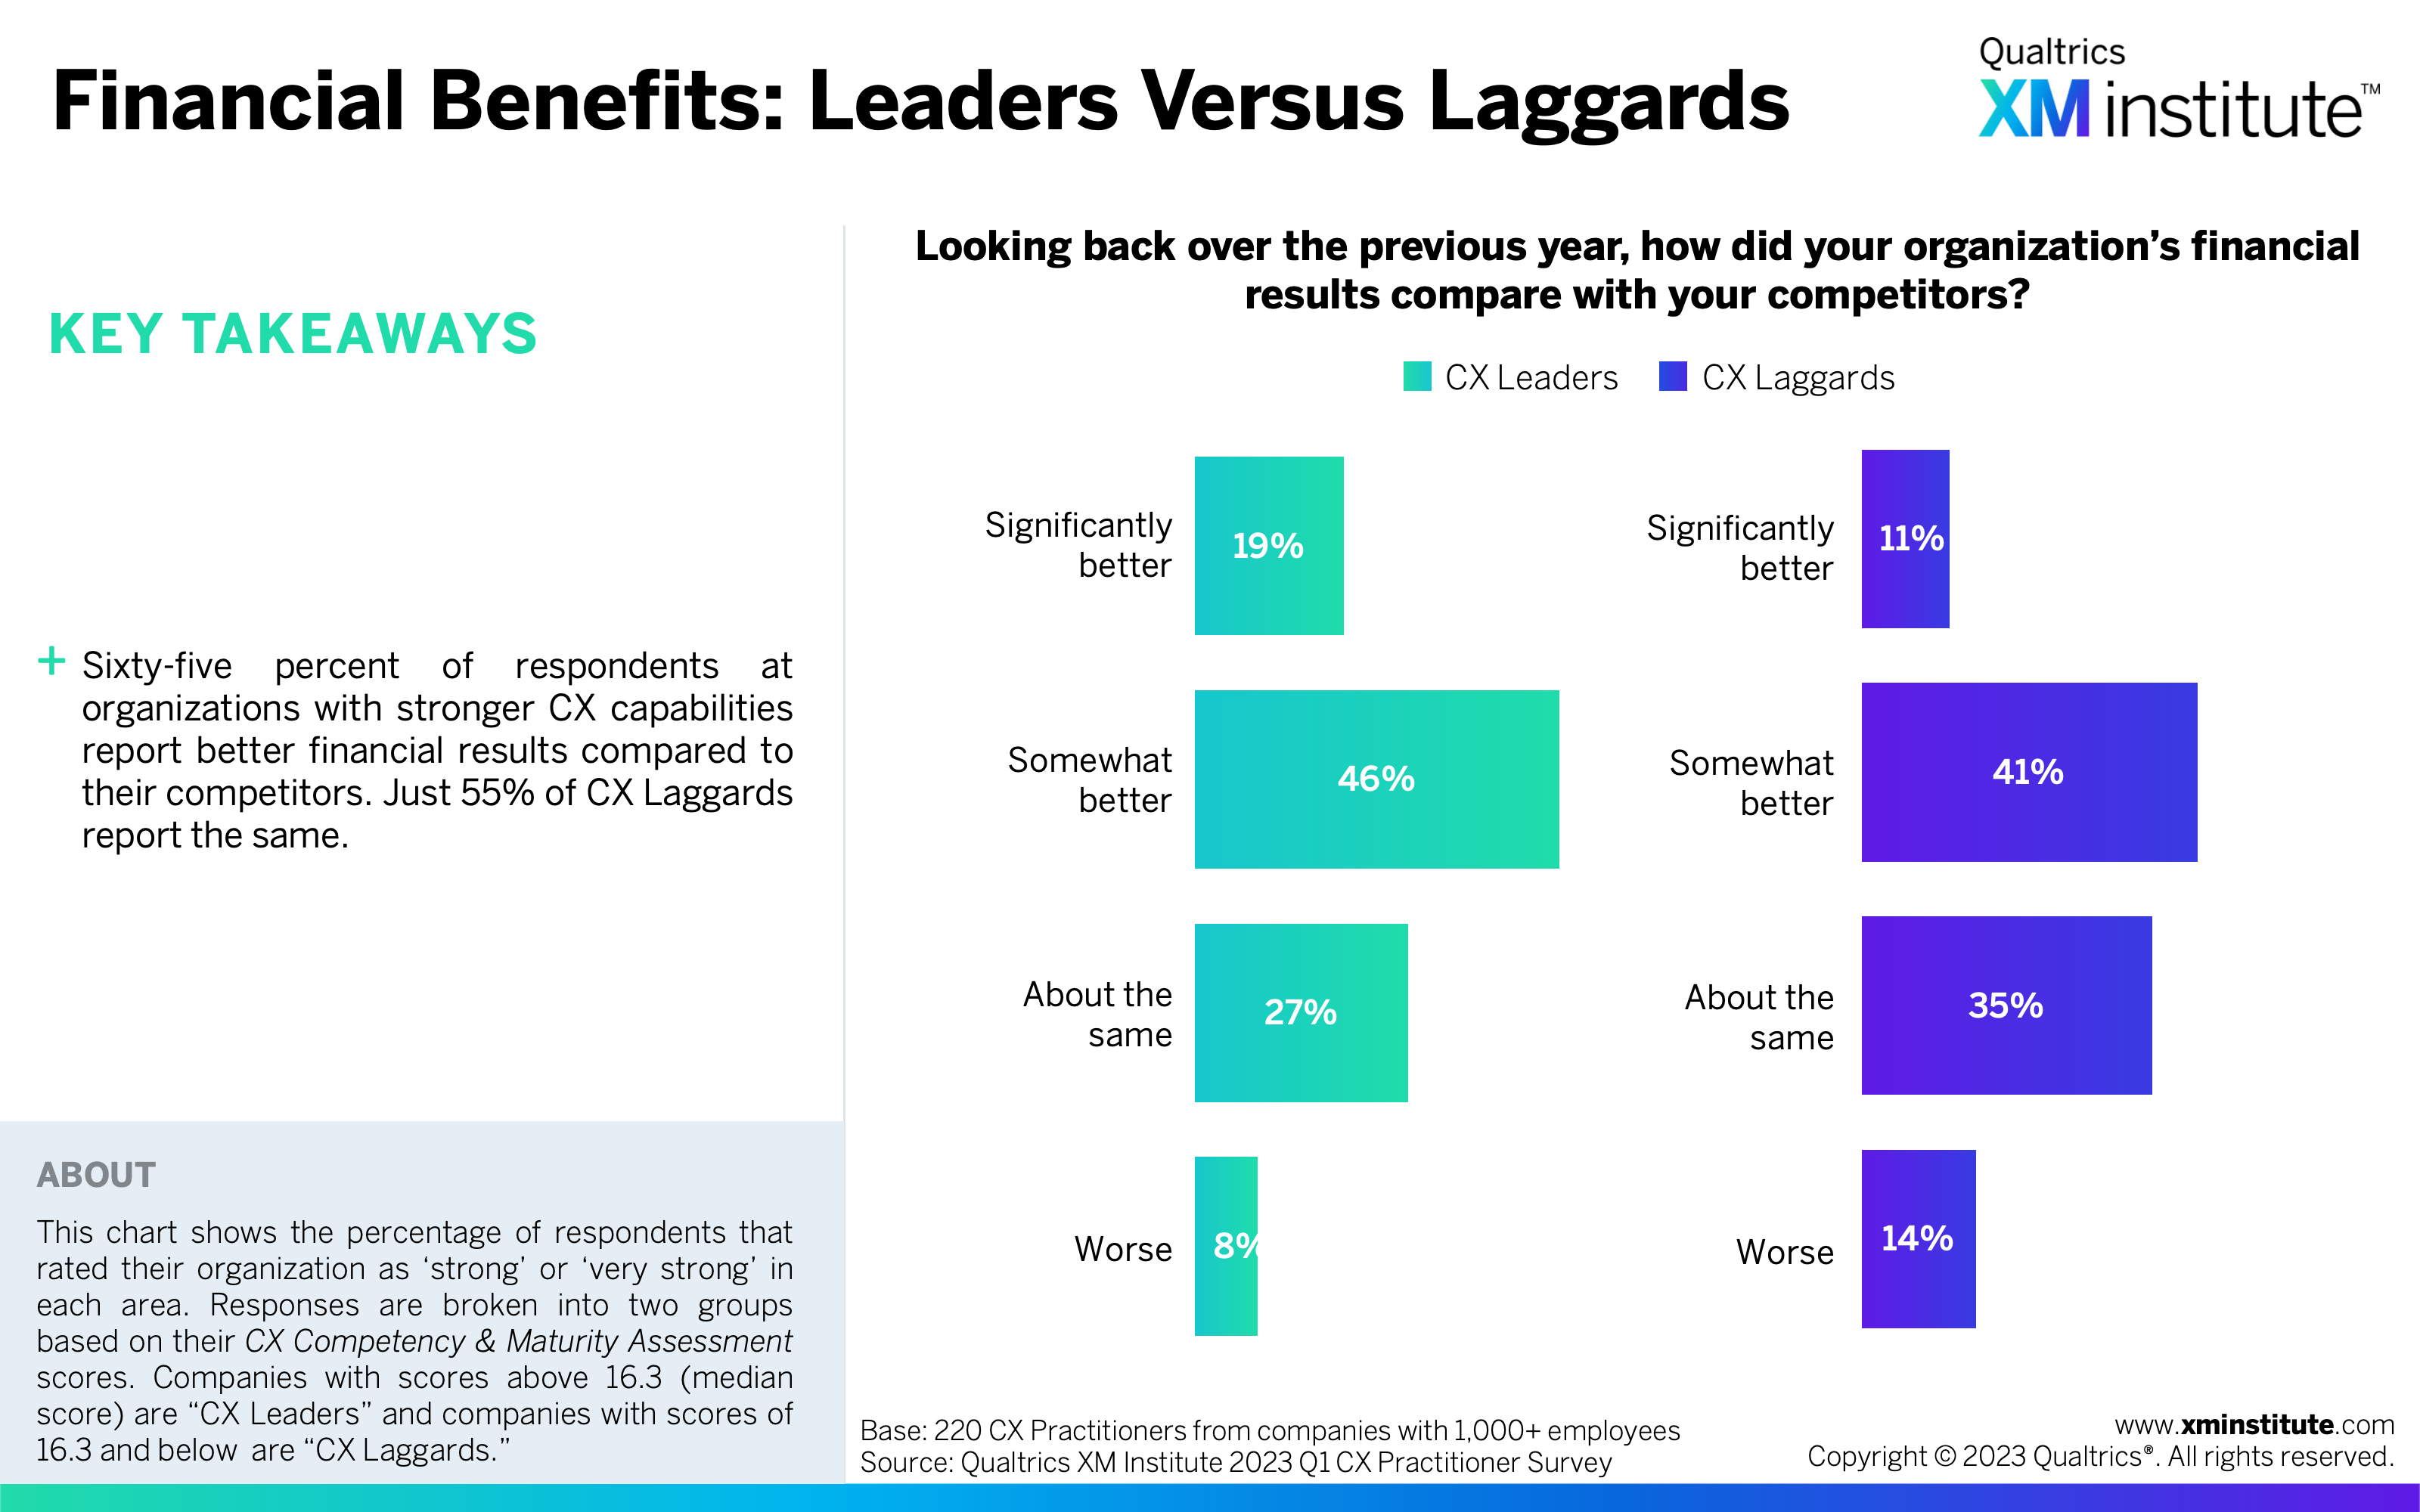
- Financial Benefits: Leaders Versus Laggards (see Figure 16)
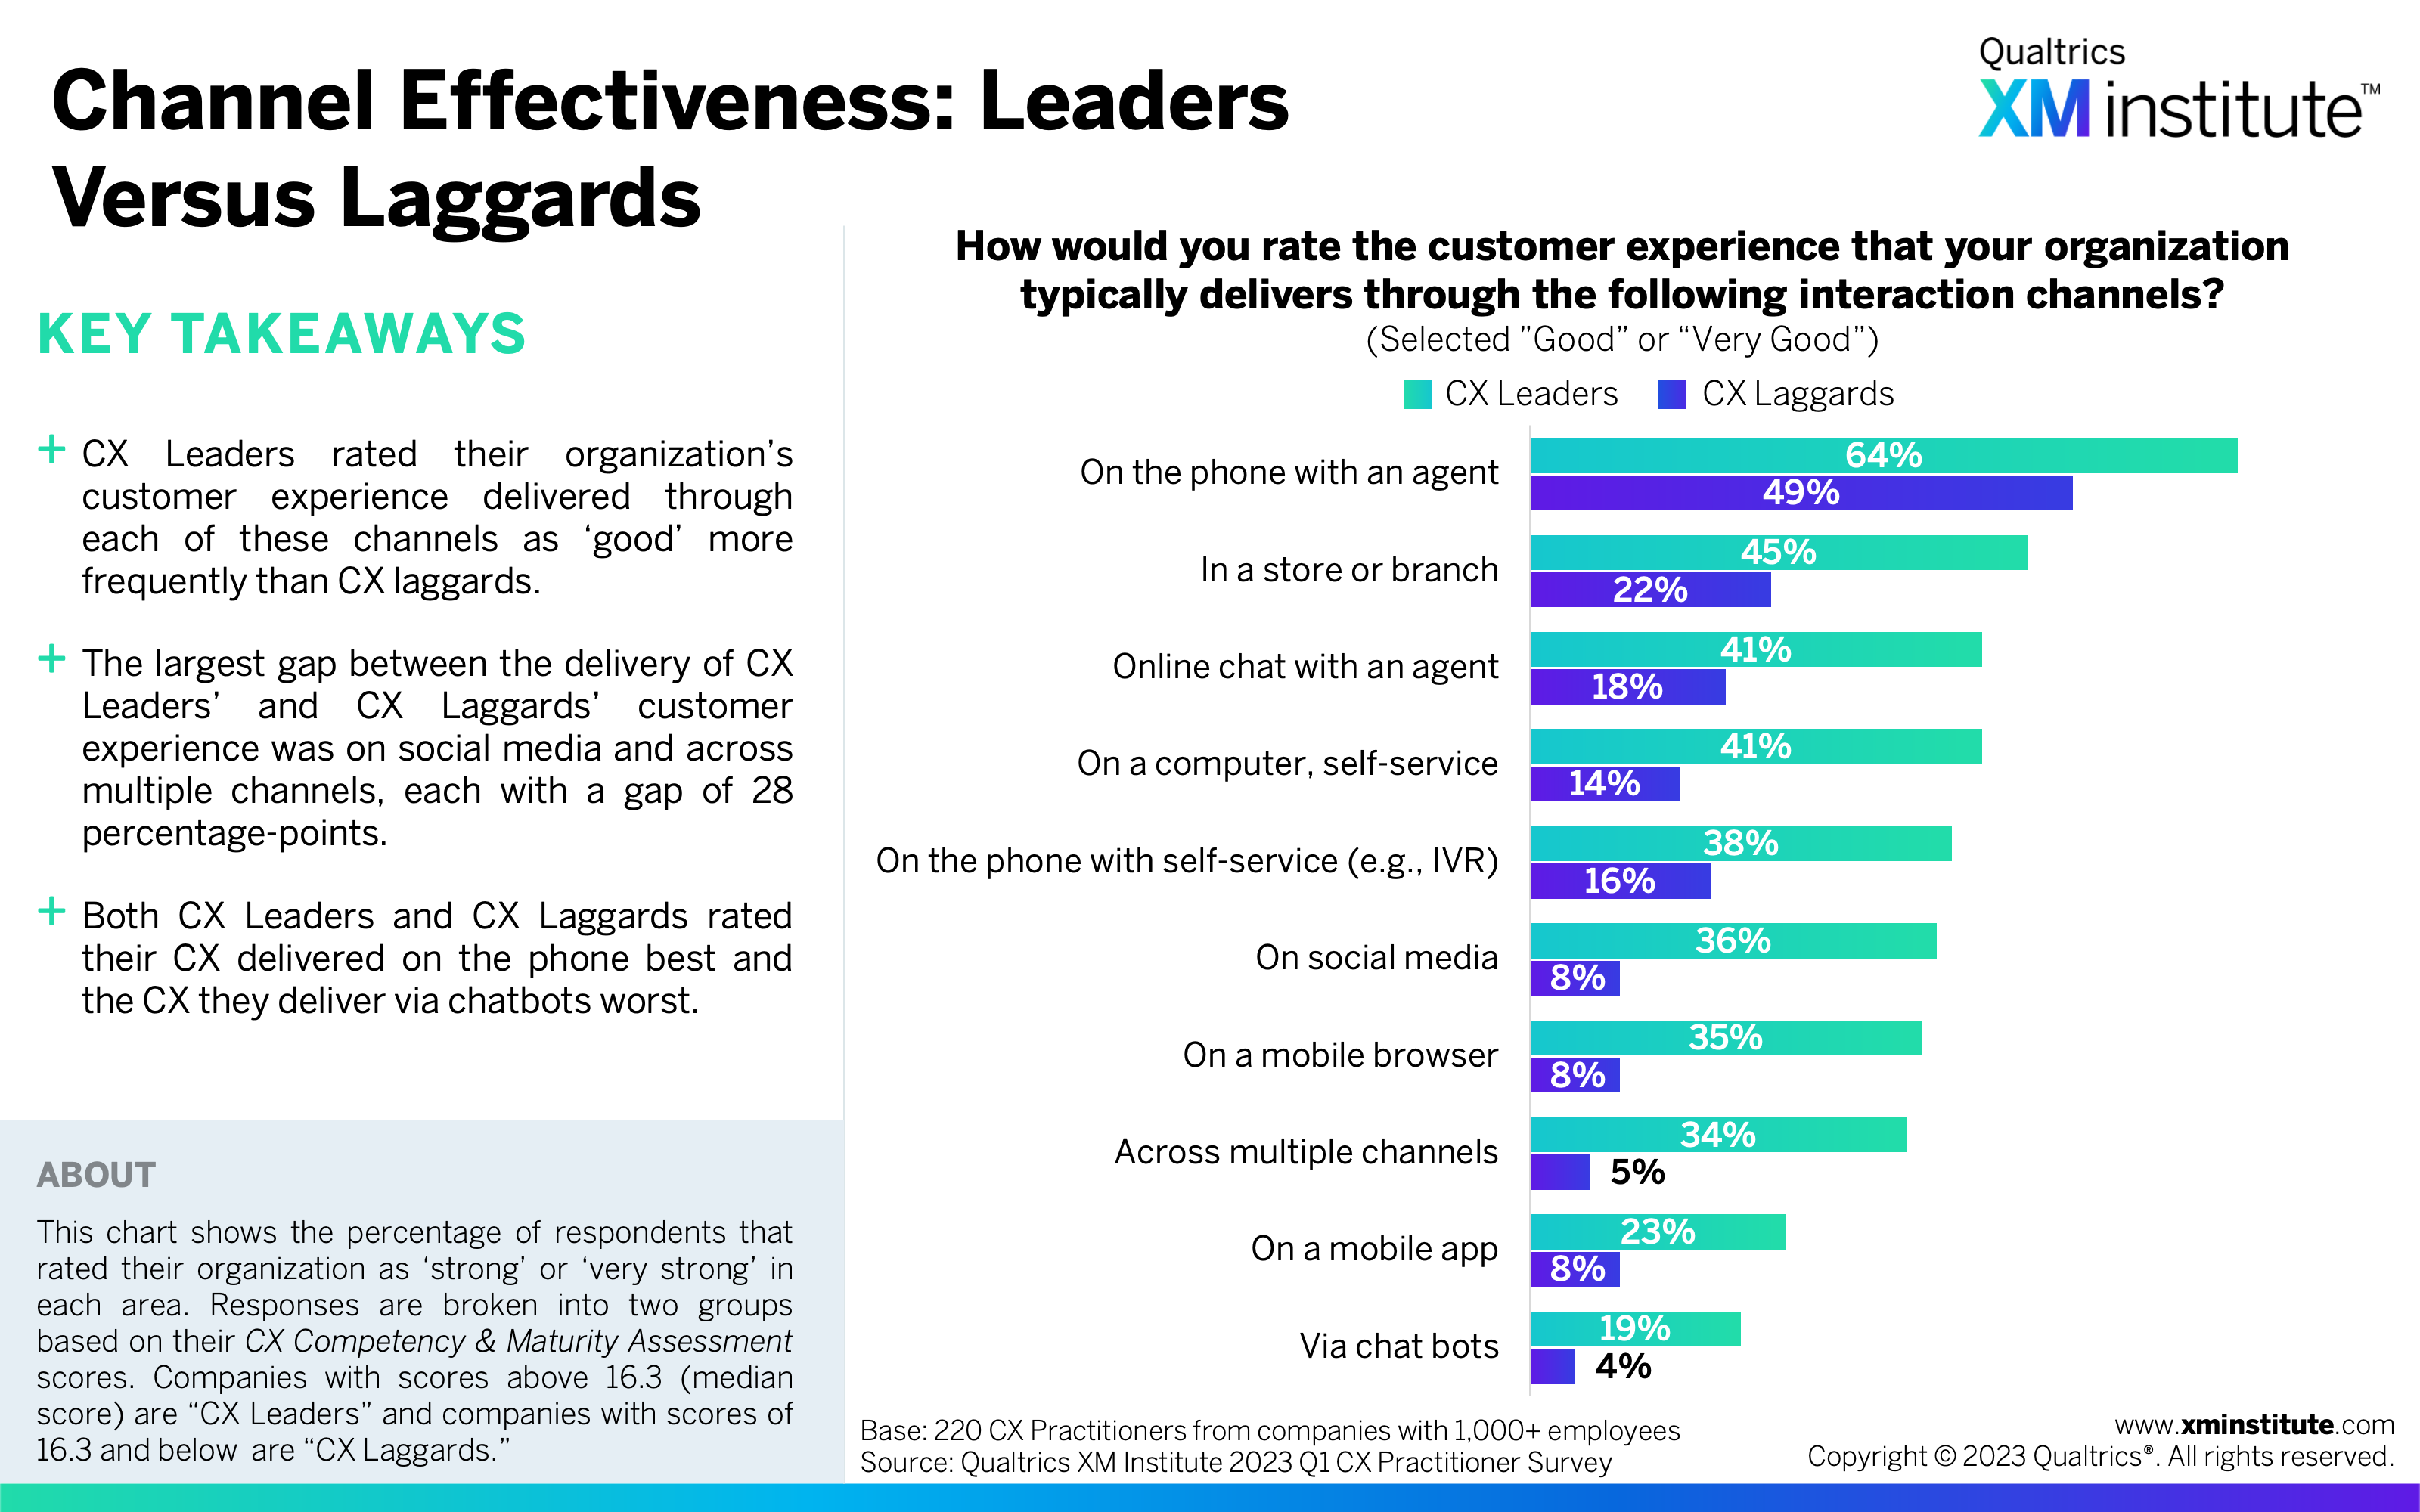
- Channel Effectiveness: Leaders Versus Laggards (see Figure 17)
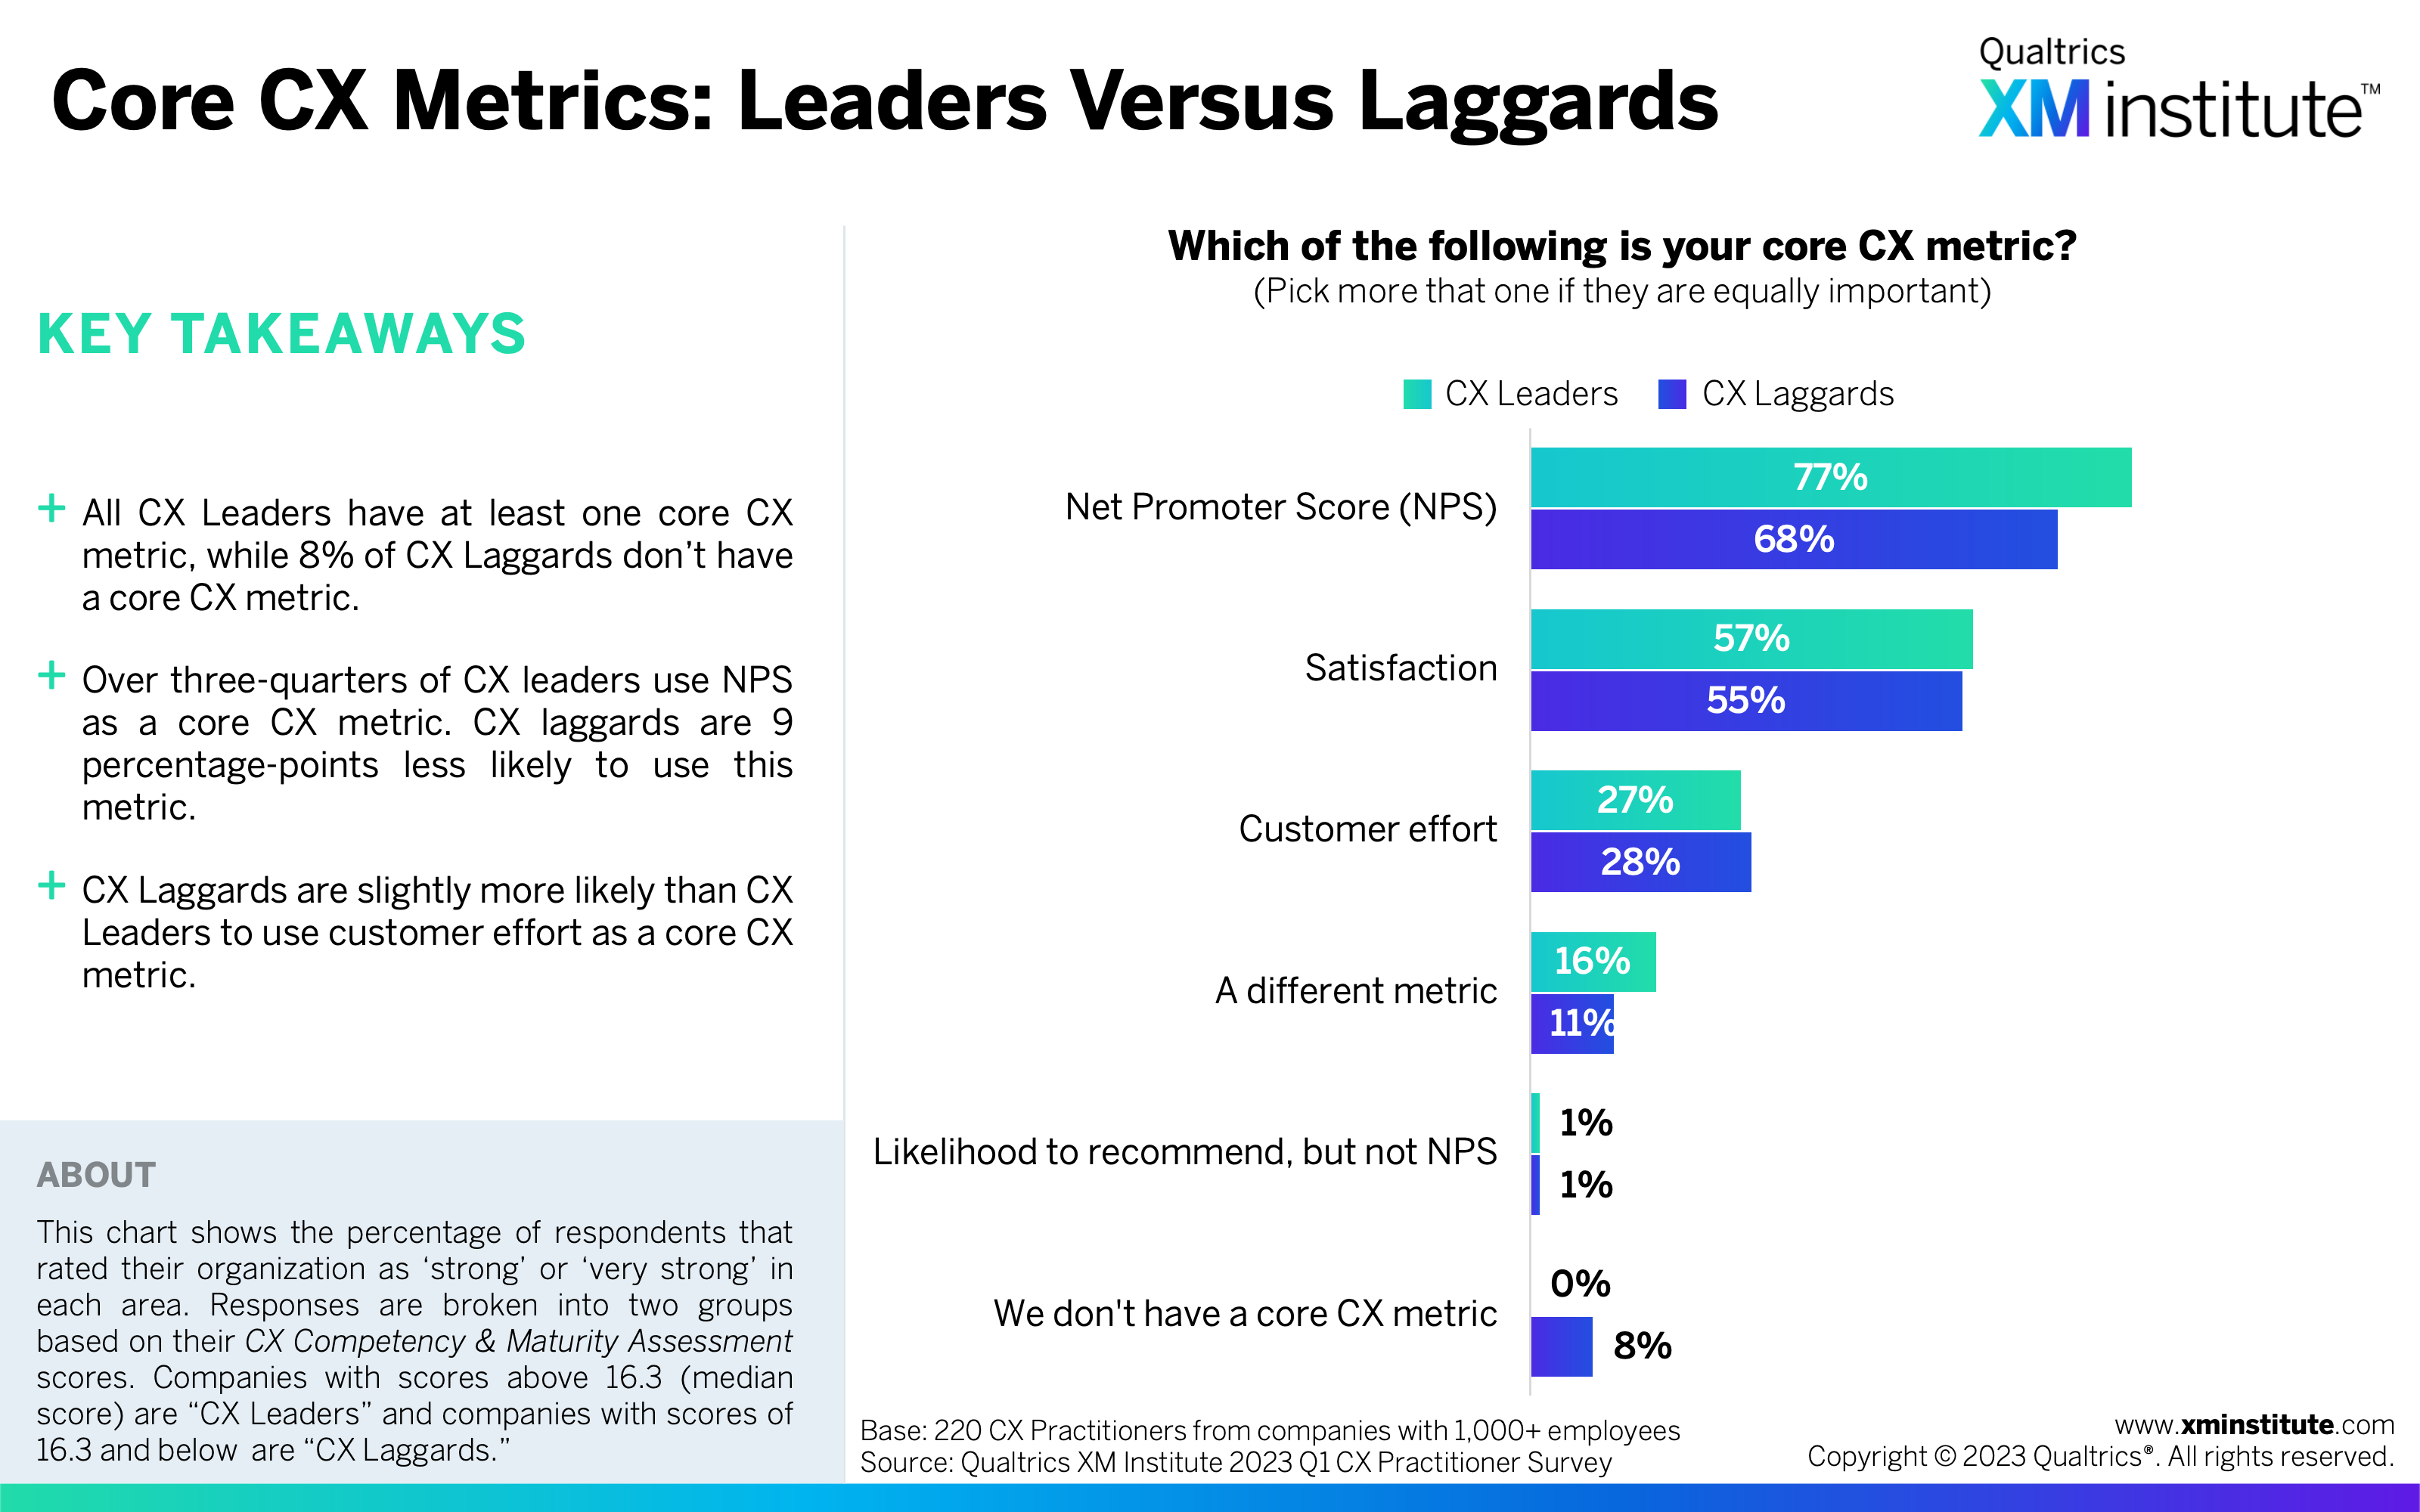
- Core CX Metrics: Leaders Versus Laggards (see Figure 18)
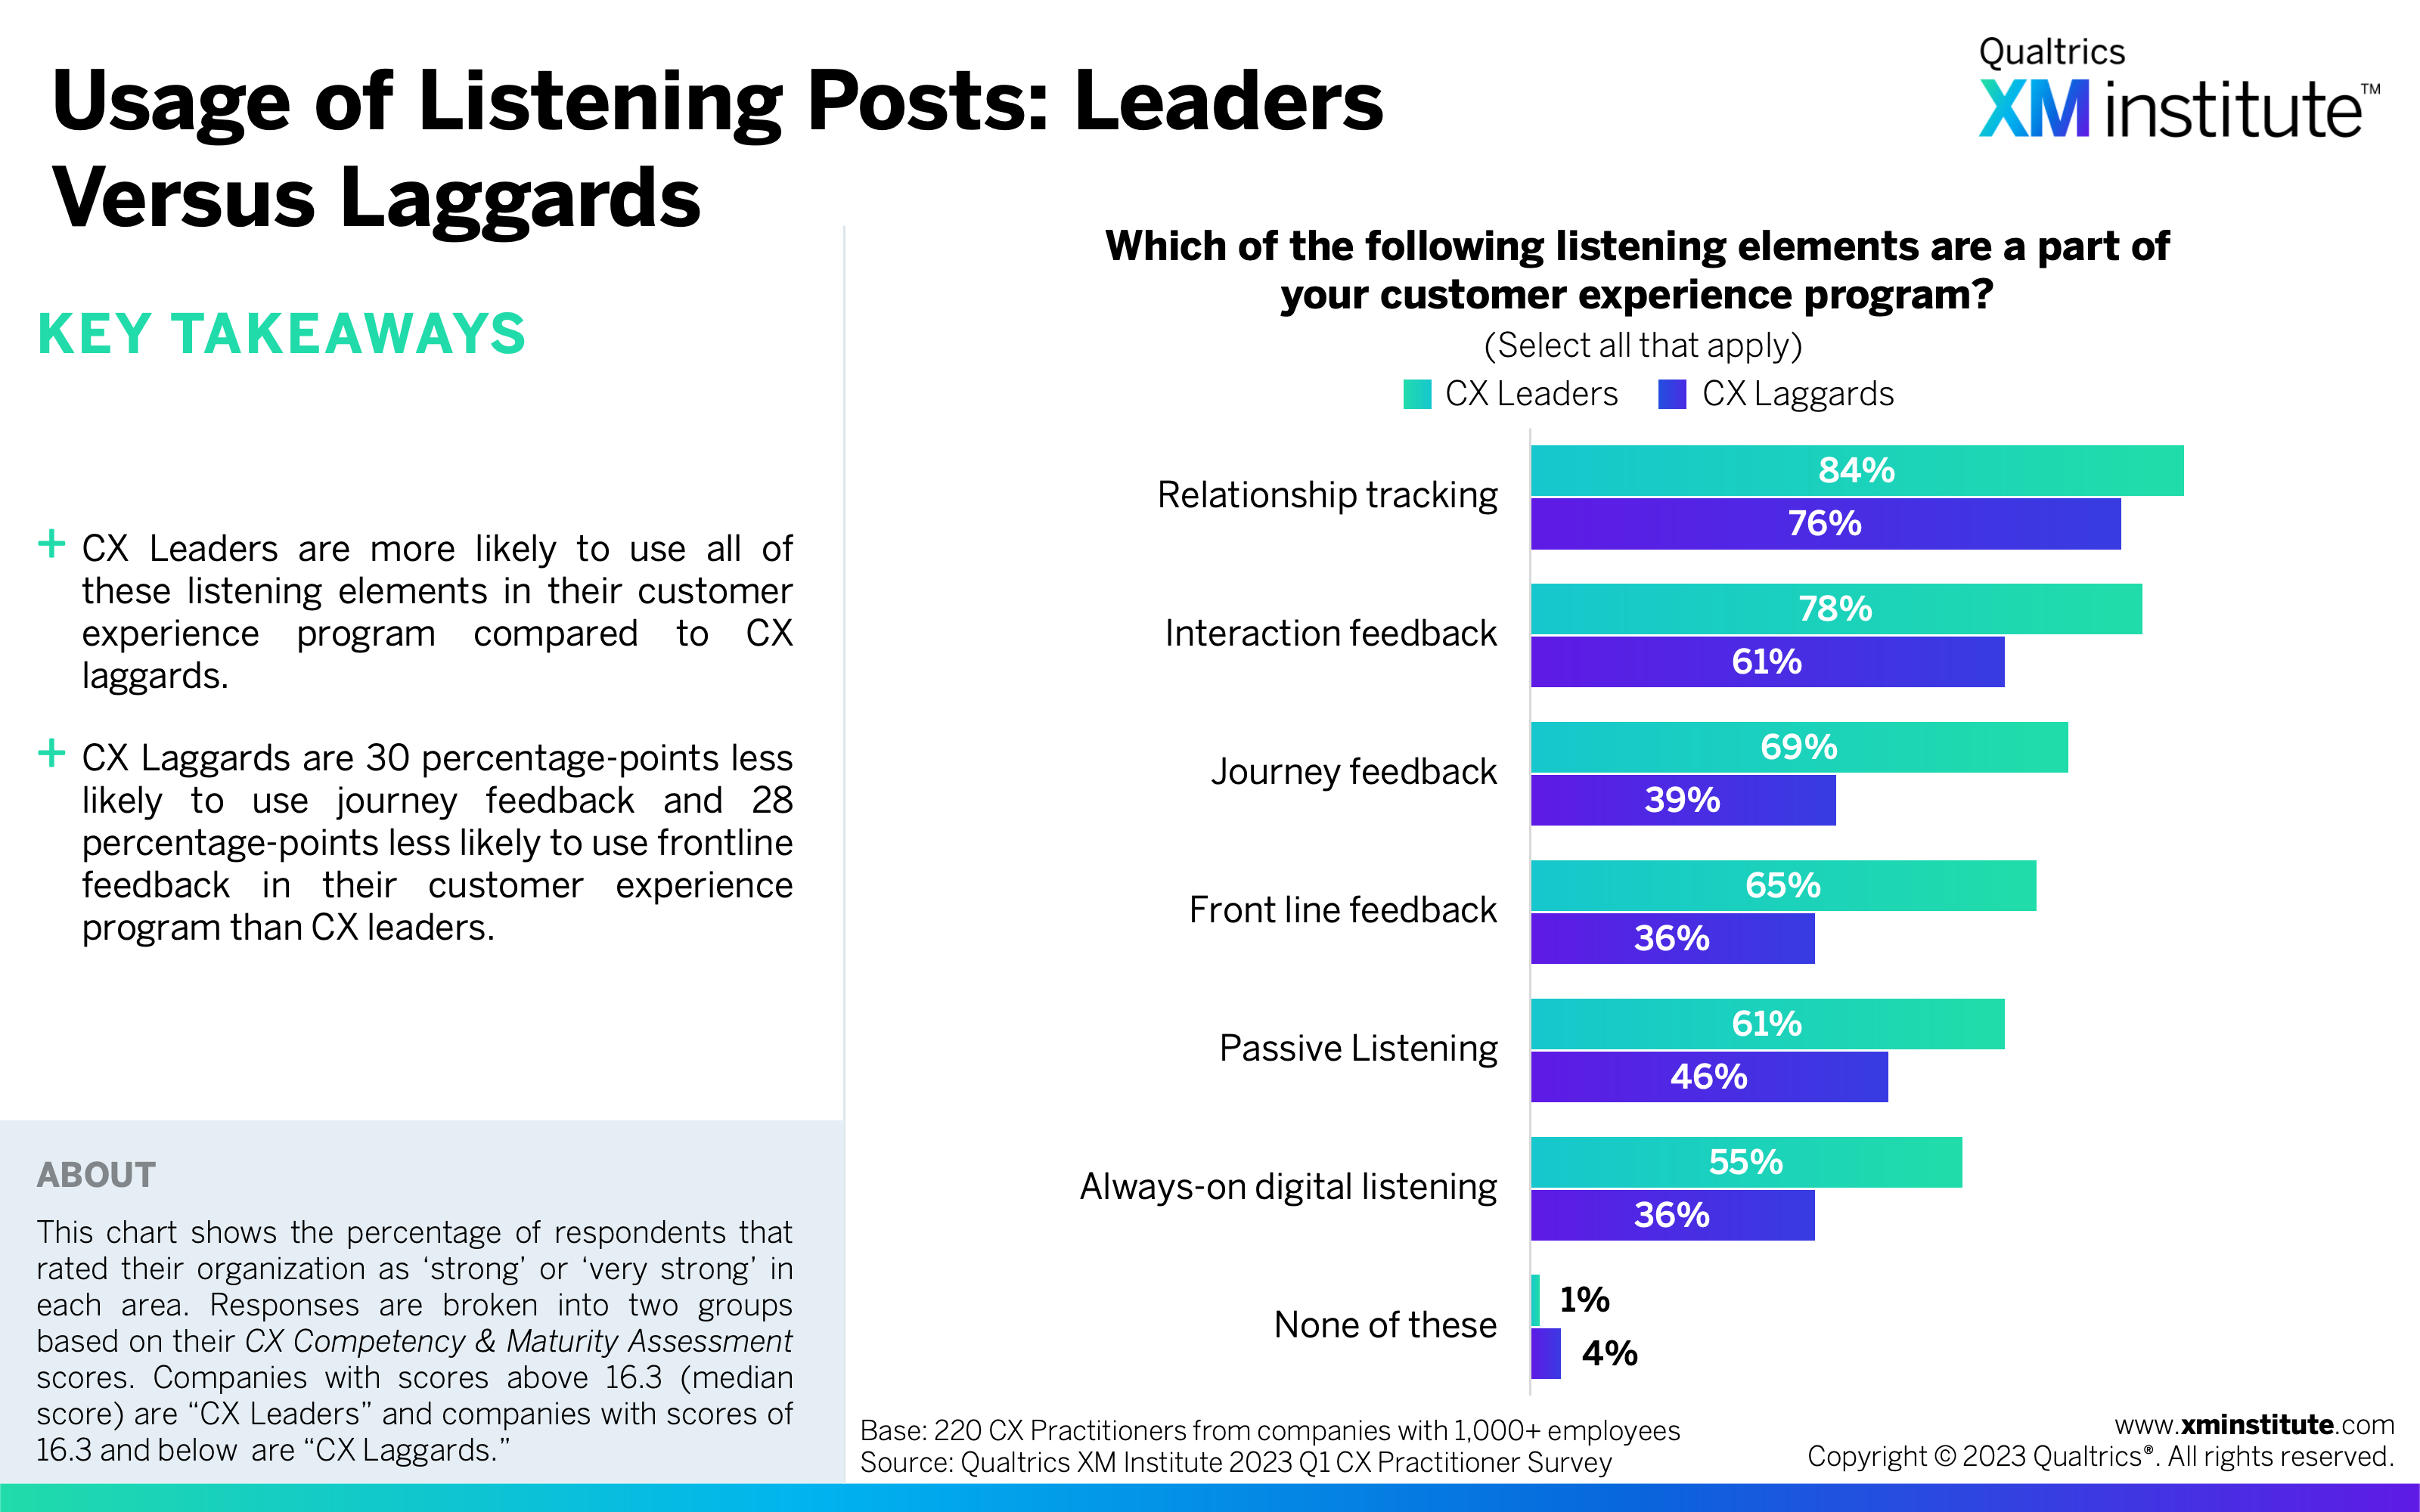
- Usage of Listening Posts: Leaders Versus Laggards (see Figure 19)
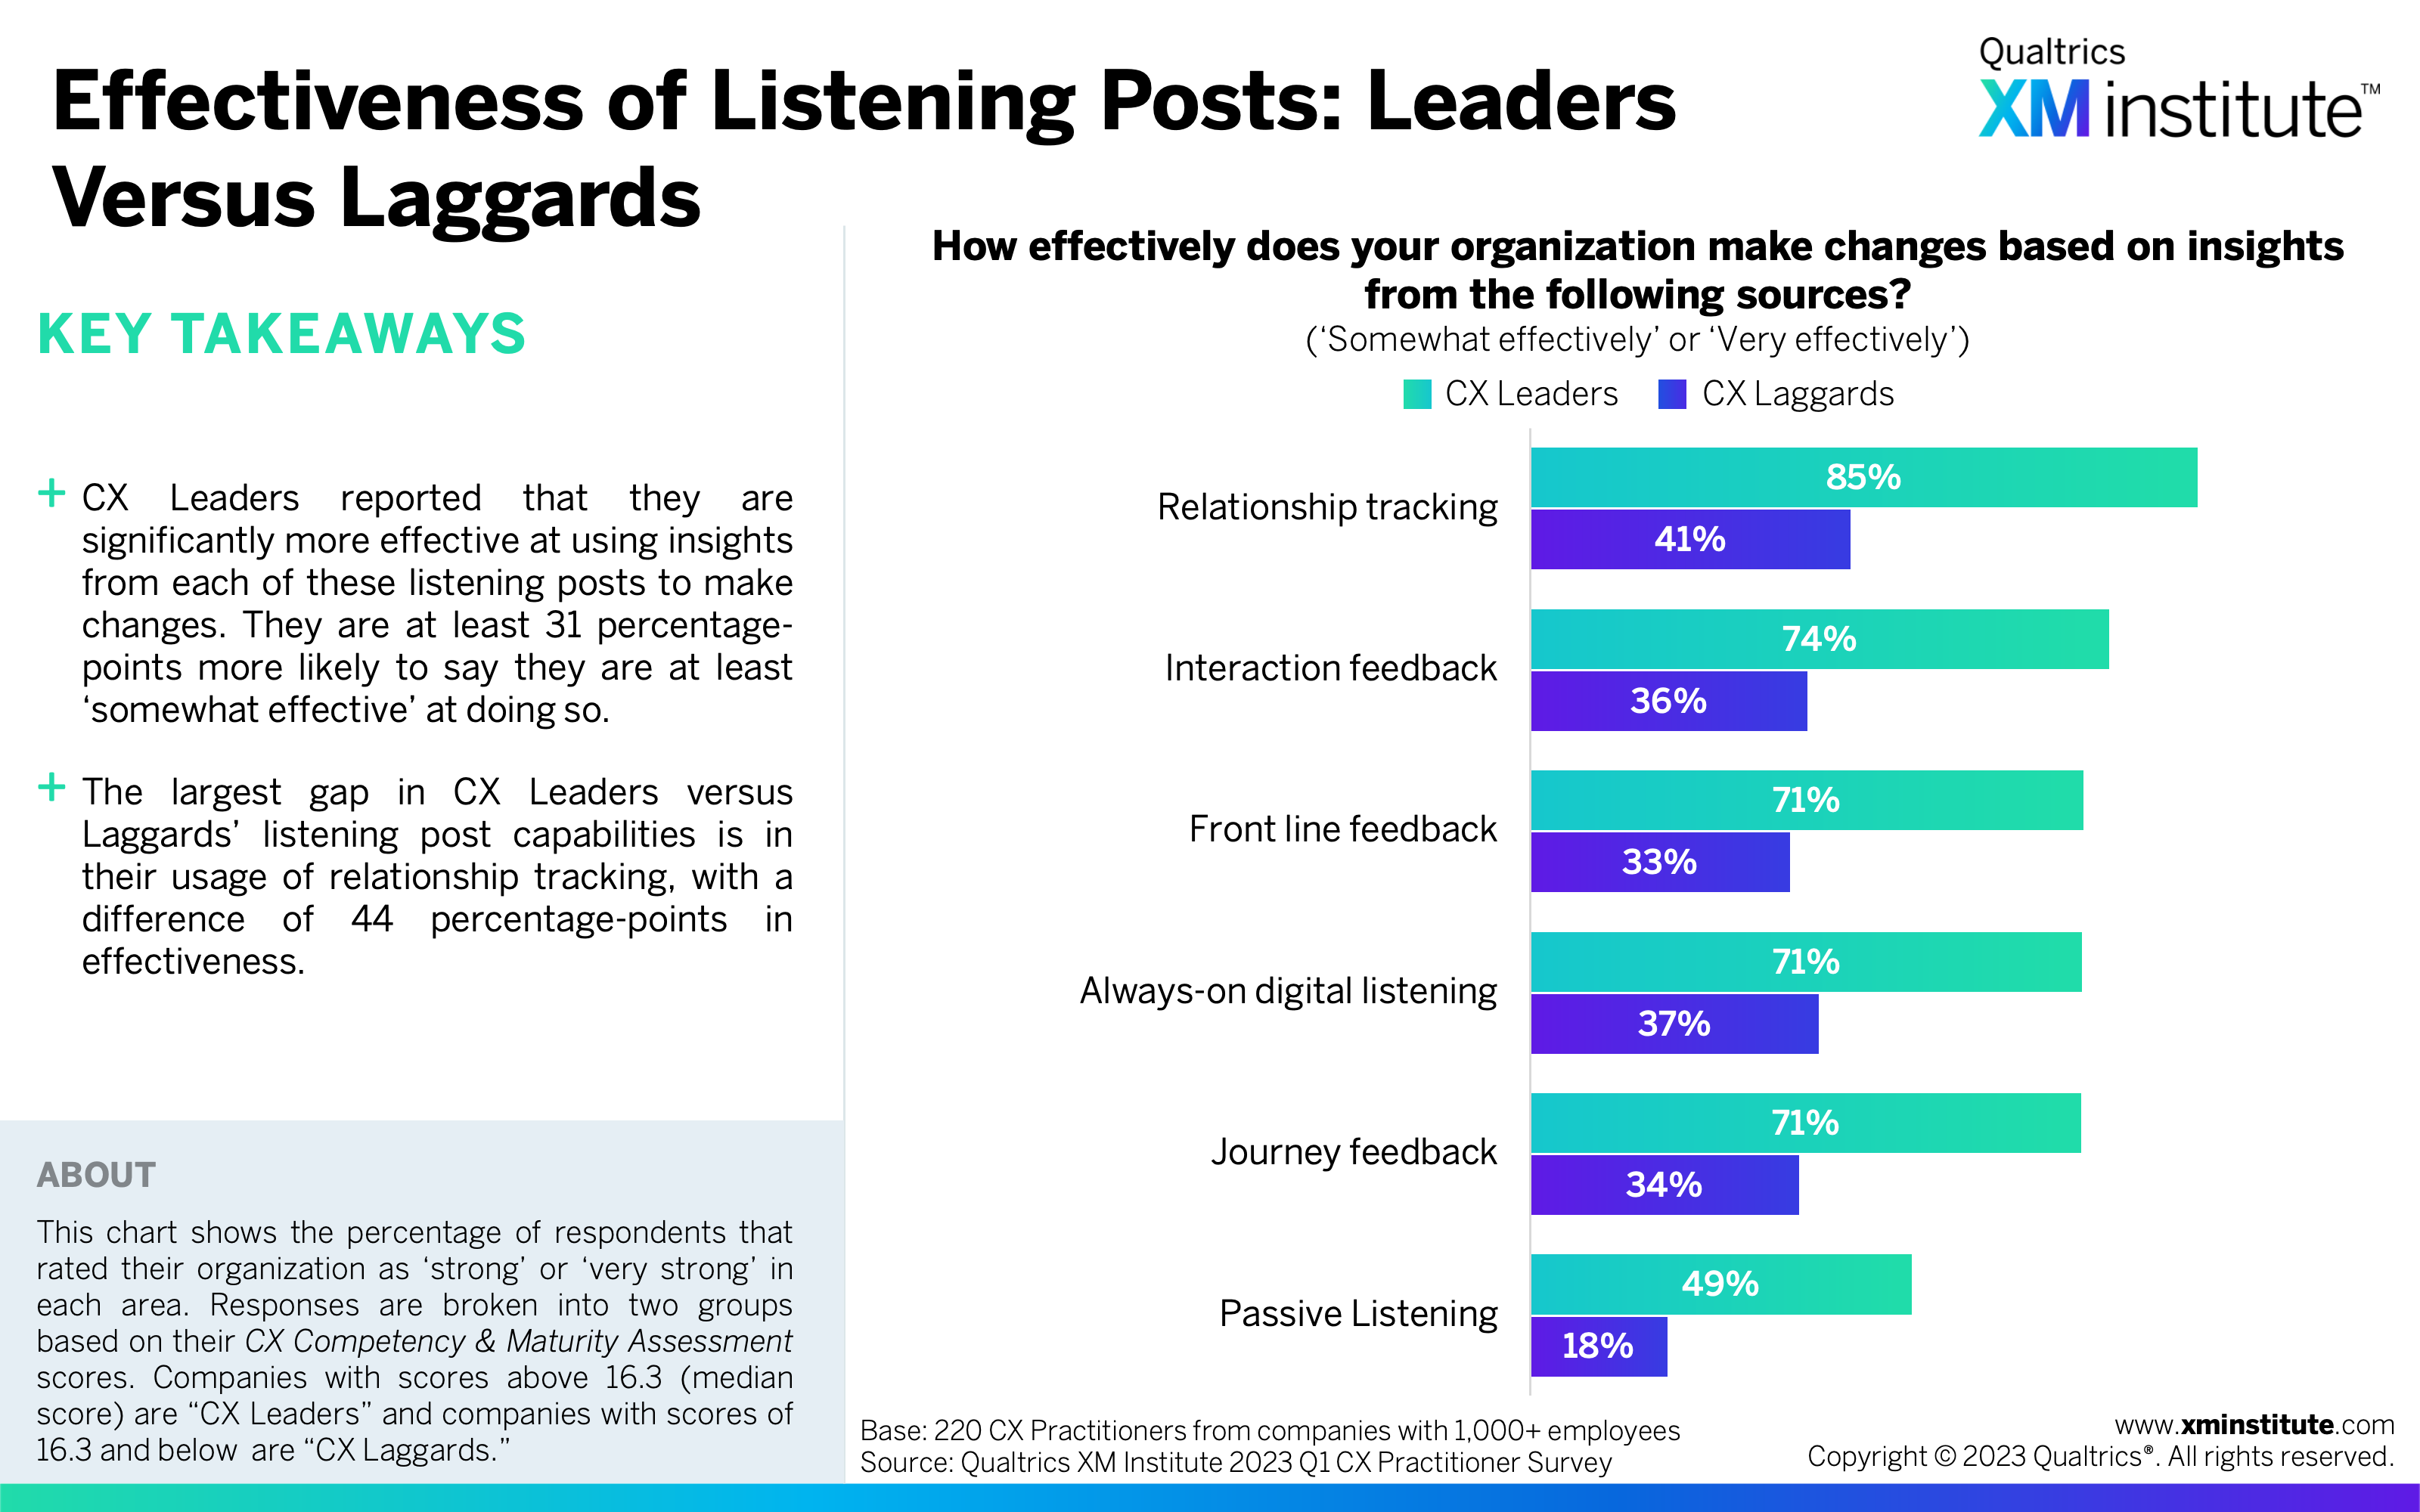
- Effectiveness of Listening Posts: Leaders Versus Laggards (see Figure 20)
- Obstacles to CX Success: Leaders Versus Laggards (see Figure 21)
- Methodology (see Figure 22)