Key Findings
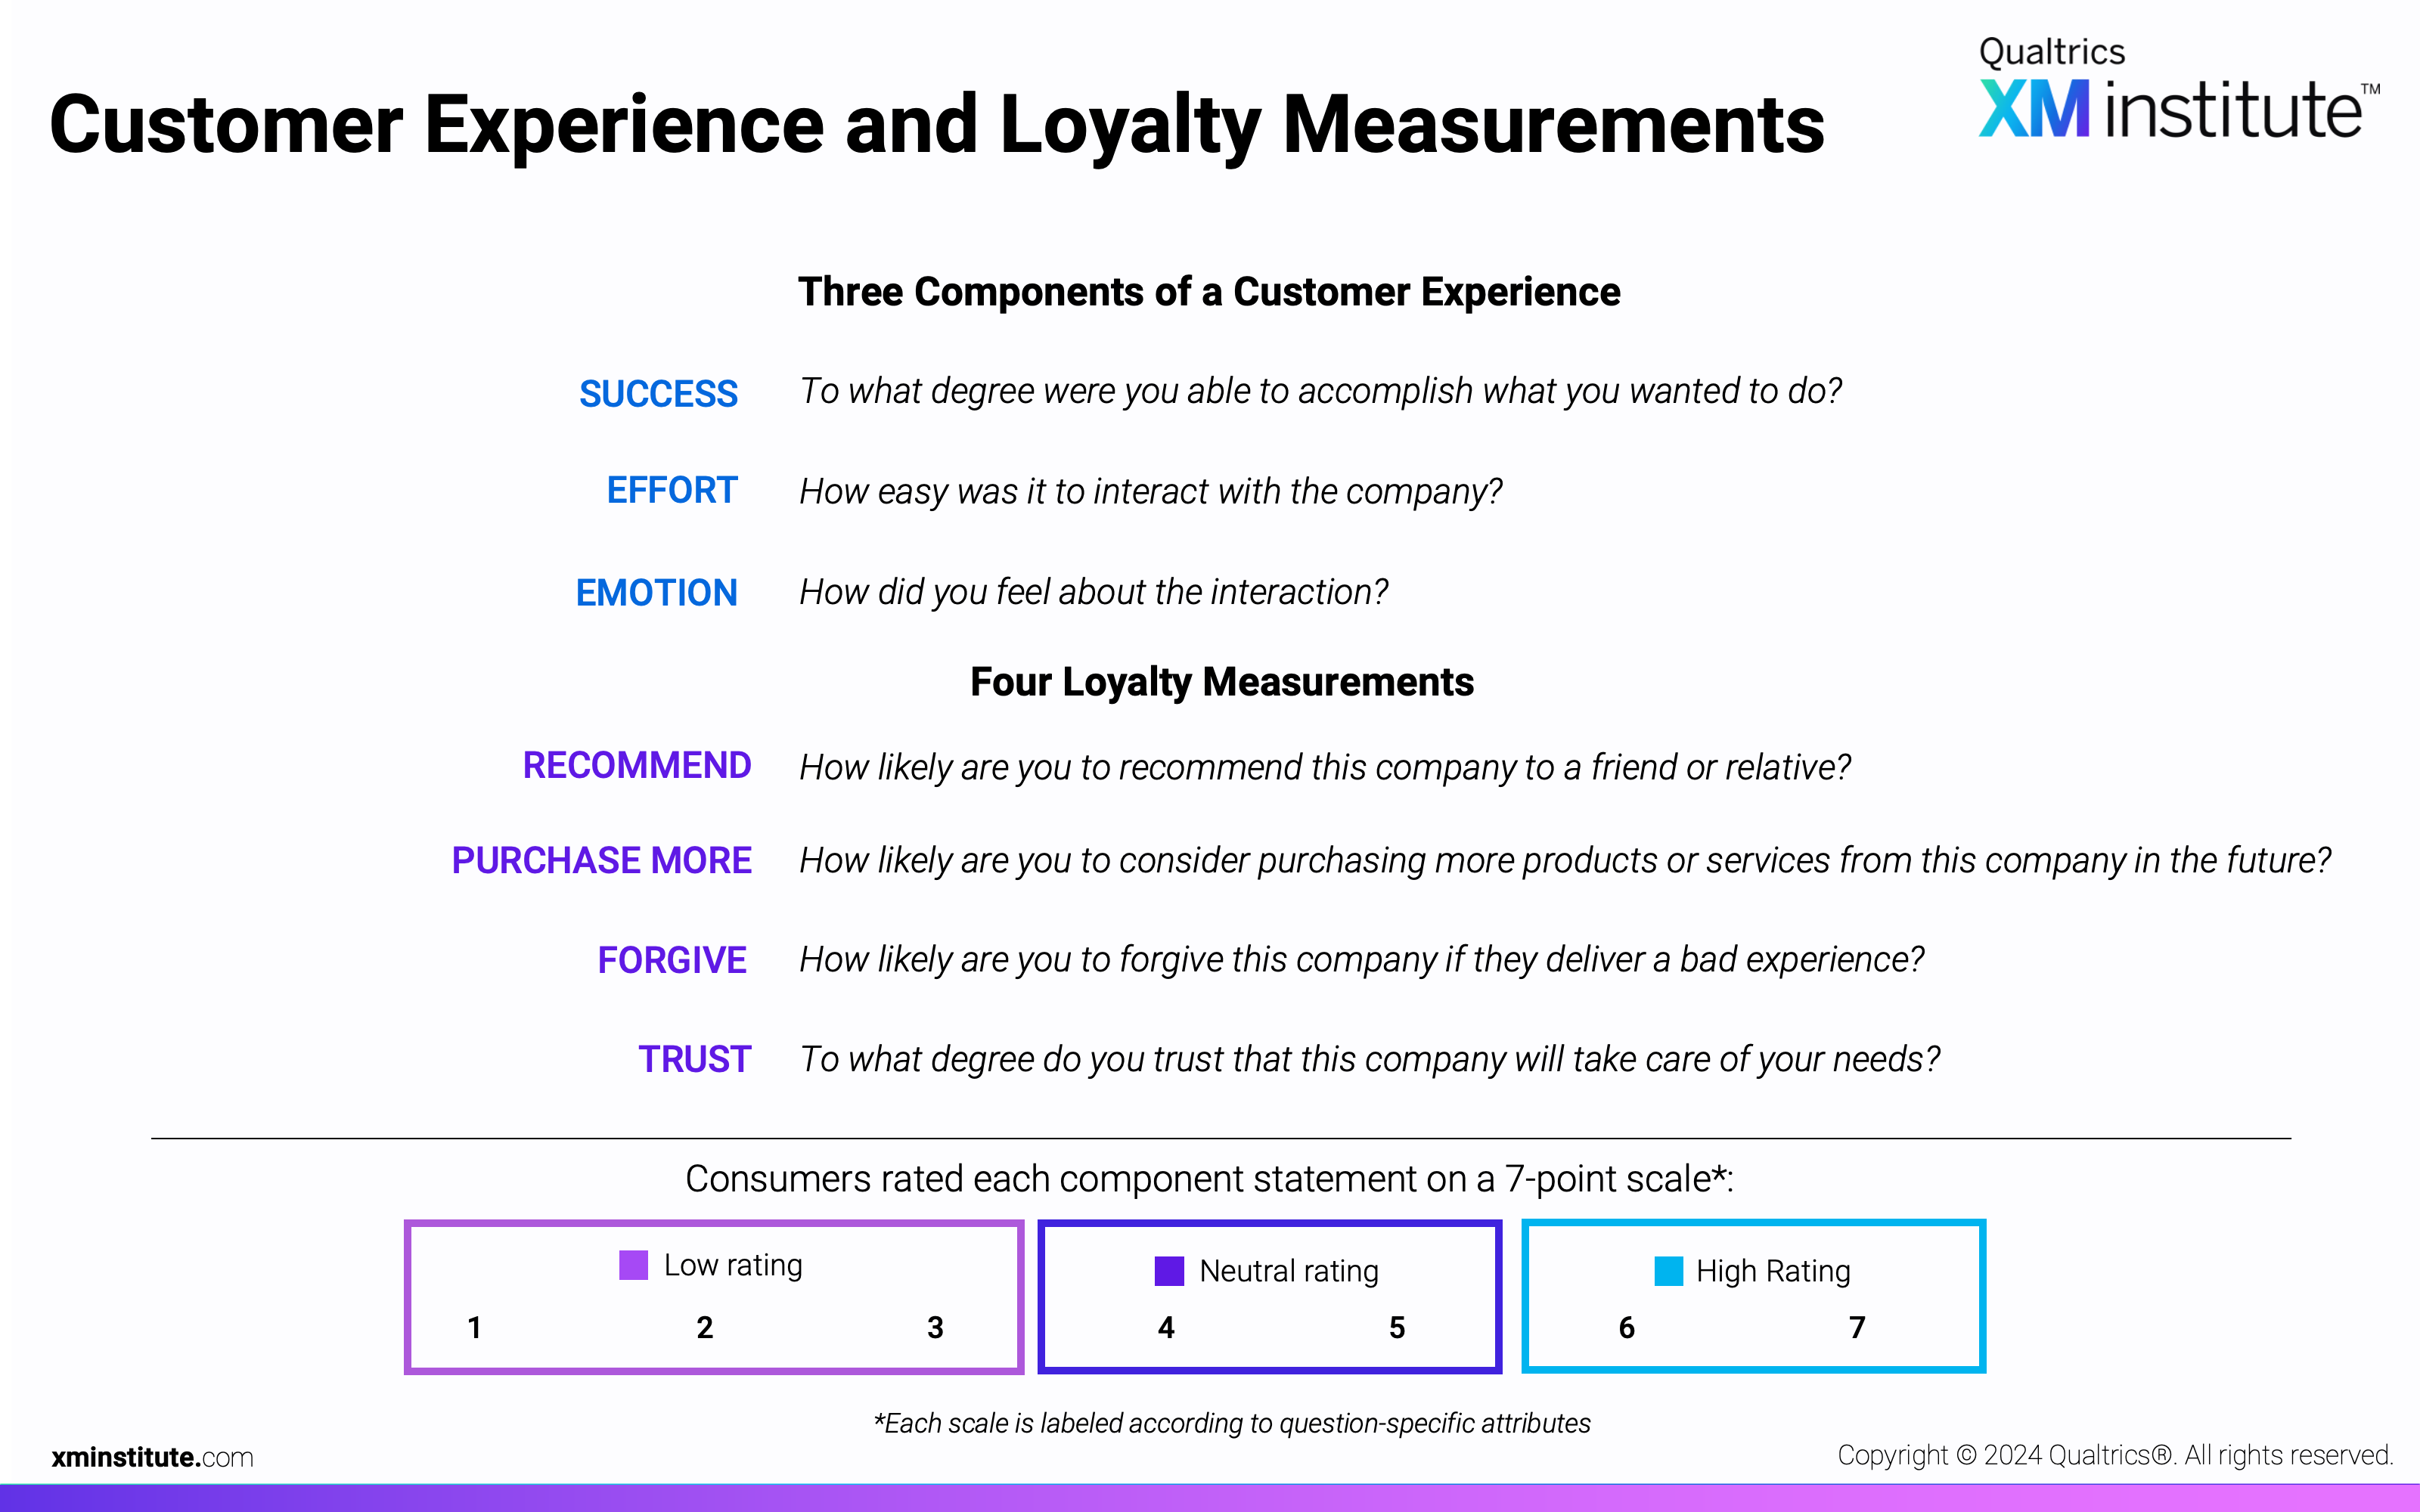
As part of Qualtrics XM Institute’s 2023 US Consumer Study, we asked 10,000 consumers to rate their recent interactions with brands across the three dimensions of customer experience – success, effort, and emotion – and how likely they are to perform four loyalty activities afterward: trust the brand, forgive the brand for a mistake, recommend the brand to others, and purchase more from the brand. From our analysis, we learned that:
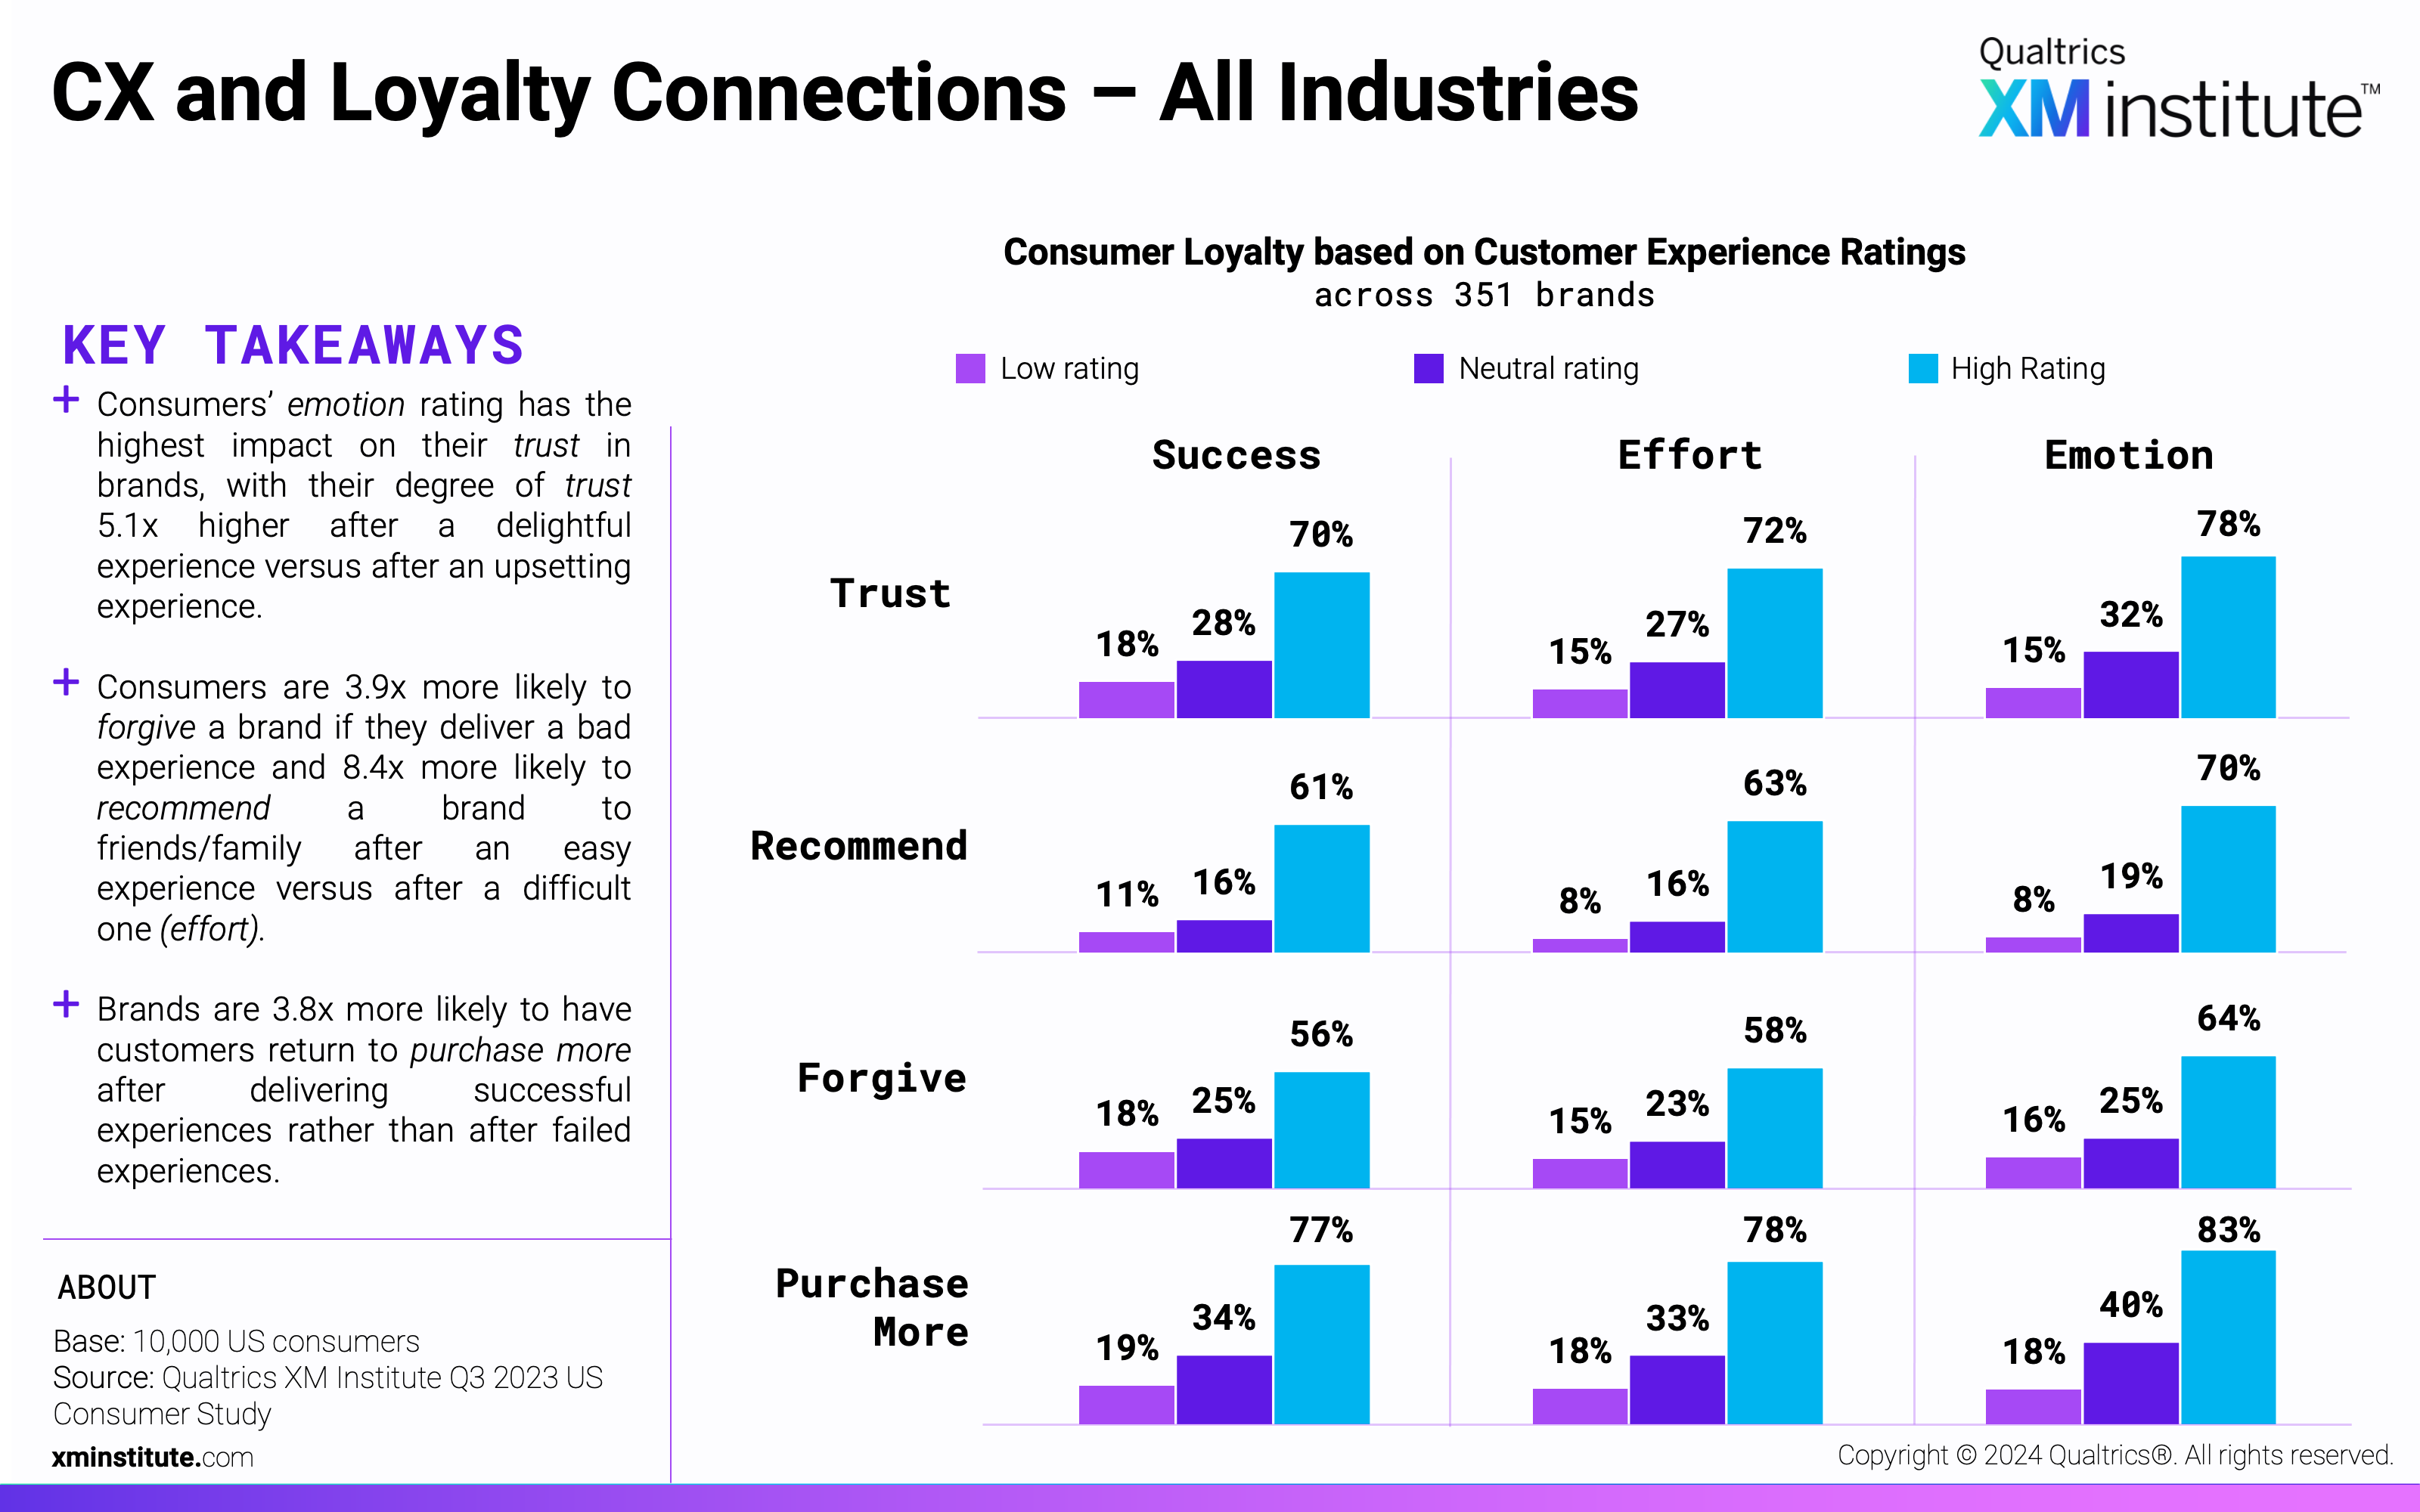
- Emotion has the largest impact. Consumers with a high emotion rating are the most likely to exhibit each of the four loyalty behaviors compared to consumers with high success or effort ratings. On average across all industries, high emotion scores are most likely to coincide with high likelihood to purchase more.
- Effort and success also have positive effects on loyalty. On average across all industries, effort and success have a strong positive impact on all loyalty behaviors. As with emotion, these customer experience components have the strongest relationship with likelihood to purchase more. Seventy-eight percent of respondents who give a high effort rating say they are likely to purchase more, while only 18% with a low effort rating say the same. These numbers for success are 77% and 19%, respectively.
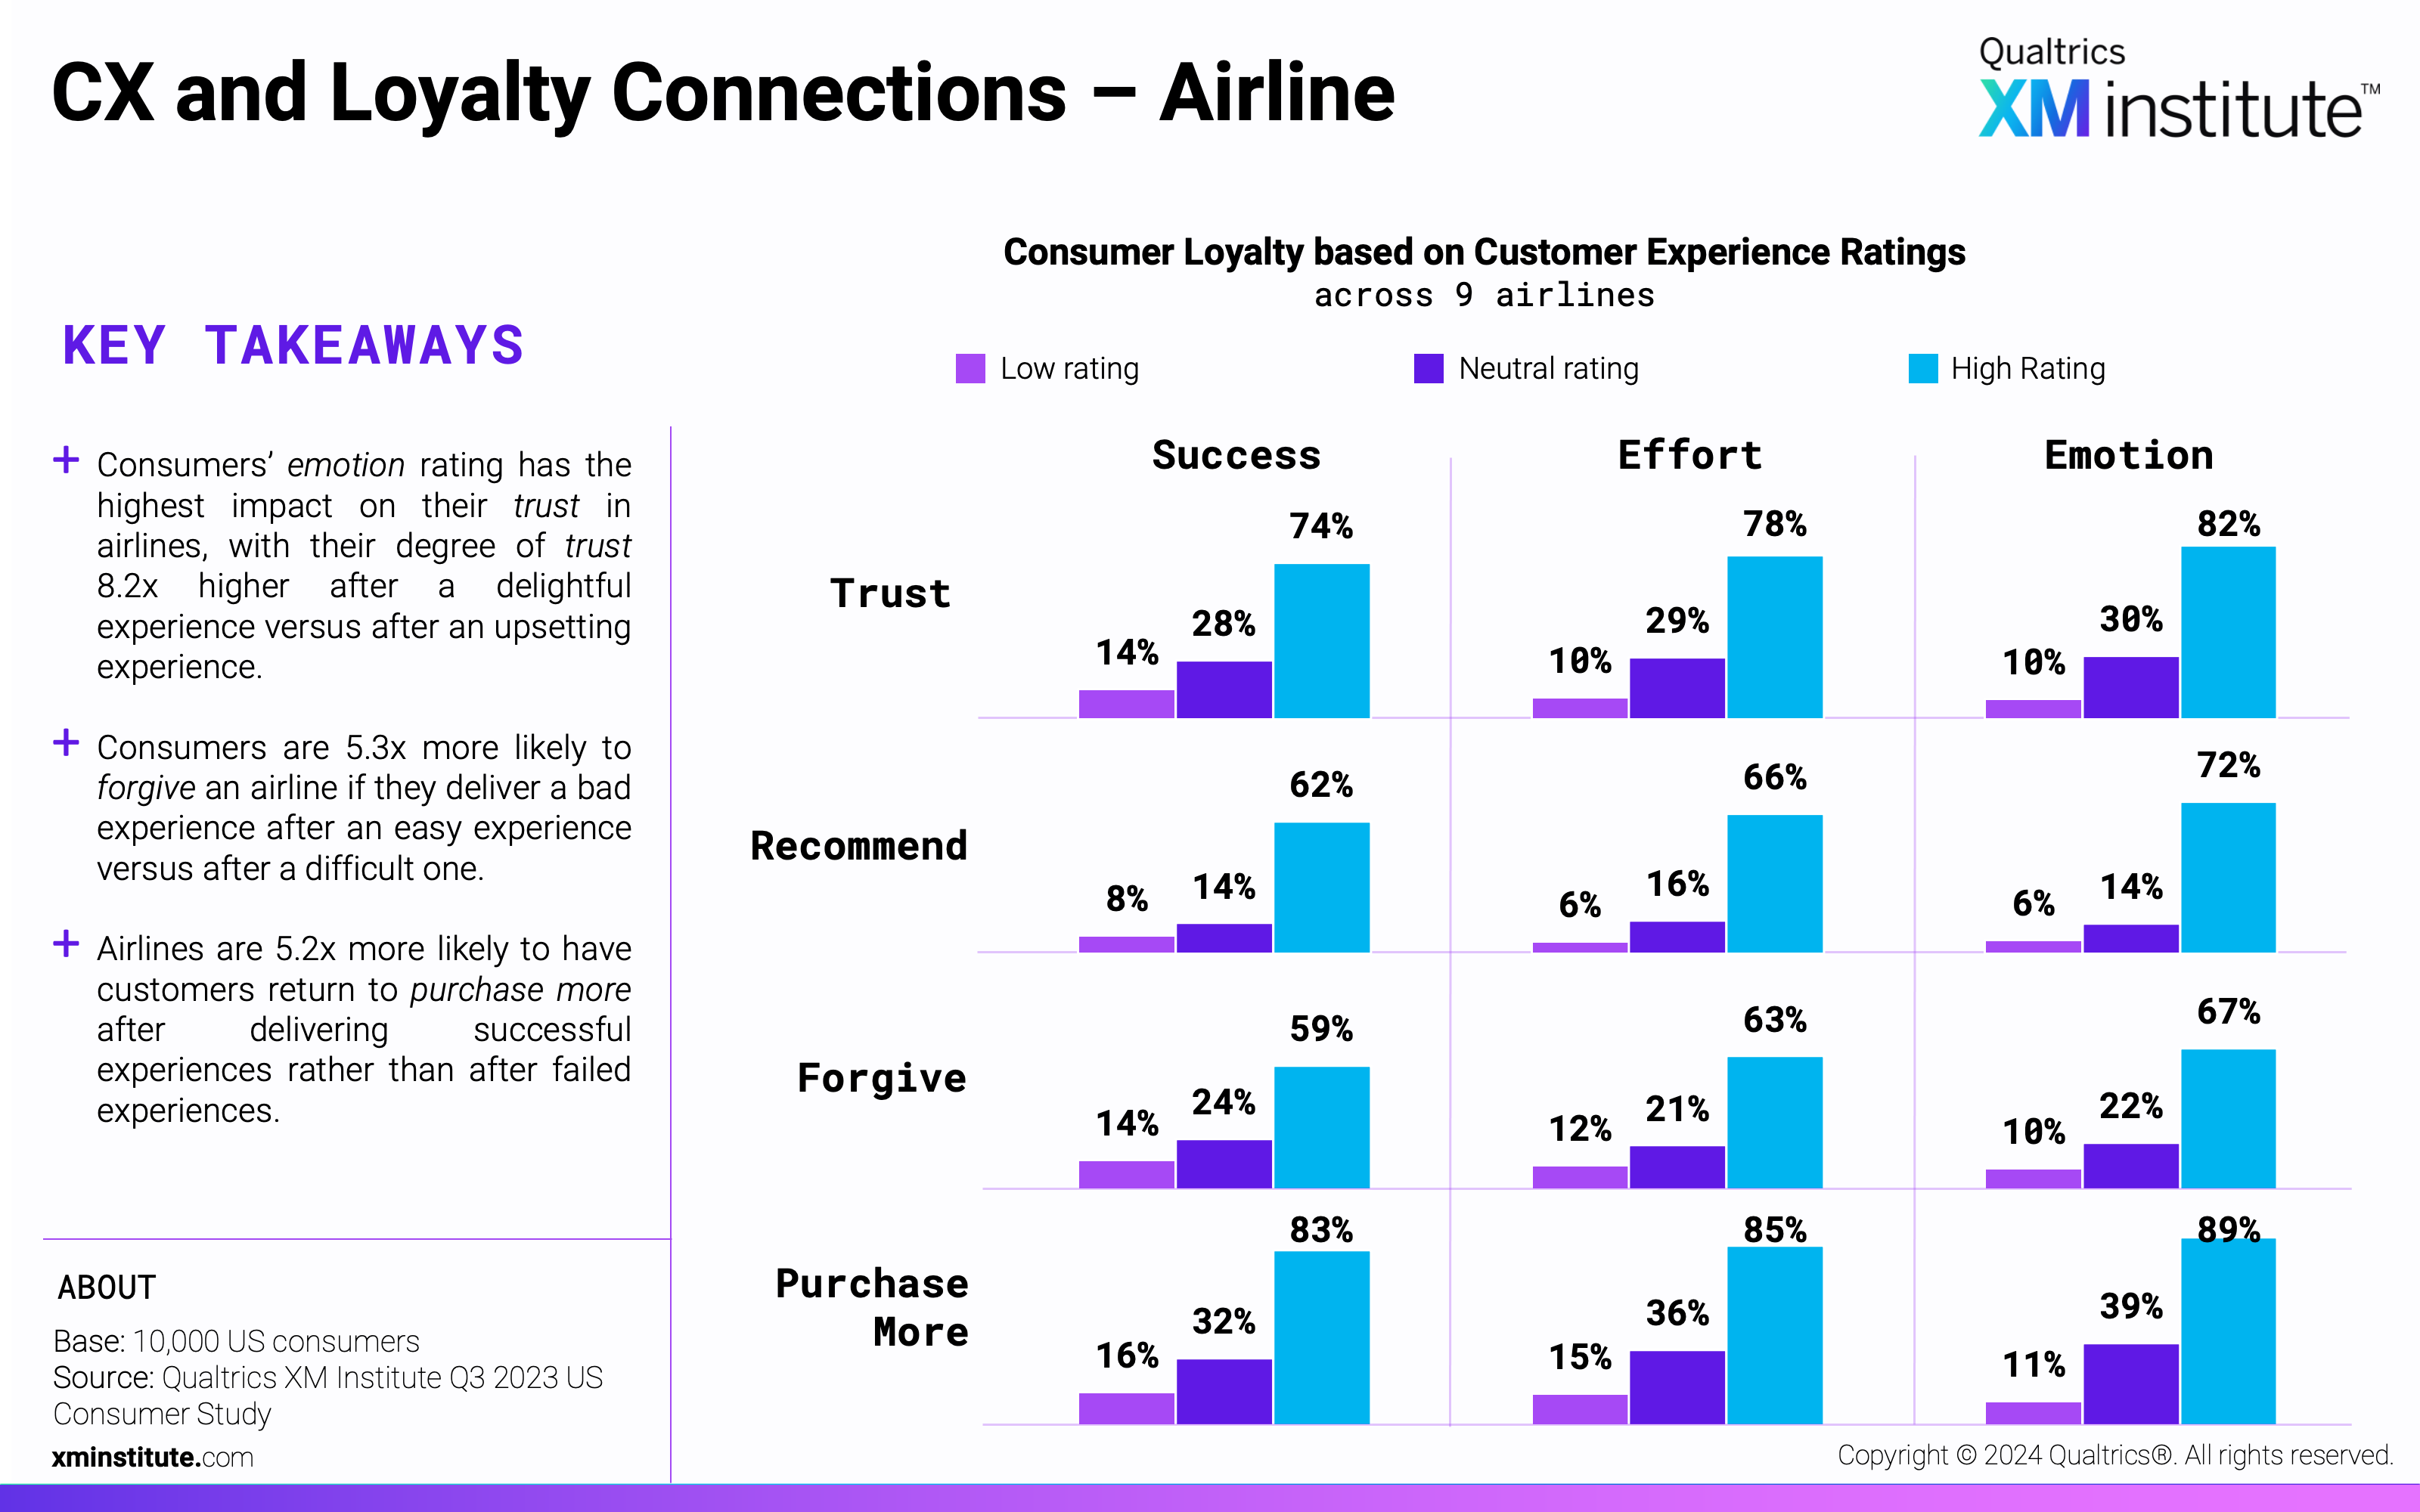
- Airlines benefit the most from strong customer experiences. Of the 22 industries, airlines’ success and emotion ratings have the strongest relationship with each the four loyalty behaviors. On average, consumers who give an airline high emotion ratings are 8.3x more likely to have strong loyalty than those with low emotion ratings, while those with high success ratings are 5.3x more likely to exhibit strong loyalty behaviors.
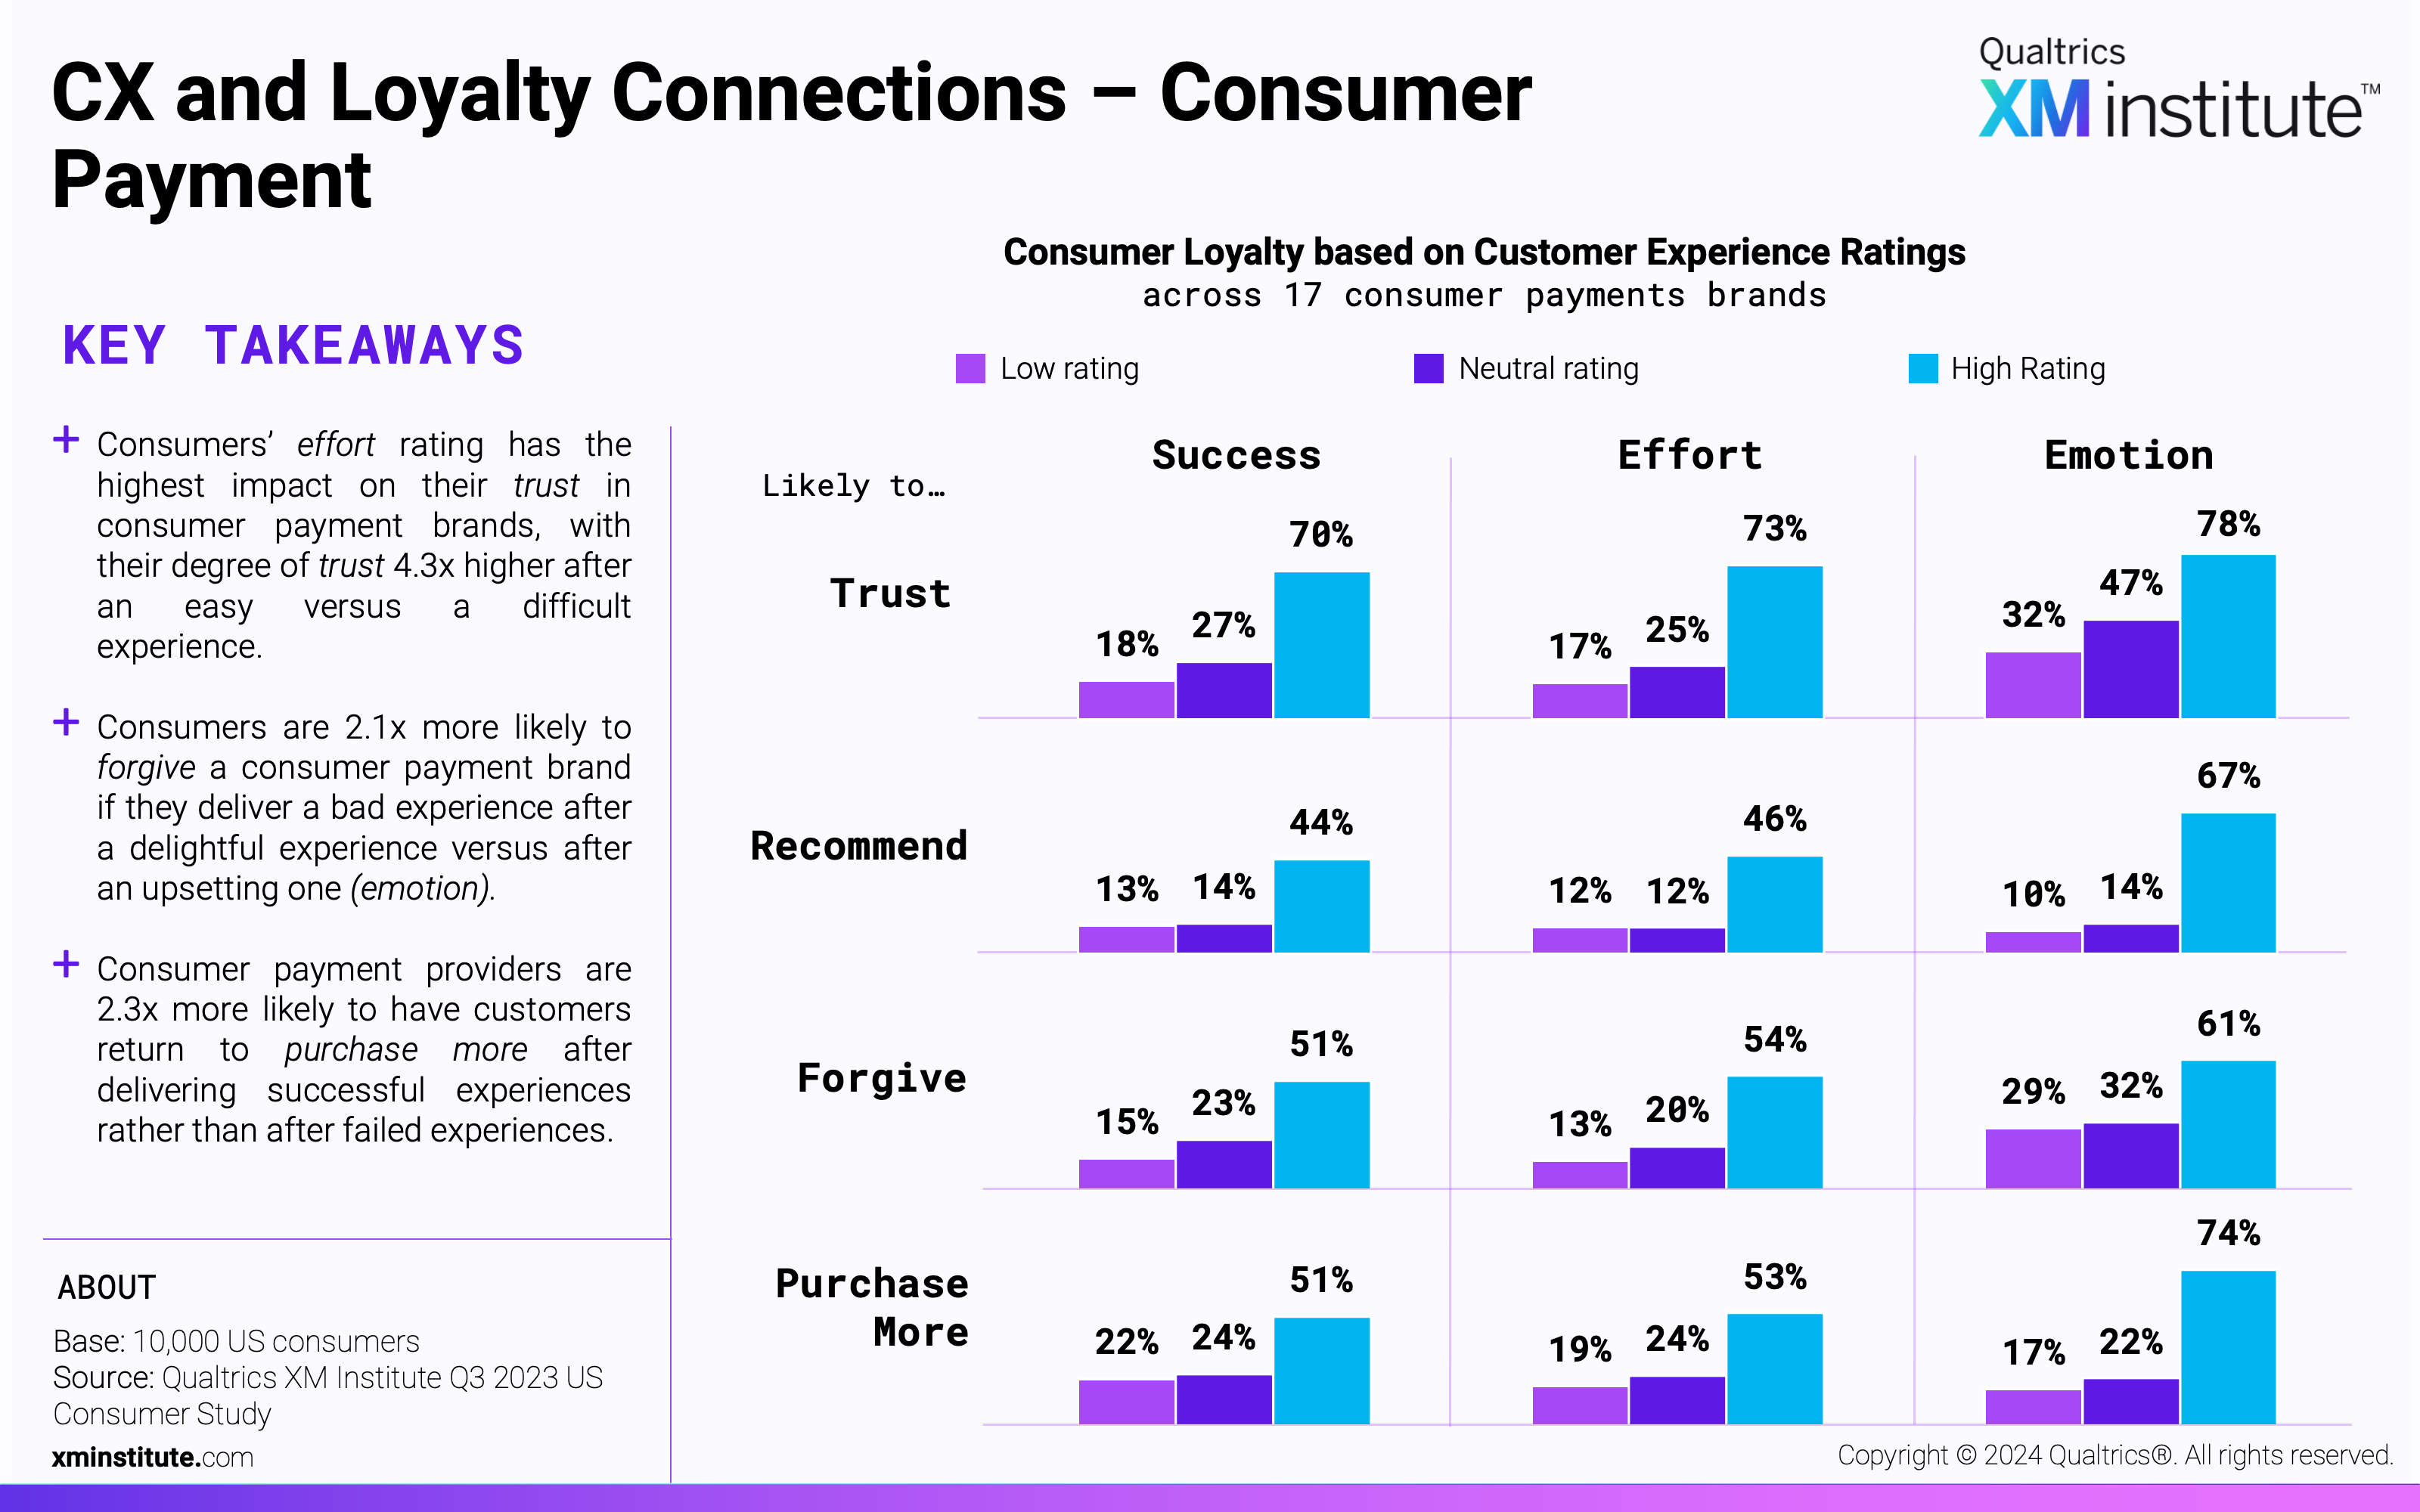
- Consumer payments loyalty is least affected by customer experience. Consumers with high success ratings are, on average, 37 points more likely than those with low success ratings to recommend, forgive, trust, and purchase more – the smallest gap across all 22 industries. Consumers with high effort ratings are 41 points more likely to exhibit these behaviors, while high emotion ratings leads to a 48 points gap – each the smallest gap present for the component.
Figures
Here are the figures in this data snapshot:
- Customer Experience and Loyalty Measurements (see Figure 1)
- CX and Loyalty Connections – All Industries (see Figure 2)
- CX and Loyalty Connections – Airline (see Figure 3)
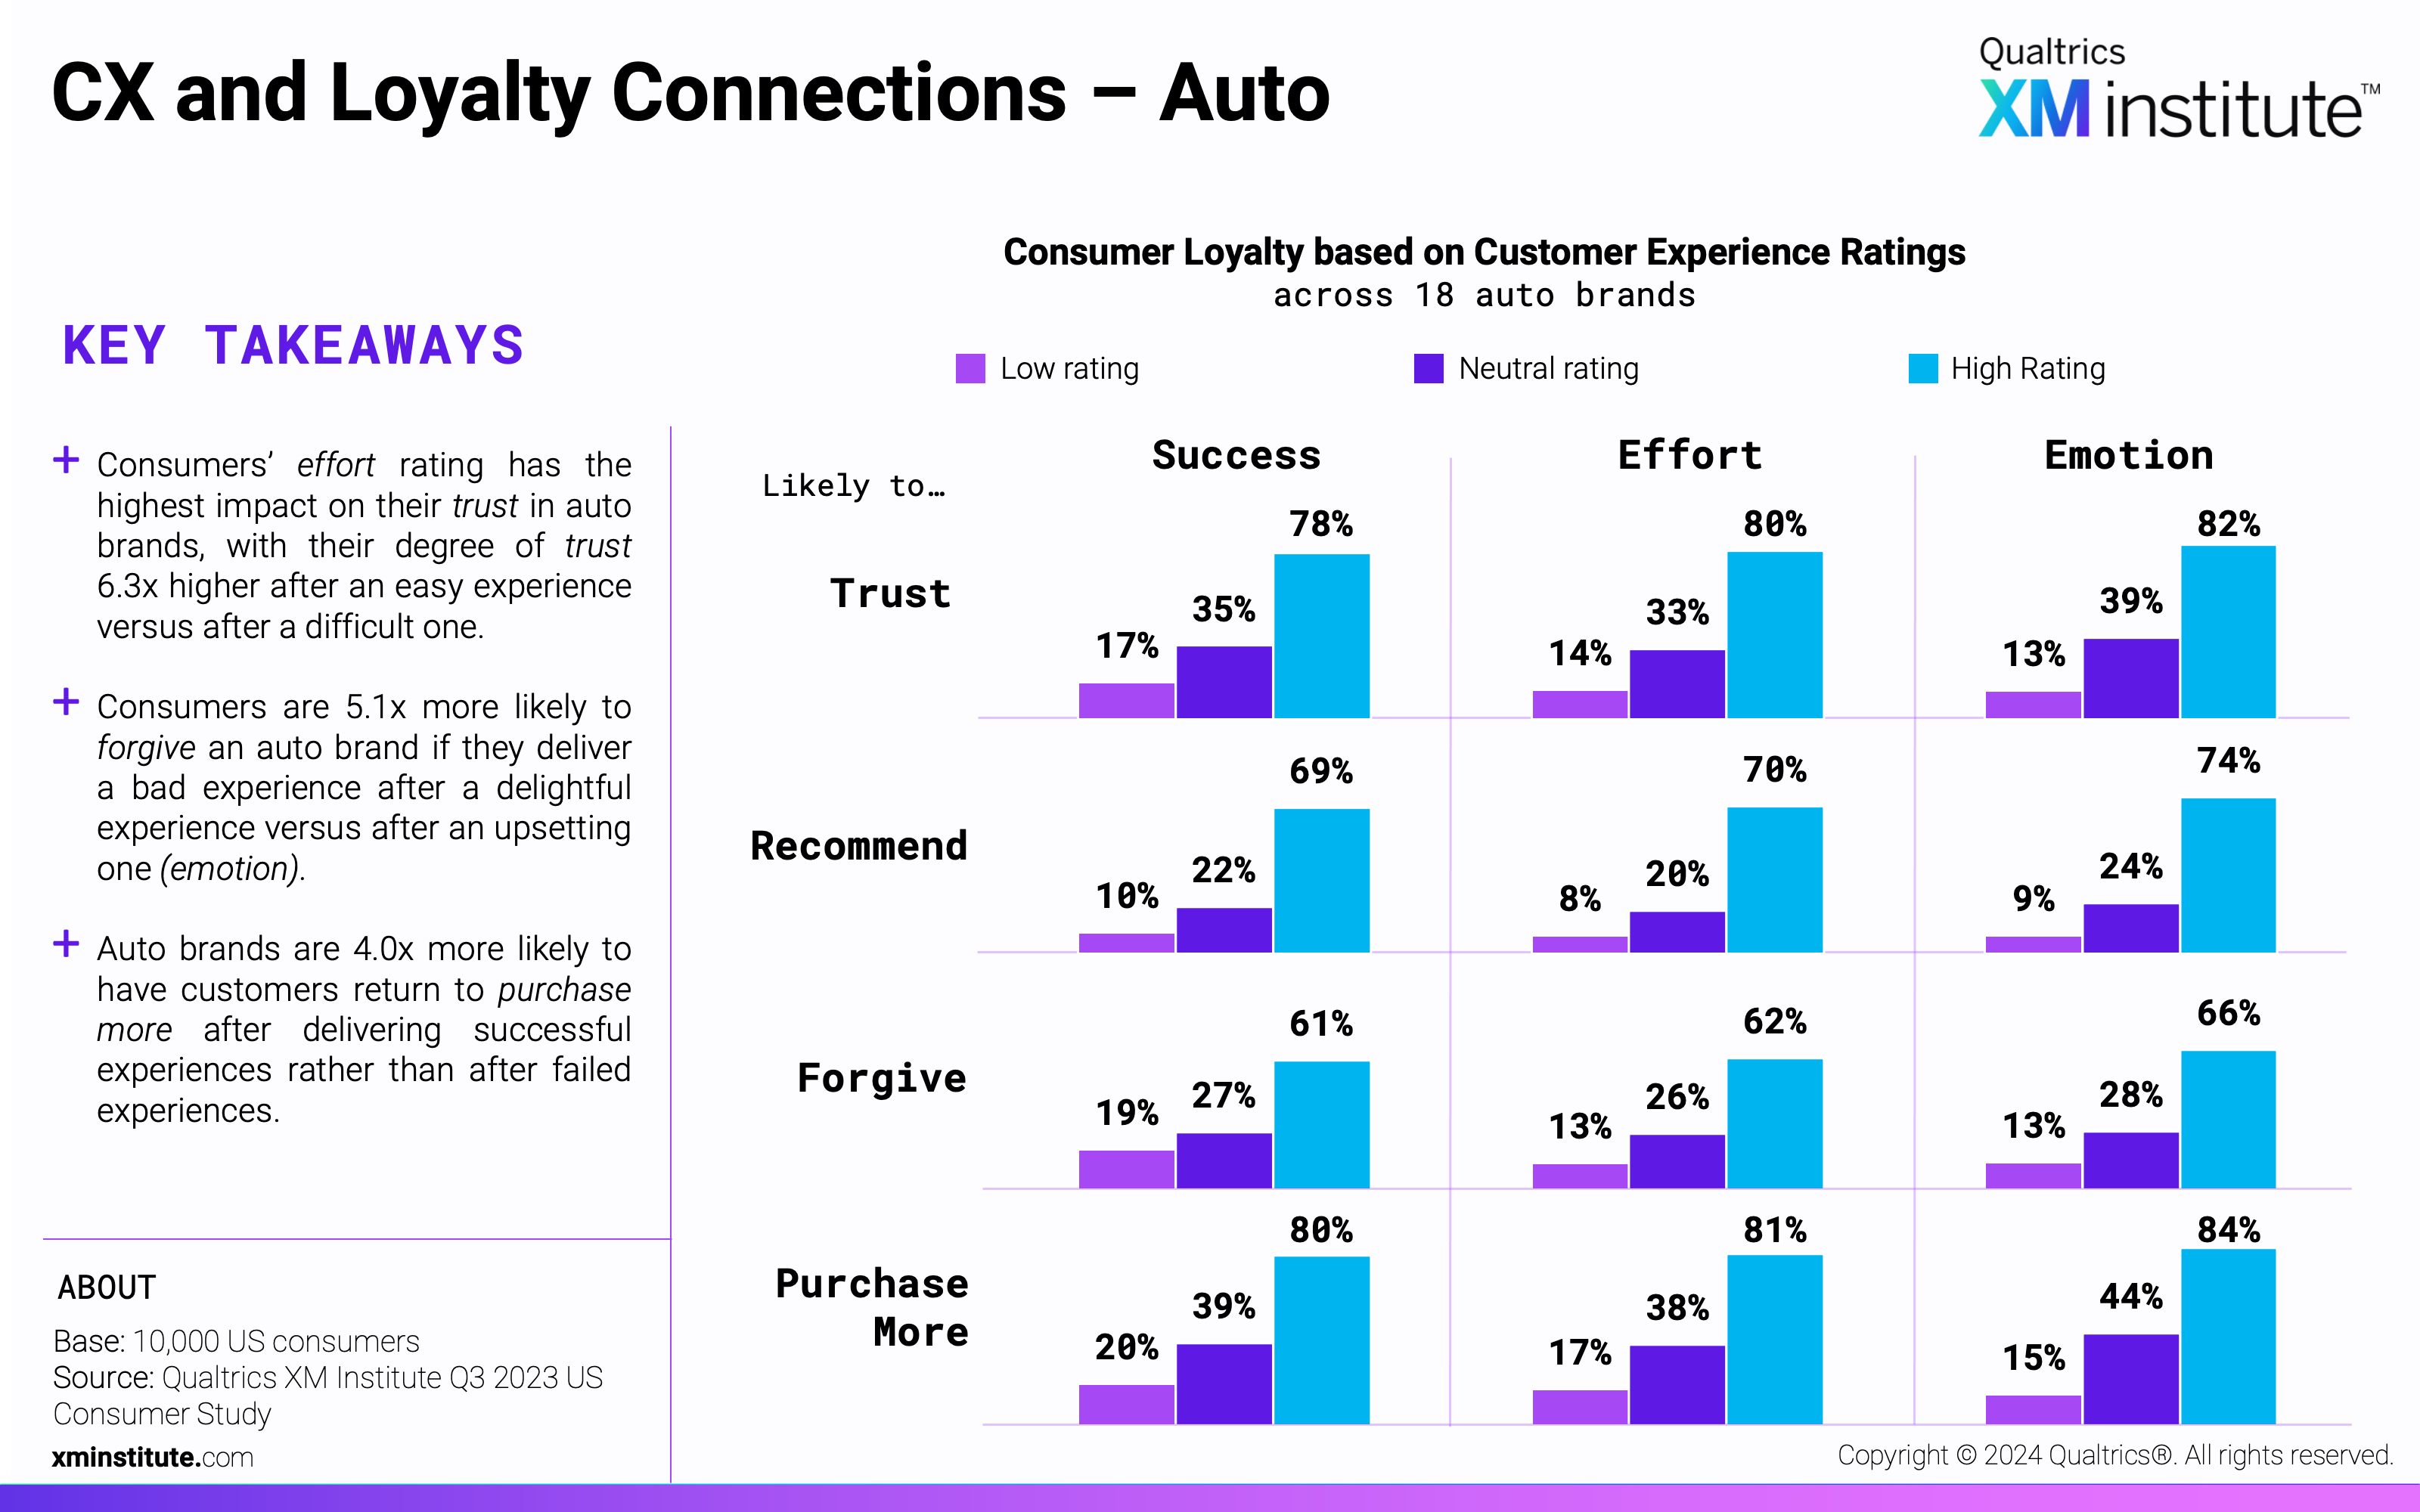
- CX and Loyalty Connections – Auto (see Figure 4)
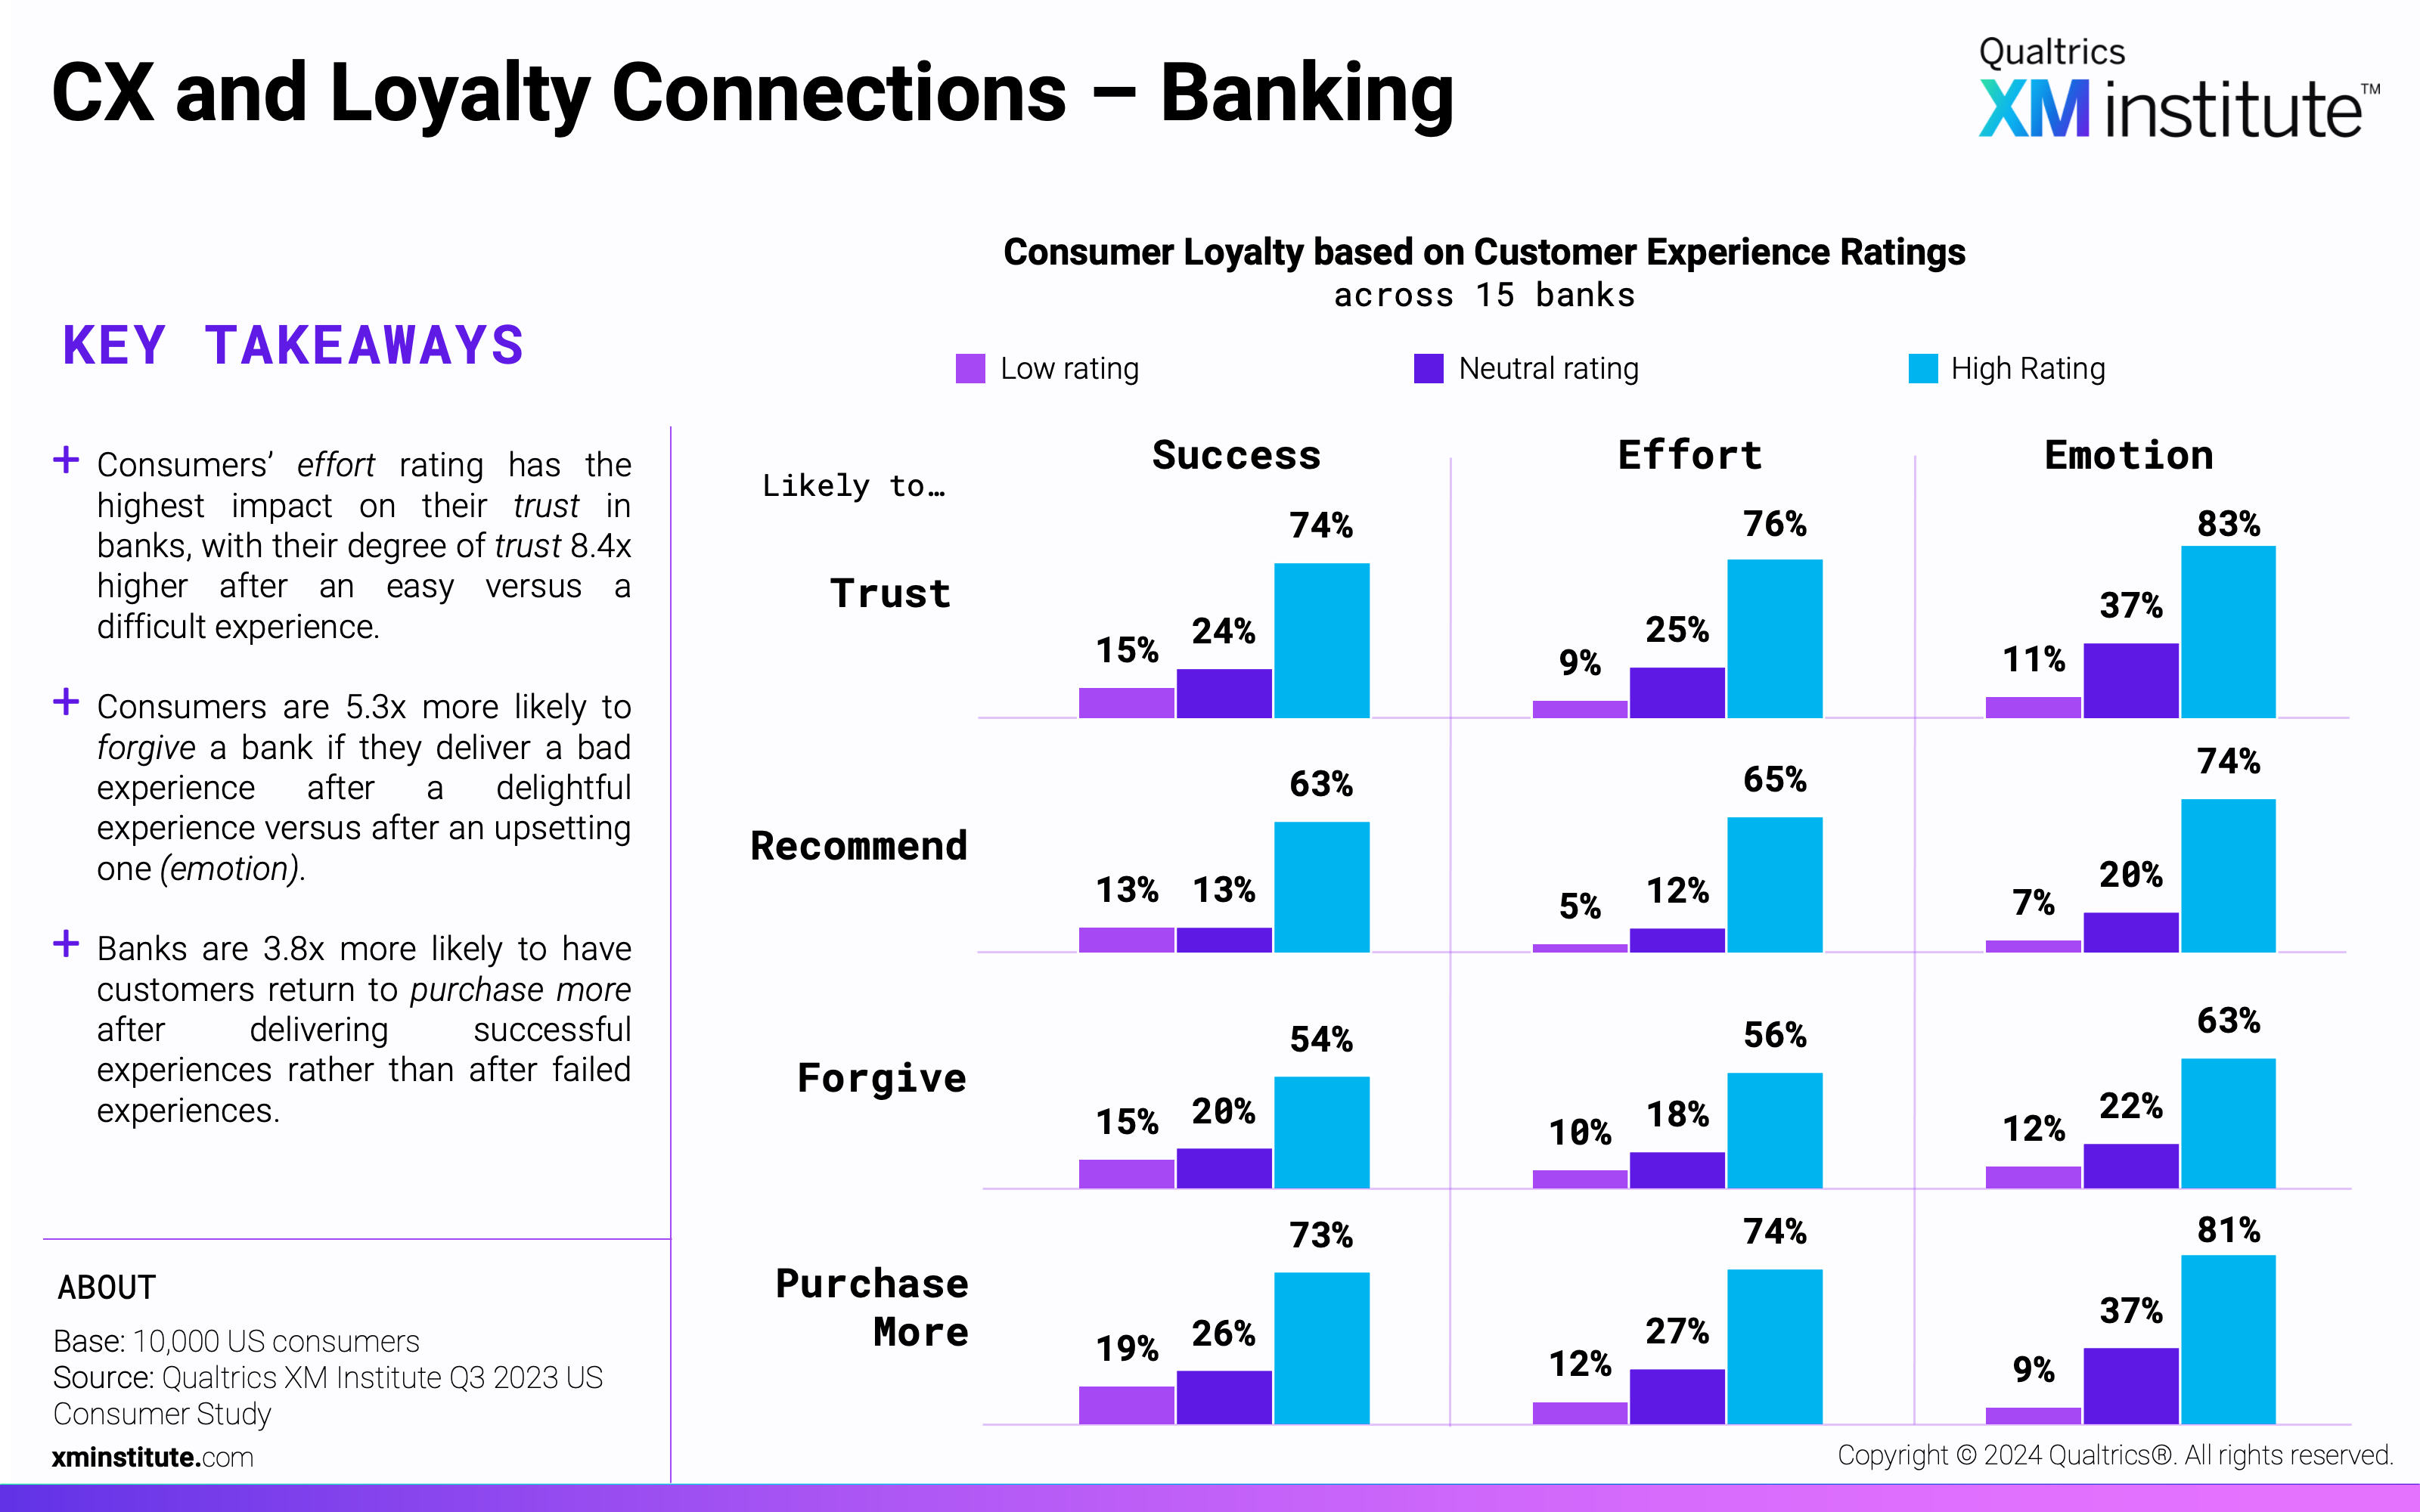
- CX and Loyalty Connections – Banking (see Figure 5)
- CX and Loyalty Connections – Car Rental (see Figure 6)
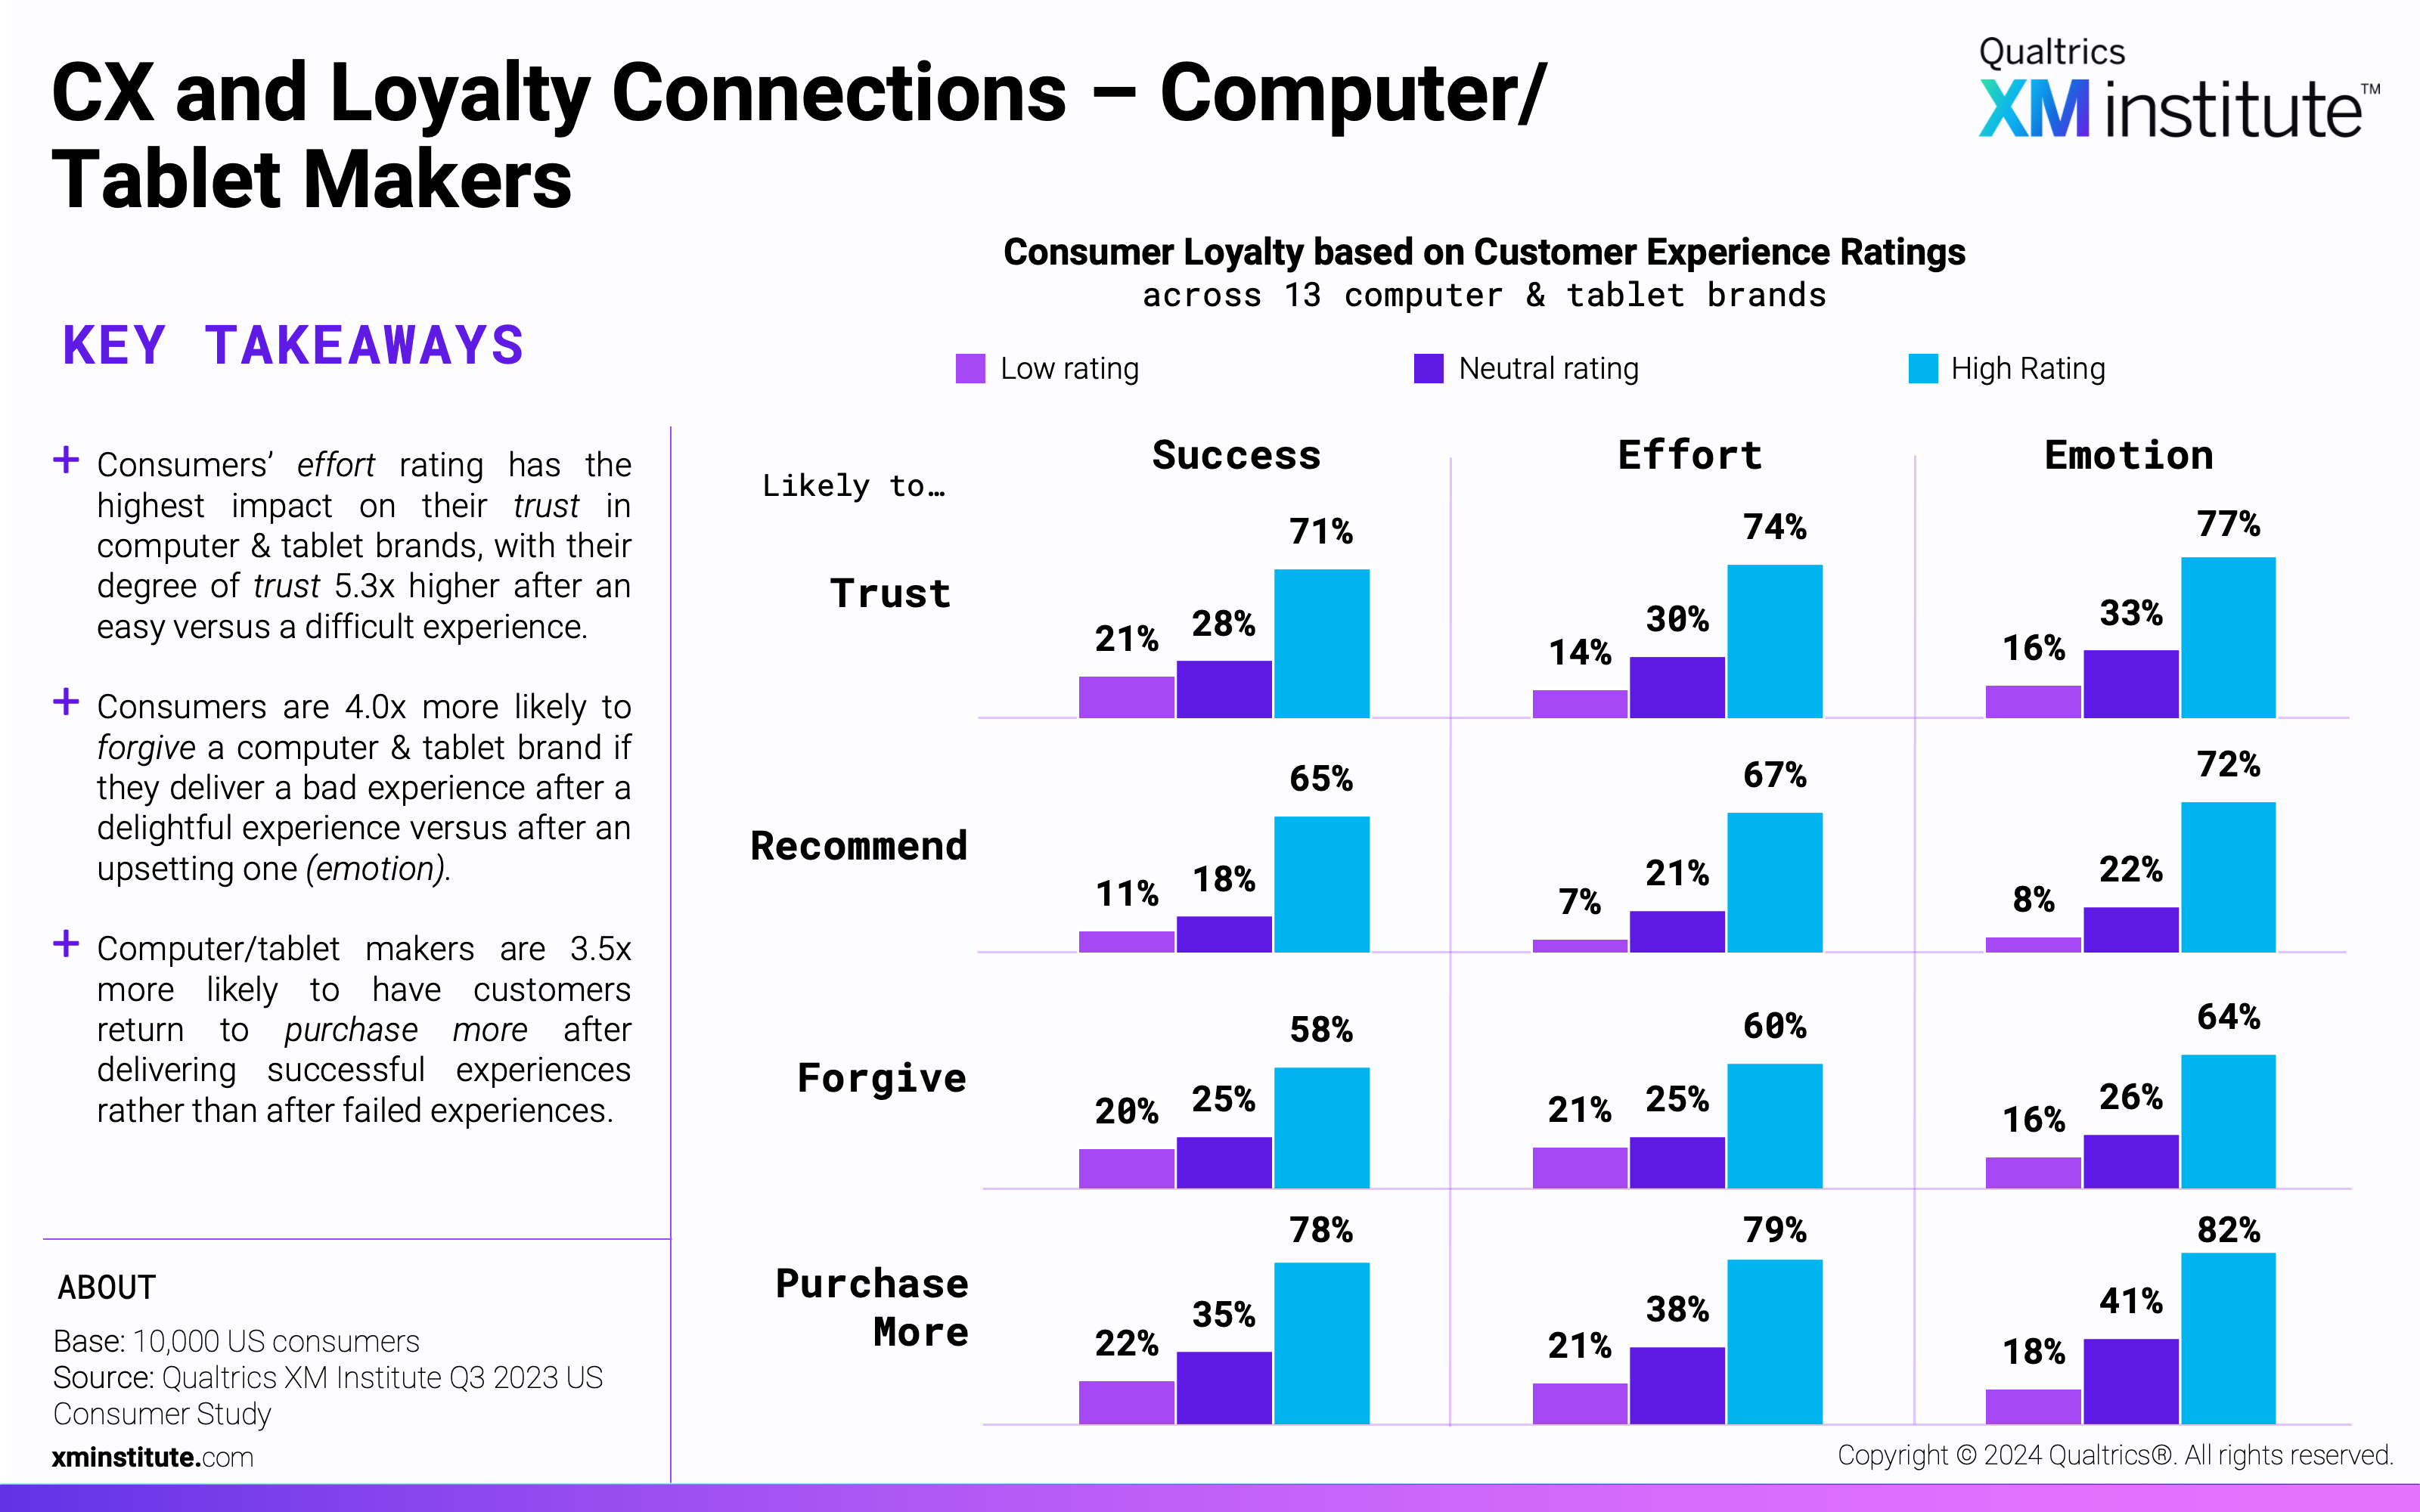
- CX and Loyalty Connections – Computer/ Tablet Makers (see Figure 7)
- CX and Loyalty Connections – Consumer Payment (see Figure 8)
- CX and Loyalty Connections – Electronics (see Figure 9)
- CX and Loyalty Connections – Fast Food (see Figure 10)
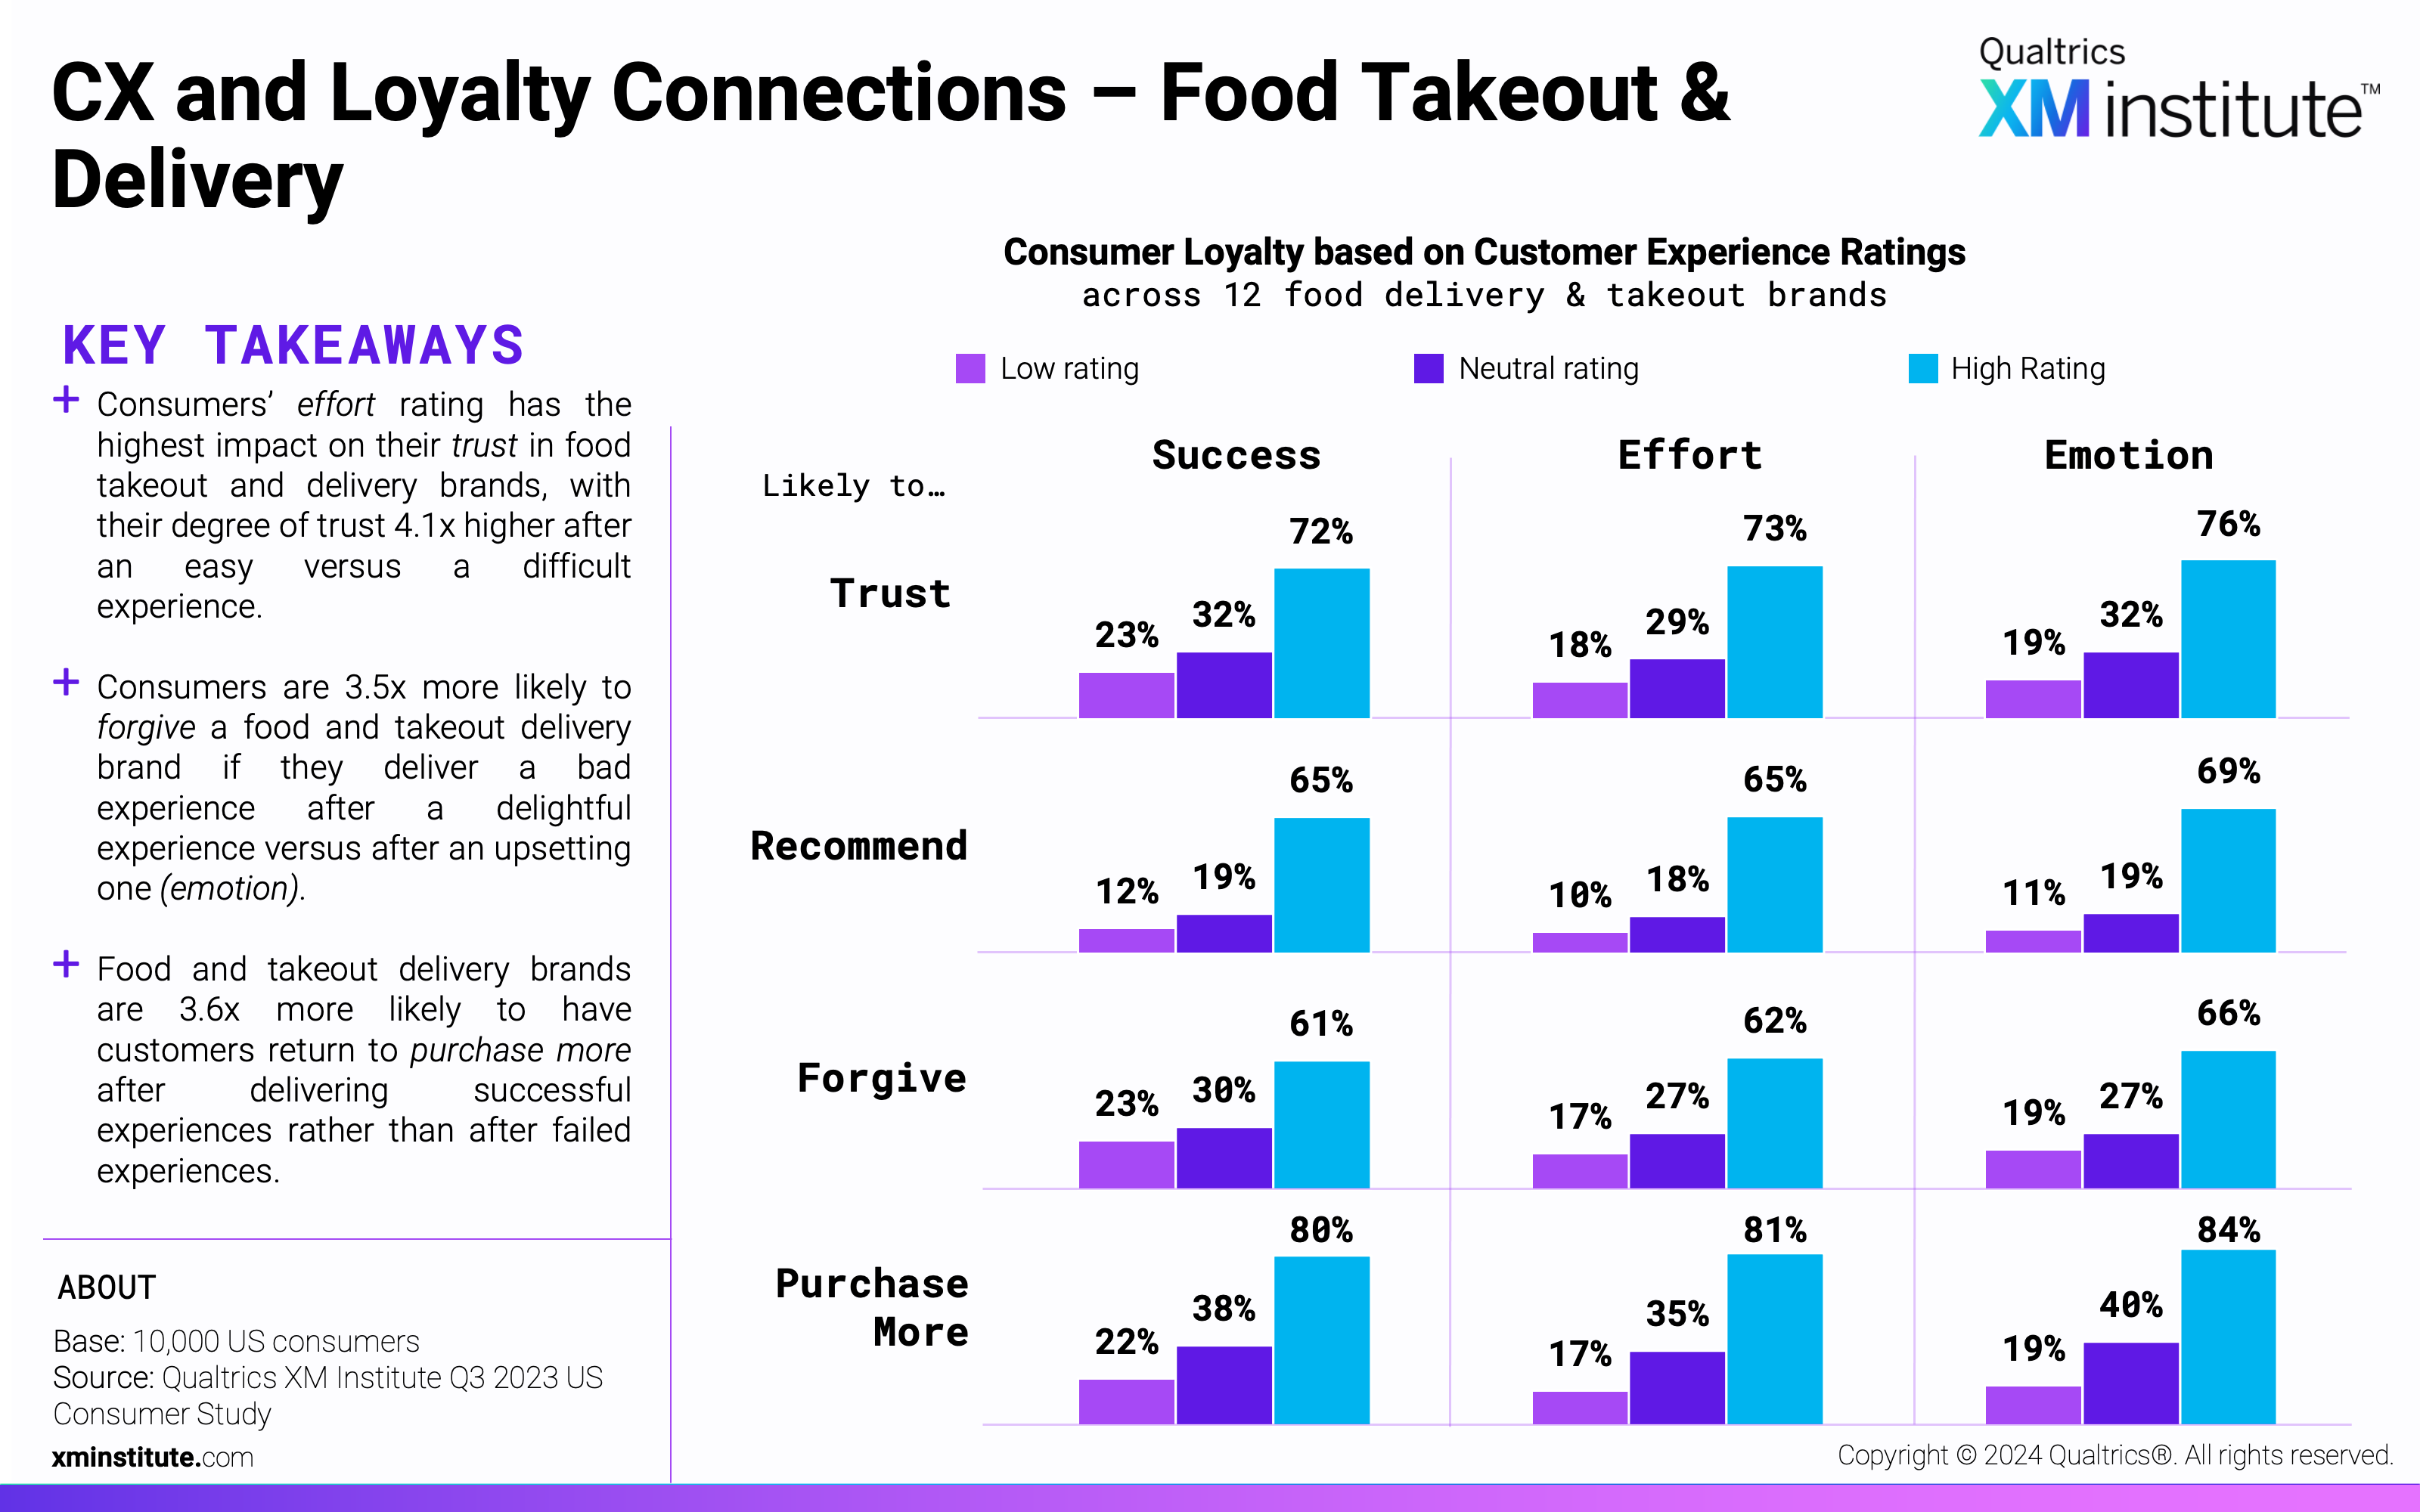
- CX and Loyalty Connections – Food Takeout & Delivery (see Figure 11)
- CX and Loyalty Connections – Grocery (see Figure 12)
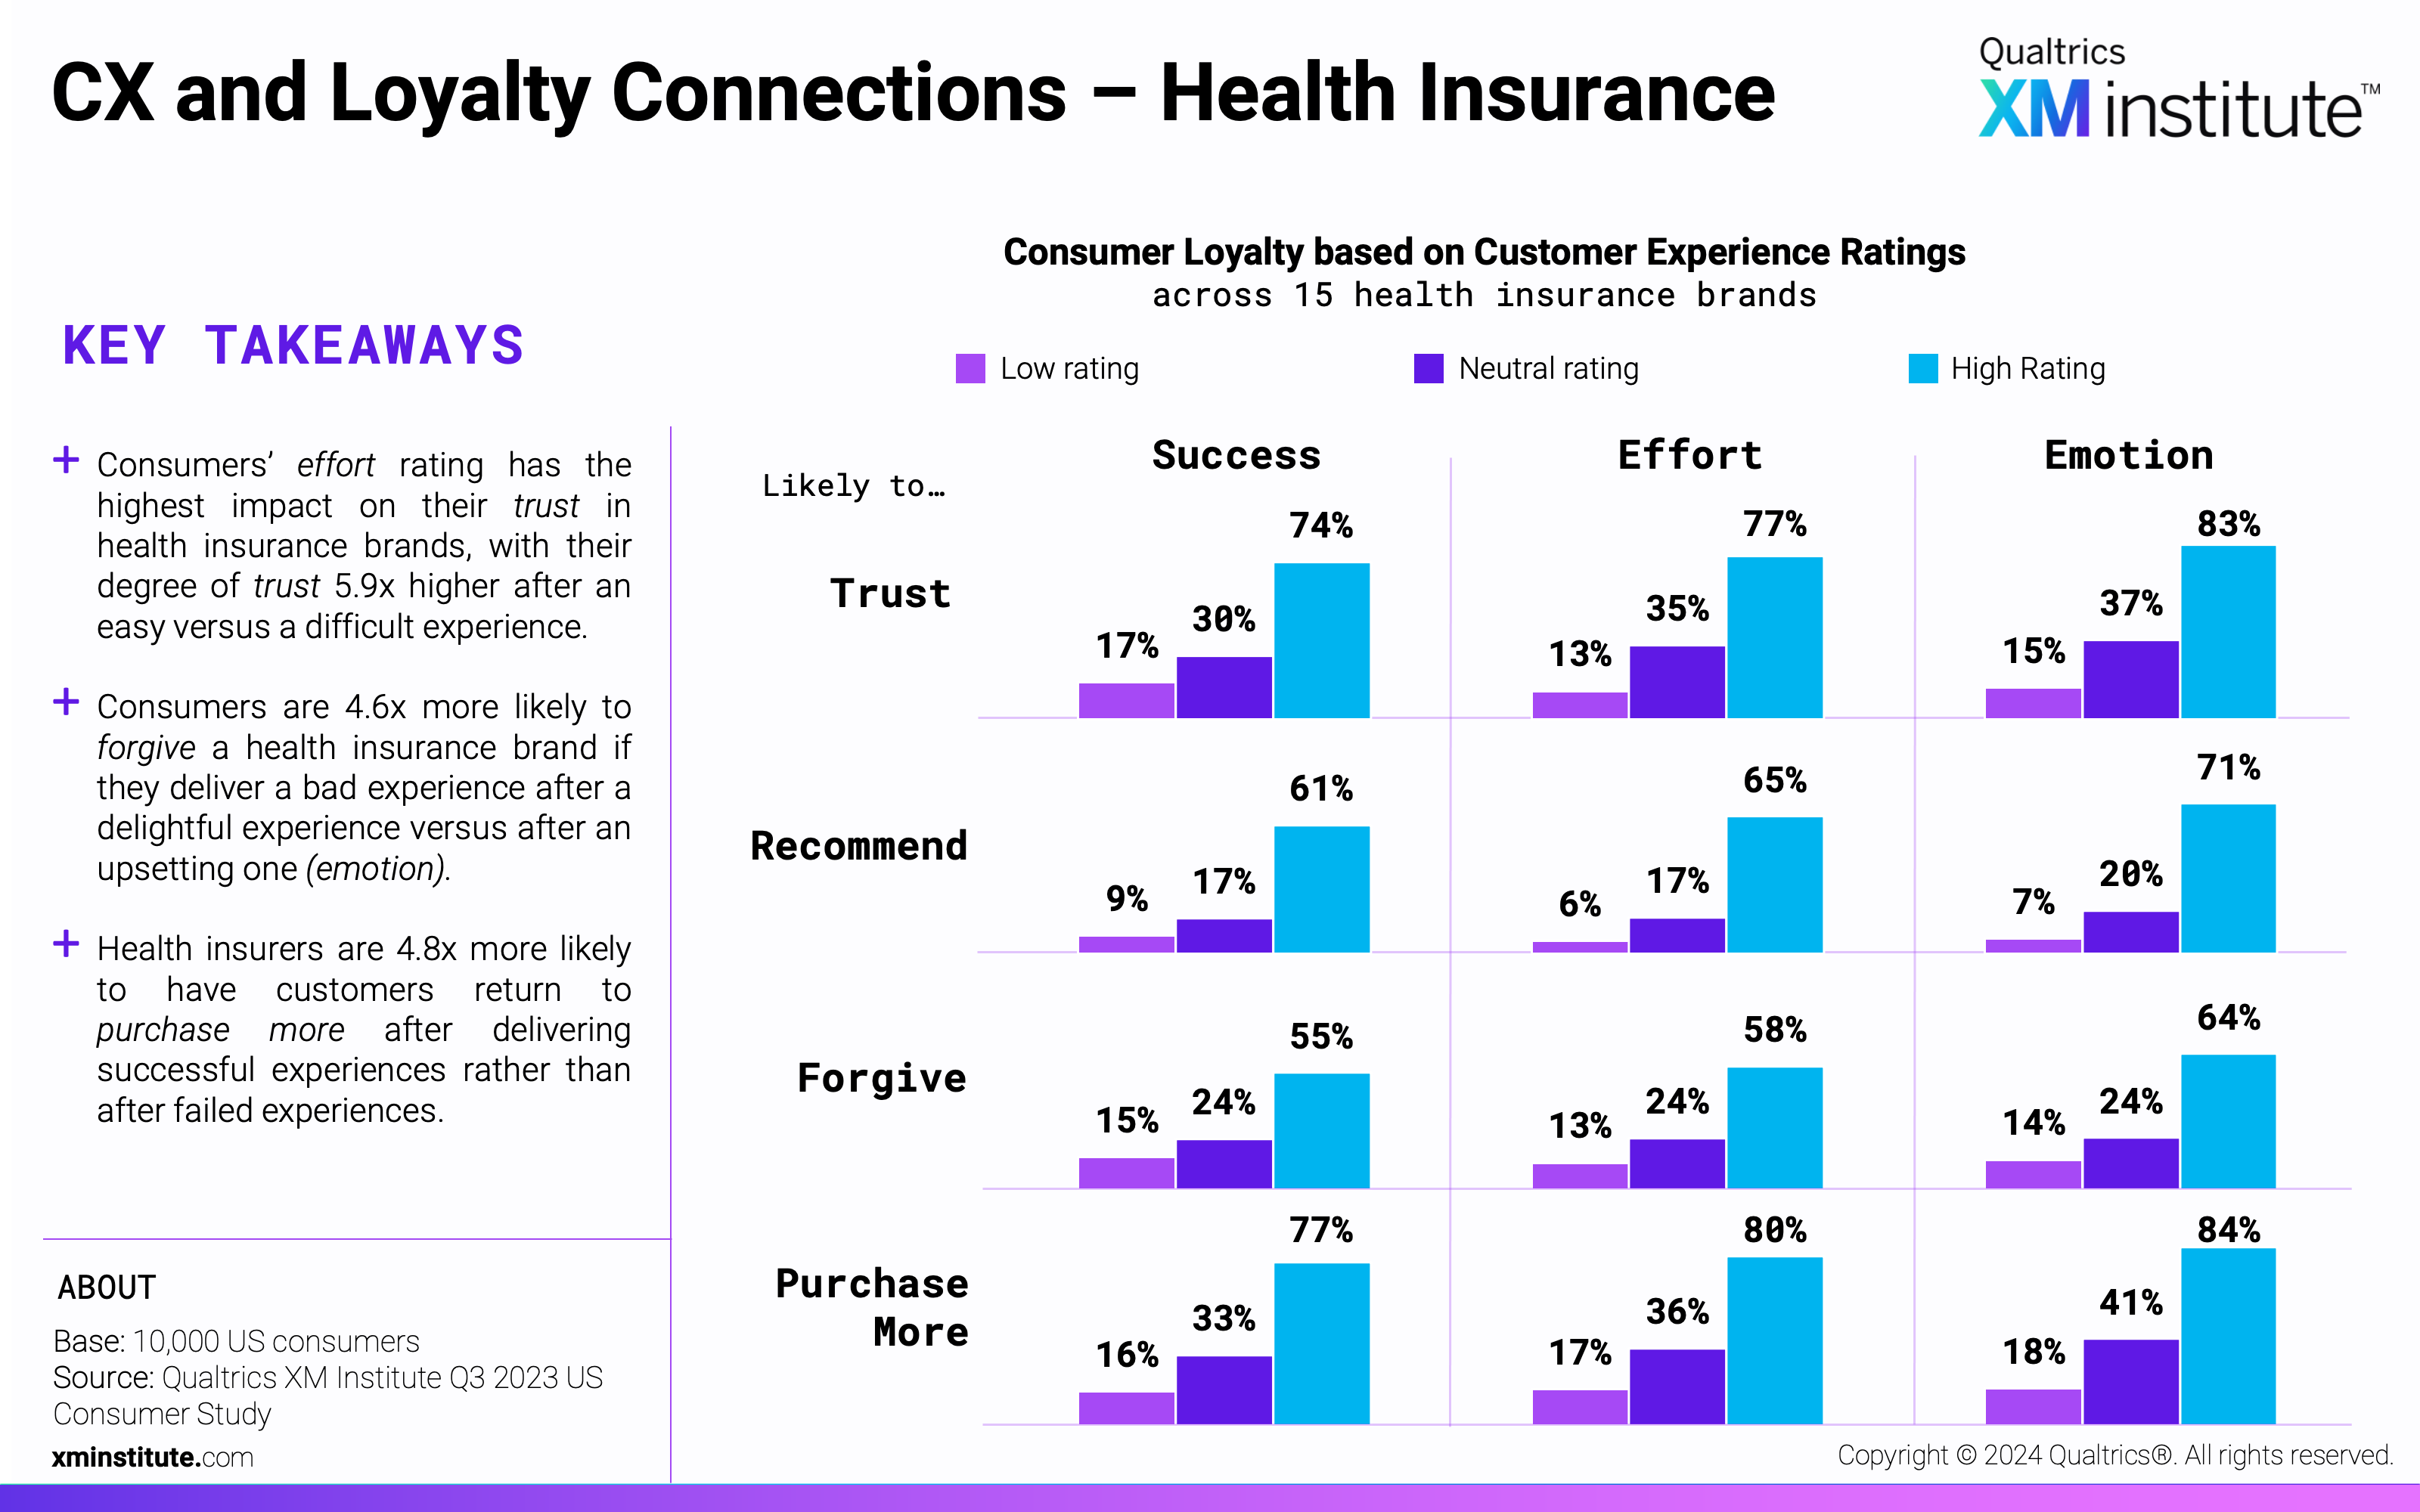
- CX and Loyalty Connections – Health Insurance (see Figure 13)
- CX and Loyalty Connections – Hotel (see Figure 14)
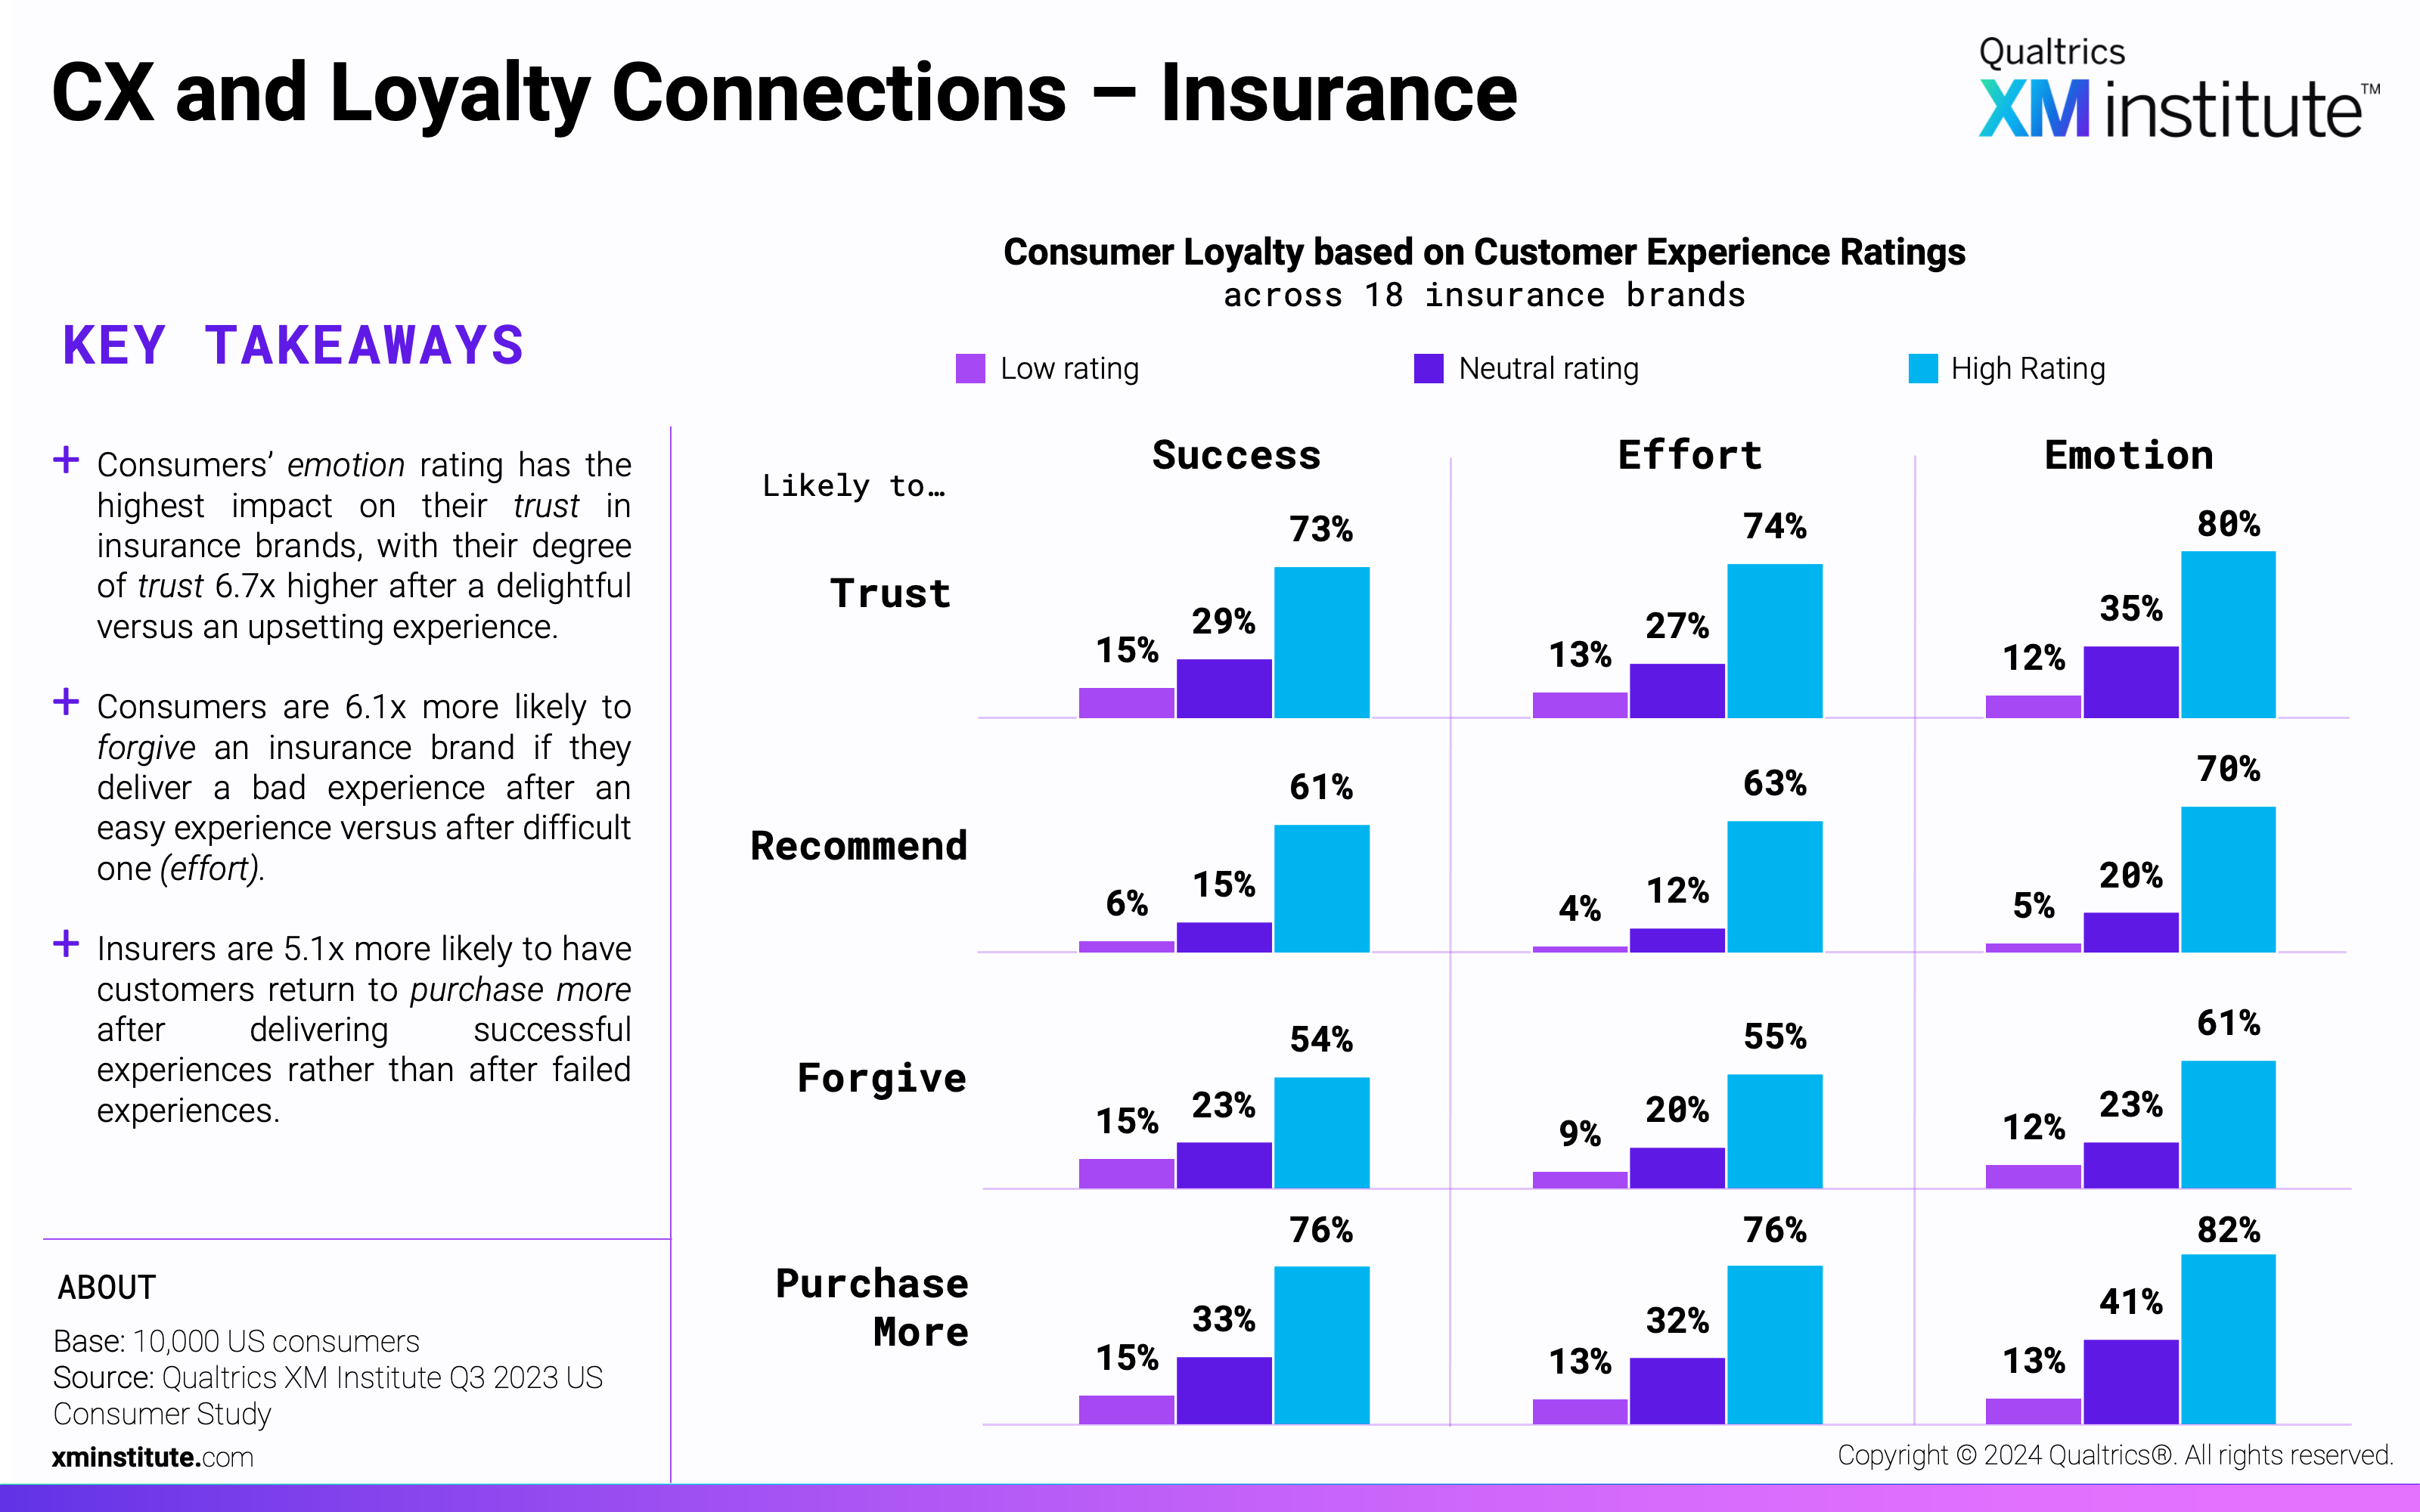
- CX and Loyalty Connections – Insurance (see Figure 15)
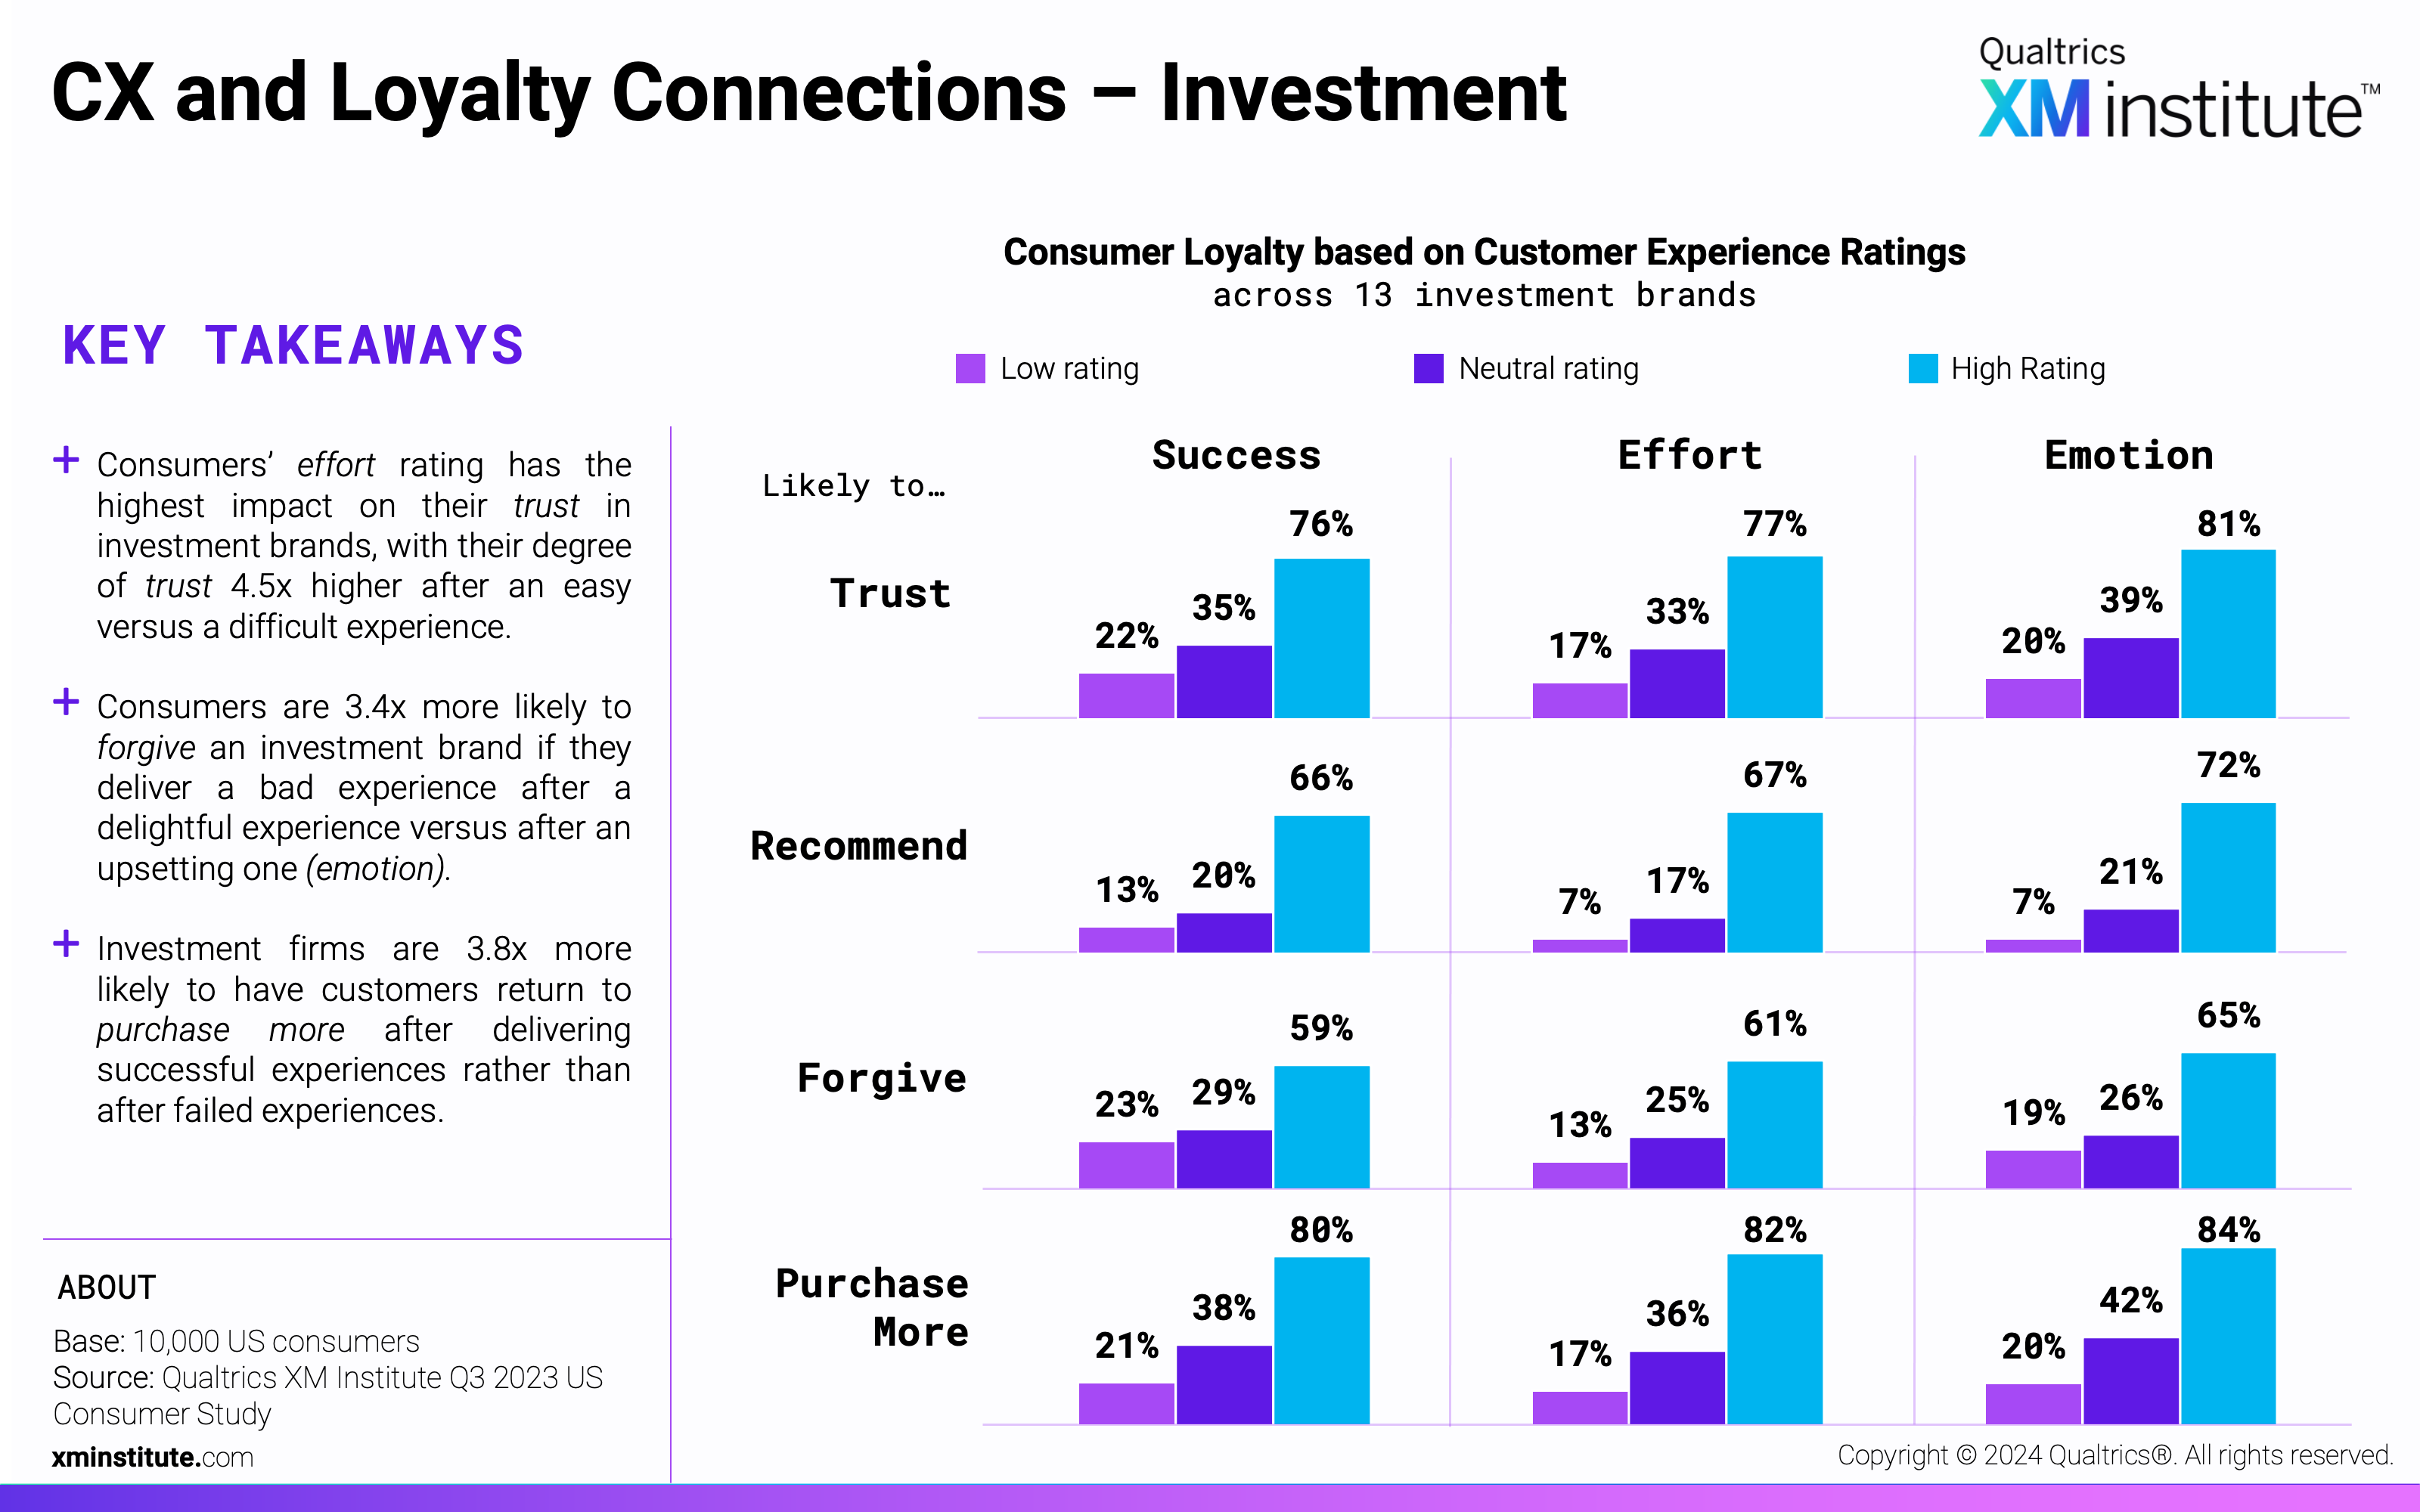
- CX and Loyalty Connections – Investment (see Figure 16)
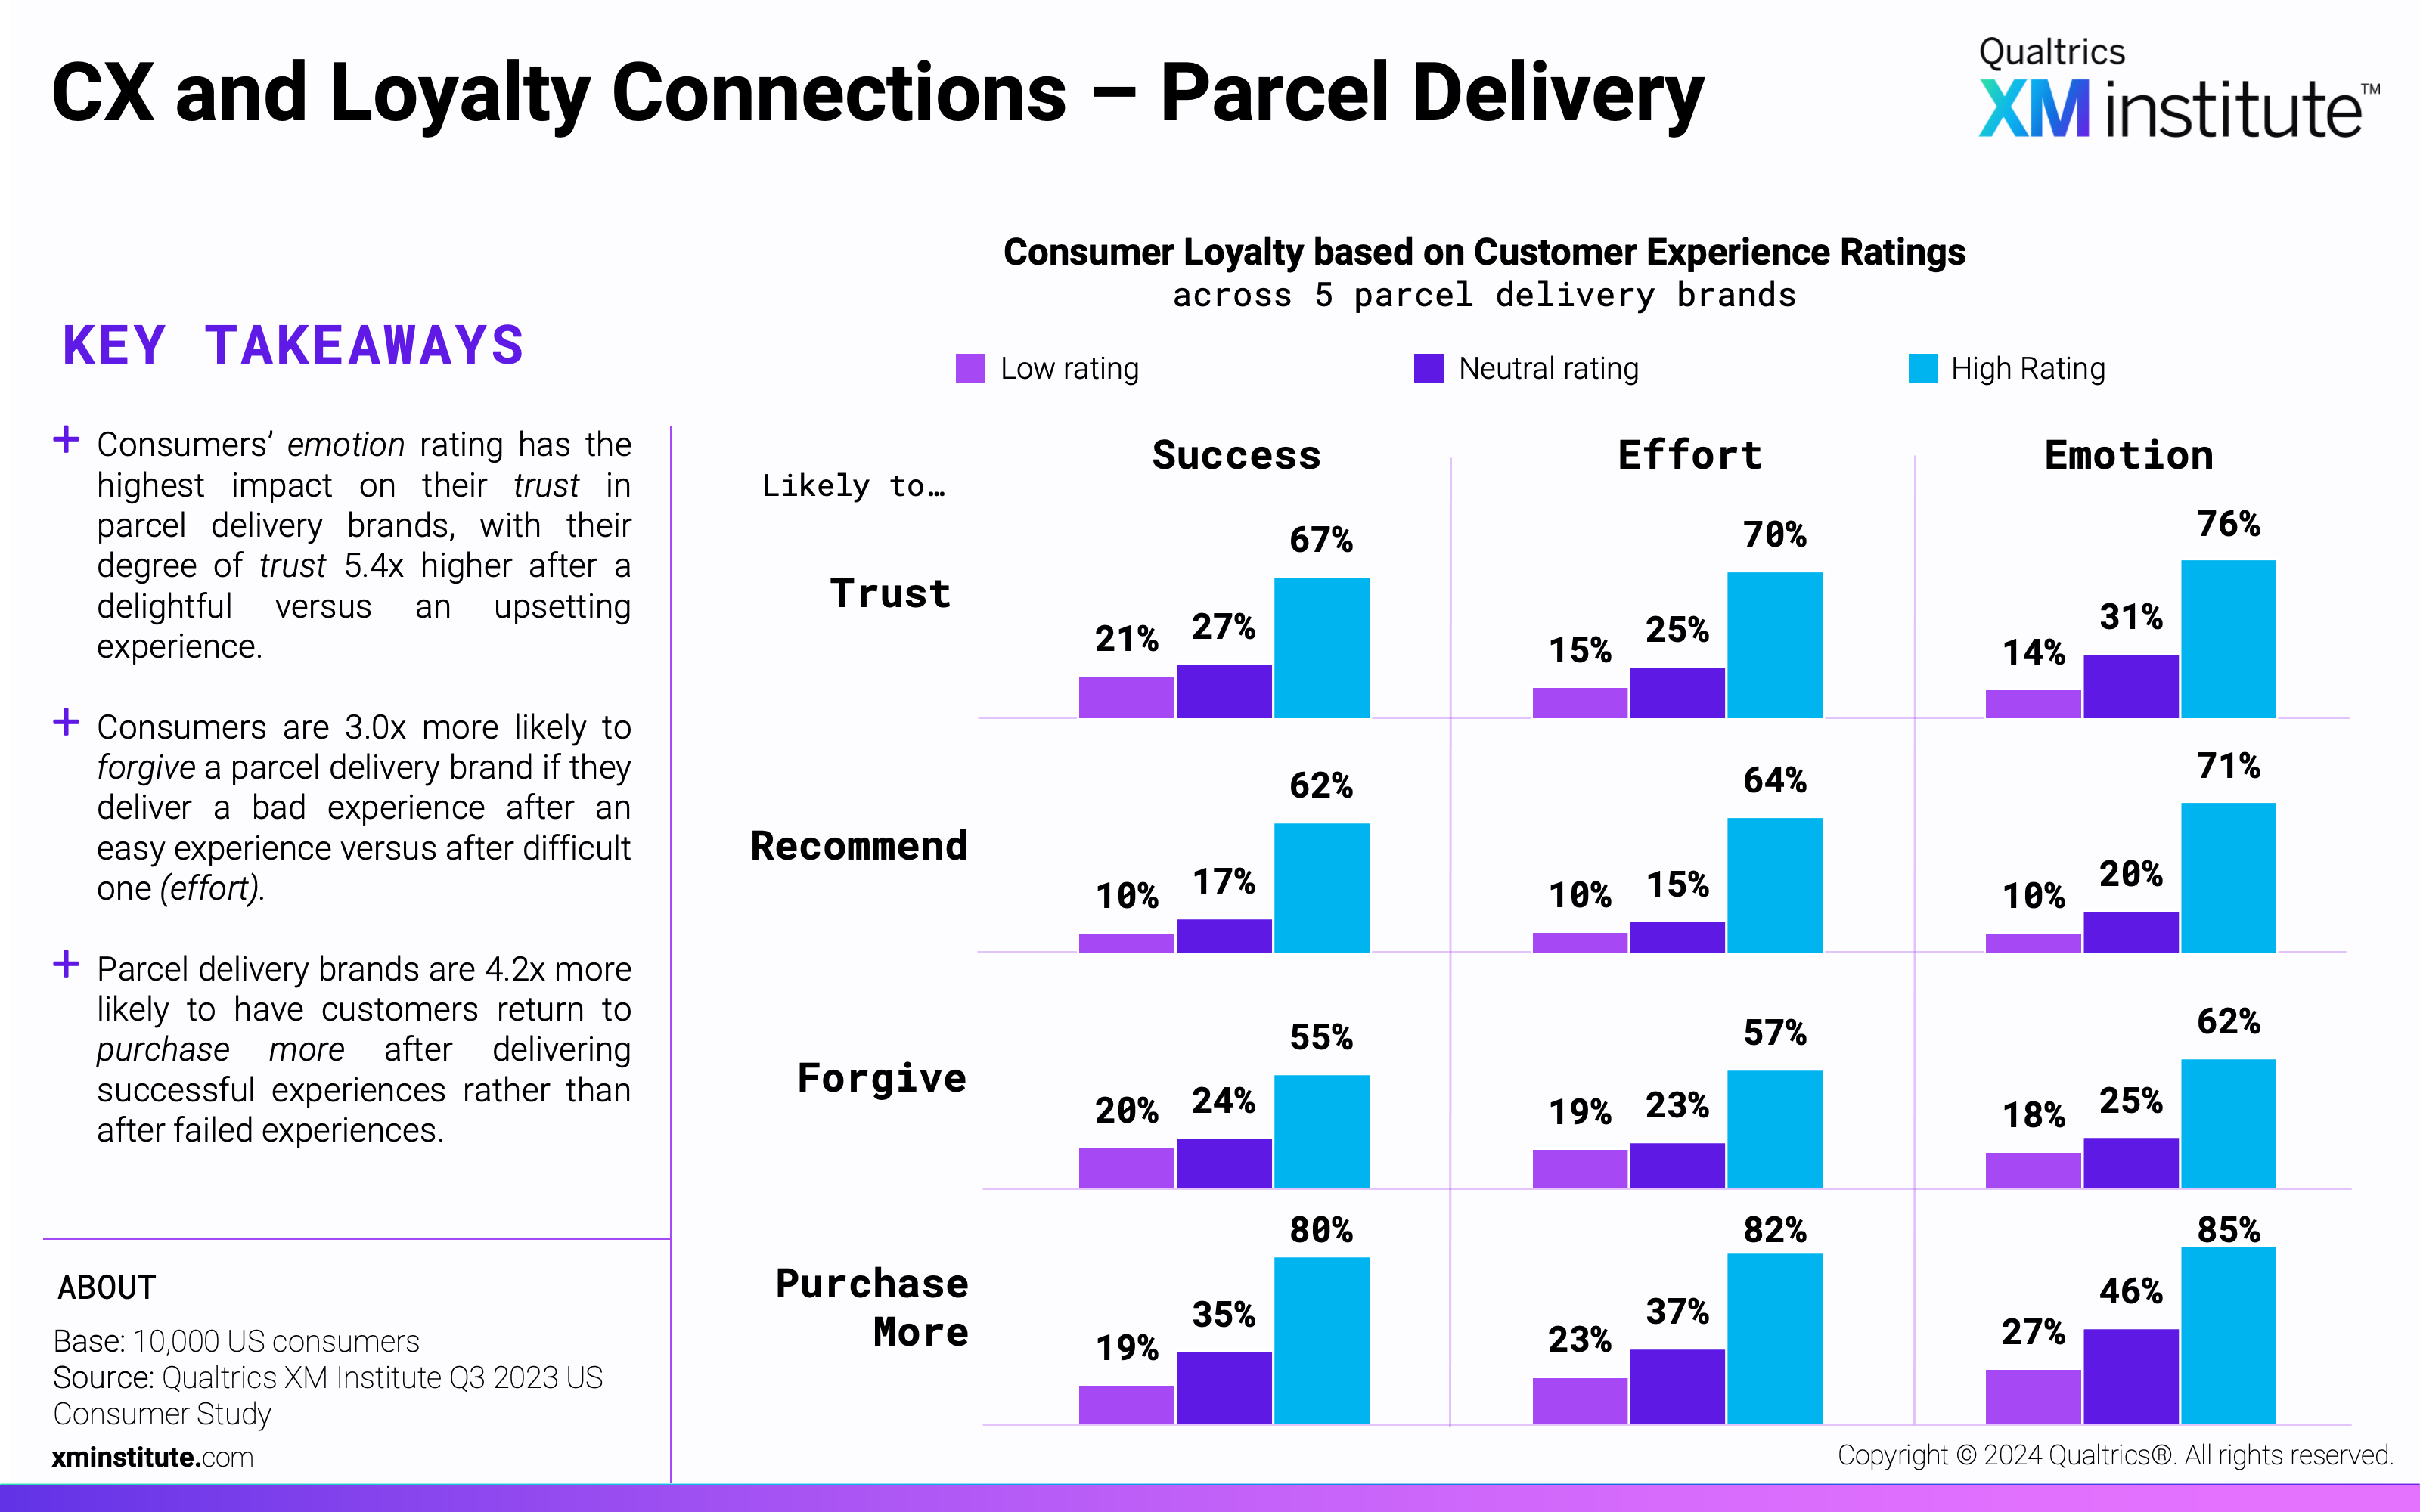
- CX and Loyalty Connections – Parcel Delivery (see Figure 17)
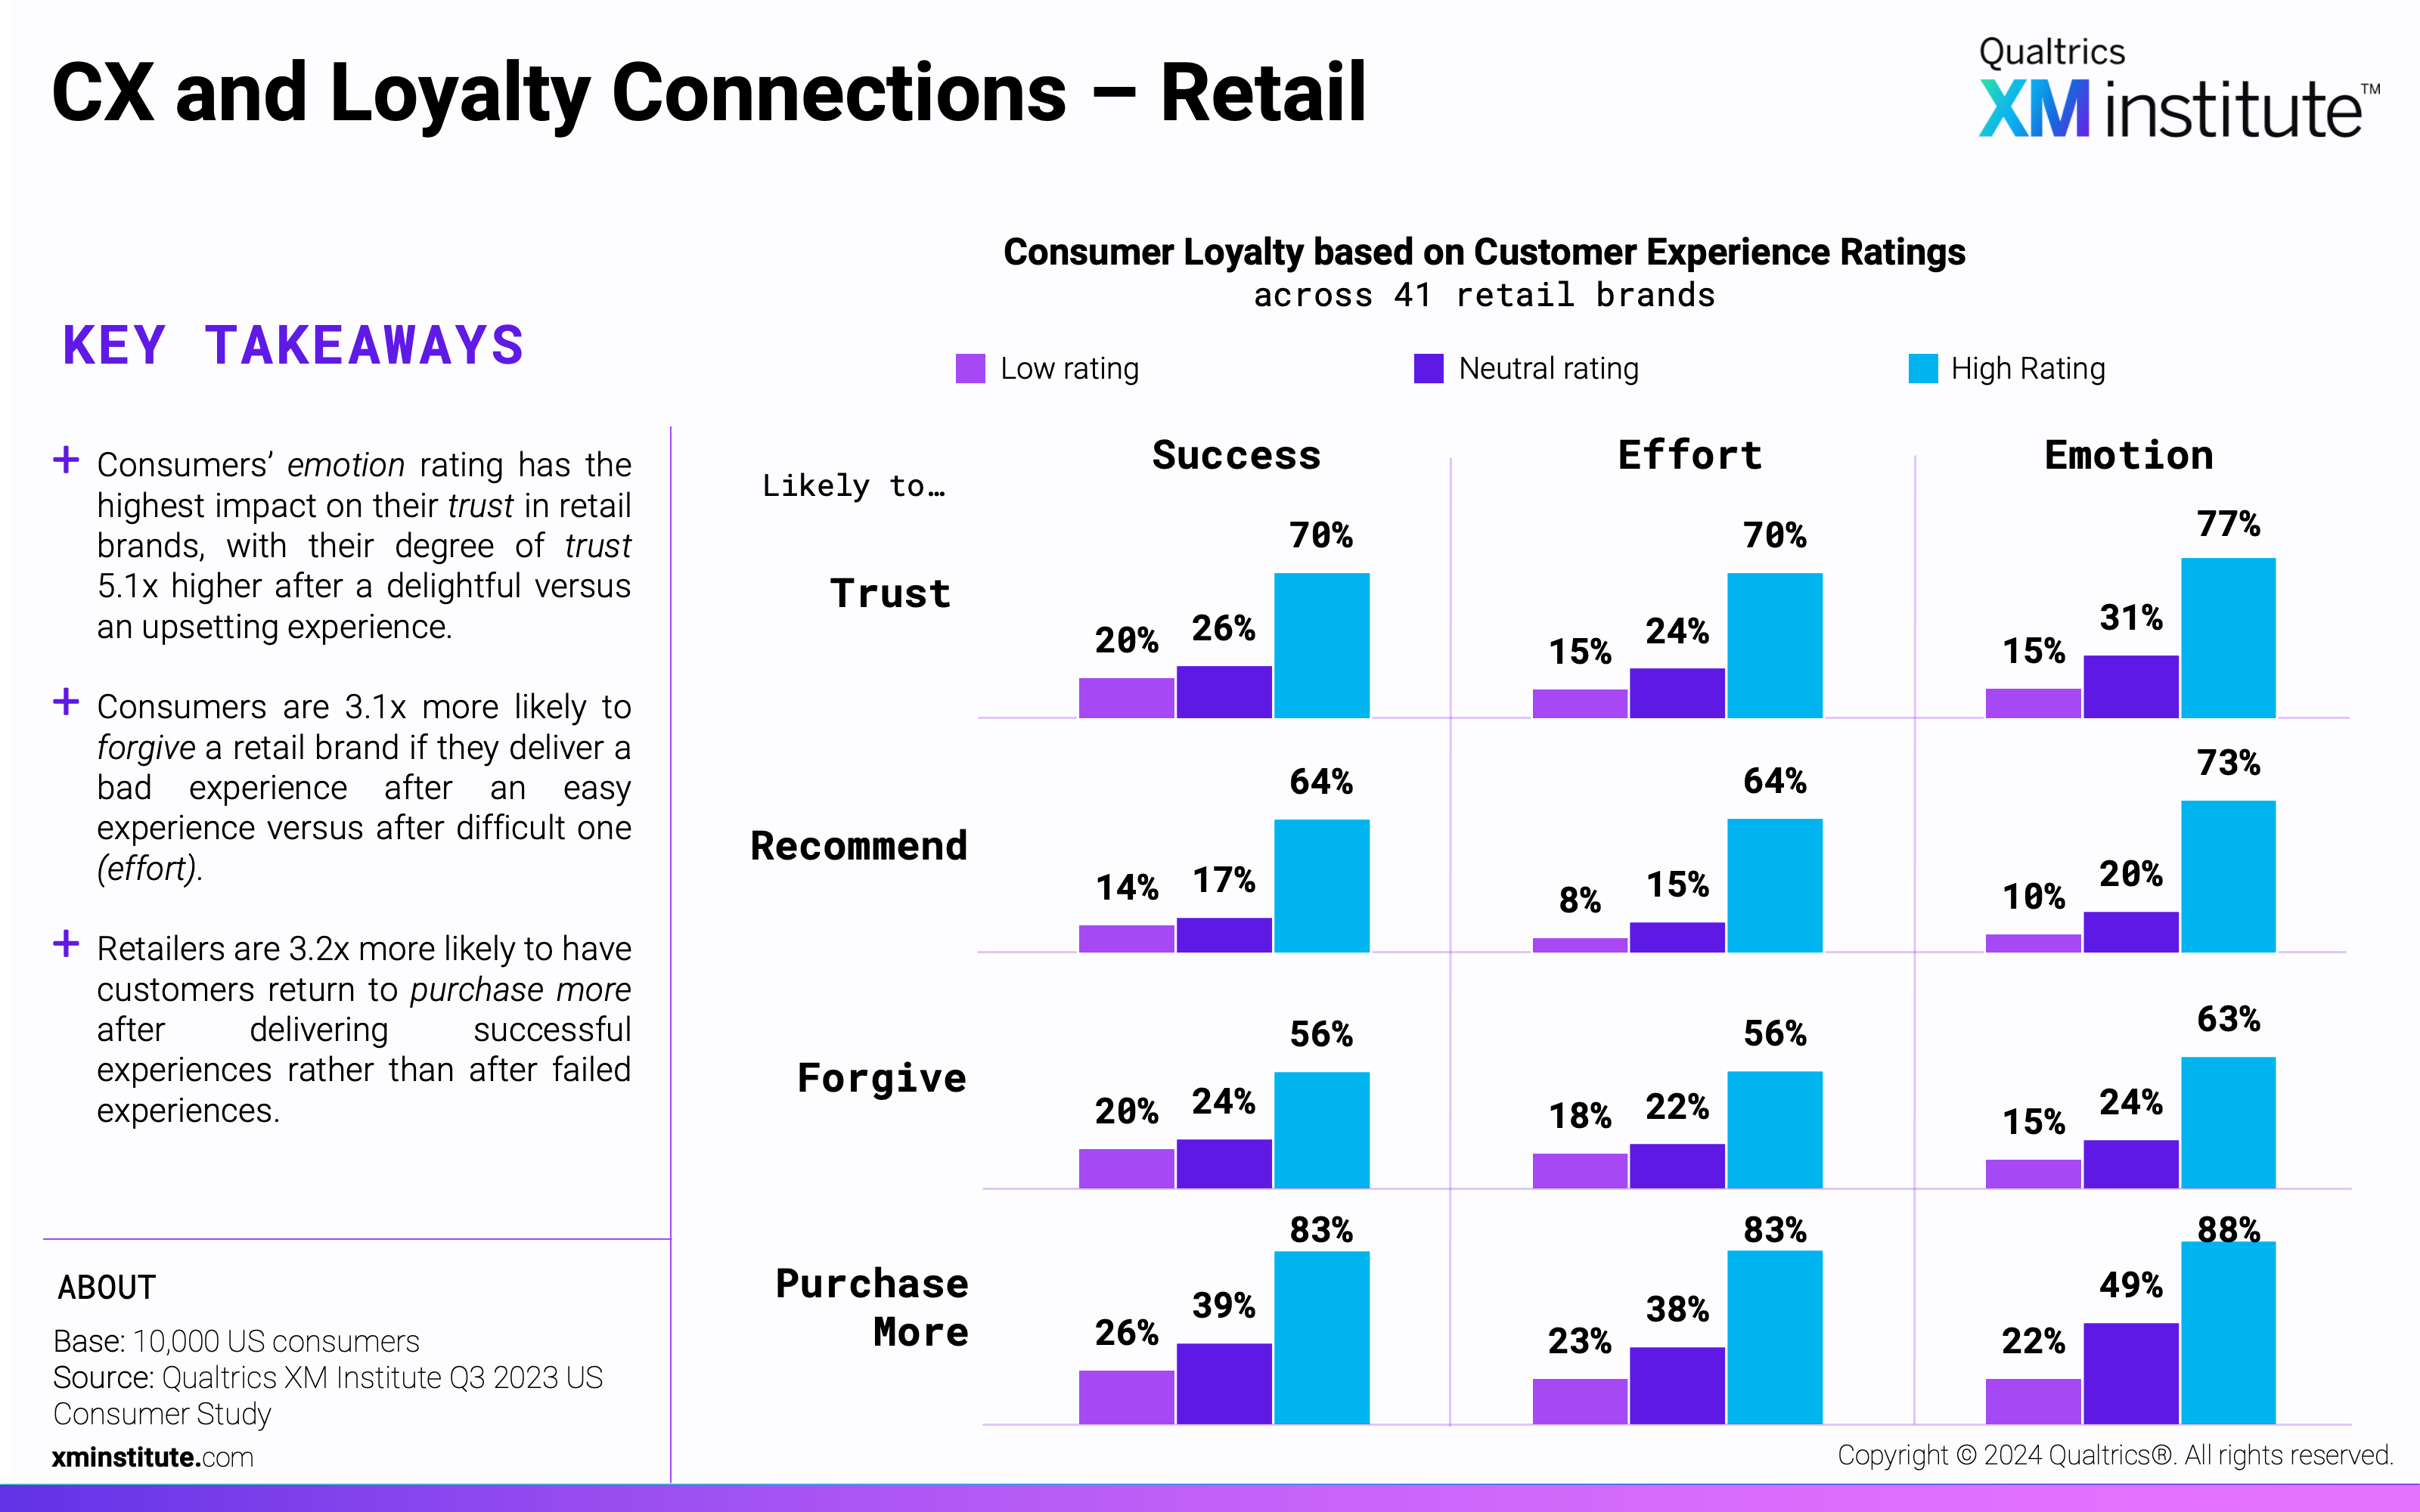
- CX and Loyalty Connections – Retail (see Figure 18)
- CX and Loyalty Connections – Software (see Figure 19)
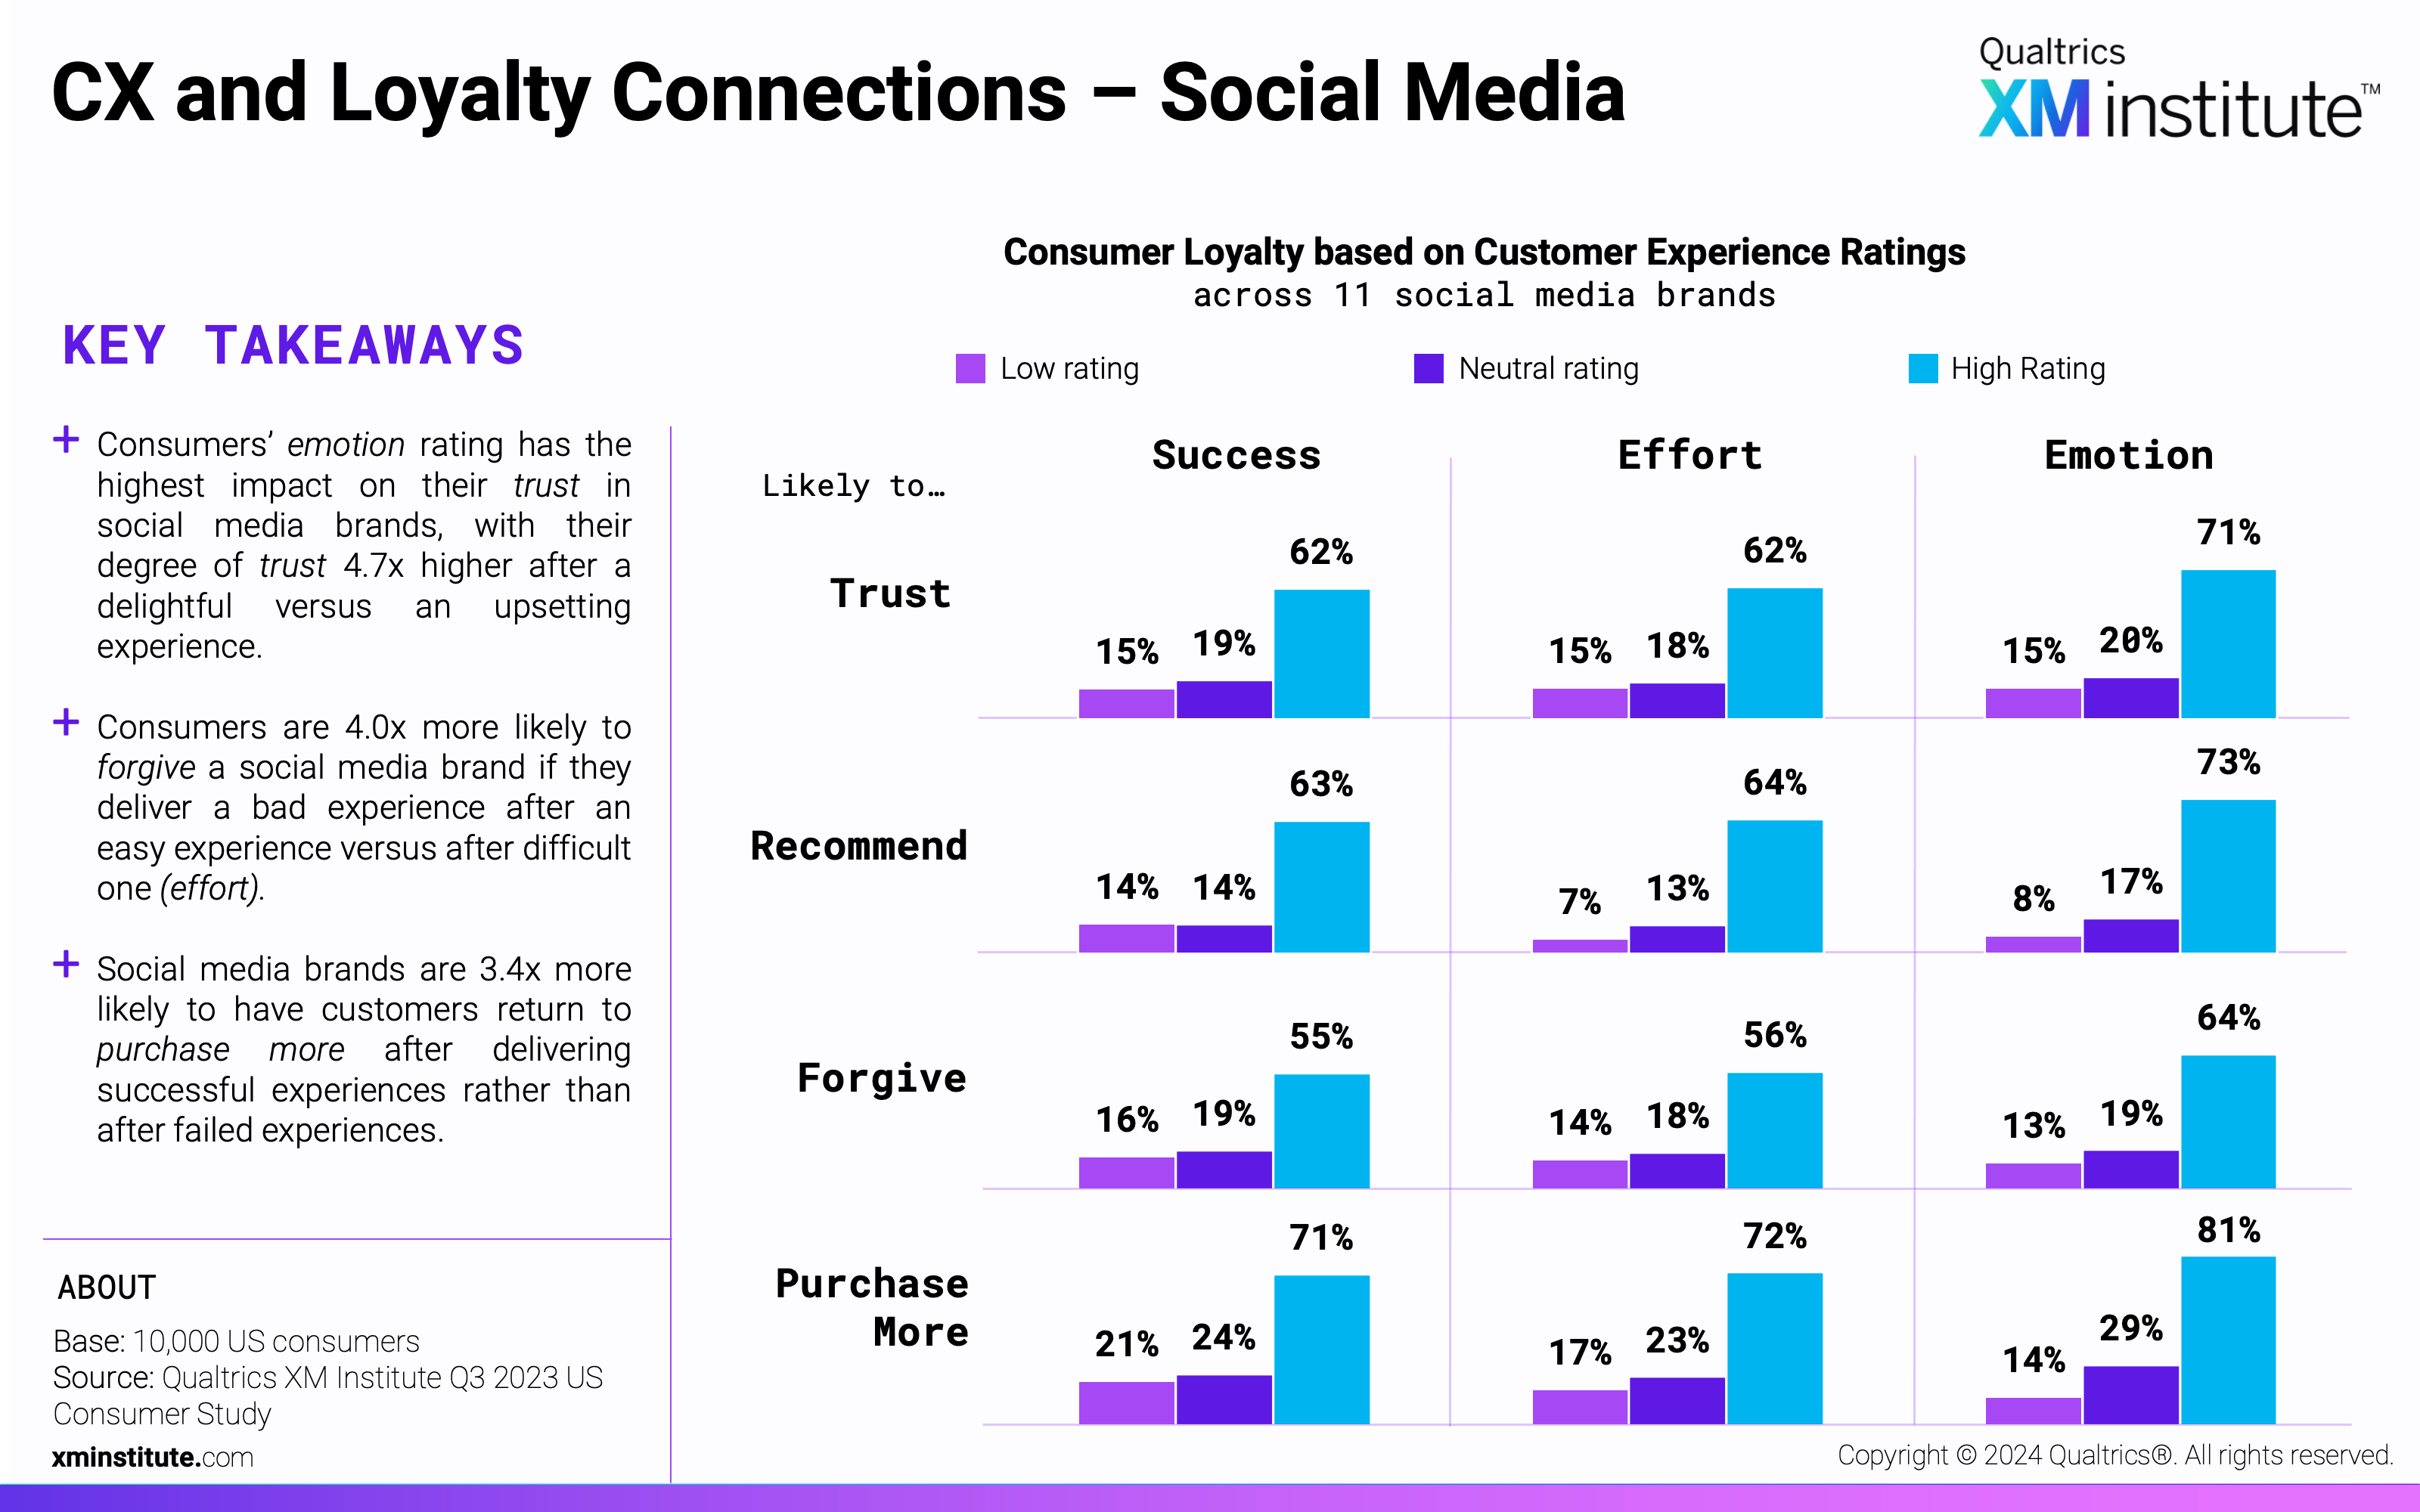
- CX and Loyalty Connections – Social Media (see Figure 20)
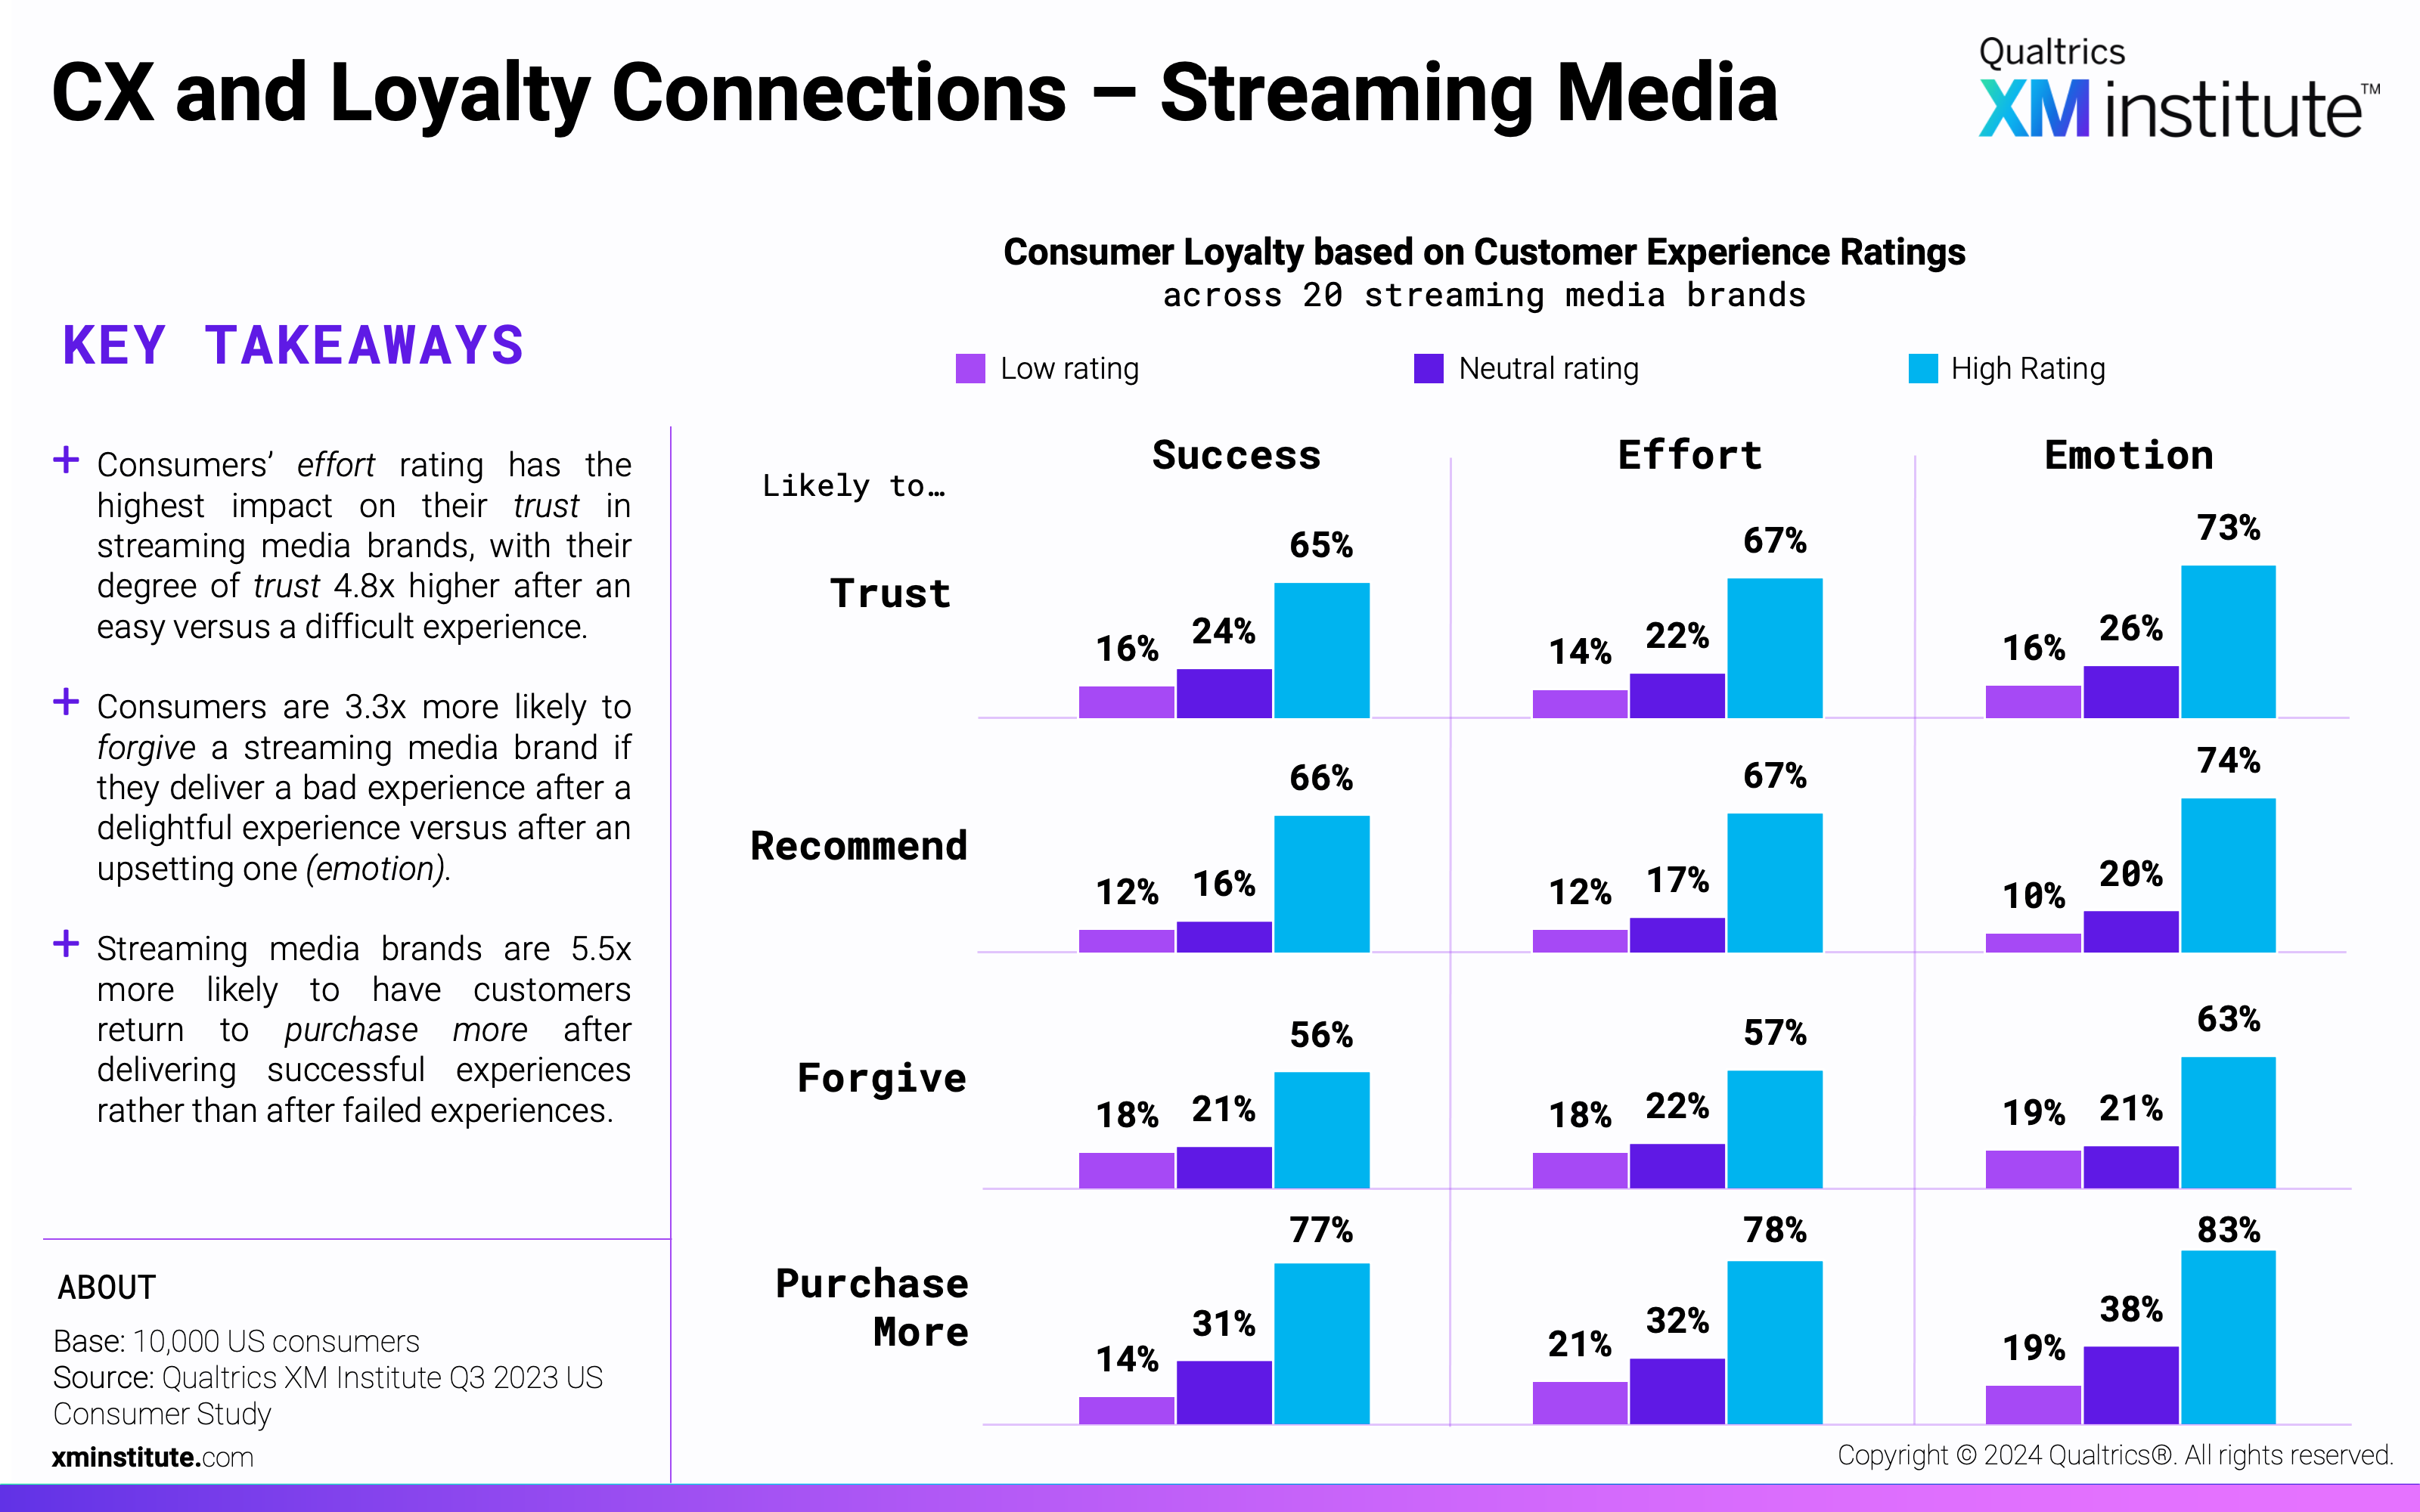
- CX and Loyalty Connections – Streaming Media (see Figure 21)
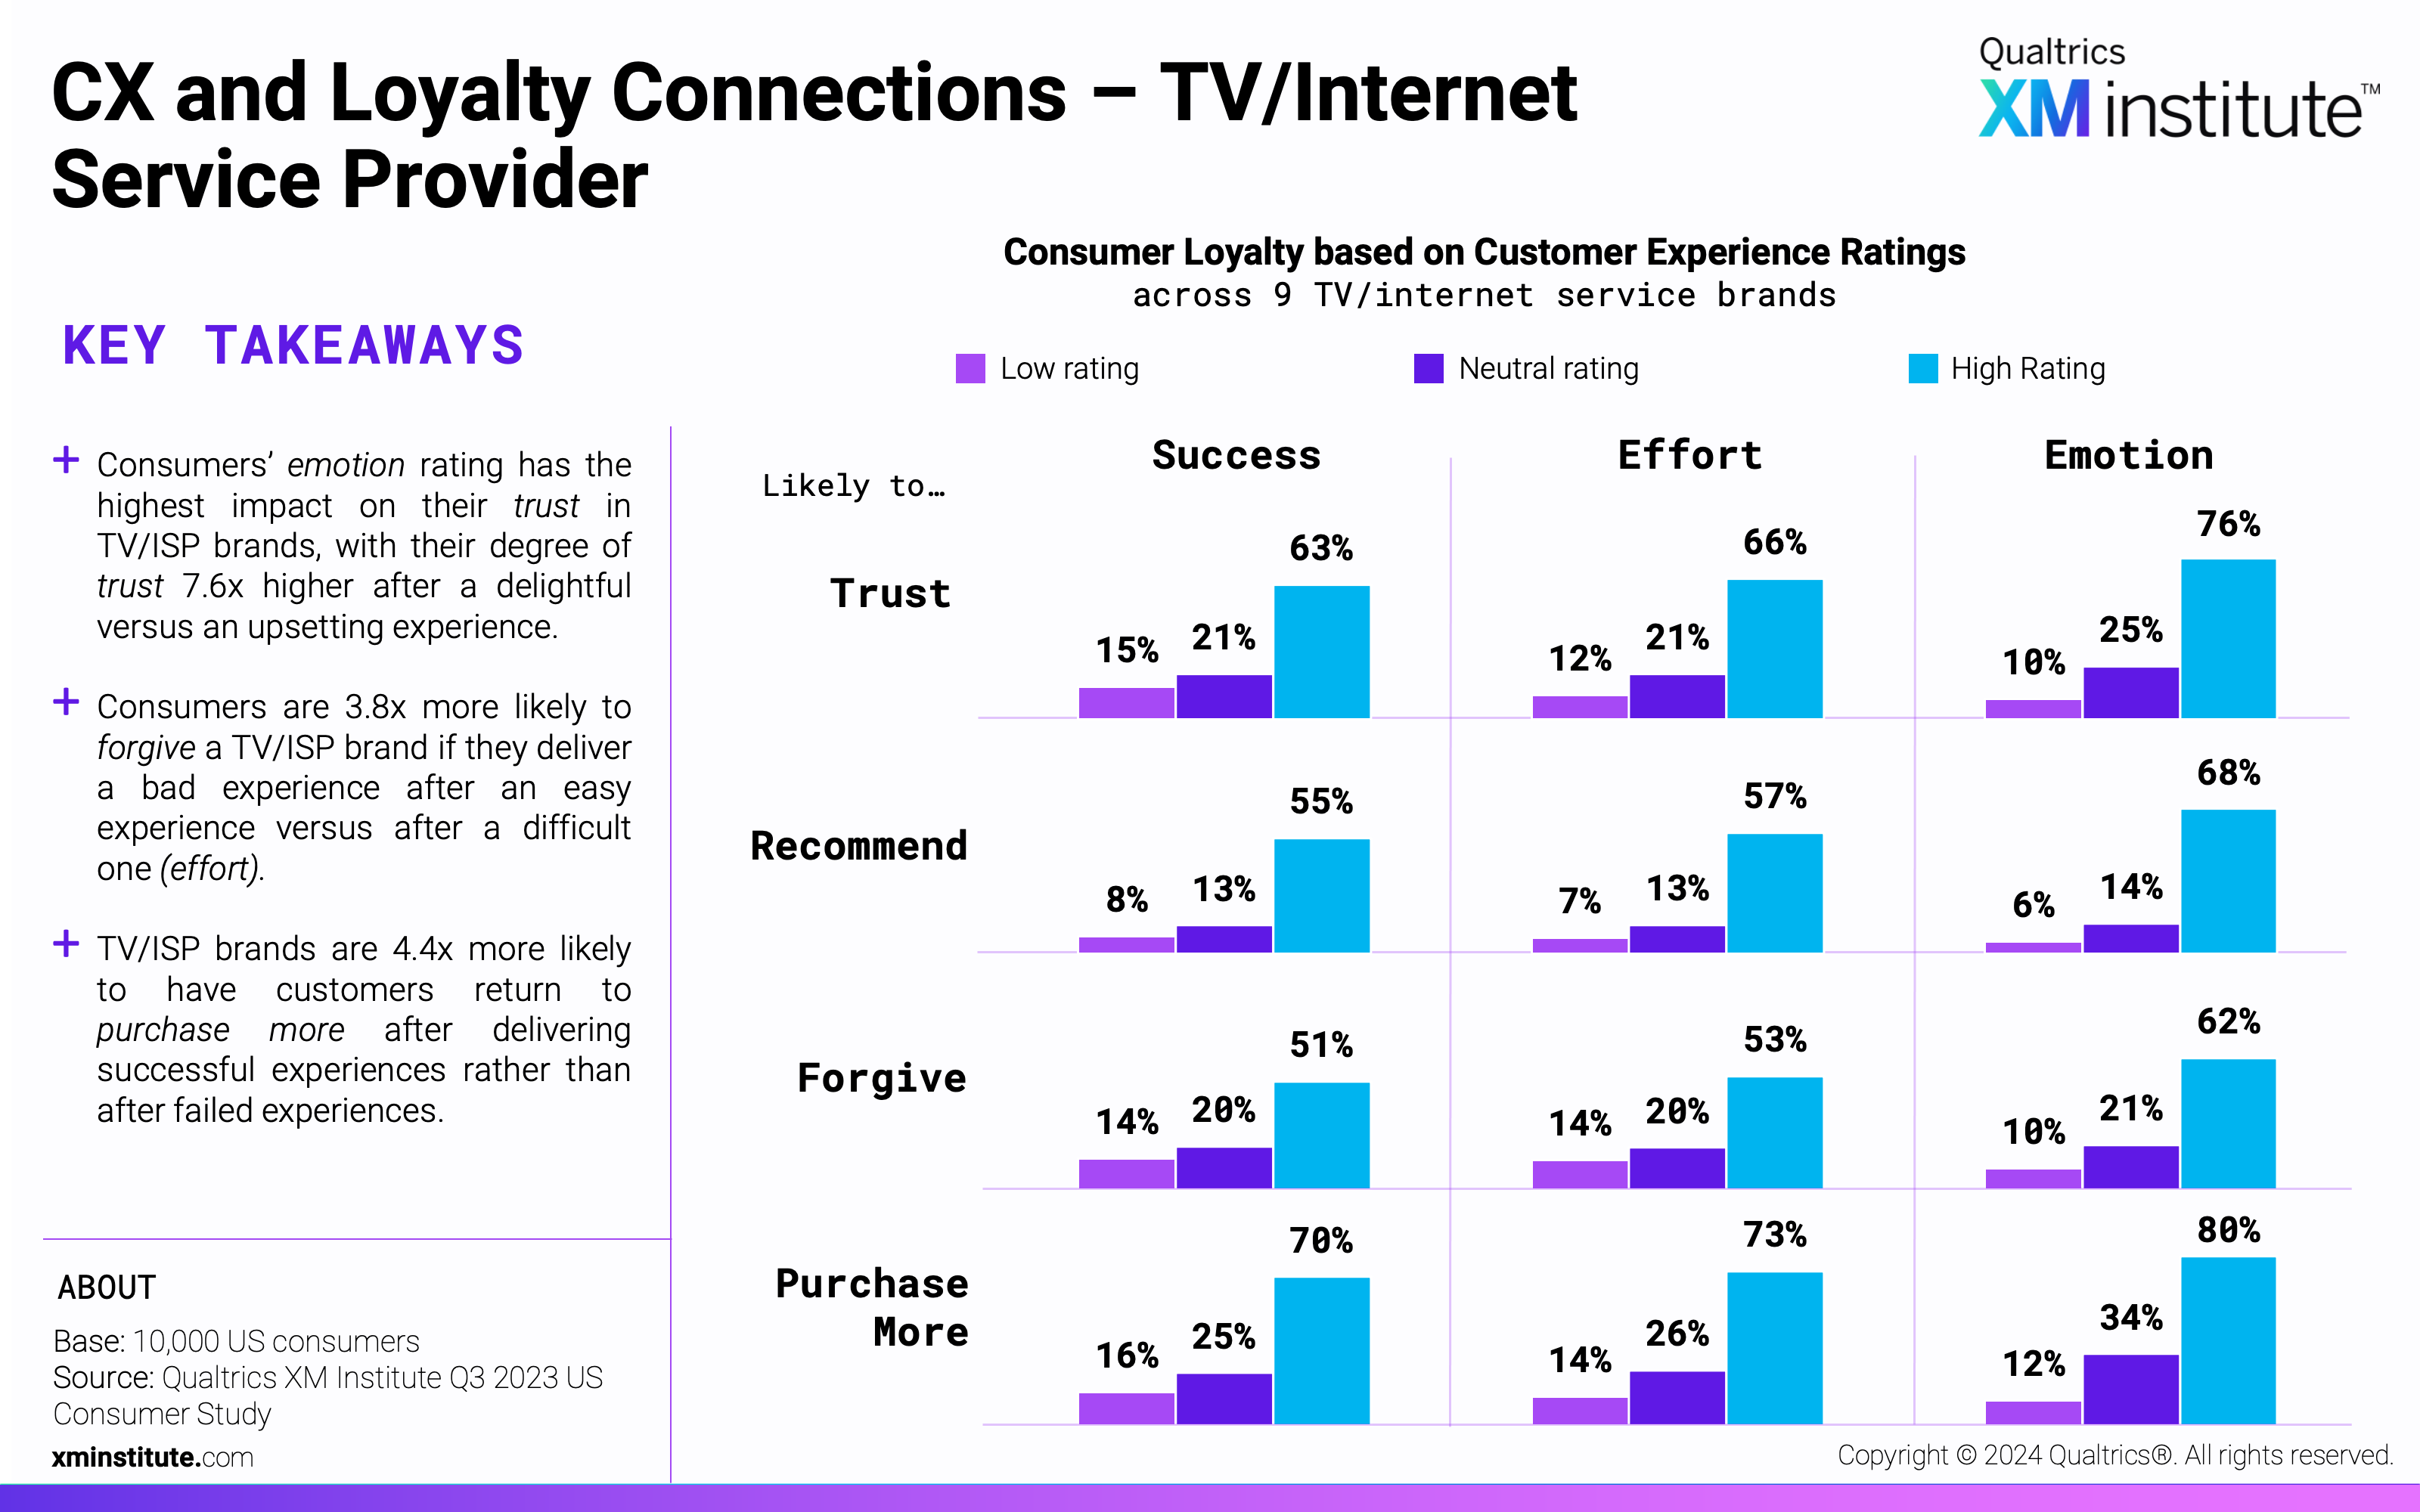
- CX and Loyalty Connections – TV/Internet Service Provider (see Figure 22)
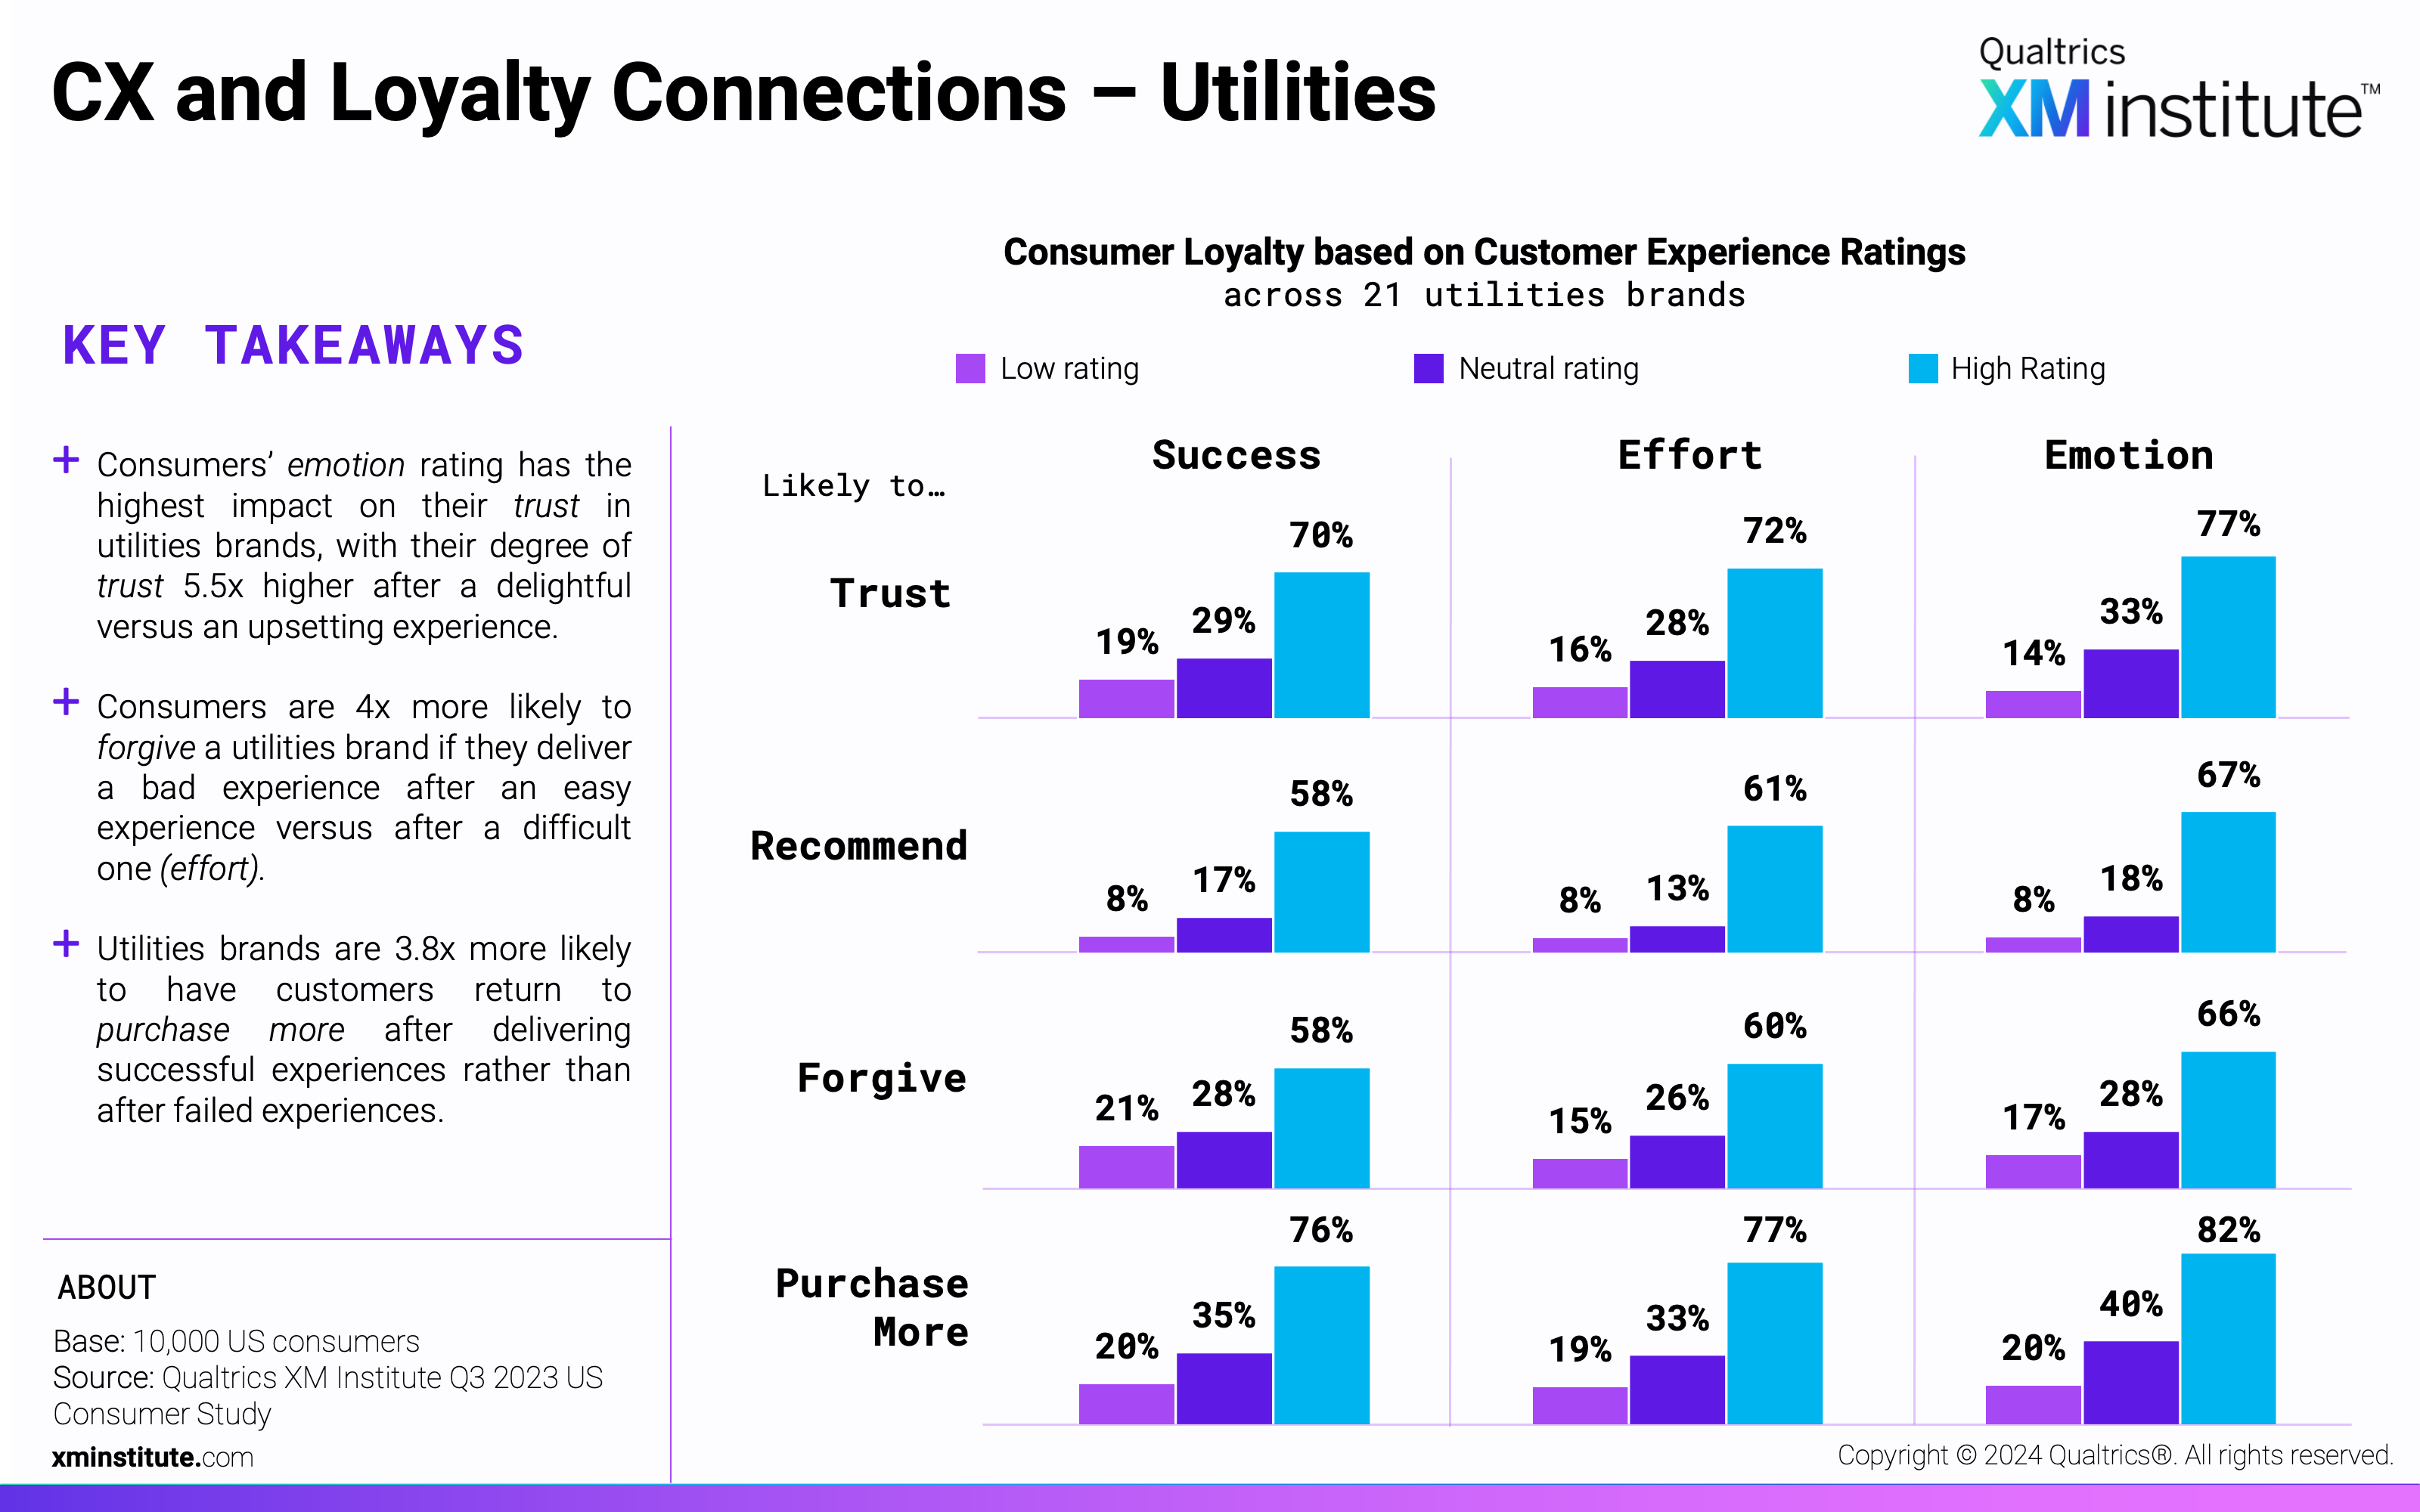
- CX and Loyalty Connections – Utilities (see Figure 23)
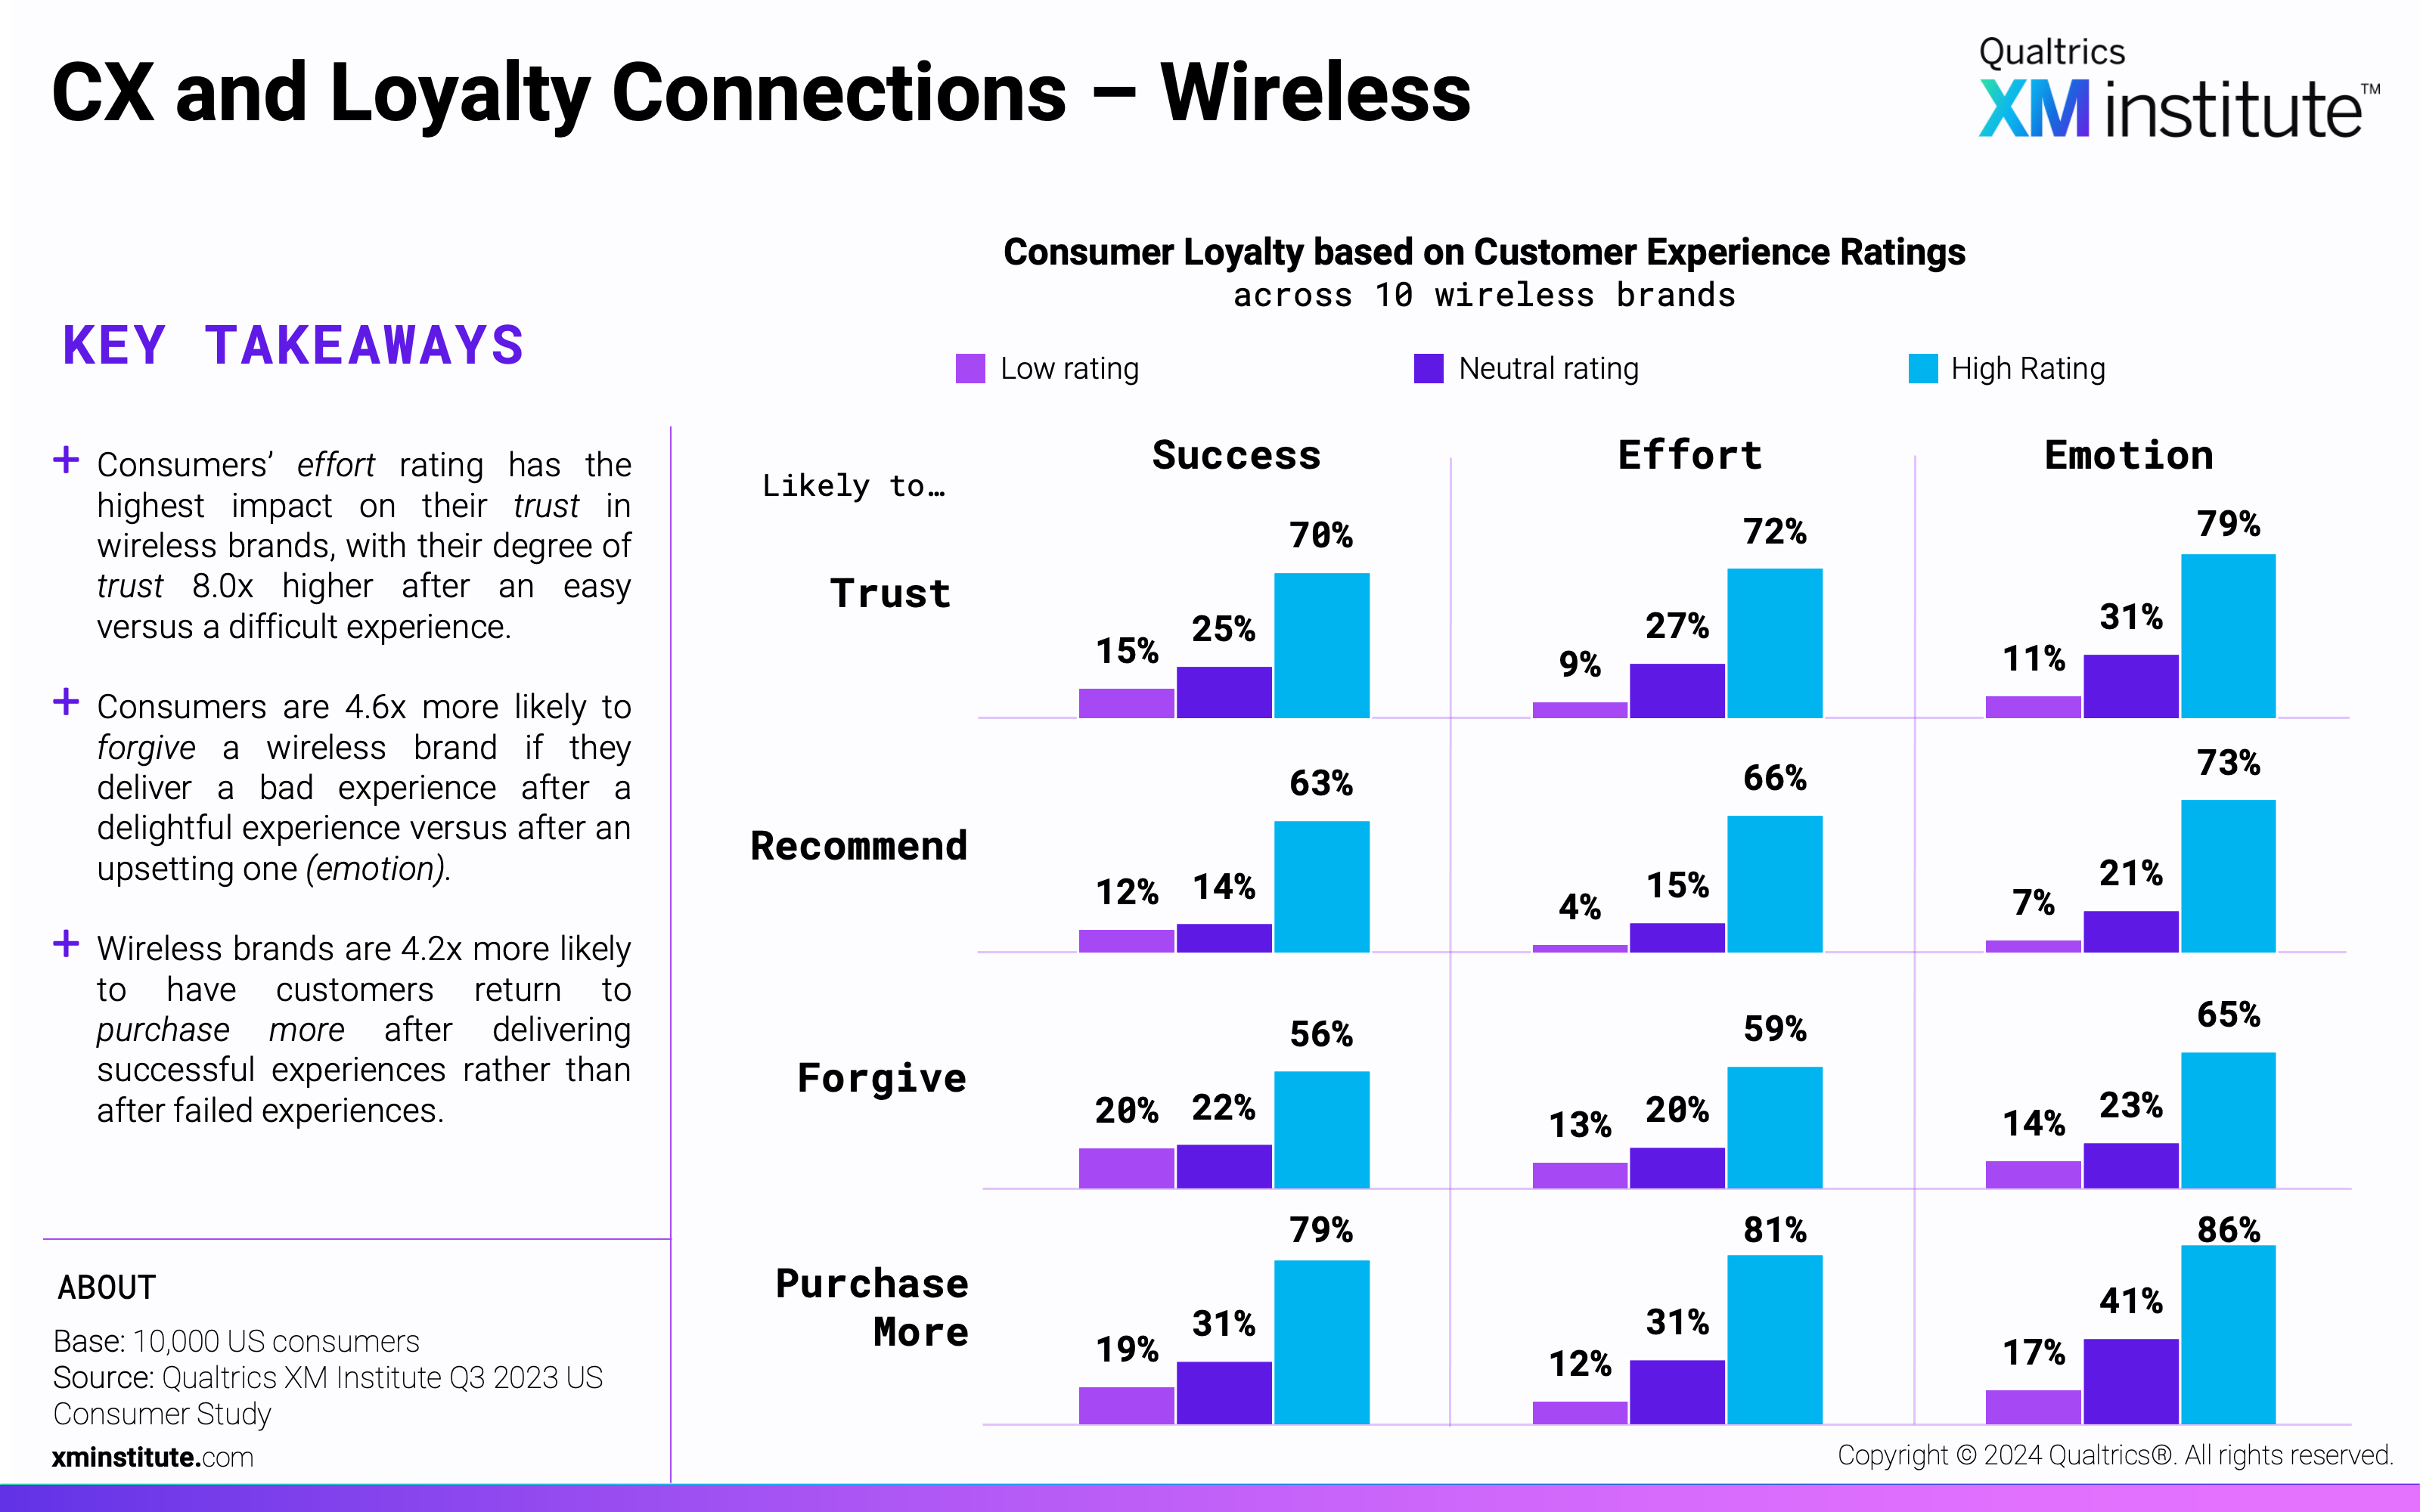
- CX and Loyalty Connections – Wireless (see Figure 24)
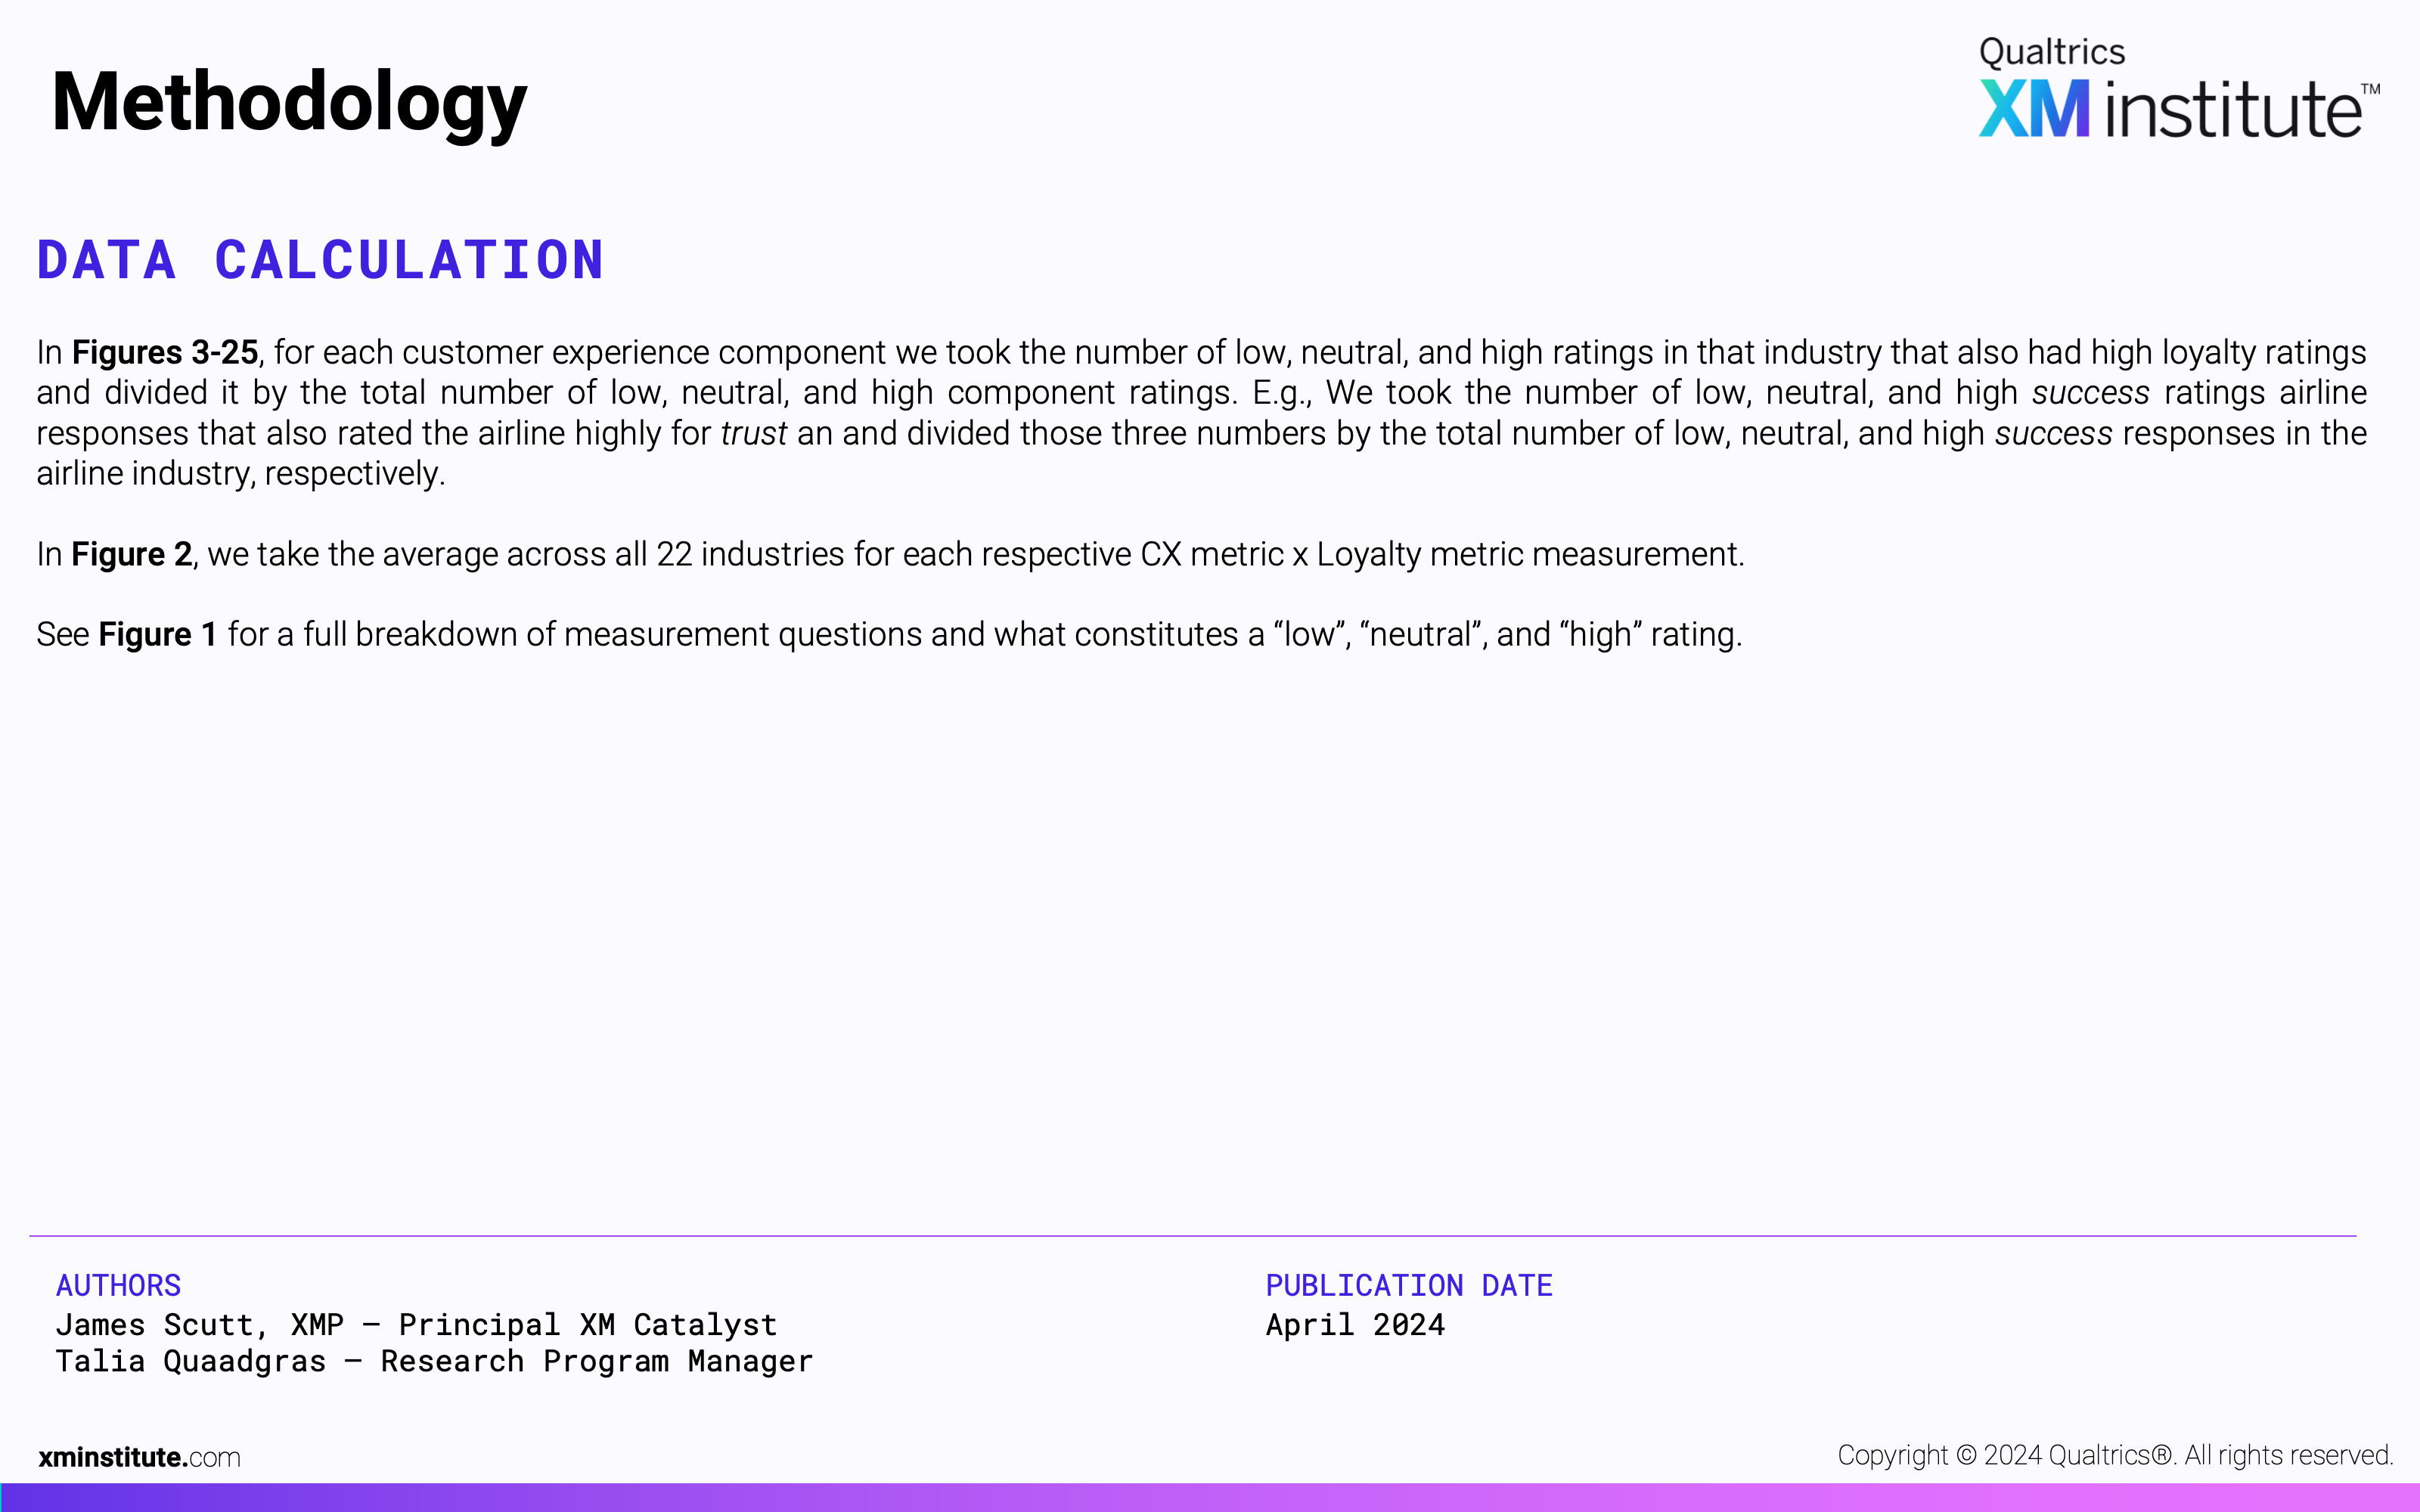
- Methodology (see Figure 25)